When to Measure Accessibility? Temporal Segmentation and Aggregation in Location-Based Public Transit Accessibility

Abstract
1. Introduction
- (1)
- The (temporal) boundary effect refers to the duration of temporal processes. Regarding location-based accessibility measures, this effect occurs when measures depend on a defined maximum travel time [16]. For example, accessibility varies for a maximum travel time of 30 min compared to 60 min. The boundary effect is the subject of numerous studies, which have found that increasing the travel time threshold results in more than a linear increase in accessibility depending on the region and the opportunities analyzed (see Pereira [16]; El-Geneidy et al. [17]; Tomasiello et al. [18]). However, the analysis of the boundary effect is beyond the scope of this study.
- (2)
- The aggregation effect considers the units of time for calculation (e.g., minutes) and the aggregation level used for reporting the results (e.g., hours). For example, the trips of a timetable planned to the minute can be aggregated to the number of departures per hour. With regard to the aggregation effect, research has thus far concentrated on the resolution of the intervals into which the study period is divided. Stępniak et al. [19] compared the precision and calculation effort of resolutions between 1 min and 60 min. Results were aggregated to the 1 h level using different aggregation methods, such as the arithmetic average and a harmonic-based average, depending on the method used to calculate the location-based accessibility. However, the authors did not compare these aggregation methods as part of the aggregation effect.
- (3)
- The segmentation effect describes the changes in results when considering different starting times [16]. For instance, calculating PT accessibility for a 2 h interval that starts at 7 a.m. shows different results than the same interval starting at 10 a.m. This is due to the temporal variation of PT service and the composition of travel time. In addition to the actual time spent traveling by PT, the overall travel time consists of accessing the first station, waiting at this station, possible transfers, and egressing from the final station. The number of trips offered, and thus the waiting and transfer times, may vary depending on the day of the week and the time of day. Given a constant time budget, longer waiting times result in shorter in-vehicle travel times and thus fewer accessible opportunities. Thus, the timing of the analysis can influence the results, even when all other conditions remain constant. Due to the timetable, the choice of starting time and time span is of particular relevance in accessibility analysis involving PT.
2. Literature Review
2.1. Location-Based Accessibility
2.2. Approaches to Dealing with the MTUP in the Context of PT Accessibility

| Reference | Accessibility Measure | Opportunities | Day | Departure Time | Time Span | Method of Aggregation |
|---|---|---|---|---|---|---|
| Single departure time | ||||||
| El-Geneidy et al. [17] | CumOpp | Jobs | Weekday | 7 a.m. | One single value | |
| Li et al. [30] | CumOpp | Senior centers | Monday, Saturday | 8:30 a.m., 2 p.m. | Multiple single values | |
| Lee and Miller [22] | CumOpp | Jobs Health care | Thursday, Sunday | 8 a.m., 1 p.m., 6 p.m., 9 p.m. | Multiple single values | |
| Time span | ||||||
| Fan et al. [31] | CumOpp | Jobs | Weekday | 5 a.m. | 16 h | Weighted average of 1 h intervals, distinction between peak and off-peak hours |
| Farber et al. [26] | Travel time | Supermarkets | Monday | 6 a.m. | 16 h | Arithmetic average and standard deviation of 1 min intervals |
| Klar et al. [1] | CumOpp GravBased | Canadian Places Dataset | N/A | 7 a.m. | 2 h | Median of 1 min intervals |
| Lunke [21] | GravBased | Jobs | N/A | 7:30 a.m. | 1 h | Median of 1 min intervals |
| Owen and Levinson [32] | CumOpp | Jobs | Weekday | 7 a.m. | 2 h | Arithmetic average, maximum, standard deviation, variance and coefficient of variation of 1 min intervals |
| Pereira [16] | CumOpp | Jobs | Weekday | 7 a.m. | 2 h | Median of 15 min intervals |
| Pereira et al. [11] | CumOpp | Jobs, schools | N/A | 7 a.m. | 12 h | Median of 20 min intervals |
| Stępniak et al. [19] | CumOpp, GravBased, Travel time | City council, nurseries, theatres, specialized health care, hospitals, secondary schools, population | Tuesday | 2 a.m., 7 a.m., 10 a.m., 10 p.m. | 1 h | Arithmetic or weighted average of different intervals (1, 5, 15, 20, 30, 60 min) |
| Tomasiello et al. [18] | CumOpp | Jobs | N/A | 6 a.m. | 2 h | Median of 1 min intervals |
| Combination | ||||||
| Boisjoly and El-Geneidy [24] | CumOpp | Jobs | N/A | 5 a.m., 6 a.m., 7 a.m., 8 a.m. 9 a.m. 12 p.m. | 1 h 3 h 17 h | Multiple single values Arithmetic average Value from 12 p.m. |
| El-Geneidy et al. [33] | GravBased | Jobs | N/A | 5 a.m., 6 a.m., 7 a.m., 8 a.m. 9 a.m. 12 p.m. | 1 h 3 h 17 h | Multiple single values Arithmetic average Value from 12 p.m. |
2.2.1. One or Multiple Single Departure Times
2.2.2. Time Spans
2.3. Problem Statement and Scope of the Paper
3. Materials and Methods
3.1. Calculation of Location-Based Accessibility with PT
3.2. Distinction of Different Regions
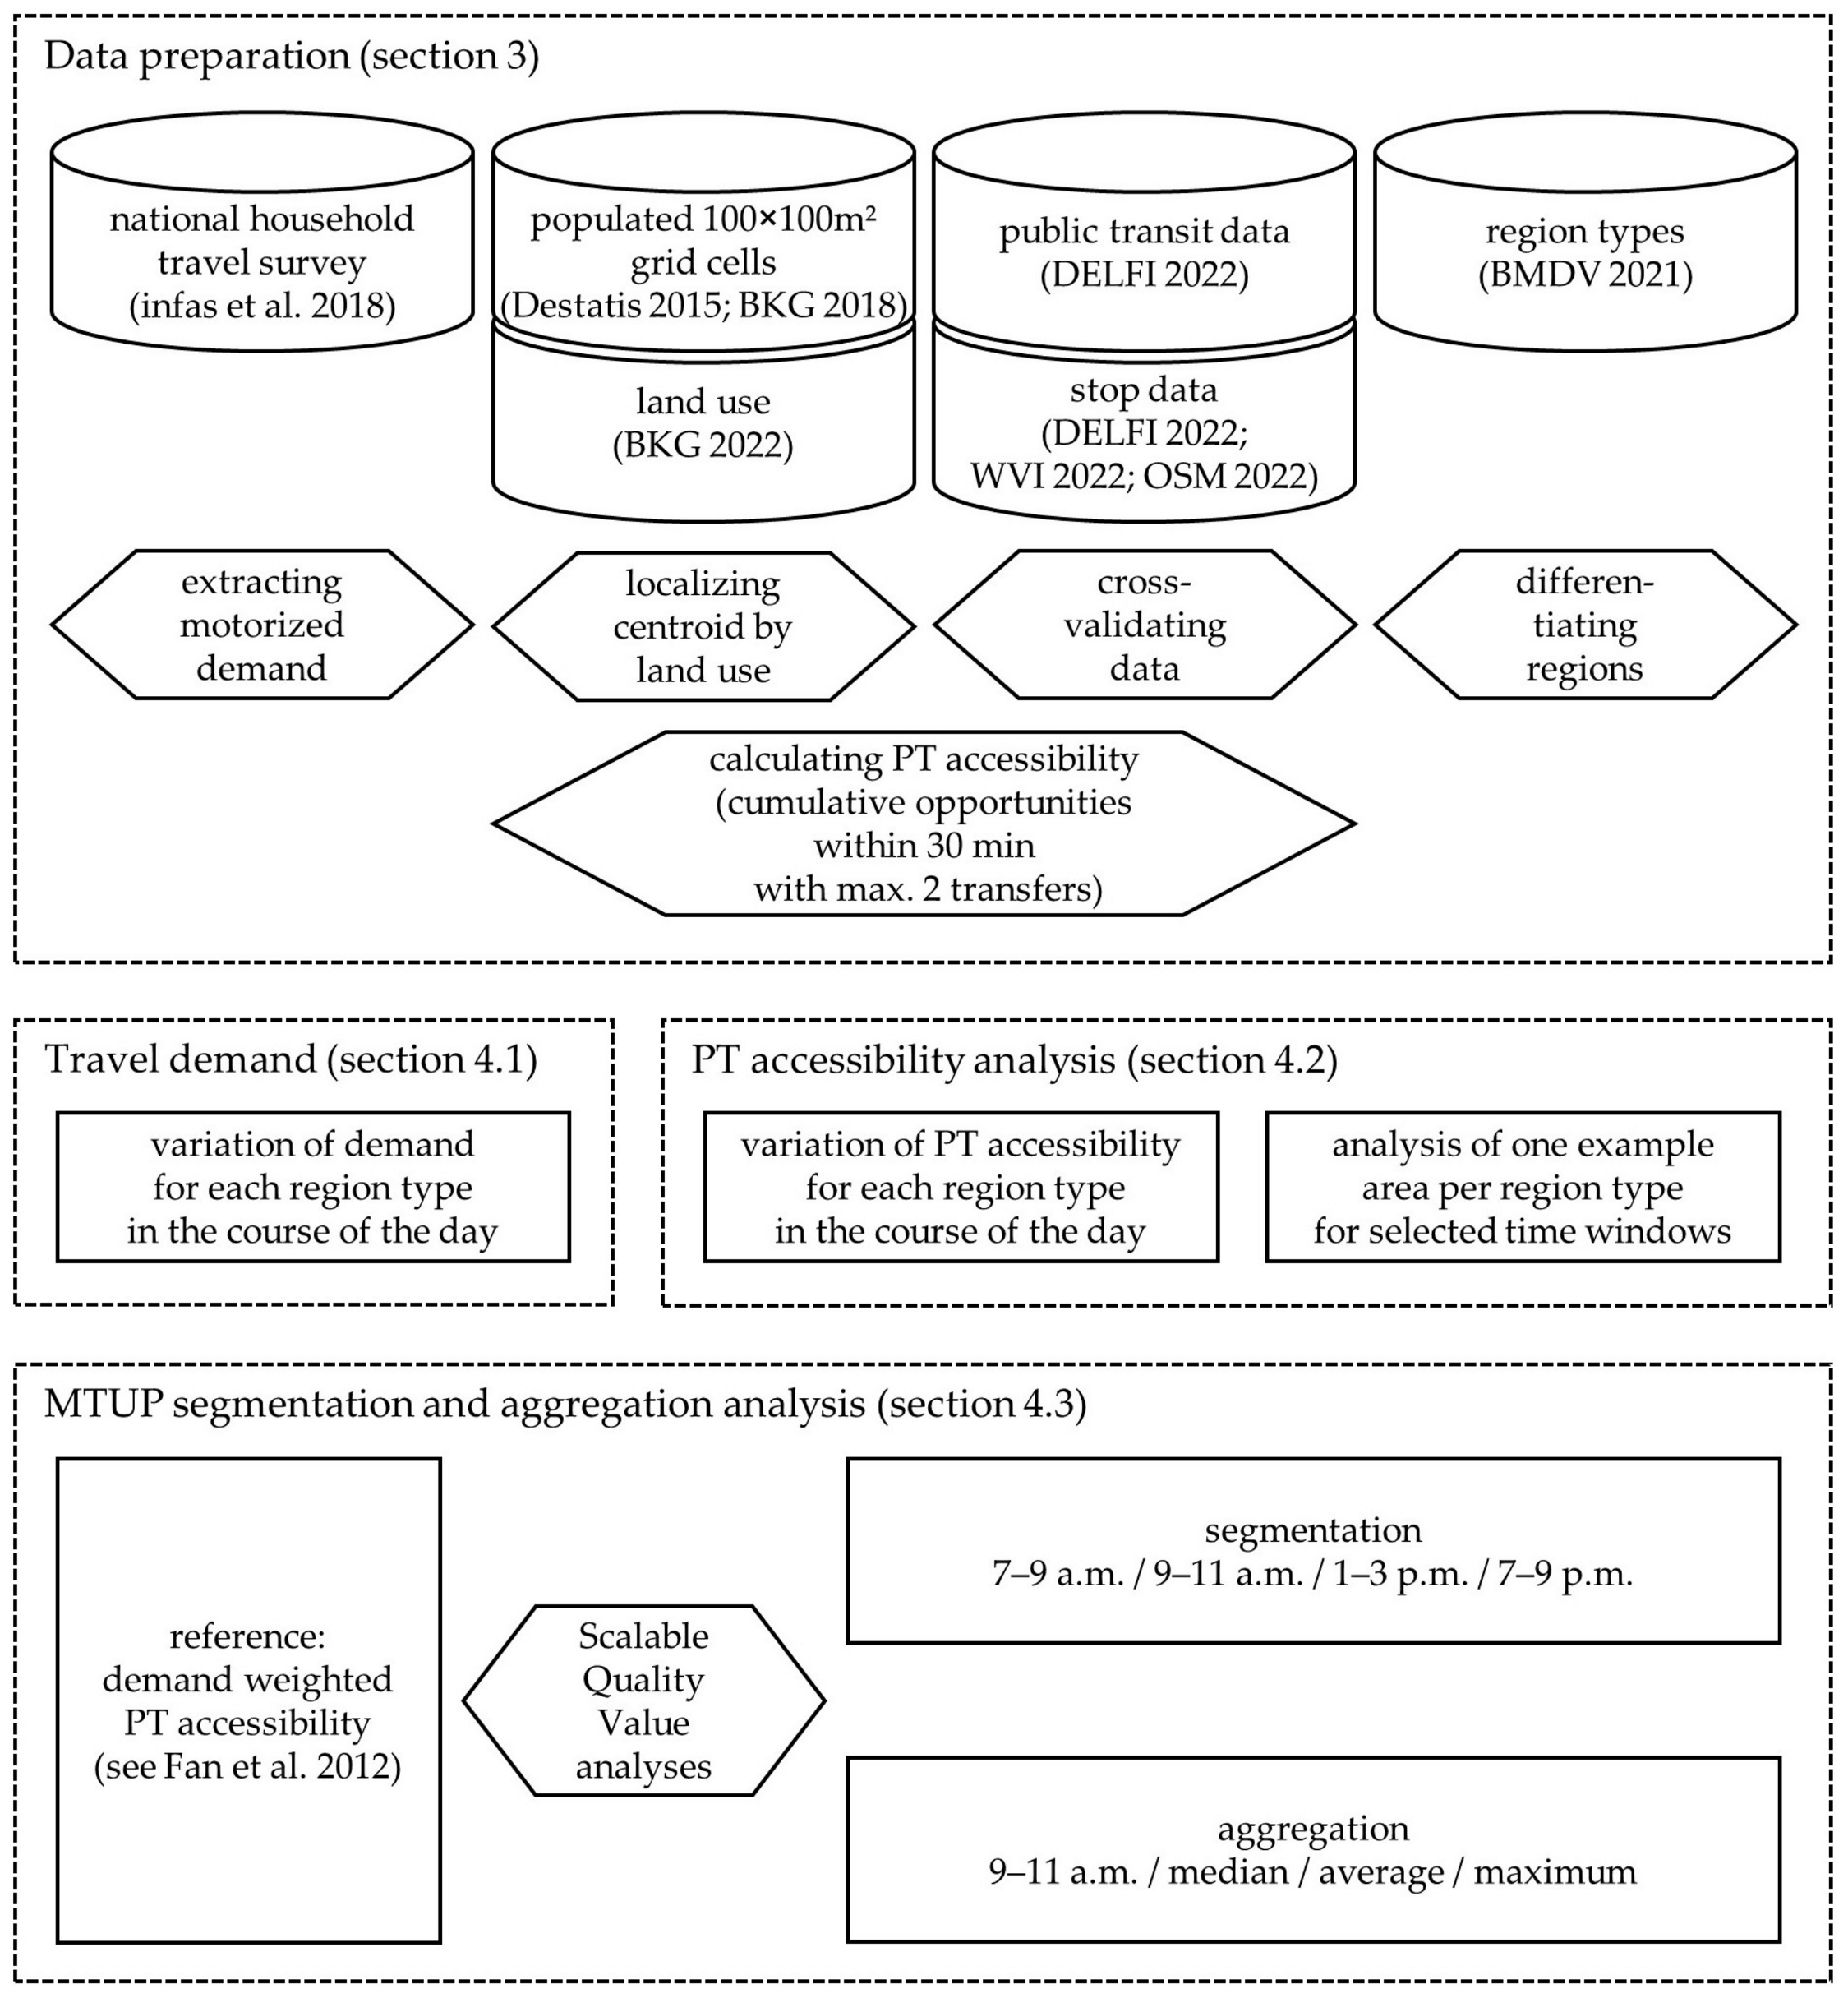
3.3. Methodology
- c observed/measured value
- m modeled value
- f scaling factor
4. Results
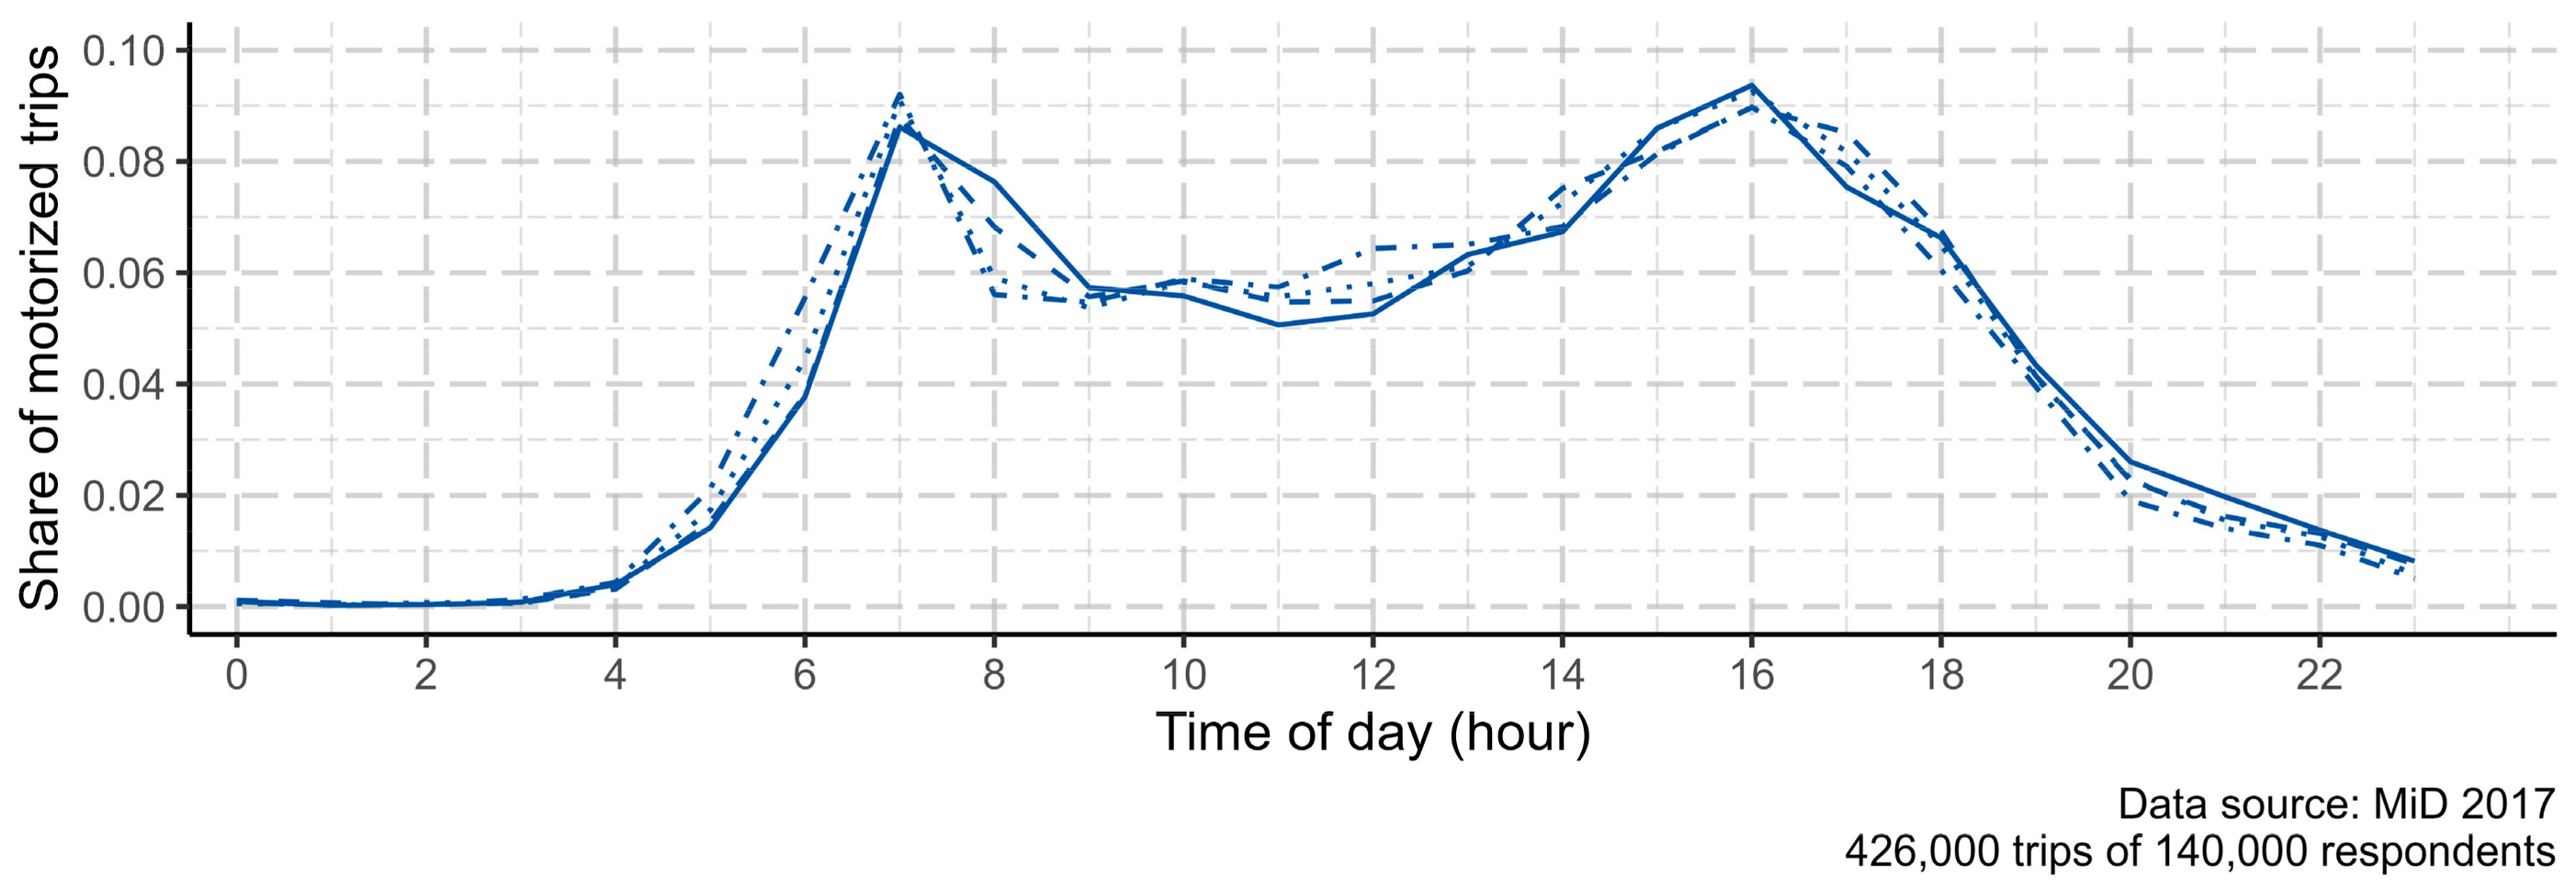
4.1. Demand for Motorized Trips
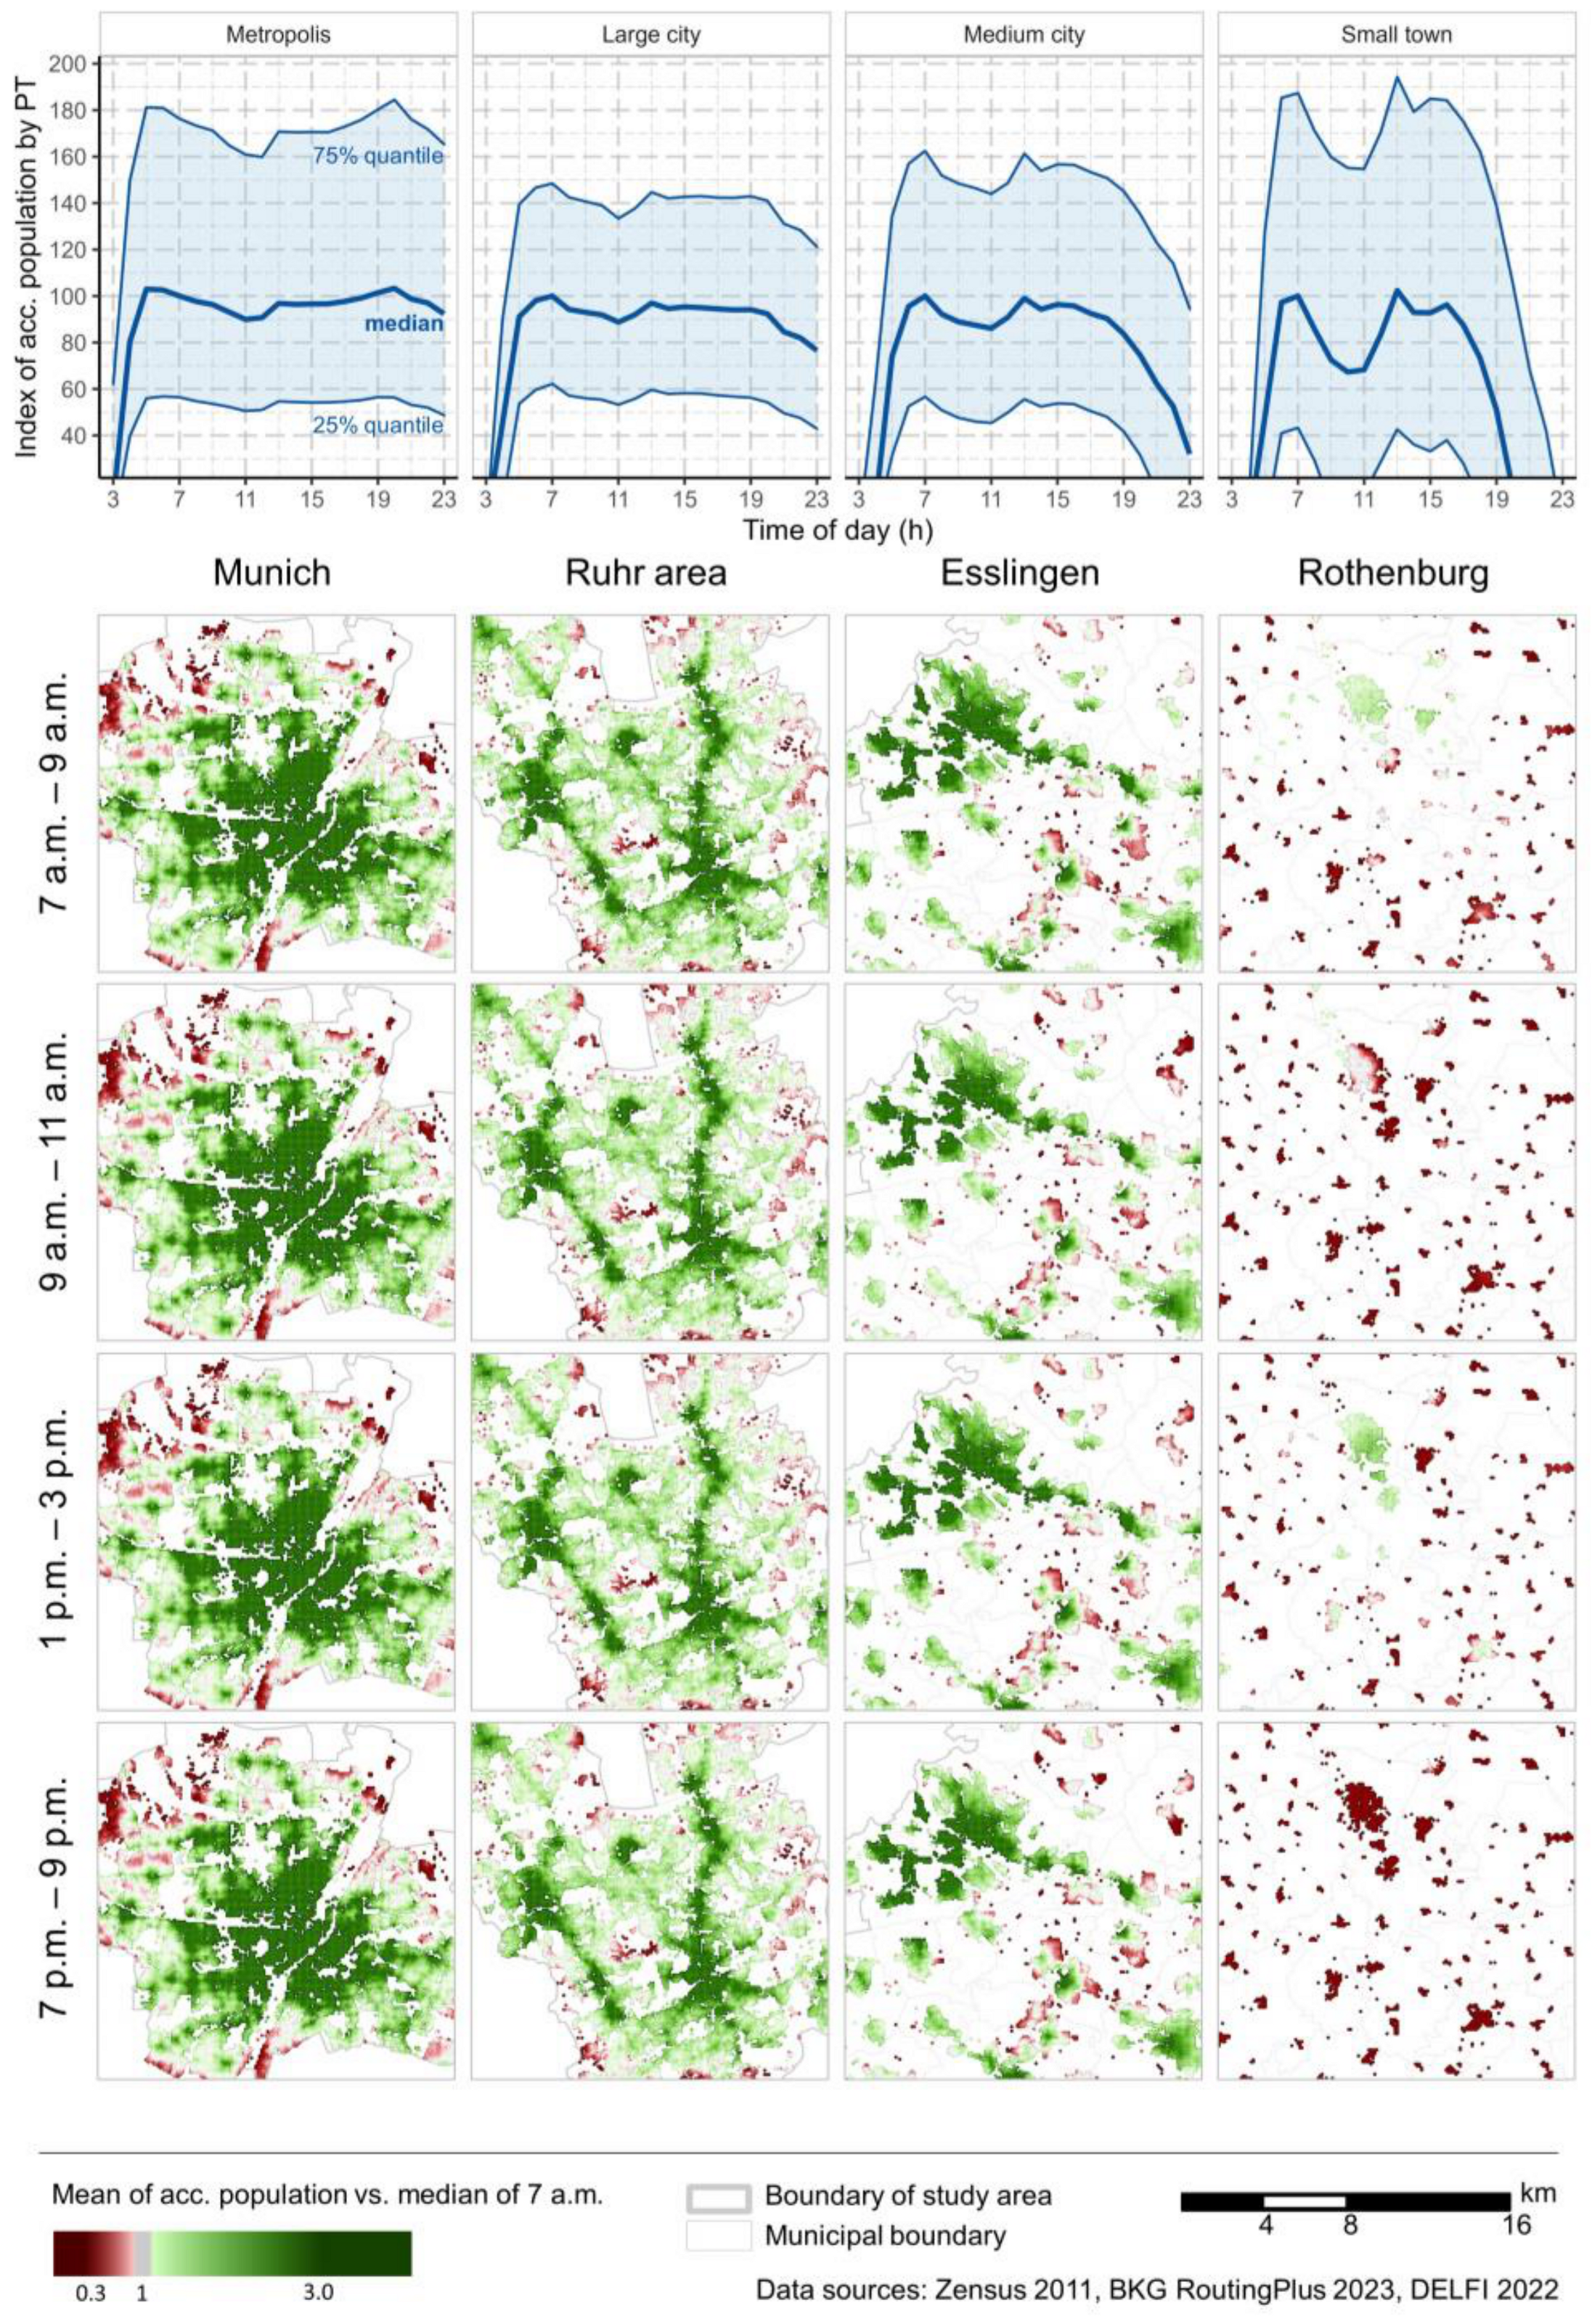
4.2. PT Accessibility
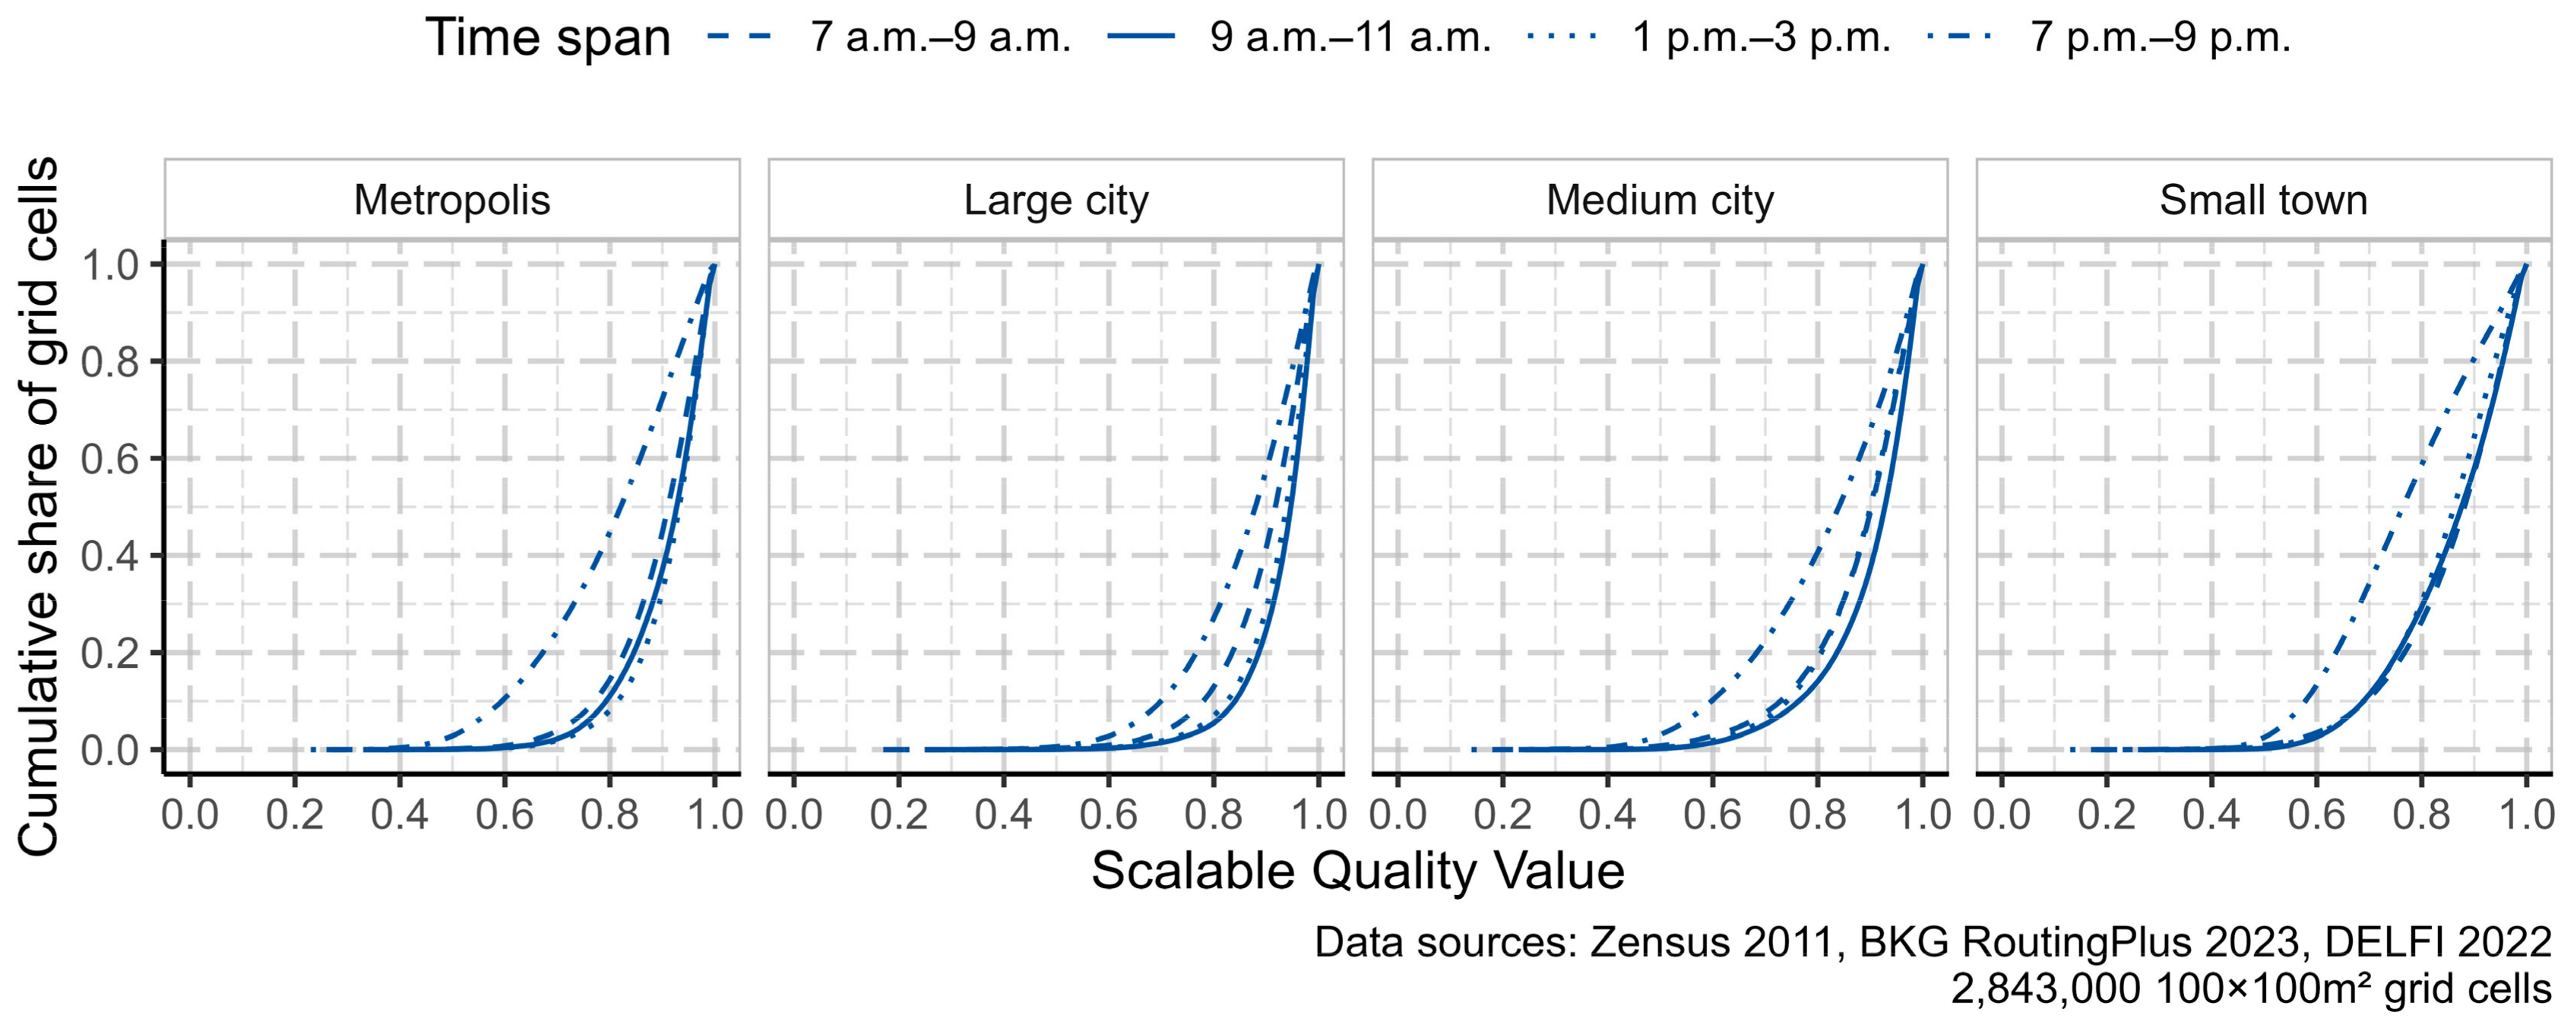
- The morning peak time (7–9 a.m.) is often used in the literature to measure the accessibility of workplaces. It is characterized by a high number of trips to school and work.
- The morning off-peak time (9–11 a.m.) has a considerably reduced PT service and correspondingly lower accessibility than the peak hour.
- The end of school/afternoon peak time (1–3 p.m.) has a similarly high level of PT service as the morning peak time and serves, among other purposes, the trips from school to home.
- In the evening (7–9 p.m.), PT services decrease significantly, especially in small towns.
4.3. Effects of Segmentation and Aggregation
4.3.1. Segmentation
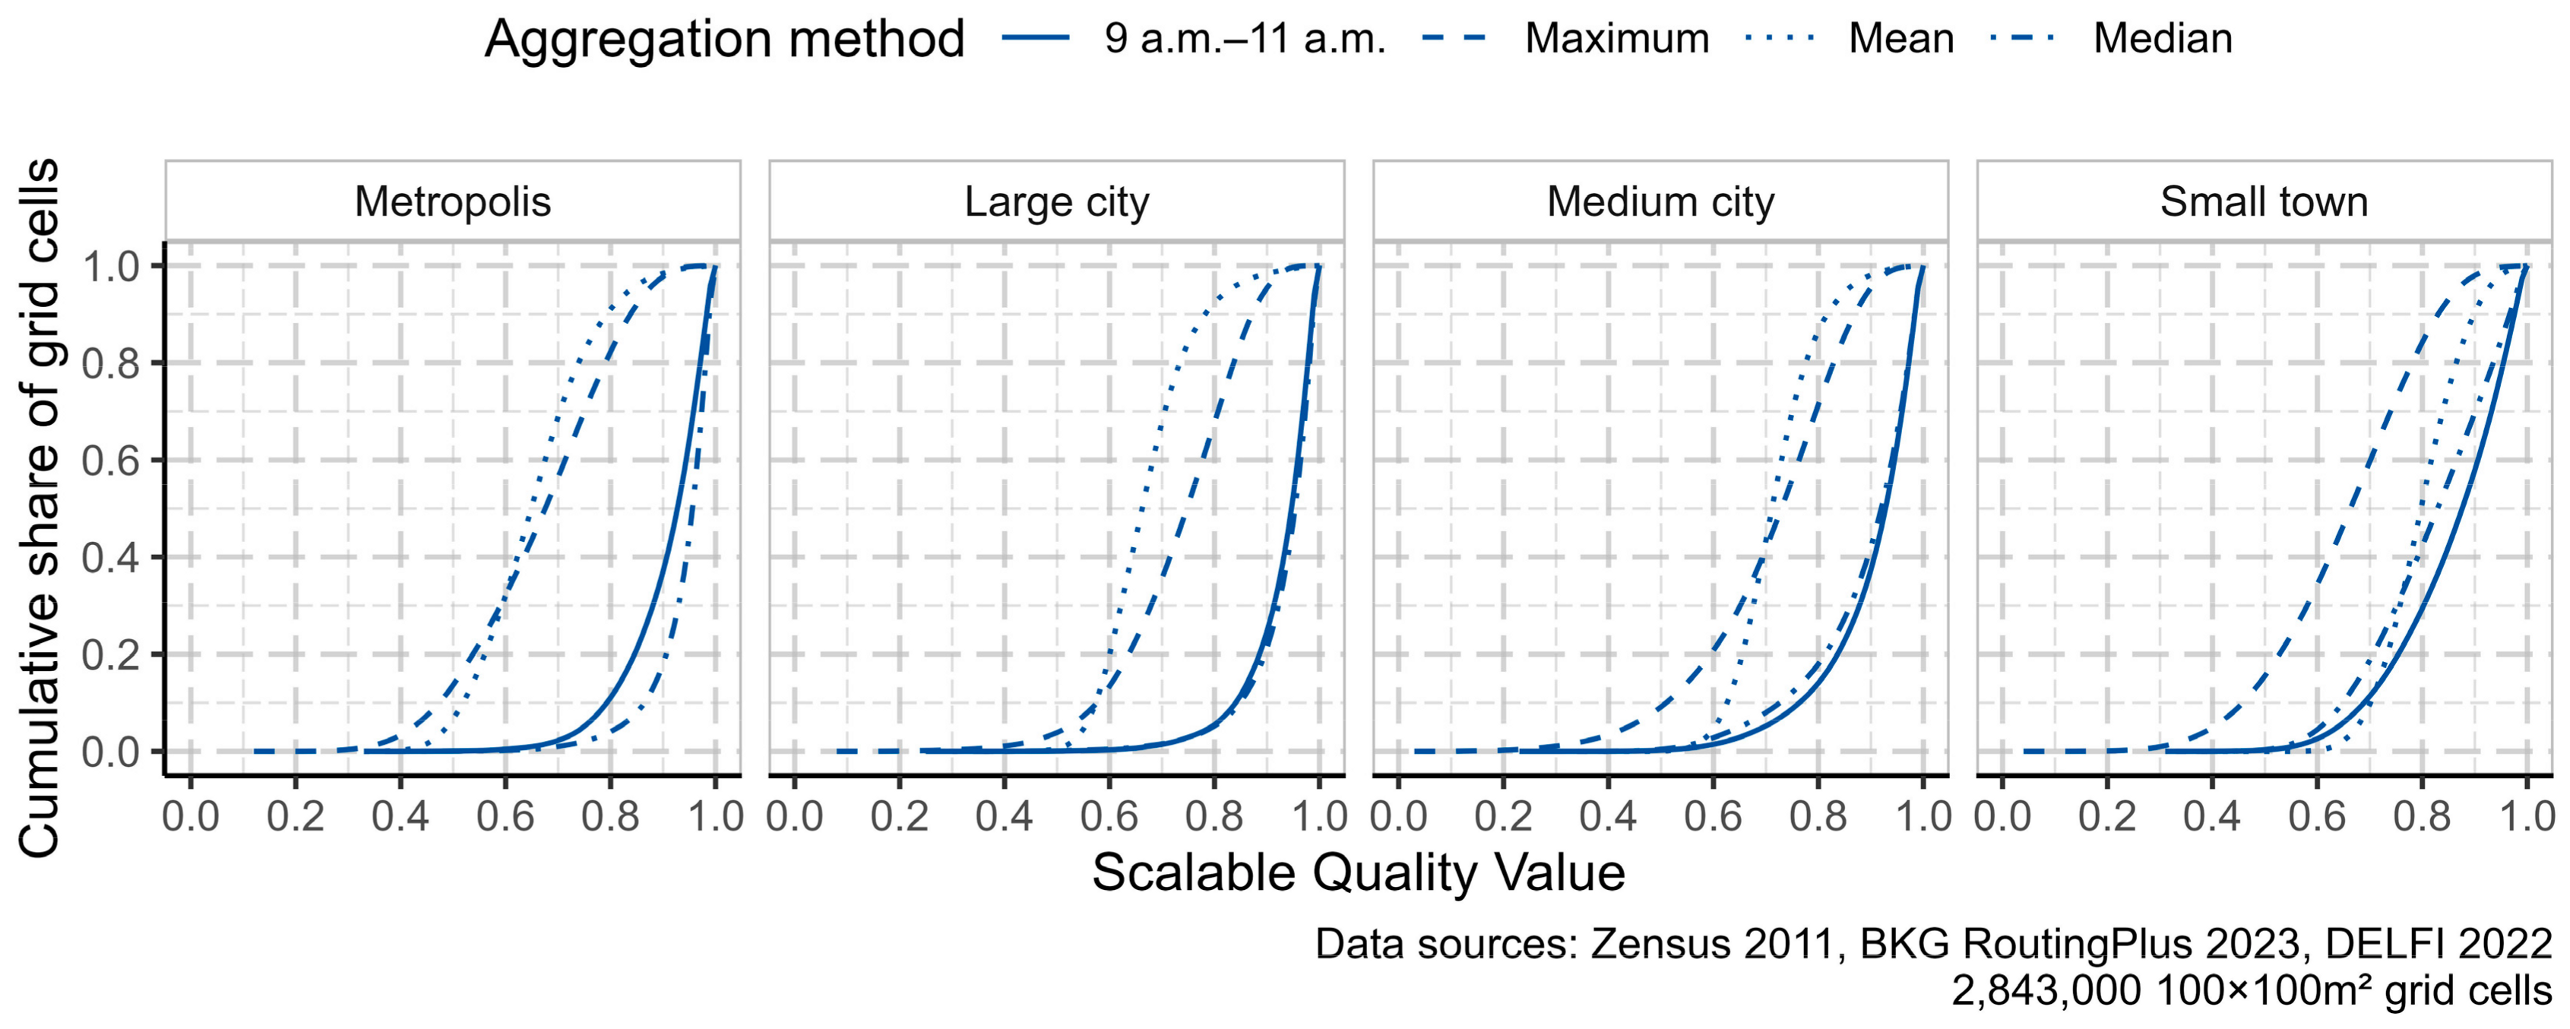
4.3.2. Aggregation
5. Discussion and Conclusions
Author Contributions
Funding
Data Availability Statement
Conflicts of Interest
References
- Klar, B.; Lee, J.; Long, J.A.; Diab, E. The impacts of accessibility measure choice on public transit project evaluation: A comparative study of cumulative, gravity-based, and hybrid approaches. J. Transp. Geogr. 2023, 106, 103508. [Google Scholar] [CrossRef] [Scilit]
- Albuquerque-Oliveira, J.L.; Moraes Oliveira-Neto, F.; Pereira, R.H. A novel route-based accessibility measure and its association with transit ridership. Transp. Res. Part A Policy Pract. 2024, 179, 103916. [Google Scholar] [CrossRef] [Scilit]
- van Wee, B. Accessibility and equity: A conceptual framework and research agenda. J. Transp. Geogr. 2022, 104, 103421. [Google Scholar] [CrossRef] [Scilit]
- Pereira, R.H.M.; Schwanen, T.; Banister, D. Distributive justice and equity in transportation. Transp. Rev. 2017, 37, 170–191. [Google Scholar] [CrossRef] [Scilit]
- Aston, L.; Currie, G.; Delbosc, A.; Kamruzzaman, M.; Teller, D. Exploring built environment impacts on transit use—An updated meta-analysis. Transp. Rev. 2021, 41, 73–96. [Google Scholar] [CrossRef] [Scilit]
- Papaioannou, D.; Martinez, L.M. The Role of Accessibility and Connectivity in Mode Choice. A Structural Equation Modeling Approach. Transp. Res. Procedia 2015, 10, 831–839. [Google Scholar] [CrossRef] [Scilit]
- Burns, L.D.; Golob, T.F. The role of accessibility in basic transportation choice behavior. Transportation 1976, 5, 175–198. [Google Scholar] [CrossRef] [Scilit]
- Geurs, K.T.; van Wee, B. Accessibility evaluation of land-use and transport strategies: Review and research directions. J. Transp. Geogr. 2004, 12, 127–140. [Google Scholar] [CrossRef] [Scilit]
- Geurs, K.T. International Transport Forum Discussion Papers. Int. Transp. Forum Discuss. Pap. 2018, 9, 1–26. [Google Scholar] [CrossRef]
- Openshaw, S. The Modifiable Areal Unit Problem. Concepts Tech. Mod. Geogr. 1984, 38, 571–575. [Google Scholar]
- Pereira, R.H.M.; Banister, D.; Schwanen, T.; Wessel, N. Distributional effects of transport policies on inequalities in access to opportunities in Rio de Janeiro. JTLU 2019, 12, 741–764. [Google Scholar] [CrossRef] [Scilit]
- Hewko, J.; Smoyer-Tomic, K.E.; Hodgson, M.J. Measuring Neighbourhood Spatial Accessibility to Urban Amenities: Does Aggregation Error Matter? Environ. Plan. A: Econ. Space 2002, 34, 1185–1206. [Google Scholar] [CrossRef] [Scilit]
- Stępniak, M.; Jacobs-Crisioni, C. Reducing the uncertainty induced by spatial aggregation in accessibility and spatial interaction applications. J. Transp. Geogr. 2017, 61, 17–29. [Google Scholar] [CrossRef] [Scilit]
- Cöltekin, A.; de Sabbata, S.; Willi, C.; Vontobel, I.; Pfister, S.; Kuhn, M.; Lacayo, M. Modifiable temporal unit problem. Persistent Probl. Geogr. Vis. 2011. [Google Scholar] [CrossRef] [Scilit]
- Cheng, T.; Adepeju, M. Modifiable temporal unit problem (MTUP) and its effect on space-time cluster detection. PLoS ONE 2014, 9, e100465. [Google Scholar] [CrossRef] [Scilit]
- Pereira, R.H. Future accessibility impacts of transport policy scenarios: Equity and sensitivity to travel time thresholds for Bus Rapid Transit expansion in Rio de Janeiro. J. Transp. Geogr. 2019, 74, 321–332. [Google Scholar] [CrossRef] [Scilit]
- El-Geneidy, A.; Levinson, D.; Diab, E.; Boisjoly, G.; Verbich, D.; Loong, C. The cost of equity: Assessing transit accessibility and social disparity using total travel cost. Transp. Res. Part A Policy Pract. 2016, 91, 302–316. [Google Scholar] [CrossRef] [Scilit]
- Tomasiello, D.B.; Herszenhut, D.; Oliveira, J.L.A.; Braga, C.K.V.; Pereira, R.H. A time interval metric for cumulative opportunity accessibility. Appl. Geogr. 2023, 157, 103007. [Google Scholar] [CrossRef] [Scilit]
- Stępniak, M.; Pritchard, J.P.; Geurs, K.T.; Goliszek, S. The impact of temporal resolution on public transport accessibility measurement: Review and case study in Poland. J. Transp. Geogr. 2019, 75, 8–24. [Google Scholar] [CrossRef] [Scilit]
- Hansen, W.G. How Accessibility Shapes Land Use. J. Am. Inst. Plan. 1959, 25, 73–76. [Google Scholar] [CrossRef] [Scilit]
- Lunke, E.B. Modal accessibility disparities and transport poverty in the Oslo region. Transp. Res. Part D Transp. Environ. 2022, 103, 103171. [Google Scholar] [CrossRef] [Scilit]
- Lee, J.; Miller, H.J. Measuring the impacts of new public transit services on space-time accessibility: An analysis of transit system redesign and new bus rapid transit in Columbus, Ohio, USA. Appl. Geogr. 2018, 93, 47–63. [Google Scholar] [CrossRef] [Scilit]
- Liao, Y.; Gil, J.; Pereira, R.H.M.; Yeh, S.; Verendel, V. Disparities in travel times between car and transit: Spatiotemporal patterns in cities. Sci. Rep. 2020, 10, 4056. [Google Scholar] [CrossRef] [Scilit] [PubMed]
- Boisjoly, G.; El-Geneidy, A. Daily fluctuations in transit and job availability: A comparative assessment of time-sensitive accessibility measures. J. Transp. Geogr. 2016, 52, 73–81. [Google Scholar] [CrossRef] [Scilit]
- Boisjoly, G.; El-Geneidy, A. The insider: A planners’ perspective on accessibility. J. Transp. Geogr. 2017, 64, 33–43. [Google Scholar] [CrossRef] [Scilit]
- Farber, S.; Morang, M.Z.; Widener, M.J. Temporal variability in transit-based accessibility to supermarkets. Appl. Geogr. 2014, 53, 149–159. [Google Scholar] [CrossRef] [Scilit]
- Chen, J.; Ni, J.; Xi, C.; Li, S.; Wang, J. Determining intra-urban spatial accessibility disparities in multimodal public transport networks. J. Transp. Geogr. 2017, 65, 123–133. [Google Scholar] [CrossRef] [Scilit]
- Kinigadner, J.; Büttner, B.; Wulfhorst, G.; Vale, D. Planning for low carbon mobility: Impacts of transport interventions and location on carbon-based accessibility. J. Transp. Geogr. 2020, 87, 102797. [Google Scholar] [CrossRef] [Scilit]
- Viguié, V.; Liotta, C.; Pfeiffer, B.; Coulombel, N. Can public transport improve accessibility for the poor over the long term? Empirical evidence in Paris, 1968–2010. J. Transp. Geogr. 2023, 106, 103473. [Google Scholar] [CrossRef] [Scilit]
- Li, S.; Duan, H.; Smith, T.E.; Hu, H. Time-varying accessibility to senior centers by public transit in Philadelphia. Transp. Res. Part A Policy Pract. 2021, 151, 245–258. [Google Scholar] [CrossRef] [Scilit]
- Fan, Y.; Guthrie, A.E.; Levinson, D.M. Impact of light rail implementation on labor market accessibility: A transportation equity perspective. JTLU 2012, 5, 28–39. [Google Scholar] [CrossRef] [Scilit]
- Owen, A.; Levinson, D.M. Modeling the commute mode share of transit using continuous accessibility to jobs. Transp. Res. Part A Policy Pract. 2015, 74, 110–122. [Google Scholar] [CrossRef] [Scilit]
- El-Geneidy, A.; Buliung, R.; Diab, E.; van Lierop, D.; Langlois, M.; Legrain, A. Non-stop equity: Assessing daily intersections between transit accessibility and social disparity across the Greater Toronto and Hamilton Area (GTHA). Environ. Plan. B Plan. Des. 2016, 43, 540–560. [Google Scholar] [CrossRef] [Scilit]
- Conway, M.W.; Byrd, A.; van Eggermond, M. Accounting for uncertainty and variation in accessibility metrics for public transport sketch planning. JTLU 2018, 11, 541–558. [Google Scholar] [CrossRef] [Scilit]
- Destatis. Zensus 2011; Statistische Ämter des Bundes und der Länder, Federal Statistical Office of Germany: Wiesbaden, Germany, 2015; Available online: https://www.zensus2011.de (accessed on 30 September 2022).
- Bundesamt für Kartographie und Geodäsie. Geographische Gitter für Deutschland in Lambert-Projektion (GeoGitter Inspire); Federal Agency for Cartography and Geodesy (BKG): Leipzig, Germany, 2018; Available online: https://gdz.bkg.bund.de/index.php/default/geographische-gitter-fur-deutschland-in-lambert-projektion-geogitter-inspire.html (accessed on 30 September 2022).
- Bundesamt für Kartographie und Geodäsie. Digitales Landschaftsmodell 1:250,000 (Ebenen, DLM250); Federal Agency for Cartography and Geodesy (BKG): Leipzig, Germany, 2022; Available online: https://gdz.bkg.bund.de/index.php/default/open-data/digitales-landschaftsmodell-1-250-000-ebenen-dlm250-ebenen.html (accessed on 30 September 2022).
- DELFI. Deutschlandweite Sollfahrplandaten (GTFS); Verein zur Förderung Einer Durchgängigen Elektronischen Fahrgastinformation e.V. (DELFI): Frankfurt am Main, Germany, 2022; Available online: https://www.opendata-oepnv.de/ht/de/organisation/delfi (accessed on 30 September 2022).
- WVI. Zentrales Haltestellenverzeichnis; Verein zur Förderung Einer Durchgängigen Elektronischen Fahrgastinformation e.V. (DELFI): Frankfurt am Main, Germany, 2022; Available online: https://www.opendata-oepnv.de/ht/de/organisation/delfi (accessed on 30 September 2022).
- OSM OpenStreetMap. OpenStreetMap Contributors. 2022. Available online: https://www.openstreetmap.org (accessed on 30 September 2022).
- infas; DLR; IVT; infas 360. Mobilität in Deutschland 2017; Federal Ministry of Digital and Transport (BMDV): Berlin, Germany, 2018. [Google Scholar]
- BMDV. RegioStaR; Federal Ministry of Digital and Transport (BMDV): Berlin, Germany, 2021; Available online: https://bmdv.bund.de/SharedDocs/DE/Artikel/G/regionalstatistische-raumtypologie.html (accessed on 30 September 2022).
- Klinkhardt, C.; Kühnel, F.; Heilig, M.; Lautenbach, S.; Wörle, T.; Vortisch, P.; Kuhnimhof, T. Quality Assessment of OpenStreetMap’s Points of Interest with Large-Scale Real Data. Transp. Res. Rec. J. Transp. Res. Board 2023, 2677, 661–674. [Google Scholar] [CrossRef] [Scilit]
- Kühnel, F.; Klinkhardt, C.; Heilig, M.; Wörle, T.; Lautenbach, S.; Kuhnimhof, T.; Kagerbauer, M. Vollständigkeit von OpenStreetMap-POI-Daten für die Nutzung in der Verkehrsplanung. In Heureka 2024: Optimierung in Transport und Verkehr, Stuttgart, Germany, 2024; FGSV-Verlag: Cologne, Germany, 2024. [Google Scholar]
- Verband Deutscher Verkehrsunternehmen e.V. Verkehrserschließung, Verkehrsangebot und Netzqualität im ÖPNV. In VDV-Schr; Verband Deutscher Verkehrsunternehmen: Cologne, Germany, 2019; Volume 4. [Google Scholar]
- Poletti, F.; Herszenhut, D.; Padgham, M.; Buckley, T.; Noriega-Goodwin, D.; Li, A.; McVey, E.; Thompson, C.H.; Sumner, M.; Hausmann, P.; et al. tidytransit 2022, Version 1.4. Available online: https://cran.r-project.org/web/packages/tidytransit/index.html (accessed on 30 September 2022).
- Bundesamt für Kartographie und Geodäsie. Routing Plus—Dienst web_ors (Bund); Federal Agency for Cartography and Geodesy (BKG): Leipzig, Germany, 2023. [Google Scholar]
- Friedrich, M.; Pestel, E.; Schiller, C.; Simon, R. Scalable GEH: A Quality Measure for Comparing Observed and Modeled Single Values in a Travel Demand Model Validation. Transp. Res. Rec. 2019, 2673, 722–732. [Google Scholar] [CrossRef] [Scilit]

Disclaimer/Publisher’s Note: The statements, opinions and data contained in all publications are solely those of the individual author(s) and contributor(s) and not of MDPI and/or the editor(s). MDPI and/or the editor(s) disclaim responsibility for any injury to people or property resulting from any ideas, methods, instructions or products referred to in the content. |
© 2024 by the authors. Licensee MDPI, Basel, Switzerland. This article is an open access article distributed under the terms and conditions of the Creative Commons Attribution (CC BY) license (https://creativecommons.org/licenses/by/4.0/).
Share and Cite
Lindner, A.; Kühnel, F.; Schrömbges, M.; Kuhnimhof, T. When to Measure Accessibility? Temporal Segmentation and Aggregation in Location-Based Public Transit Accessibility. Urban Sci. 2024, 8, 165. https://doi.org/10.3390/urbansci8040165
Lindner A, Kühnel F, Schrömbges M, Kuhnimhof T. When to Measure Accessibility? Temporal Segmentation and Aggregation in Location-Based Public Transit Accessibility. Urban Science. 2024; 8(4):165. https://doi.org/10.3390/urbansci8040165
Chicago/Turabian StyleLindner, Anna, Fabian Kühnel, Michael Schrömbges, and Tobias Kuhnimhof. 2024. "When to Measure Accessibility? Temporal Segmentation and Aggregation in Location-Based Public Transit Accessibility" Urban Science 8, no. 4: 165. https://doi.org/10.3390/urbansci8040165
APA StyleLindner, A., Kühnel, F., Schrömbges, M., & Kuhnimhof, T. (2024). When to Measure Accessibility? Temporal Segmentation and Aggregation in Location-Based Public Transit Accessibility. Urban Science, 8(4), 165. https://doi.org/10.3390/urbansci8040165