Prioritizing Sustainable City Indicators for Cambodia


Abstract
:
1. Introduction
1.1. Background and Purposes
1.2. Consensus Indicators
2. Materials and Methods
2.1. Questionnaire Development
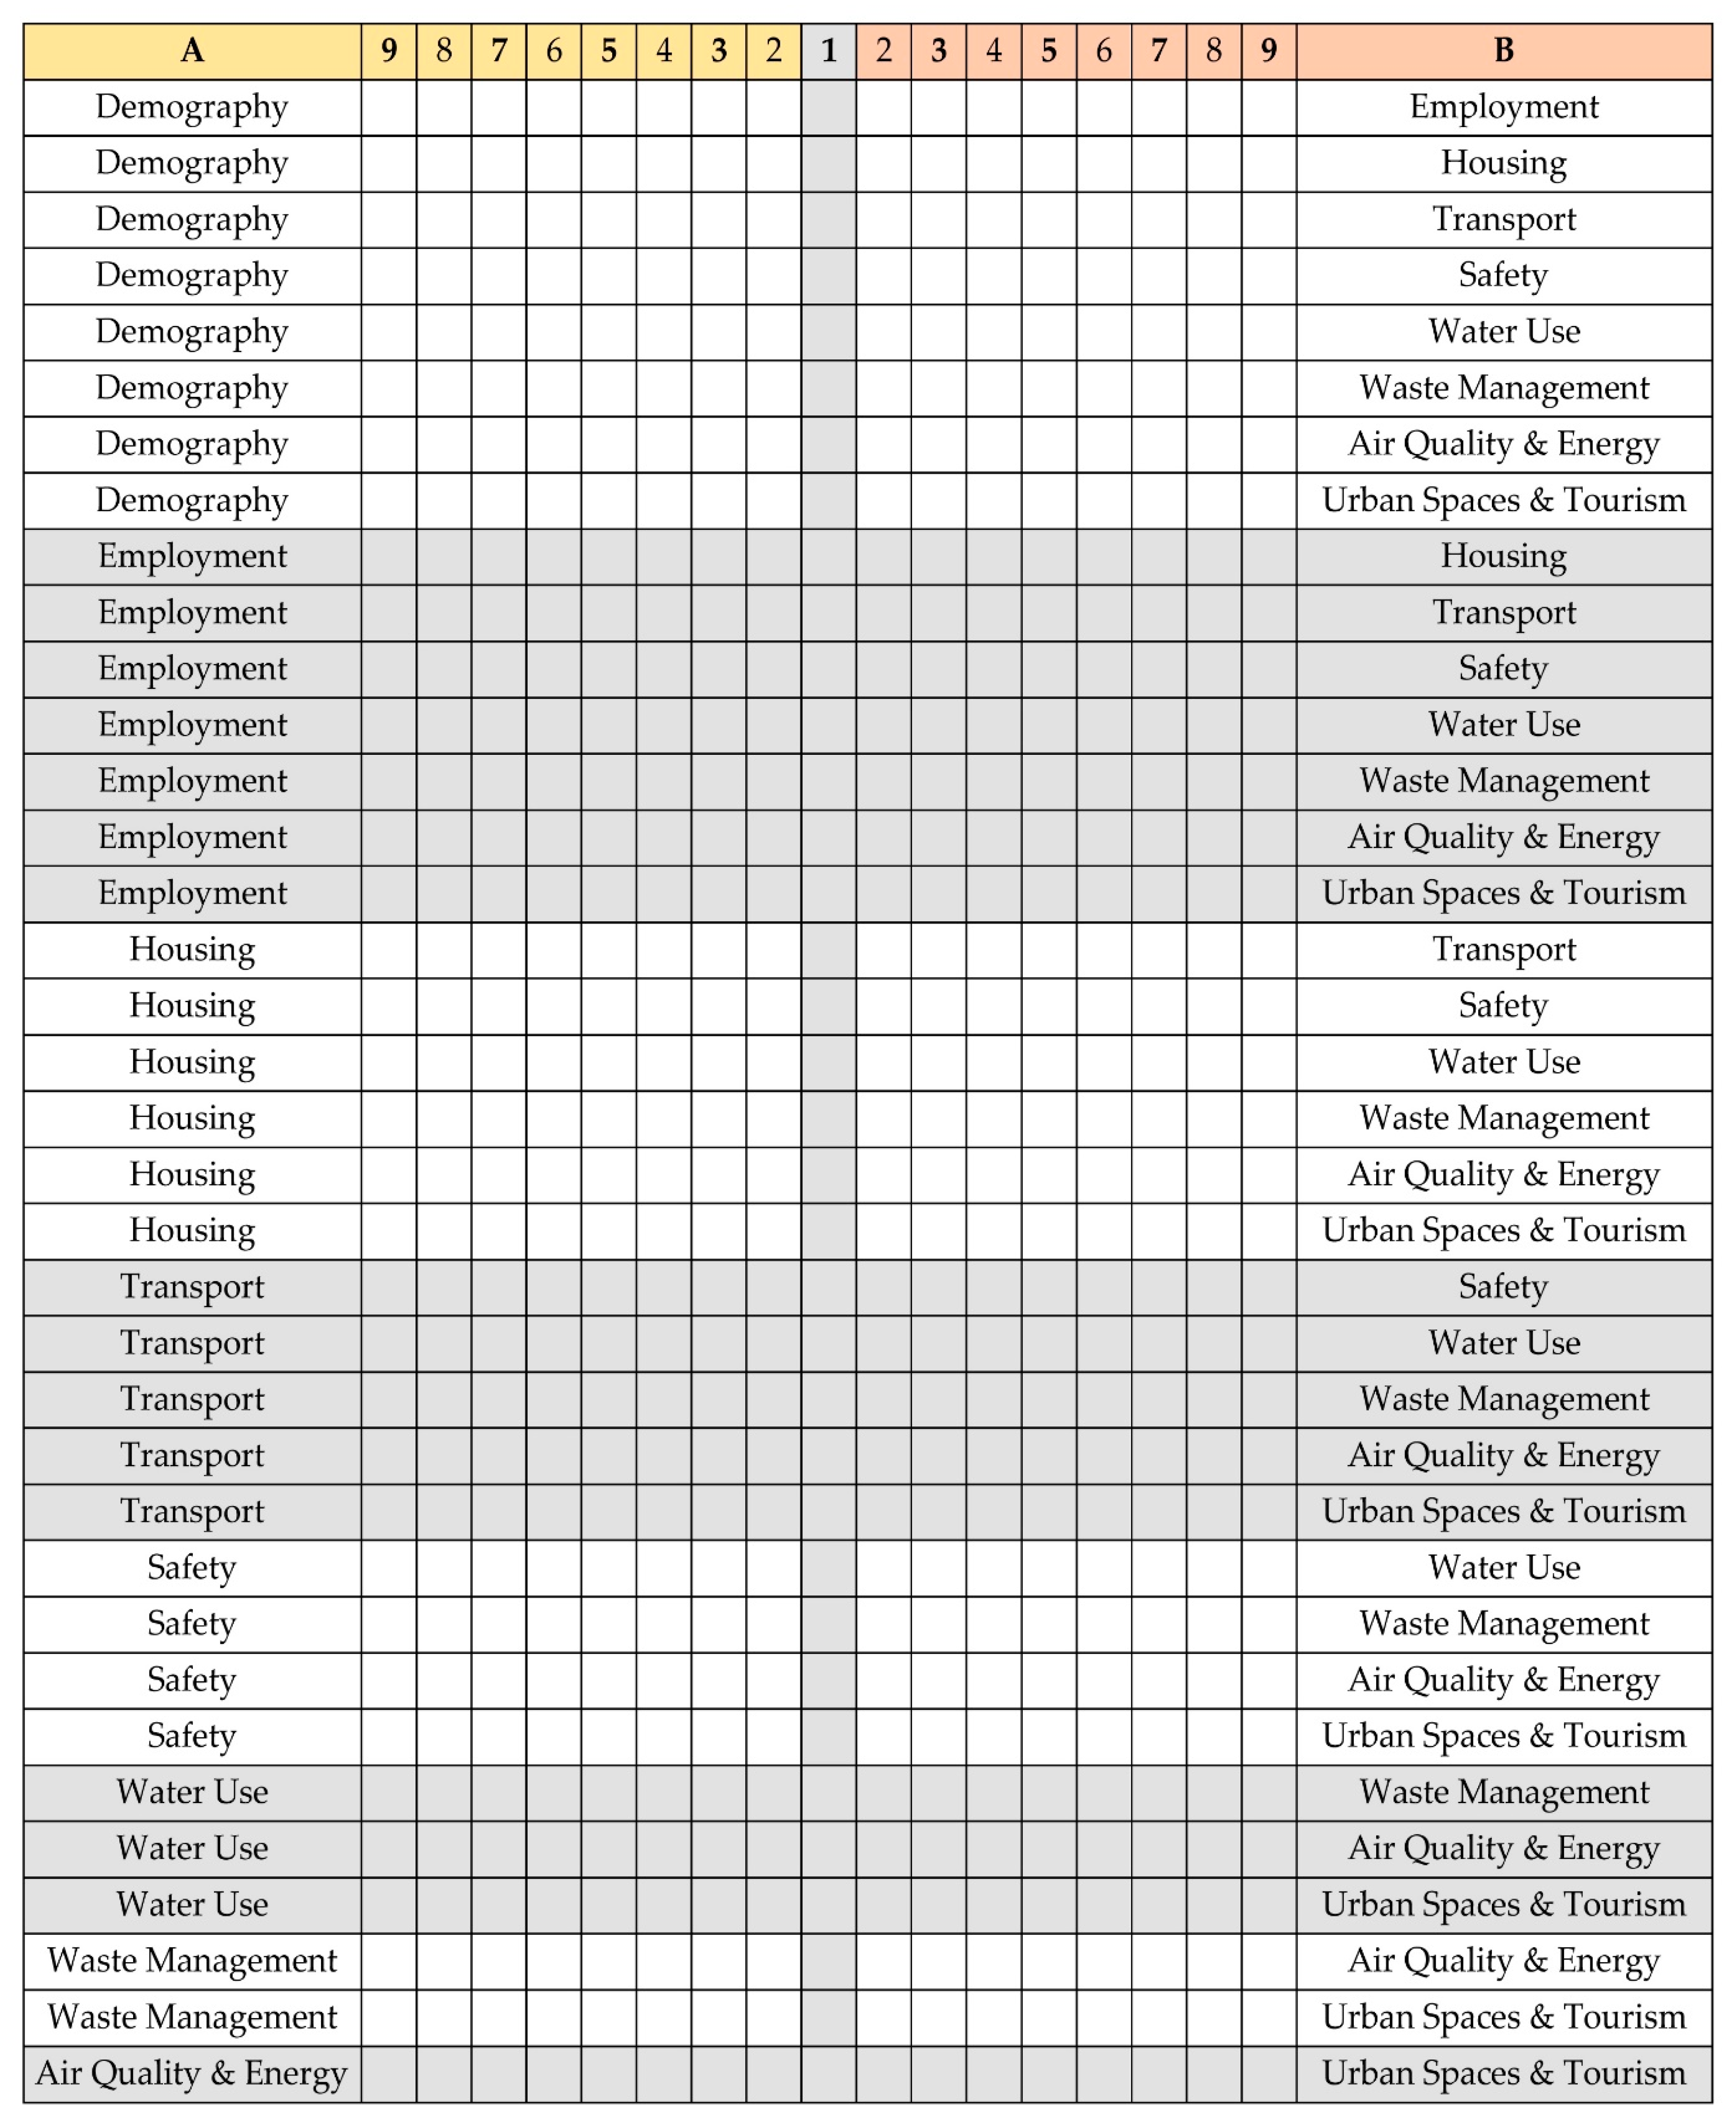
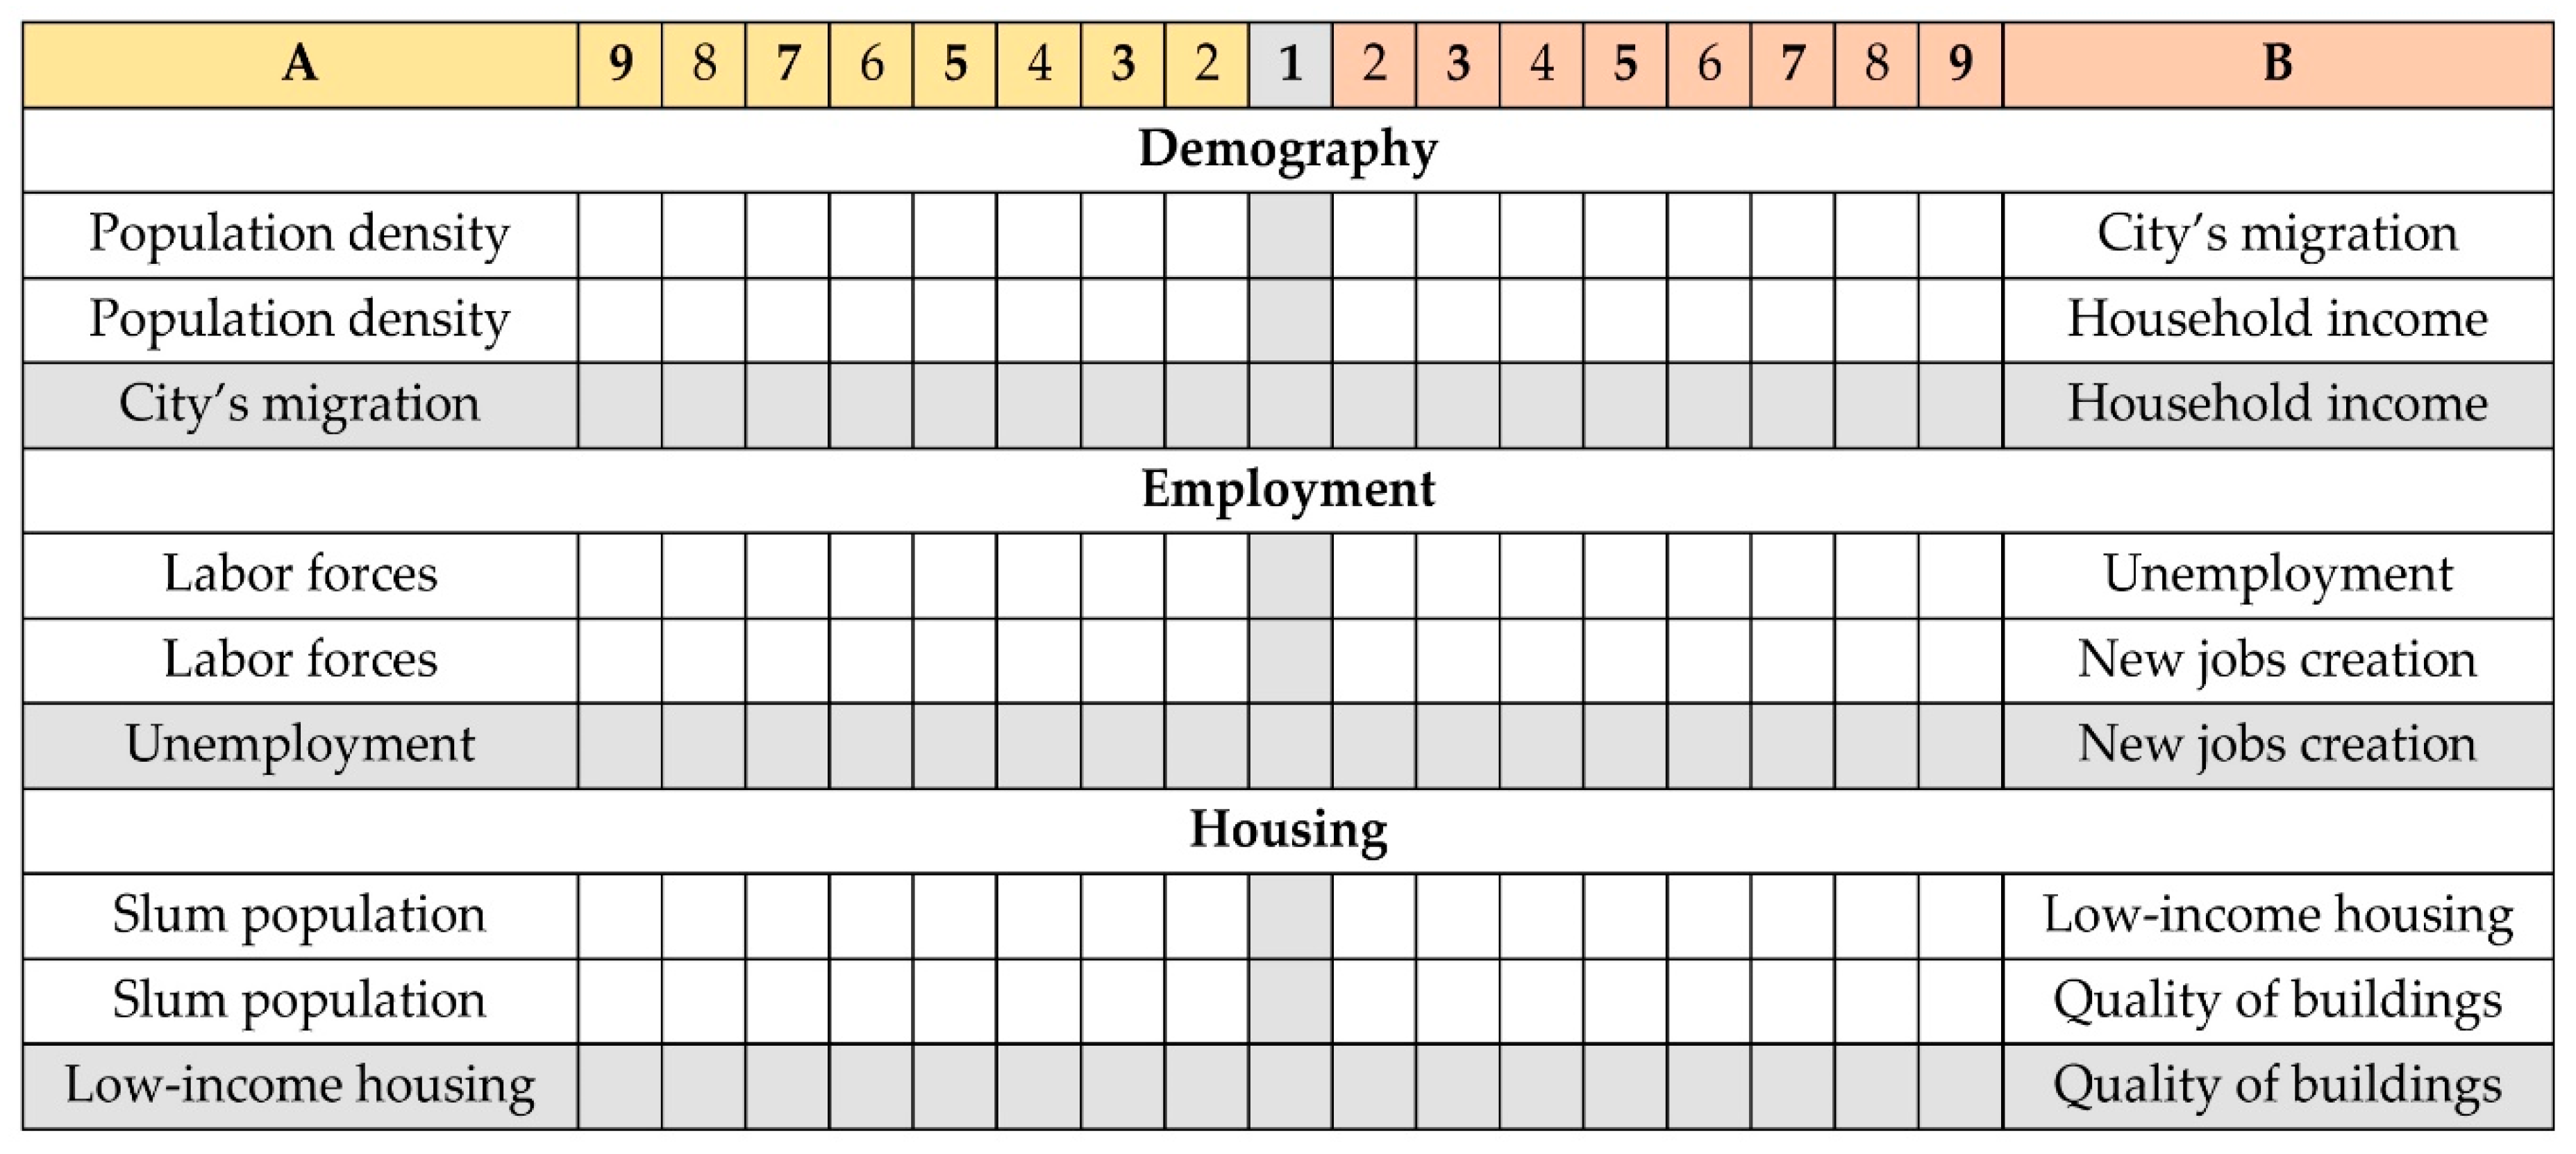
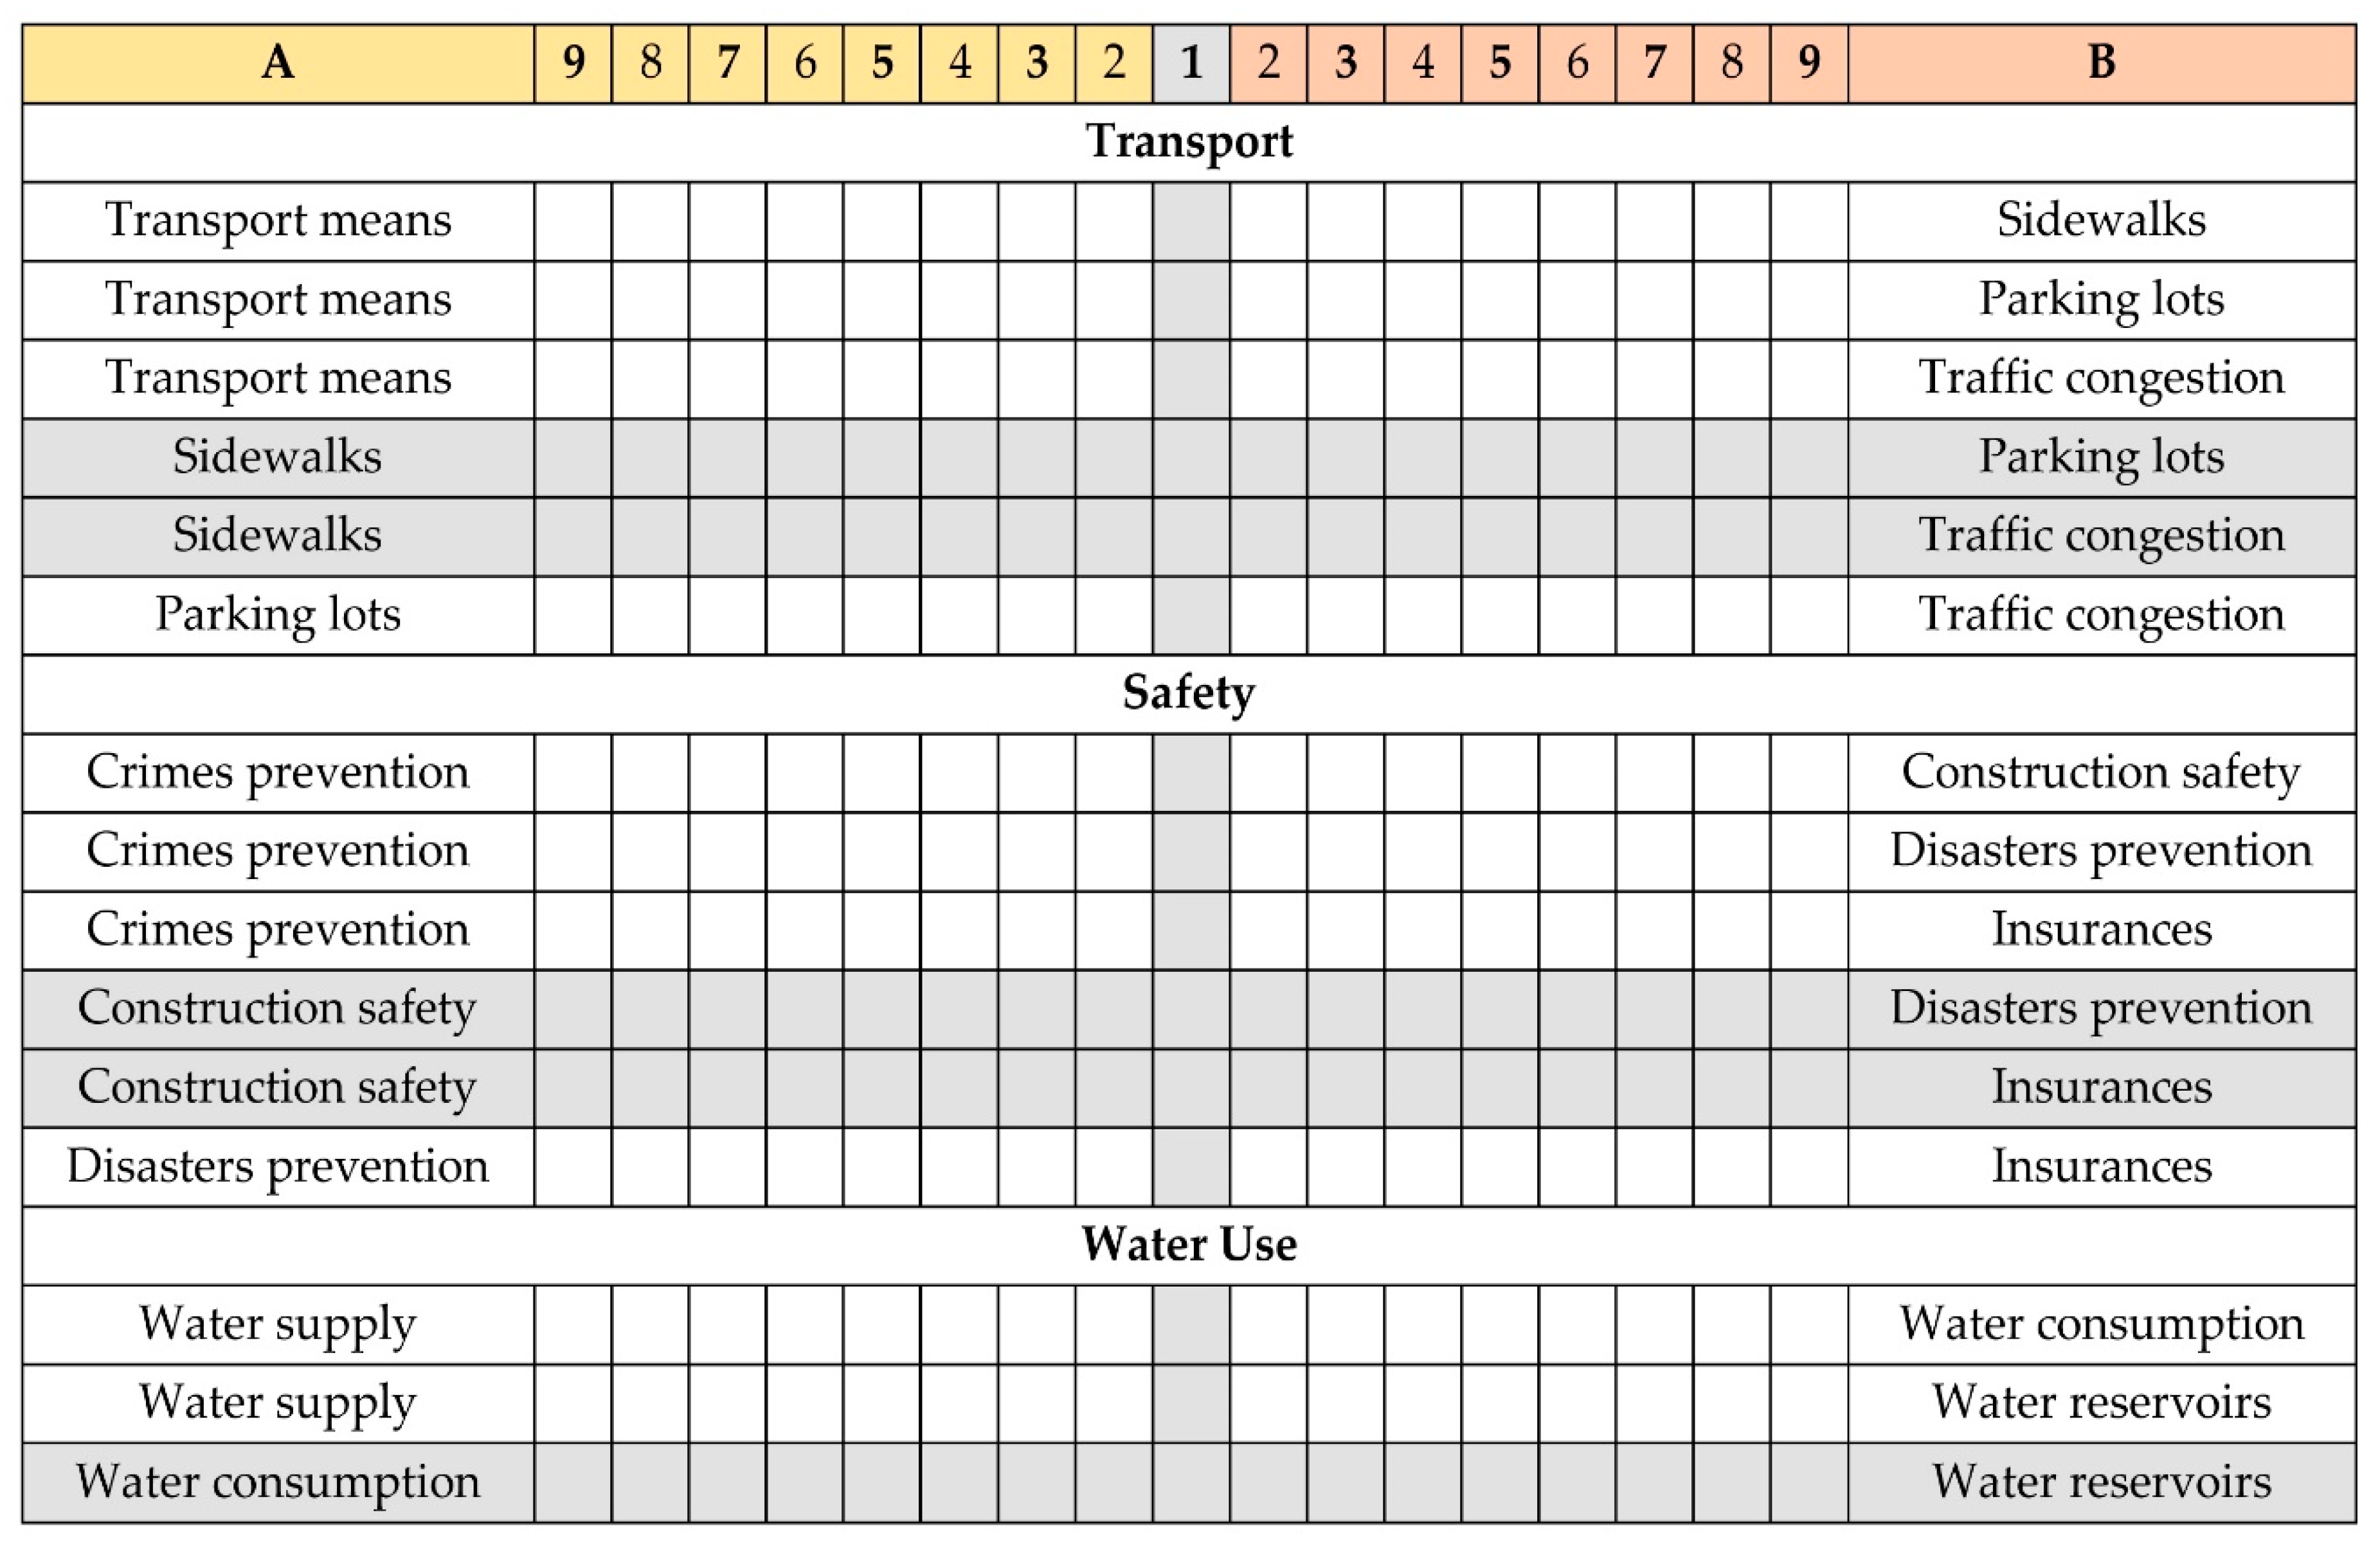
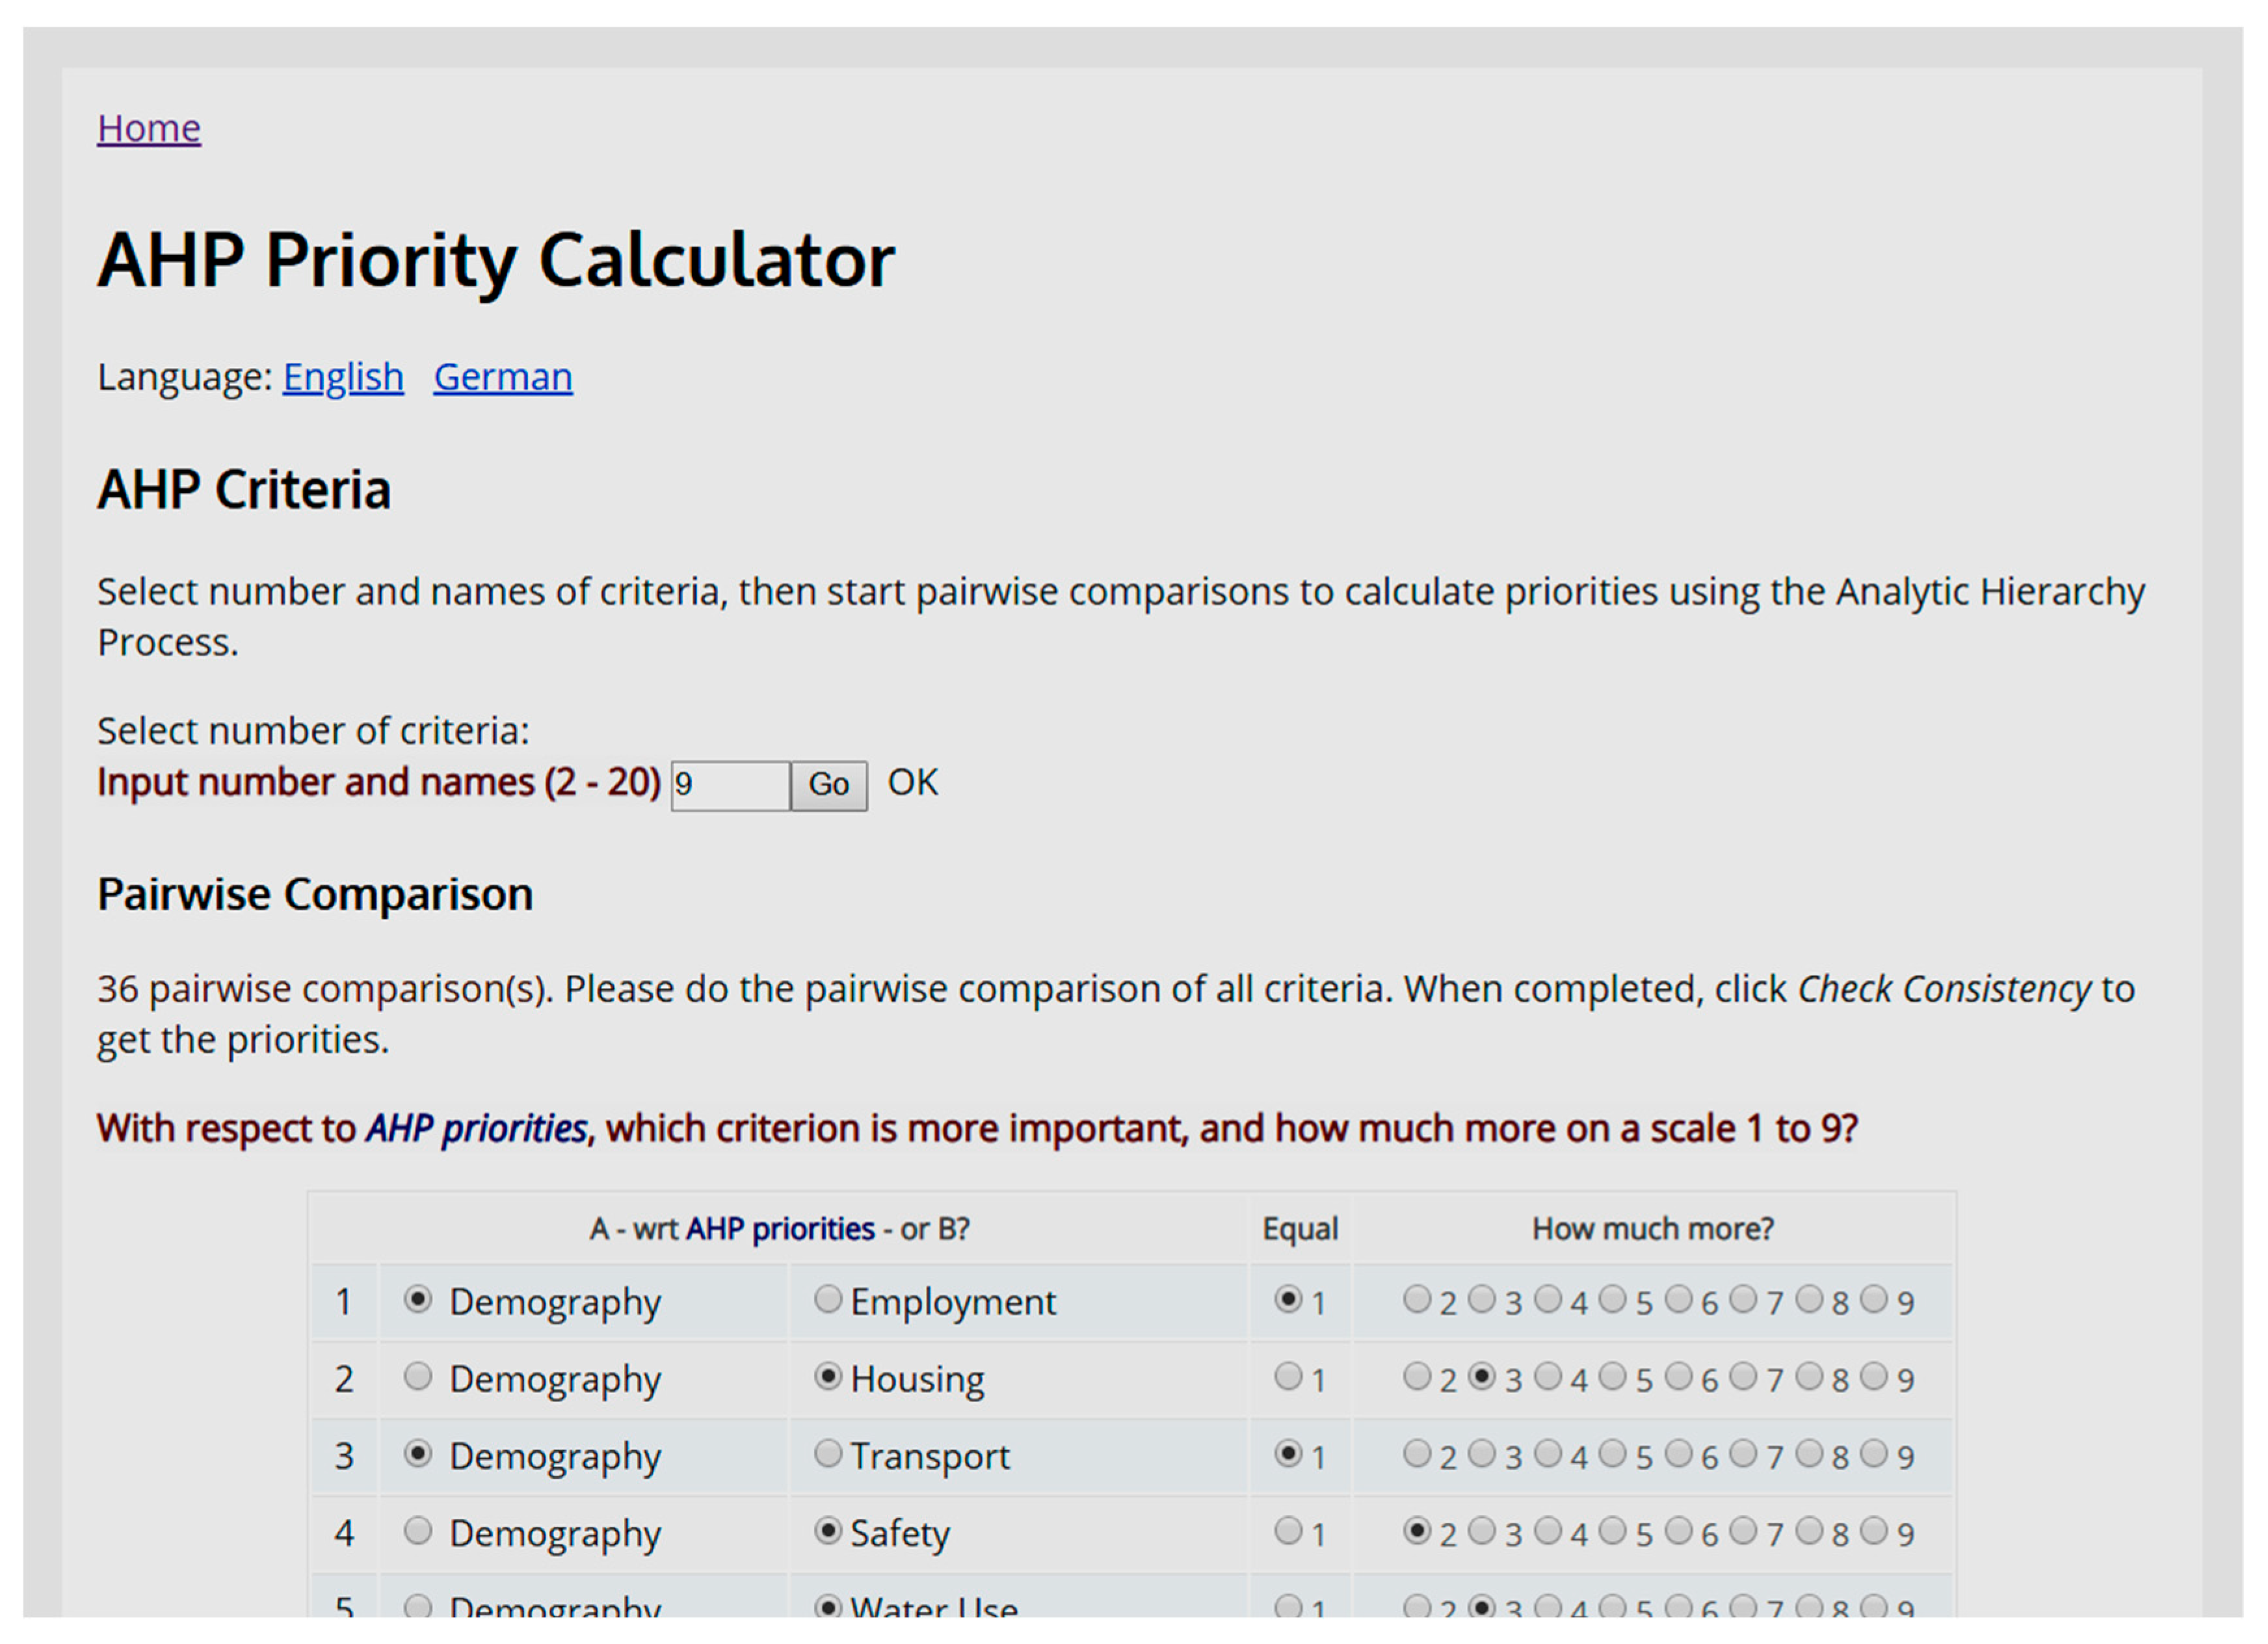
2.2. AHP Survey and Data Analysis
3. Results
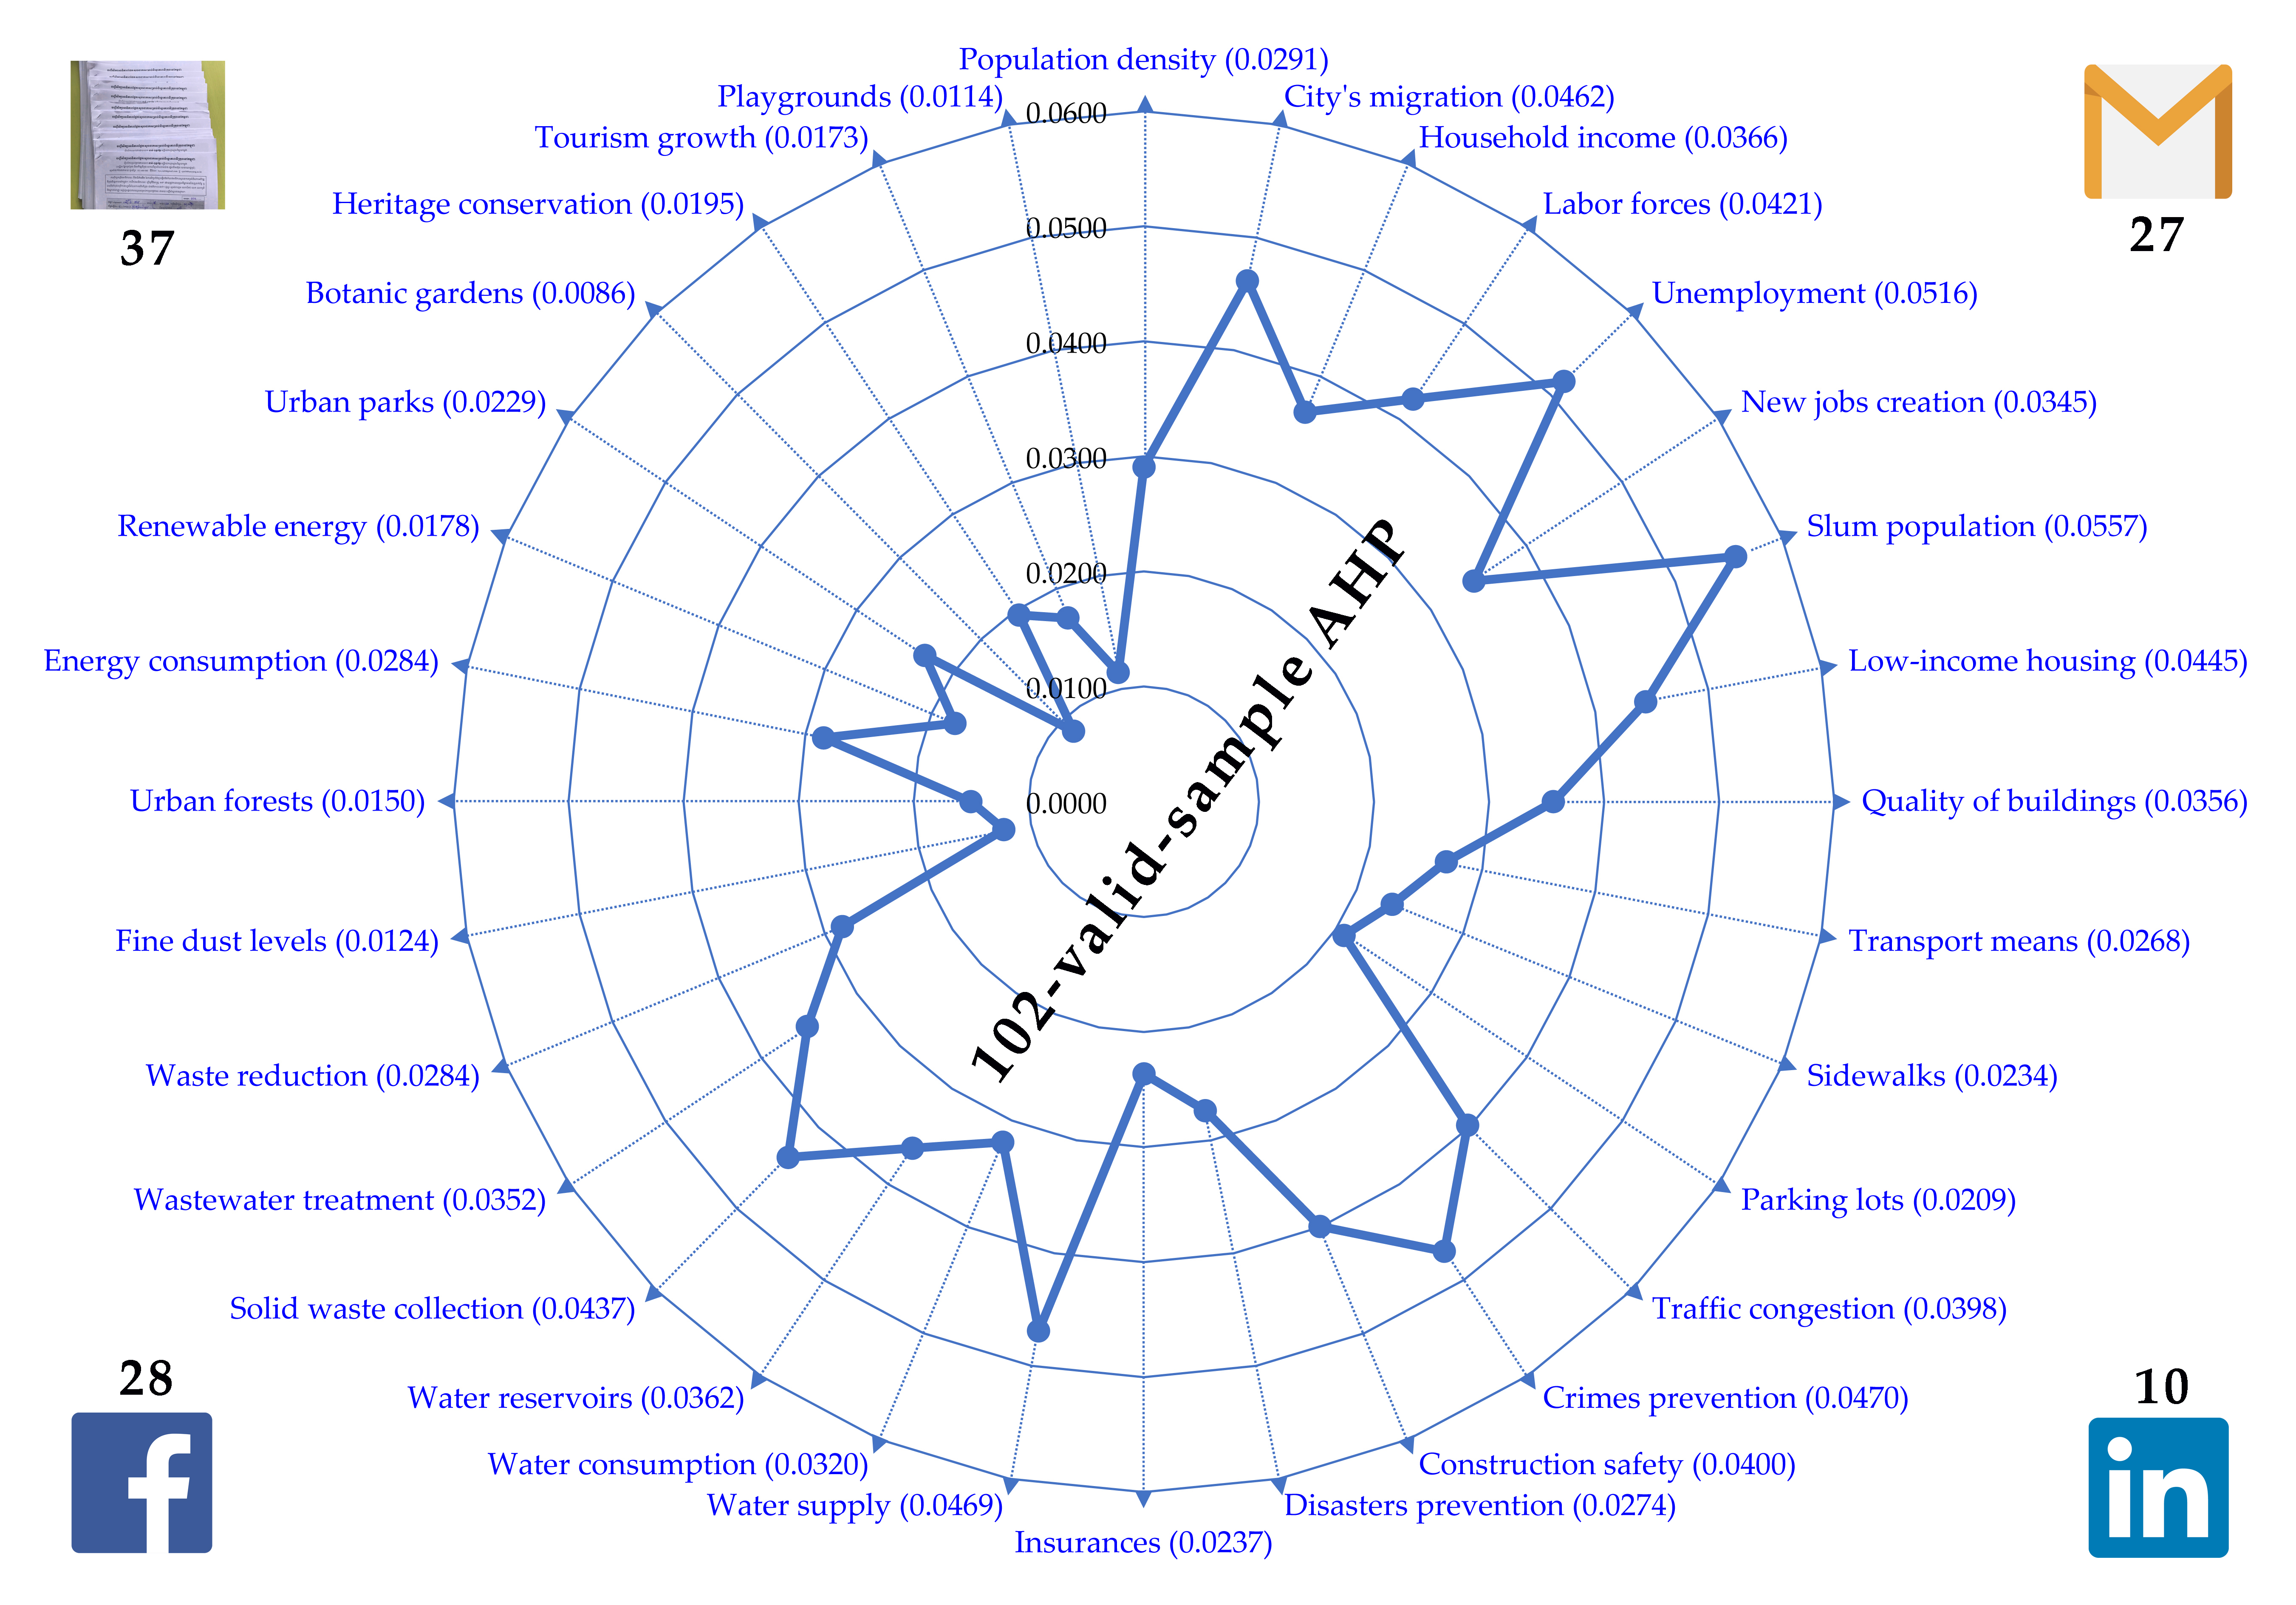
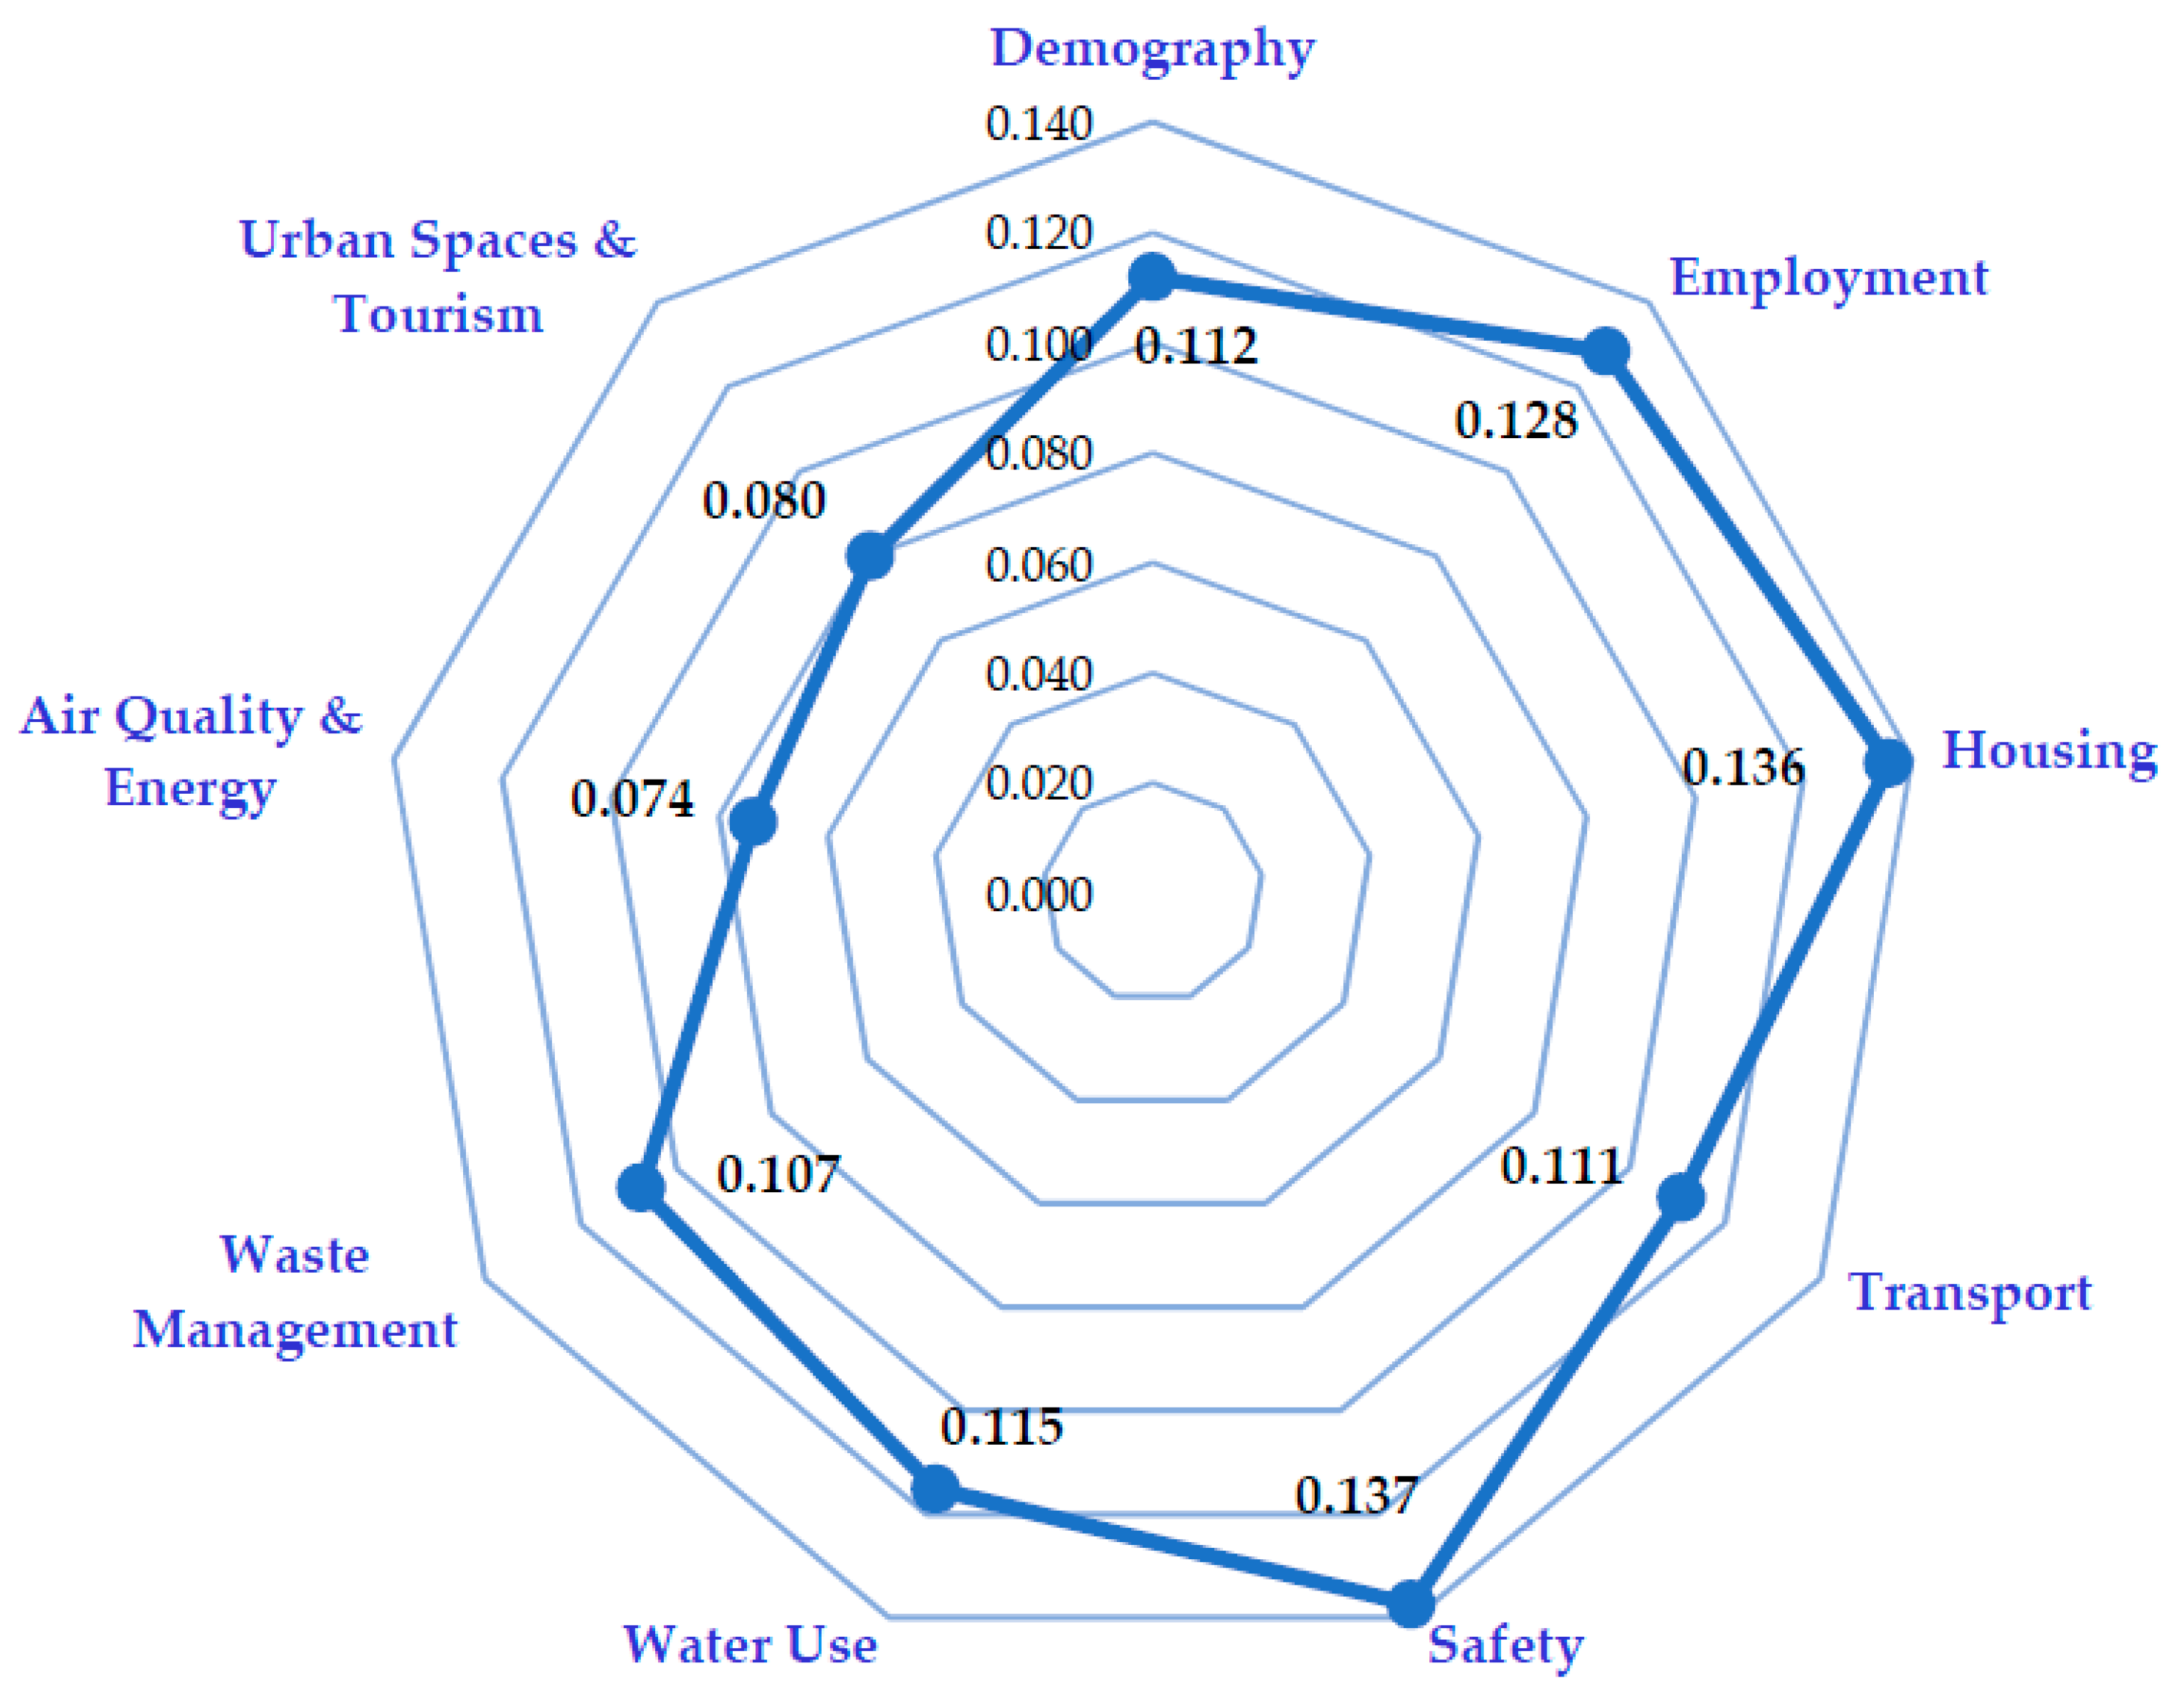
3.1. Priority Weights of the Nine Criteria
3.2. Priority Weights of the Indicators in Each Criterion
3.2.1. Demography
3.2.2. Employment
3.2.3. Housing
3.2.4. Transport
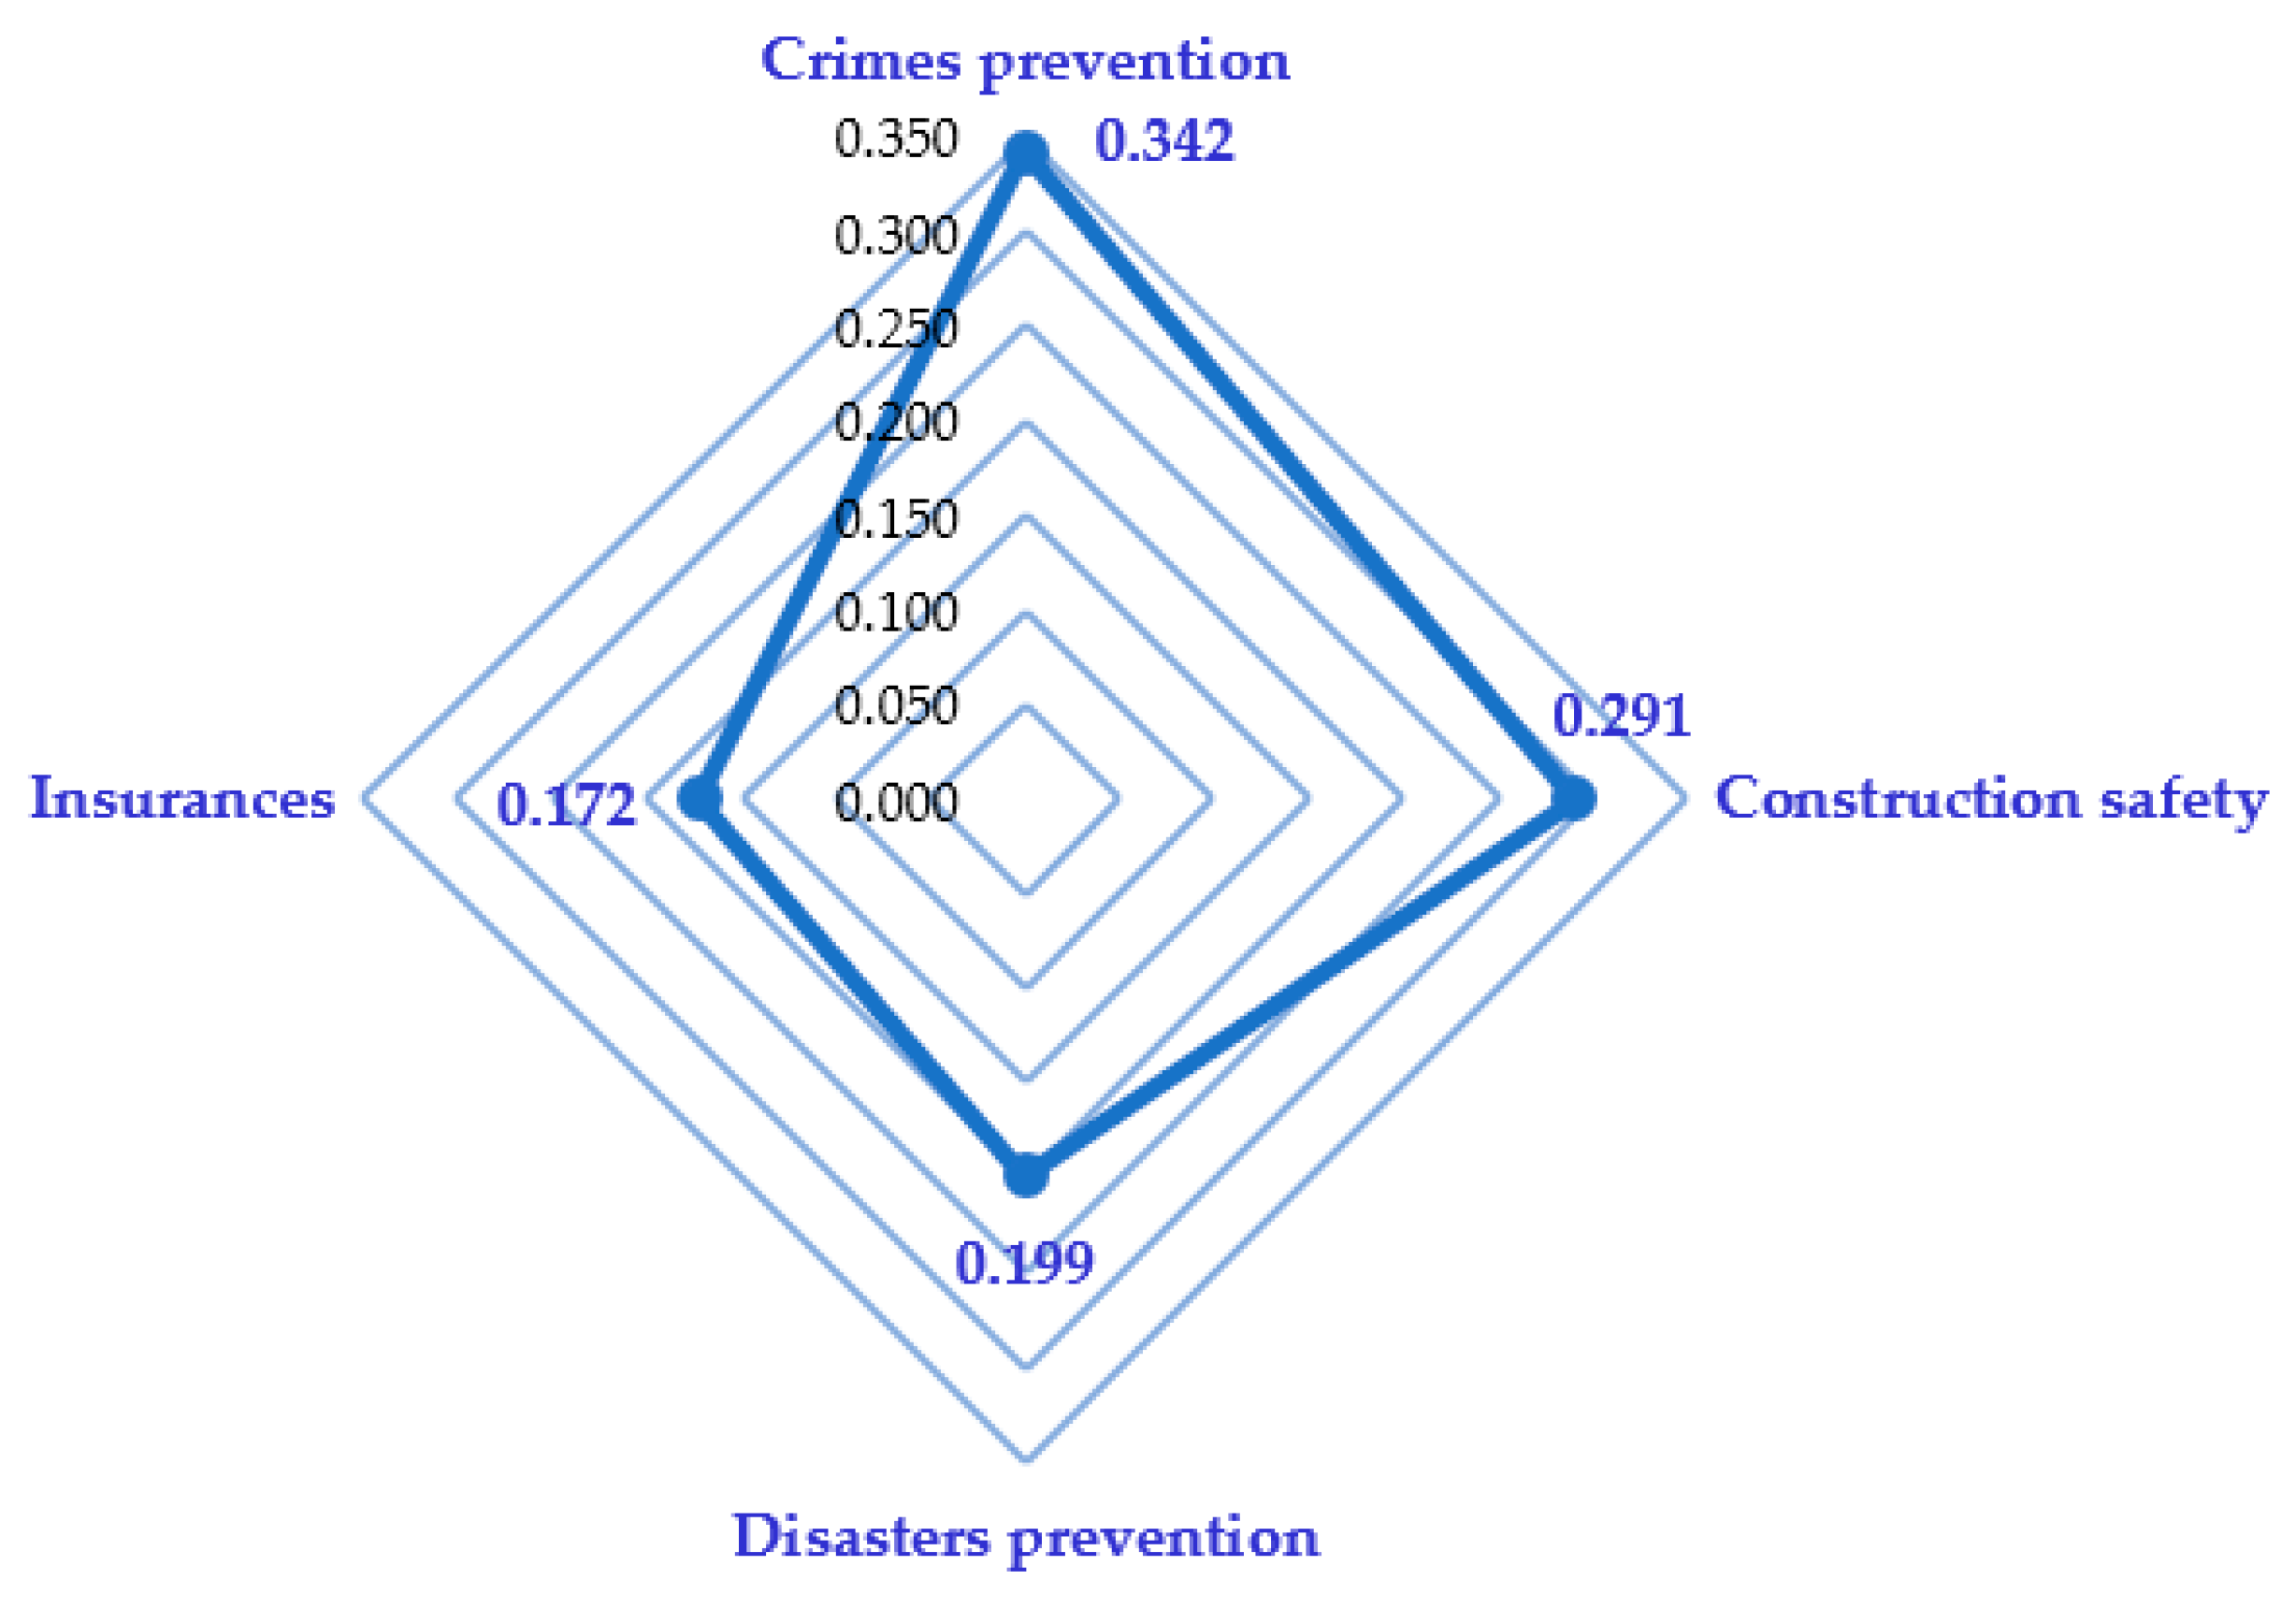
3.2.5. Safety
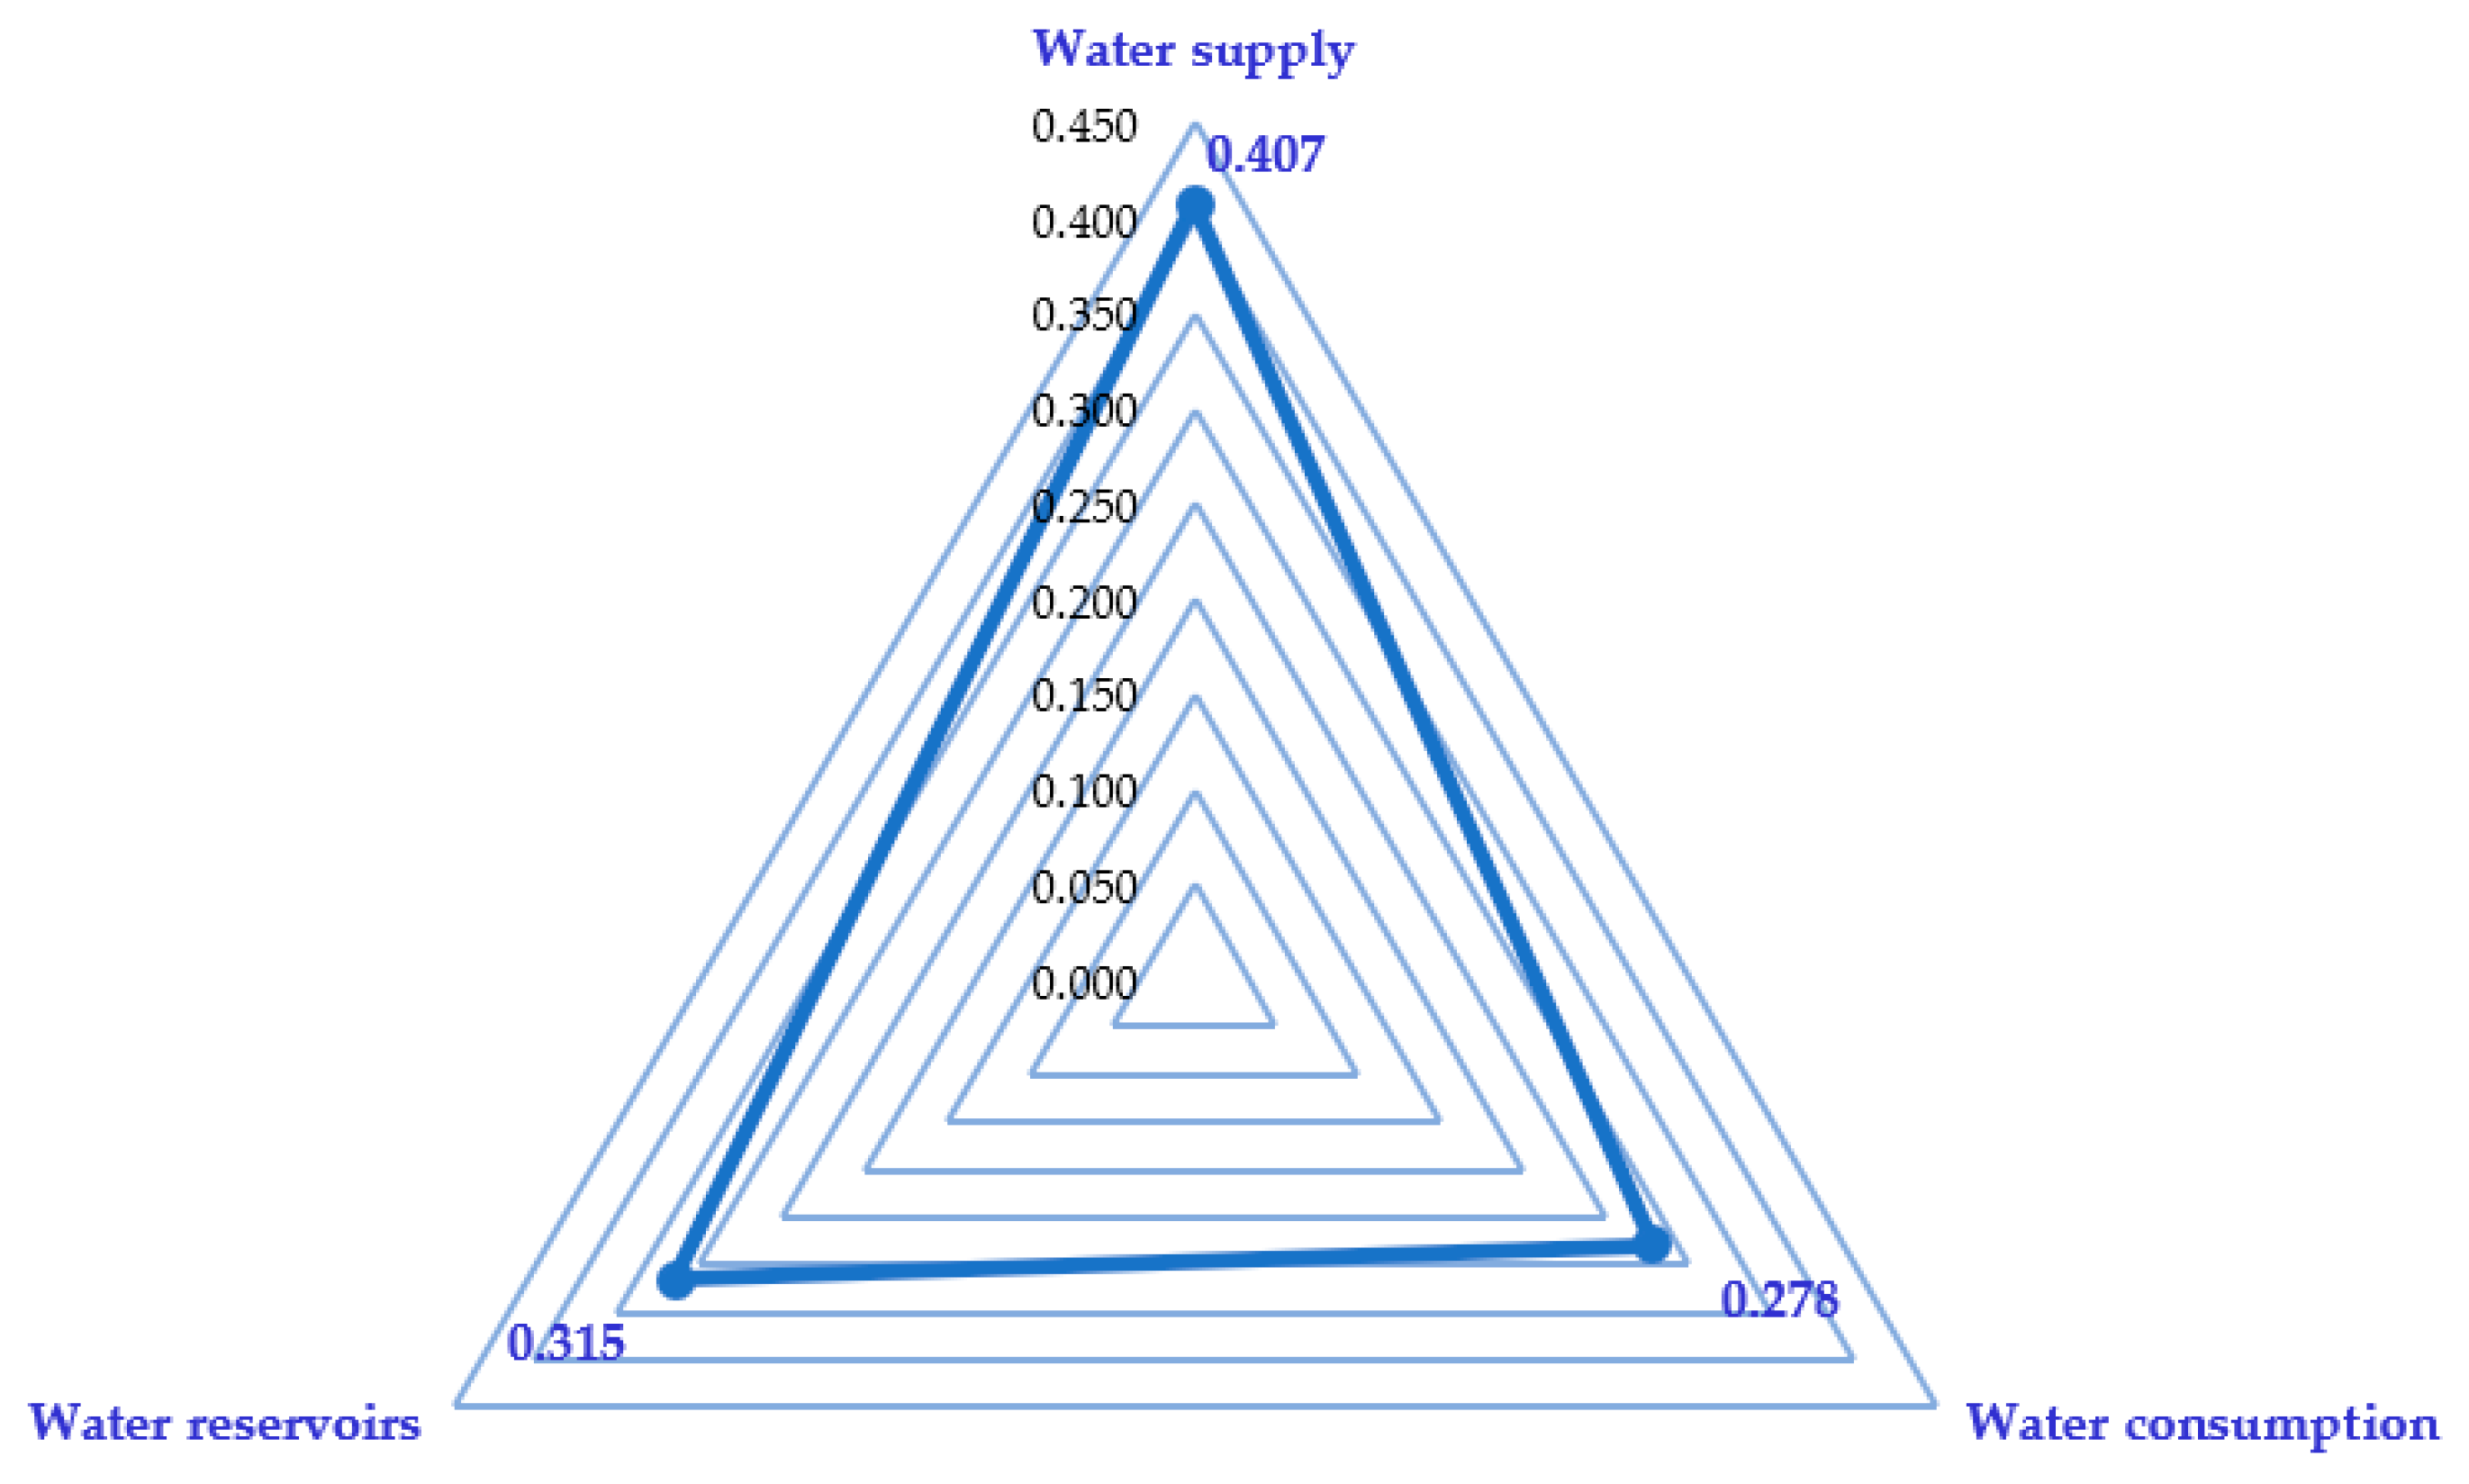
3.2.6. Water Use
3.2.7. Waste Management
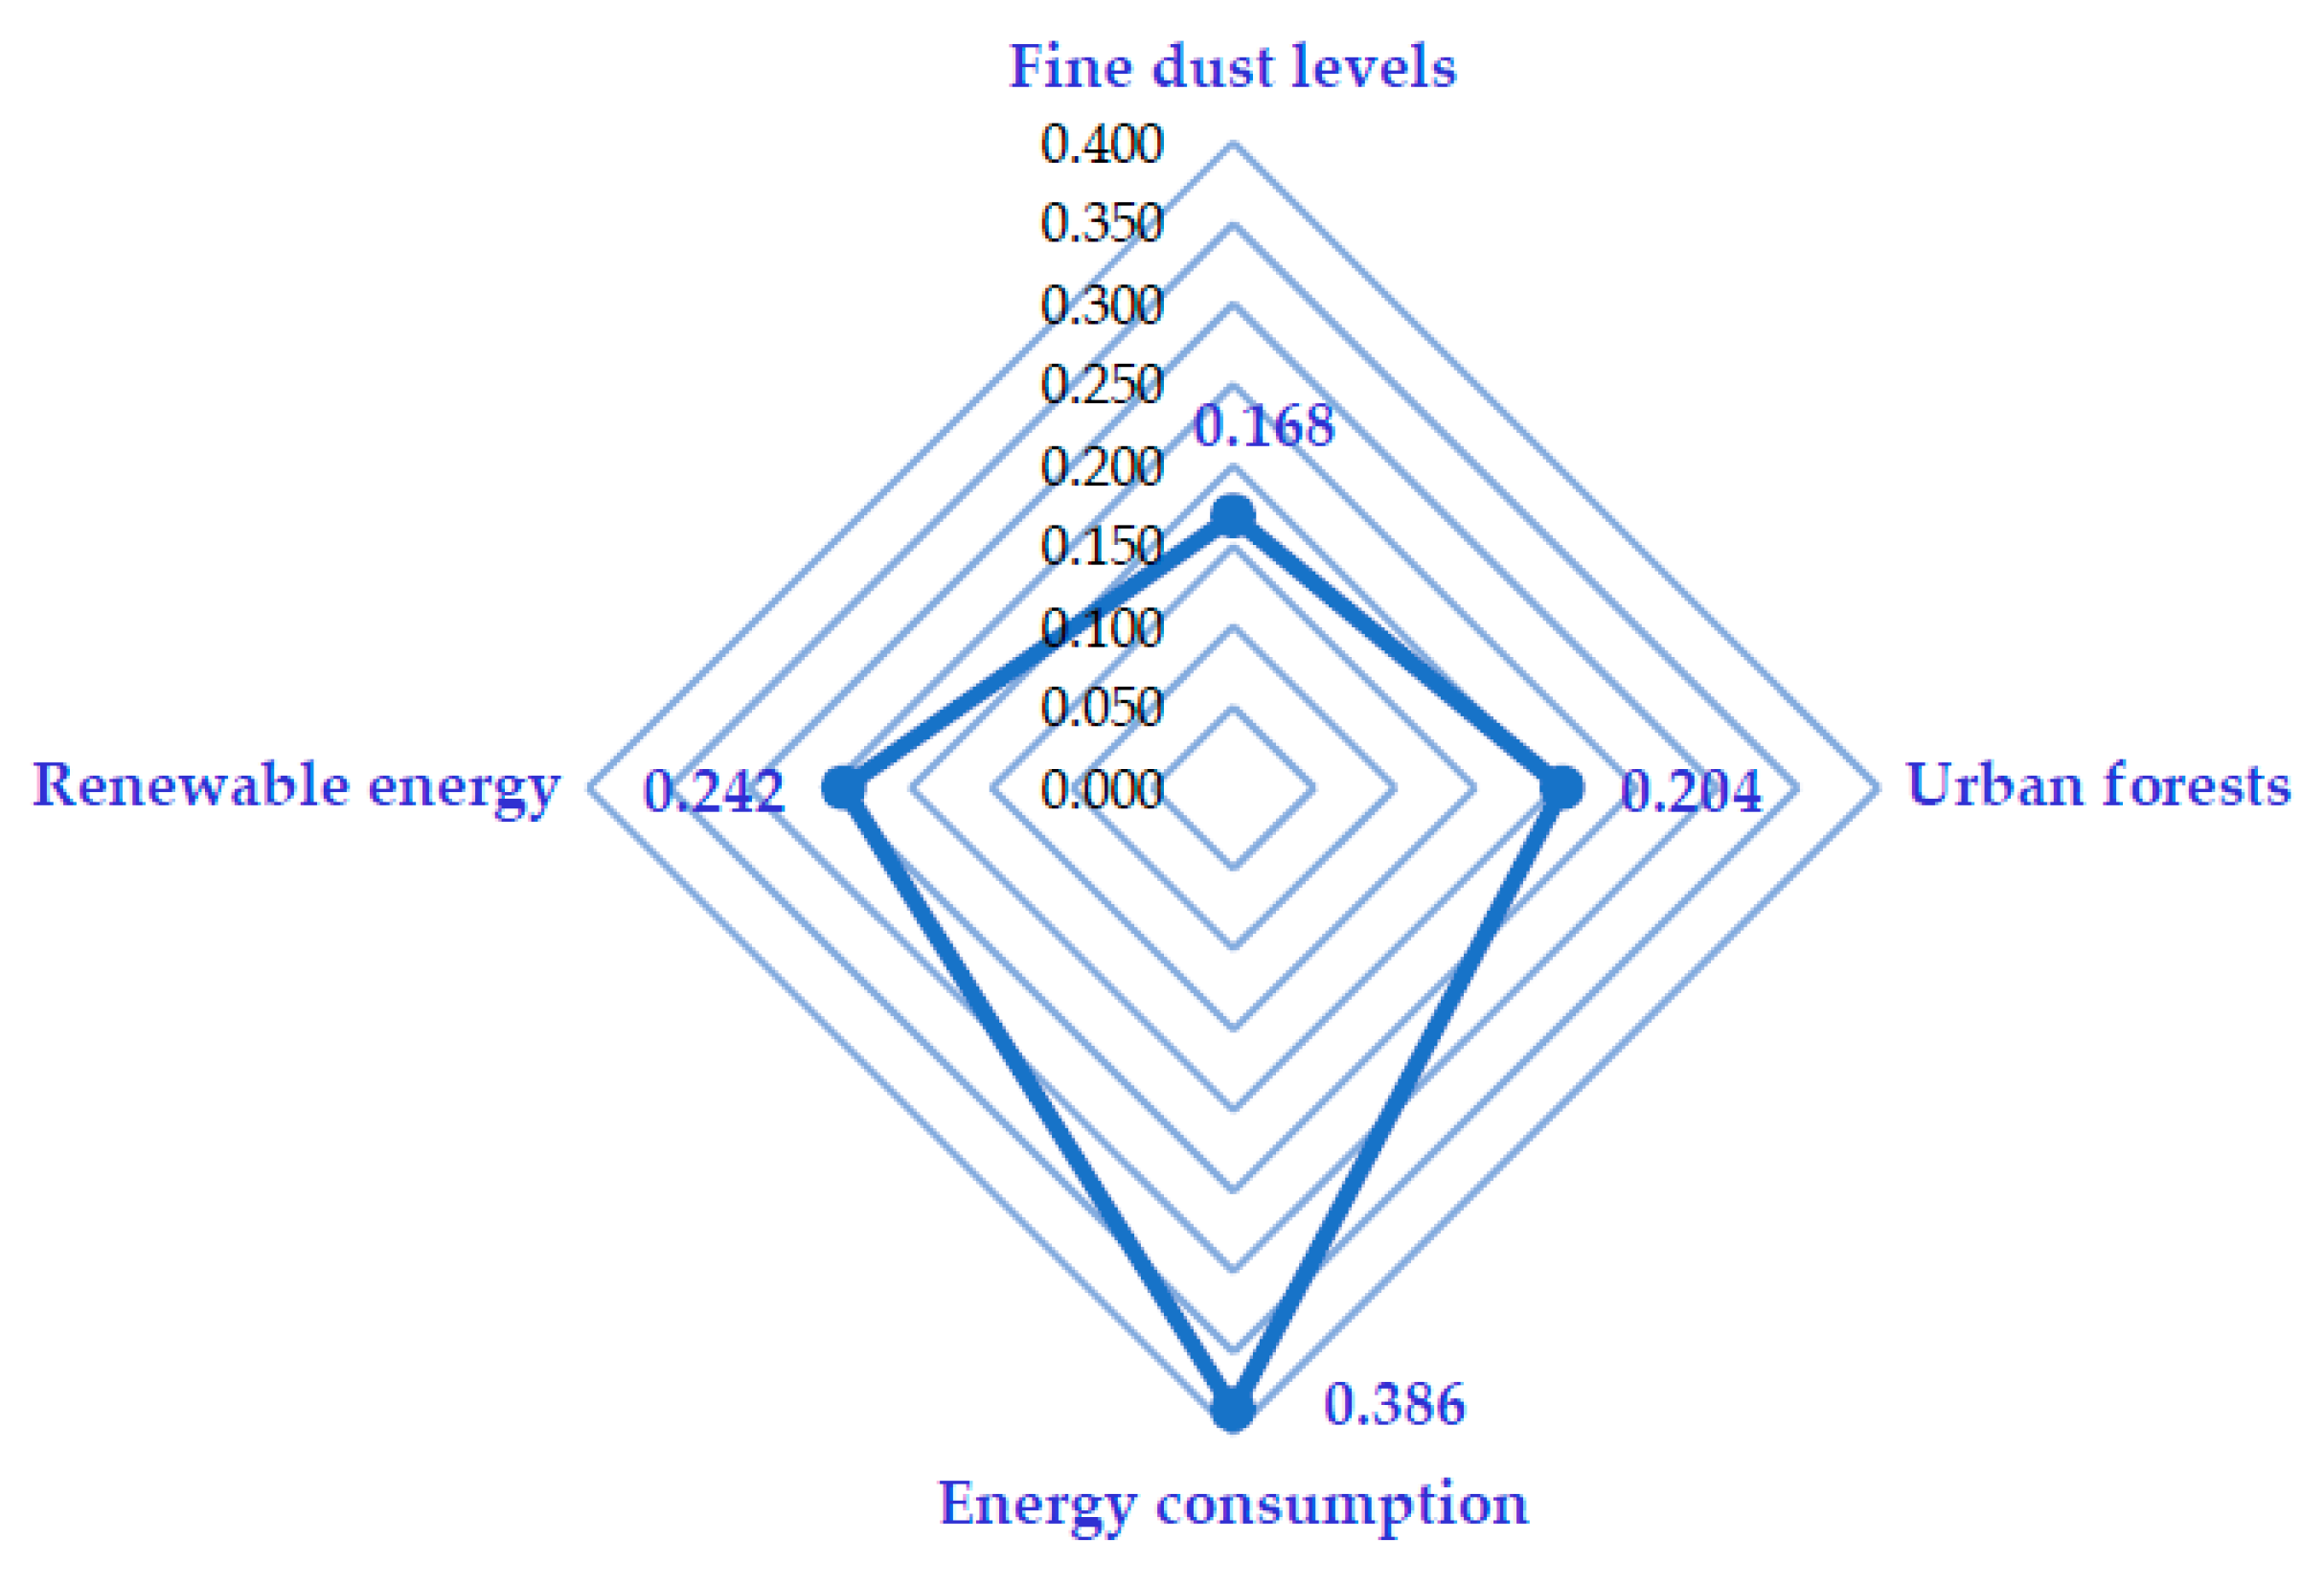
3.2.8. Air Quality and Energy
3.2.9. Urban Spaces and Tourism
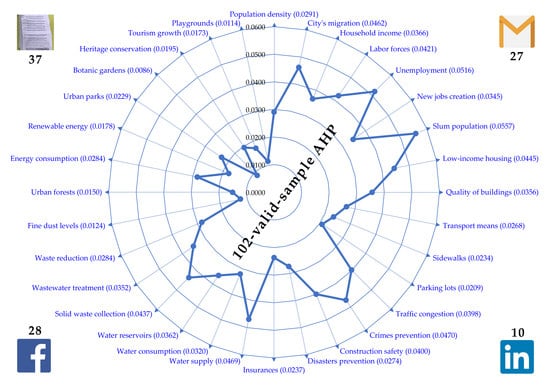
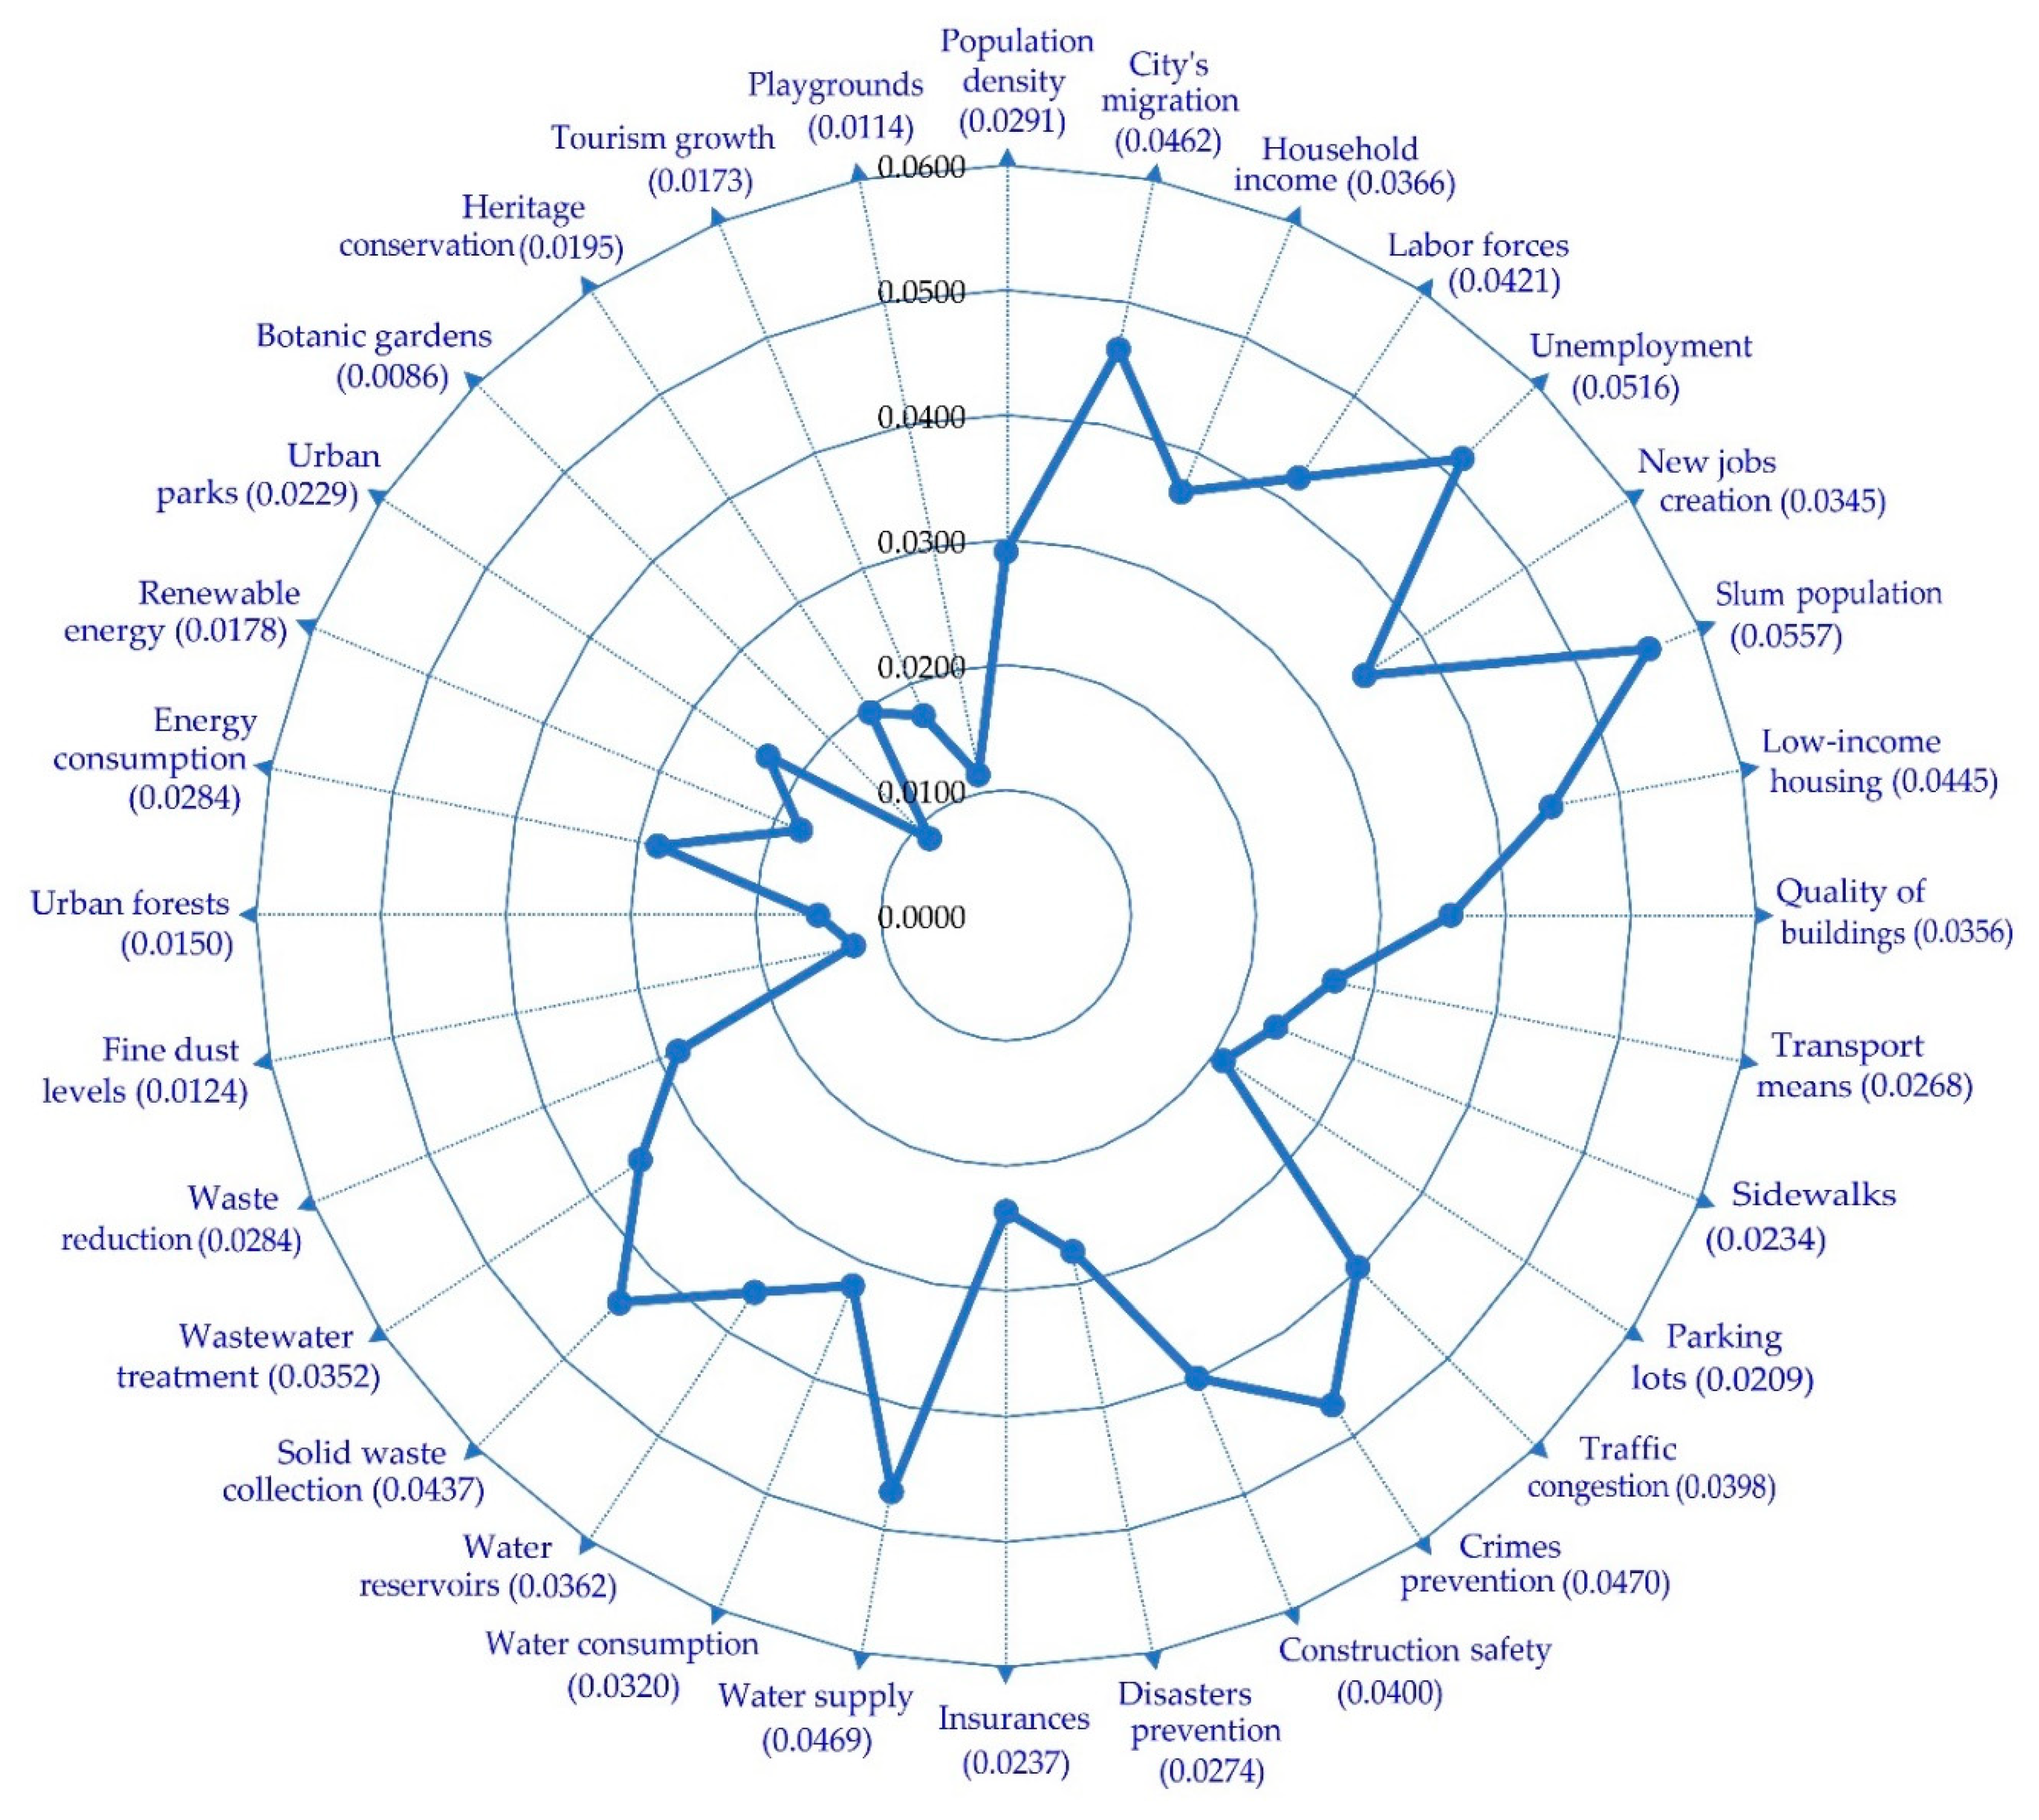
3.3. Priority Weights of All 32 Indicators
4. Discussion
5. Summary and Conclusions
Author Contributions
Funding
Acknowledgments
Conflicts of Interest
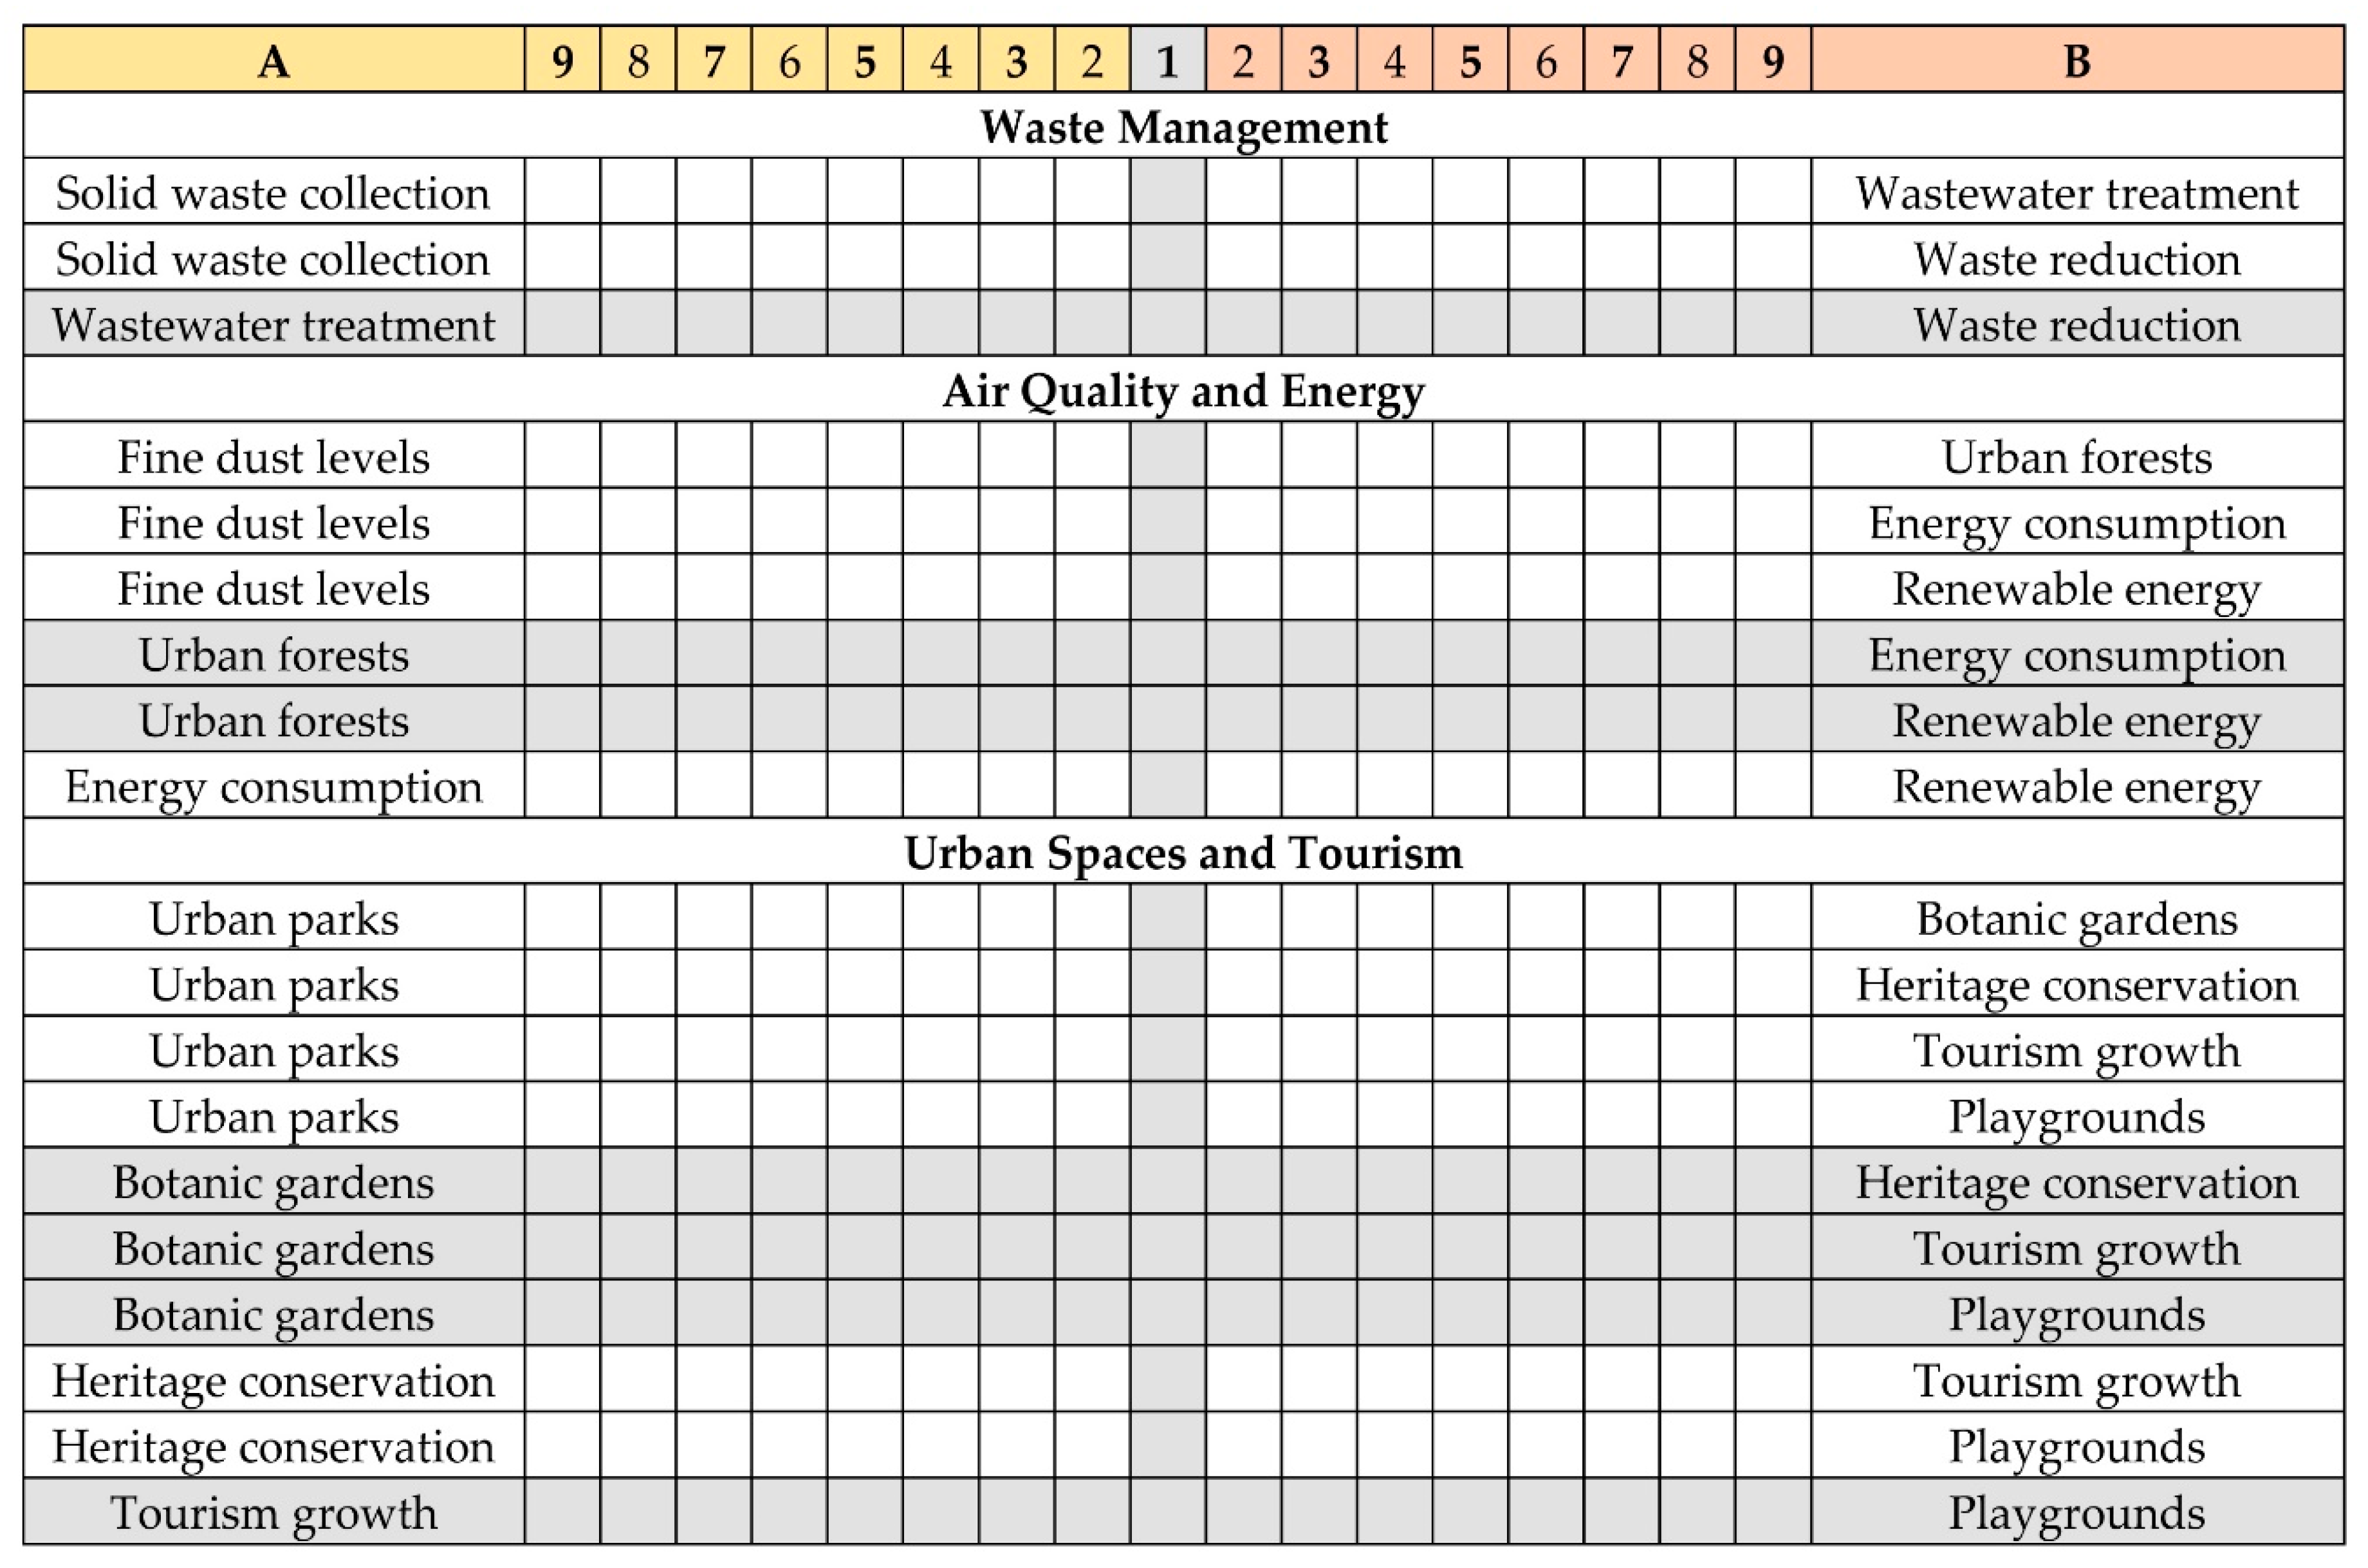
Appendix A. Relevant Indicators

| Category | Indicator | SDG11 | ESC | HAN | GC | CC |
|---|---|---|---|---|---|---|
| Demography | Population density | ● | ● | |||
| Population growth rate | ● | ● | ||||
| The ratio of land consumption rate to the population growth rate | ● | ● | ||||
| Birth rate | ● | |||||
| Active population (20–65) rate | ● | |||||
| Elderly population (over 65) rate | ● | |||||
| Jobs and Tourism | Labor force participation rate | ● | ||||
| Unemployment rate | ● | ● | ||||
| Absence or presence of shopping centers or shopping outlets within tourist areas | ● | |||||
| Absence or presence of local products in shopping centers within tourist areas | ● | |||||
| Tourism growth rate per year | ● | |||||
| Number of registered foreigners | ● | |||||
| Housing | Percentage of the population living in slums | ● | ● | |||
| Percentage of the population spending more than 30% of their income on housing costs | ● | |||||
| Number of low-income housing units | ● | |||||
| Percentage of population living in owned houses | ● | |||||
| Percentage of aging residential buildings | ● | |||||
| Transport | Percentage of population living within 0.5 km of public transport access | ● | ||||
| Percentage of people using large public transports | ● | |||||
| Public transport sharing rate | ● | |||||
| Investment in transports under the budget | ● | ● | ||||
| Number of taxi and bus | ● | |||||
| Proportion of environmentally friendly vehicles | ● | |||||
| Proportion of traffic congestion level (extra hours of travel time) | ● | ● | ||||
| Safety | Absence or presence of measures to prevent crimes | ● | ● | |||
| Number of people affected by crimes; number of crimes | ● | ● | ||||
| Number of affected people resulting from disasters | ● | |||||
| Number of damaged or destroyed houses | ● | ● | ||||
| Proportion of disaster prevention facilities (constructed dams, reservoirs, pumping stations etc.) | ● | ● | ● | |||
| Proportion of basic livelihood security | ● | |||||
| Clean Air and Energy | Fine dust level | ● | ● | ● | ||
| Number of days in a year that Pollutant Standards Index (PSI) exceeded 100 (unhealthy) using USEPA standard | ● | |||||
| Proportion of the city government’s efforts in greenhouse gas reduction | ● | ● | ||||
| The ratio of forest conservation areas to the total land area of the city | ● | |||||
| Percentage of gasoline- and diesel-fueled vehicles that meet city or national standards during roadside inspection | ● | |||||
| Percentage of industries that fulfill the requirement of national standards | ● | ● | ||||
| Types of alternative fuels used | ● | |||||
| Percentage of hotels using energy saving devices or renewable energy | ● | |||||
| Proportion of awareness campaigns on energy-saving techniques | ● | |||||
| Proportion of incentives for sustainable use of energy | ● | |||||
| Percentage of solar energy share in electricity supply | ● | |||||
| Number of buildings with solar PV installed | ● | |||||
| Number of green buildings in the city | ● | ● | ||||
| Waste Management | Percentage of solid waste regularly collected and recycled | ● | ● | ● | ● | ● |
| Percentage of reduction in total waste generated a year | ● | |||||
| Percentage of waste collected from door to door/collection point | ● | |||||
| Percentage of waste transported in covered vehicles on a daily basis | ● | |||||
| Percentage of households and industries linked to sewerage system | ● | |||||
| Percentage of households with secured sanitation systems | ● | |||||
| Proportion of wastewater treatment plants in the city | ● | |||||
| Water Use | Percentage of households with tap water that meets WHO drinking water standard | ● | ||||
| Percentage of school at all levels with water conservation education programs | ● | |||||
| Percentage of capacity of city in supplying water to meet average consumption | ● | |||||
| Percentage of available freshwater from ground and surface water extracted for use | ● | |||||
| Percentage of households with access to potable water infrastructure | ● | ● | ||||
| Public Space and Heritage | The ratio of public and green spaces compared to the total area of the city | ● | ● | ● | ||
| Frequency and time of maintaining and cleaning public and green spaces | ● | |||||
| Percentage of the area that complies with the stipulated spatial plan of the city | ● | ● | ||||
| Number of urban parks | ● | |||||
| Proportion of leisure areas in the city | ● | |||||
| Percentage of residents residing in public and green spaces accessible within 0.5 km | ● | |||||
| Percentage of conservation status given to historical and cultural areas | ● | ● | ||||
| Percentage of the budget provided to maintain the cultural and natural heritage | ● | ● |
Appendix B. AHP Questionnaires

Appendix C. A Consistent Sample Calculated by AHP-OS Program
Appendix C.1. Criteria

Appendix C.2. Indicators
Appendix C.2.1. Demography

Appendix C.2.2. Employment

Appendix C.2.3. Housing

Appendix C.2.4. Transport

Appendix C.2.5. Safety

Appendix C.2.6. Water Use

Appendix C.2.7. Waste Management

Appendix C.2.8. Air Quality and Energy

Appendix C.2.9. Urban Spaces and Tourism

References
- Chan, P.; Lee, M.-H. Developing sustainable city indicators for cambodia through Delphi Processes of panel surveys. Sustainability 2019, 11, 3166. [Google Scholar] [CrossRef]
- Sourani, A.; Sohail, M. The Delphi method: Review and use in construction management research. Int. J. Constr. Education Res. 2015, 11, 54–76. [Google Scholar] [CrossRef]
- Gupta, U.G.; Clarke, R.E. Theory and applications of the Delphi technique: A bibliography (1975–1994). J. Technol. Forecast. Soc. Chang. 1996, 53, 185–211. [Google Scholar] [CrossRef]
- Hinks, J.; McNay, P. The creation of a management-by-variance tool for facilities management performance assessment. Facilities 1999, 17, 31–53. [Google Scholar] [CrossRef]
- Bradley, L.; Stewart, K. A Delphi study of the drivers and inhibitors of Internet banking. Int. J. Bank Mark. 2002, 20, 250–260. [Google Scholar] [CrossRef]
- Padel, S.; Midmore, P. The development of the European market for organic products: Insights from a Delphi study. Br. Food J. 2005, 107, 626–647. [Google Scholar] [CrossRef]
- Bendaña, R.; del Caño, A.; de la Cruz, M.P. Contractor selection: Fuzzy control approach. Can. J. Civ. Eng. 2008, 35, 473–486. [Google Scholar] [CrossRef]
- Yeung, J.F.Y.; Chan, A.P.C.; Chan, D.W.M. Developing a performance index for relationship-based construction projects in Australia: Delphi study. J. Manag. Eng. 2009, 25, 59–68. [Google Scholar] [CrossRef]
- Lucko, G.; Rojas, E.M. Research validation: Challenges and opportunities in the construction domain. J. Constr. Eng. Manag. 2010, 136, 127–135. [Google Scholar] [CrossRef]
- United Nations—General Assembly. Transforming Our World: The 2030 Agenda for Sustainable Development; Resolution adopted by the General Assembly; United Nations: New York, NY, USA, 2015. [Google Scholar]
- Kumar, S.; Kumar, N.; Vivekadhish, S. Millennium development goals (MDGS) to sustainable development goals (SDGS): Addressing unfinished agenda and strengthening sustainable development and partnership. Ind. J. Community Med. 2016, 41, 1–4. [Google Scholar] [CrossRef]
- Battersby, J. MDGs to SDGs—New goals, same gaps: The continued absence of urban food security in the post-2015 global development agenda. J. Afr. Geogr. Rev. 2017, 36, 115–129. [Google Scholar] [CrossRef]
- WHO. Health in 2015: From Millennium Development Goals to Sustainable Development Goals. 2015. Available online: https://apps.who.int/iris/bitstream/handle/10665/200009/9789241565110_eng.pdf (accessed on 21 April 2019).
- Carl, D.; Clive, G. Doing biopolitics differently? Radical potential in the post-2015 MDG and SDG debates. Globalizations 2015, 12, 597–612. [Google Scholar]
- Li, L.; Shefali, O.; Dan, H.; Yue, C.; Jamie, P.; Jun, Z.; Joy, E.L.; Simon, C.; Colin, M.; Robert, E.B. Global, regional, and national causes of under-5 mortality in 2000–2015: An updated systematic analysis with implications for the sustainable development goals. Lancet 2016, 388, 3027–3035. [Google Scholar] [CrossRef]
- United Nations. About the Sustainable Development Goals (17 Goals). Available online: https://un.org/sustainabledevelopment/sustainable-development-goals/ (accessed on 11 January 2019).
- UN-Habitat. SDG Goal 11 Monitoring Framework. A Guide to Assist National and Local Governments to Monitor & Report on SDG 11 Indicators. 2016. Available online: https://unhabitat.org/wp-content/uploads/2016/02/SDG-Goal%2011%20Monitoring%20Framework%2025-02-16.pdf (accessed on 21 January 2019).
- ASEAN. ASEAN Cooperation on Environmentally Sustainable City (ESC). The Introduction. Available online: https://environment.asean.org (accessed on 21 January 2019).
- ASEAN. Annex C—Environmentally Sustainable City (ESC) Key Indicators. Available online: http://environment.asean.org/wp-content/uploads/2017/01/Key-Indicators_2017-Endorsed.pdf (accessed on 14 January 2019).
- Han, S.M. A Study on the Development and Application of Evaluation Indicators for Sustainable Urban Development and Management. Ph.D. Thesis, Hanyang University, Seoul, Korea, 2019. [Google Scholar]
- Han, S.M.; Lee, M.H. Analysis of Evaluation Indicators for the Development and Management of Sustainable and Resilient Cities: Focusing on the Goal 11 of UN Sustainable Developments Goals (SDGs). J. Korean Regional Dev. Assoc. 2017, 29, 1–24. [Google Scholar]
- NCSD; GGGI; ICEM. The Green City Strategic Planning Methodology. 2016. Available online: http://gggi.org/wp-content/uploads/2016/08/Annex-A-AAS1507-REP-006-Final-Green-city-strategic-planning-methodology.pdf (accessed on 14 January 2019).
- NCSD; GGGI; ICEM. The Phnom Penh Green City Strategic Plan 2017–2026 and List of Priority Green City Investment Projects for Phnom Penh; NCSD: Phnom Penh, Cambodia, 2016; pp. 11–13. [Google Scholar]
- Royal Government of Cambodia, NCCCA. Why Clean City Contest? Available online: http://www.cambodiacleancity.gov.kh/kh (accessed on 14 January 2019).
- Royal Government of Cambodia, NCCCA. The Action Plan 2011–2014. Available online: http://www.cambodiacleancity.gov.kh/kh/documents (accessed on 14 January 2019).
- Royal Government of Cambodia, NCCCA. The Clean City Standard. 2012. Available online: http://www.cambodiacleancity.gov.kh/kh/documents (accessed on 21 January 2019).
- Guarini, M.R.; Battisti, F.; Chiovitti, A. Public initiatives of settlement transformation: A theoretical-methodological approach to selecting tools of multi-criteria decision analysis. Buildings 2018, 8, 1. [Google Scholar] [CrossRef]
- Li, Y.; Thomas, M.A. A multiple criteria decision analysis (MCDA) software selection framework. In Proceedings of the 47th Hawaii International Conference on System Science (HICSS), Waikoloa, HI, USA, 6–9 January 2014; pp. 1084–1094. [Google Scholar]
- Guarini, M.R.; Battisti, F.; Chiovitti, A. A methodology for the selection of multi-criteria decision analysis methods in real estate and land management processes. Sustainability 2018, 10, 507. [Google Scholar] [CrossRef]
- Sepasgozar, S.M.E.; Davis, S. Construction technology adoption cube: An investigation on process, factors, barriers, drivers and decision makers using NVivo and AHP analysis. Buildings 2018, 8, 74. [Google Scholar] [CrossRef]
- Kaspar, R.; Ossadnik, W. Evaluation of AHP software from a management accounting perspective. J. Model. Manag. 2013, 8, 305–319. [Google Scholar]
- Baudry, G.; Macharis, C.; Vallée, T. Range-based multi-actor multi-criteria analysis: A combined method of multi-actor multi-criteria analysis and Monte Carlo simulation to support participatory decision making under uncertainty. Eur. J. Oper. Res. 2018, 264, 257–269. [Google Scholar] [CrossRef]
- Wang, J.-J.; Jing, Y.-Y.; Zhang, C.-F.; Zhao, J.-H. Review on multi-criteria decision analysis aid in sustainable energy decision-making. Renew. Sustain. Energy Rev. 2009, 13, 2263–2278. [Google Scholar] [CrossRef]
- Ribeiro, F.; Ferreira, P.; Araújo, M. Evaluating future scenarios for the power generation sector using a multi-criteria decision analysis (MCDA) tool: The Portuguese case. J. Energy 2013, 52, 126–136. [Google Scholar] [CrossRef]
- Shen, Y.C.; Grace, T.R.L.; Tzeng, G.H. Combined DEMATEL techniques with novel MCDM for the organic light emitting diode technology selection. J. Expert Syst. Appl. 2011, 38, 1468–1481. [Google Scholar] [CrossRef]
- Goepel, K.D. Implementation of an online software tool for the analytic hierarchy process (AHP-OS). Int. J. Anal. Hierarchy Process 2018, 10, 469–487. [Google Scholar]
- Lee, J.H. Assessment of the Development of the Market Utilizing Traditional AHP. Ph.D. Thesis, Hanyang University, Seoul, Korea, 2016. [Google Scholar]
- Kim, S.J. A Study on the Risk Factor of Global Procurement Project by Using AHP Method. Ph.D. Thesis, Hanyang University, Seoul, Korea, 2015. [Google Scholar]
- Cho, H.I. A Study on Risk Factors of PPI Projects Using Analytic Hierarchy Process. Ph.D. Thesis, Hanyang University, Seoul, Korea, 2008. [Google Scholar]
- Kim, J.J. Importance Analysis of Obstacle Factors on the CM at Risk Project Using AHP Method. Ph.D. Thesis, Hanyang University, Seoul, Korea, 2018. [Google Scholar]
- Lee, H.J. A Study on Deduction of Planning Indicators and AHP for Development Plan of Industrial Complex: Focusing on Industrial Complex in Gyeonggi Province. Ph.D. Thesis, Hanyang University, Seoul, Korea, 2013. [Google Scholar]
- Kim, B.H. A Case Study on Determining Process Improvement Priorities in a 3PL Company Using the Analytic Hierarch Process. Ph.D. Thesis, Hanyang University, Seoul, Korea, 2013. [Google Scholar]
- Kim, K.S. Analysis of Priority for Certification Criteria of Environment-friendly Building by AHP. Ph.D. Thesis, Hanyang University, Seoul, Korea, 2019. [Google Scholar]
- Oh, T.J. Analyzing the Importance of Change Orders in Apartment Projects Using AHP. Ph.D. Thesis, Hanyang University, Seoul, Korea, 2015. [Google Scholar]
- Lee, D.J. Evaluation of Urban Growth Management in Metropolis of Korea. Ph.D. Thesis, Hanyang University, Seoul, Korea, 2015. [Google Scholar]
- Han, S.M.; Lee, M.H. Application of Evaluation Index for Urban Sustainability and Resilience: Focused on the Goal 11 of UN Sustainable Development Goals (SDGs). J. Korea Real Estate Manag. Res. 2019, 29, 7–27. [Google Scholar]
- Nam, K.J. By Using AHP, Analysis for Importance of Visiting Factors about Integrated Resort. Ph.D. Thesis, Hanyang University, Seoul, Korea, 2018. [Google Scholar]
- Saaty, T.L. A scaling method for priorities in hierarchical structures. J. Math. Psychol. 1977, 15, 234–281. [Google Scholar] [CrossRef]
- Saaty, T.L. The Analytical Hierarchy Process—What it is and how it is used. Math. Modell. 1987, 9, 161–176. [Google Scholar] [CrossRef]
- Saaty, T.L. Decision making with the analytic hierarchy process. Int. J. Serv. Sci. 2008, 1, 83–98. [Google Scholar] [CrossRef]
- Rimba, A.B.; Setiawati, M.D.; Sambah, A.B.; Miura, F. Physical Flood Vulnerability Mapping Applying Geospatial Techniques in Okazaki City, Aichi Prefecture, Japan. Urban Sci. 2017, 1, 7. [Google Scholar] [CrossRef]
- Cappai, F.; Forgues, D.; Glaus, M. The Integration of Socio-Economic Indicators in the CASBEE-UD Evaluation System: A Case Study. Urban Sci. 2018, 2, 28. [Google Scholar] [CrossRef]
- AHP Online System—AHP-OS: Multi-criteria Decision Making Using the Analytic Hierarchy Process. Available online: https://bpmsg.com/ahp/ (accessed on 17 August 2019).
- AHP Online System—AHP-OS: AHP Priority Calculator. Available online: https://bpmsg.com/ahp/ahp-calc.php (accessed on 17 August 2019).
- Goepel, K.D. Implementation of an Online Software Tool for the Analytic Hierarchy Process: Challenges and Practical Experiences. Available online: https://bpmsg.com/wordpress/wp-content/uploads/2017/09/ahp-software.pdf (accessed on 17 August 2019).


| Criteria | Indicator | Description |
|---|---|---|
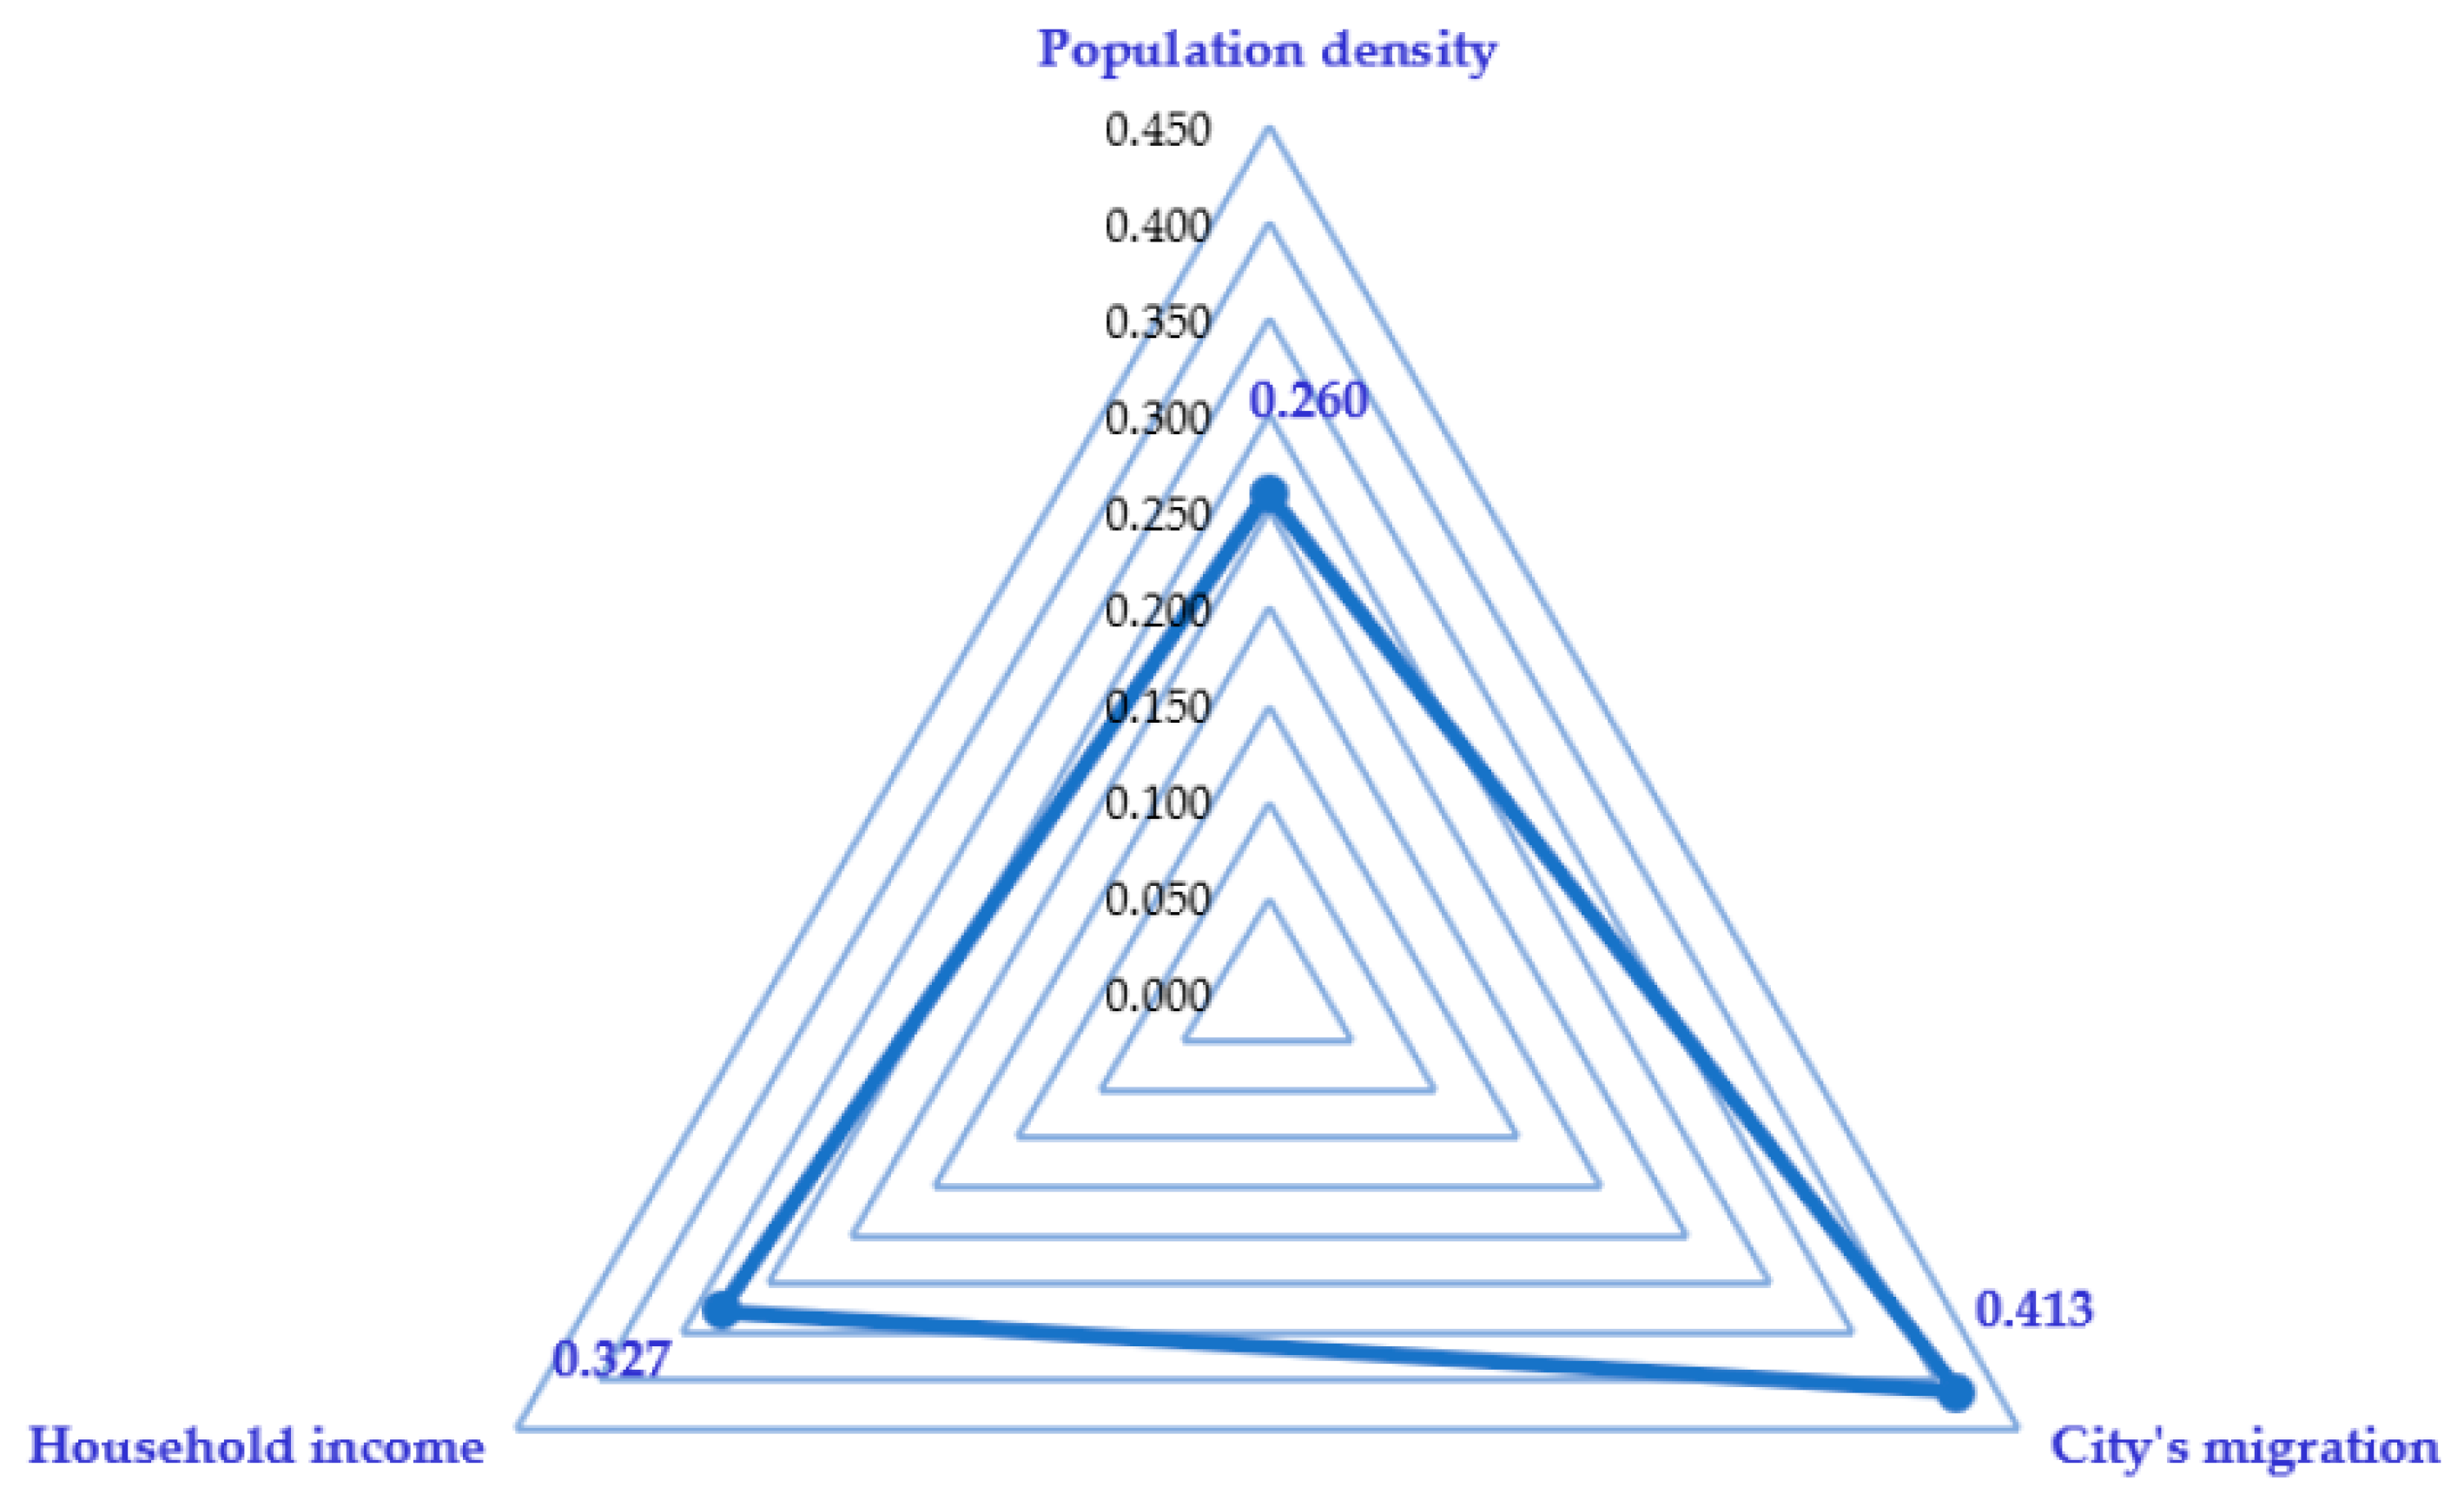
| Demography | Population density | This indicator assesses the living spaces in the city. It measures through the density of population per square kilometer. |
| City’s migration | This indicator assesses the migration situation in the city. It measures through the rural-urban migration rate in a year. | |
| Household income | This indicator assesses the economic conditions of households living in the city. It measures through the income of households. | |
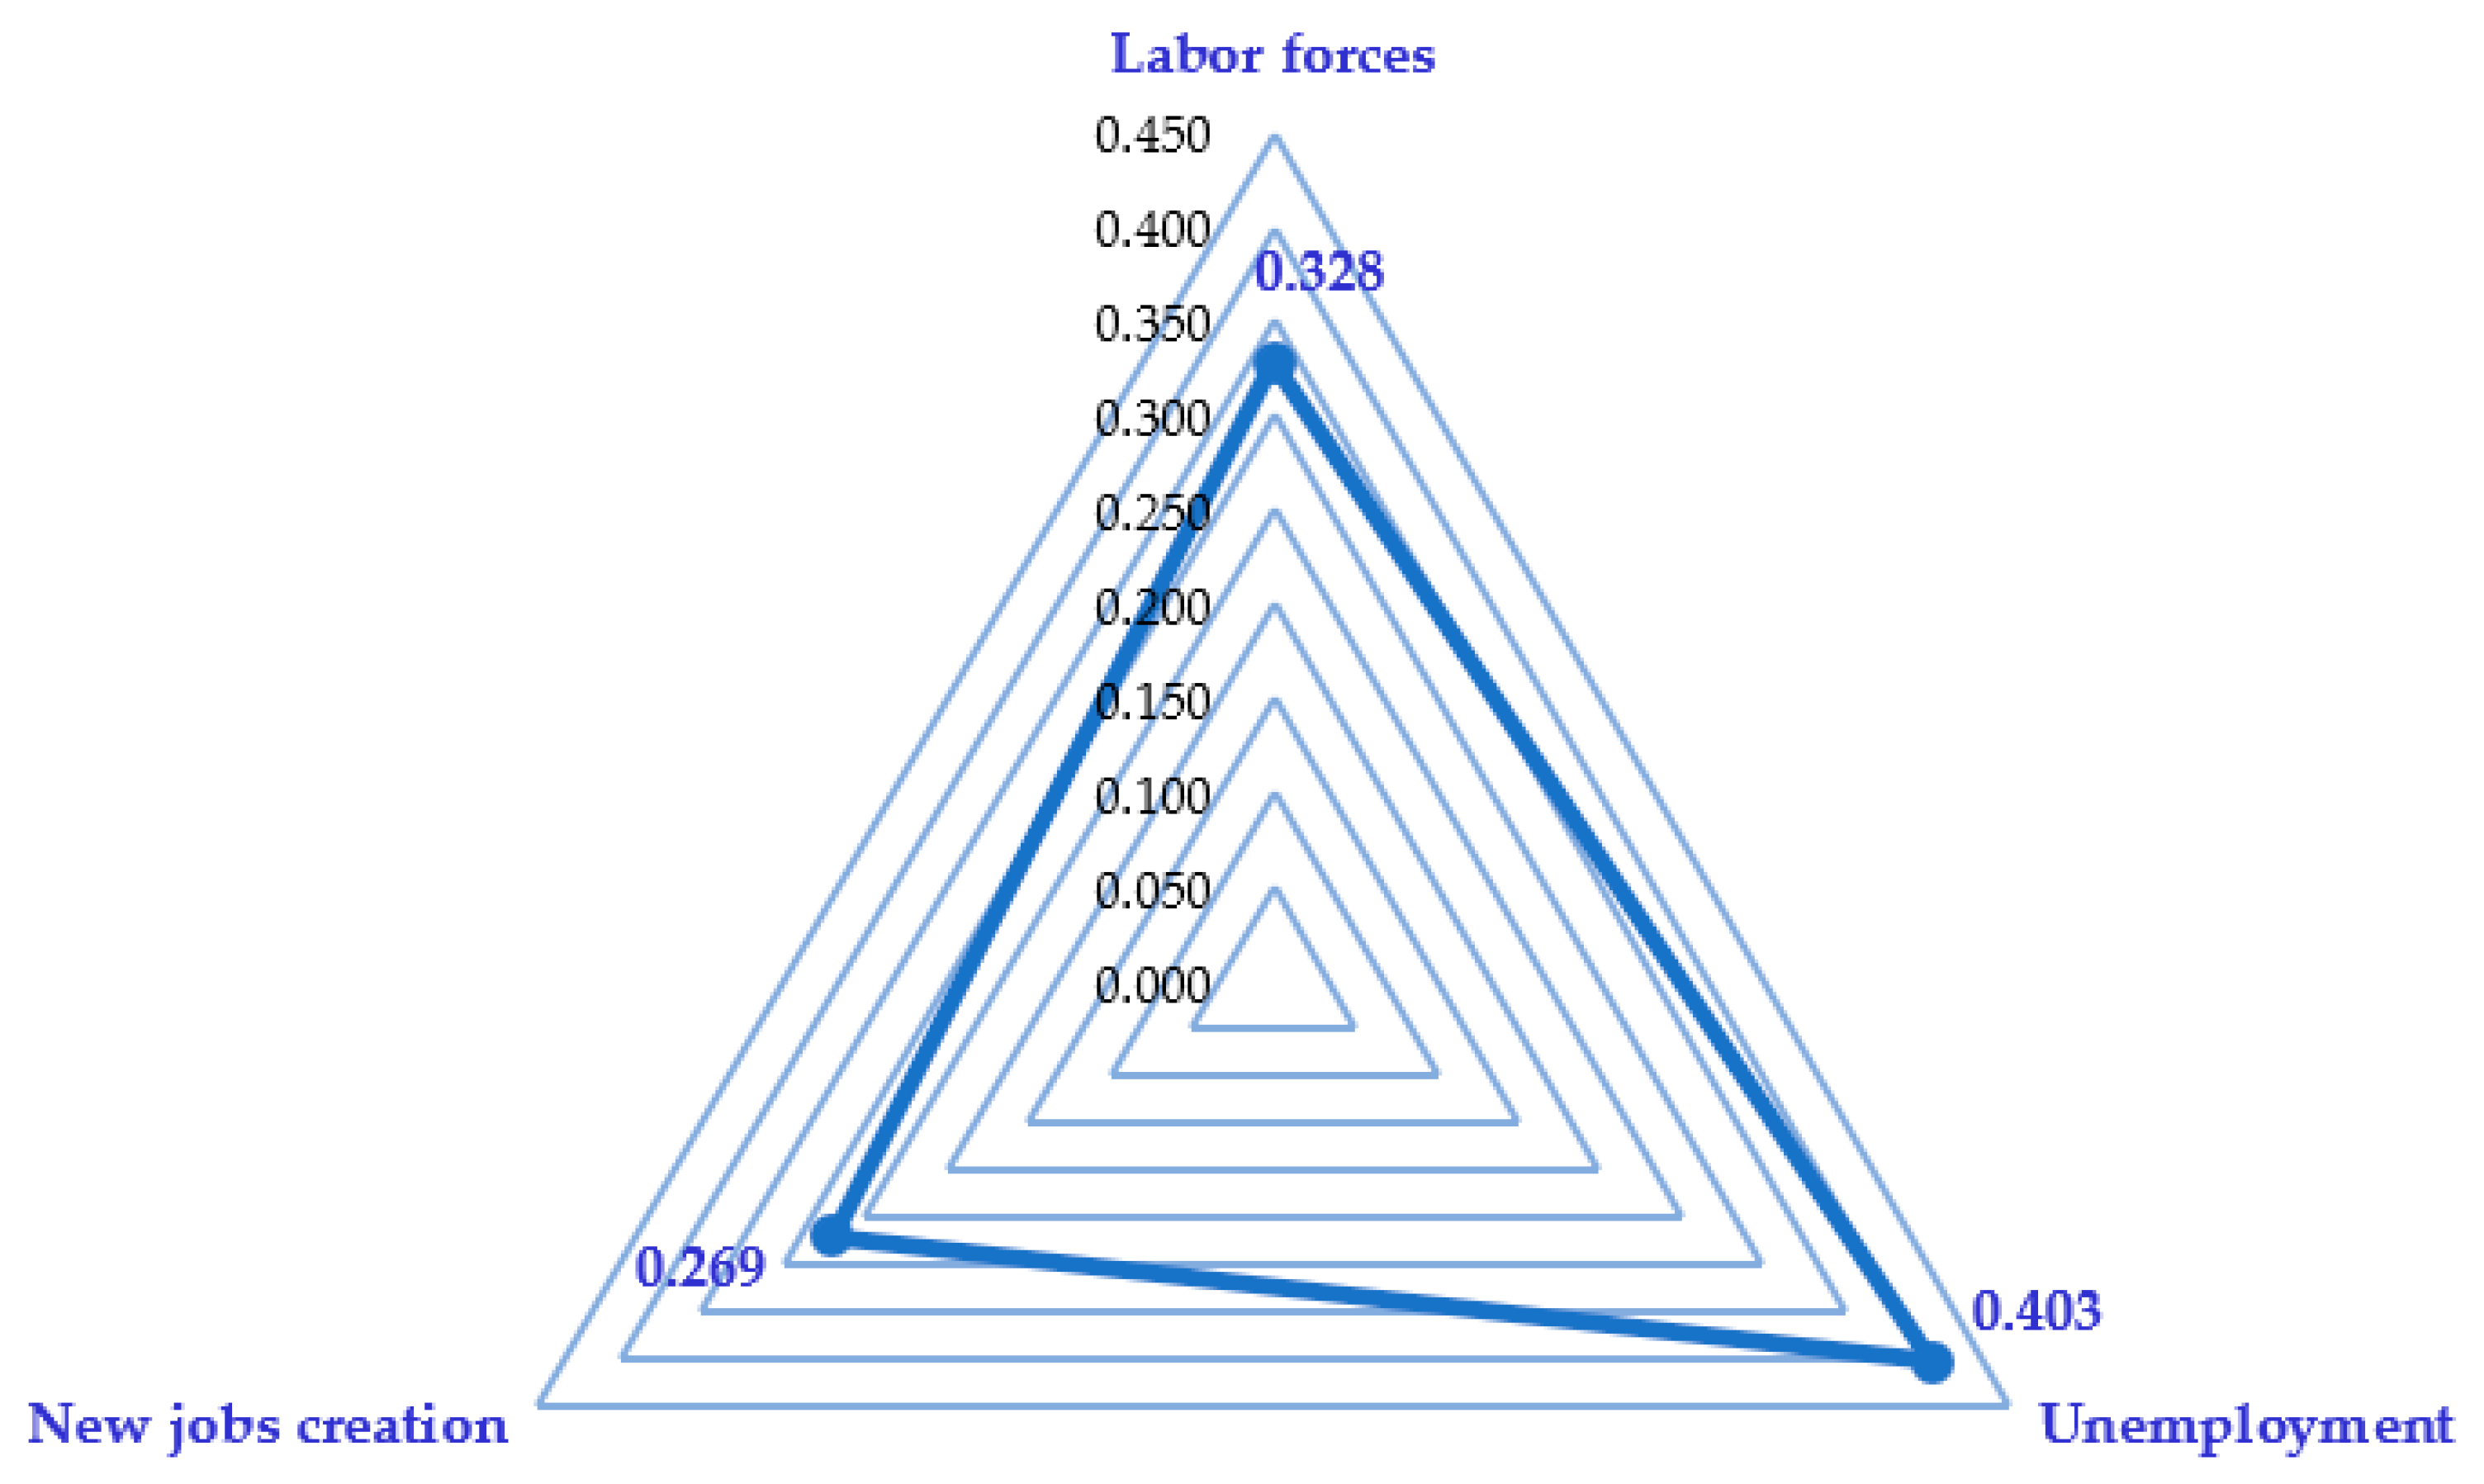
| Employment | Labor forces | This indicator assesses the productivity of the city. It measures through the productive population in the labor forces. |
| Unemployment | This indicator assesses the employment situation in the city. It measures through the unemployment rate. | |
| New jobs creation | This indicator assesses the city government’s efforts in creating new jobs towards reducing the unemployment rate. It measures through the number, type, and size of new jobs created per year. | |
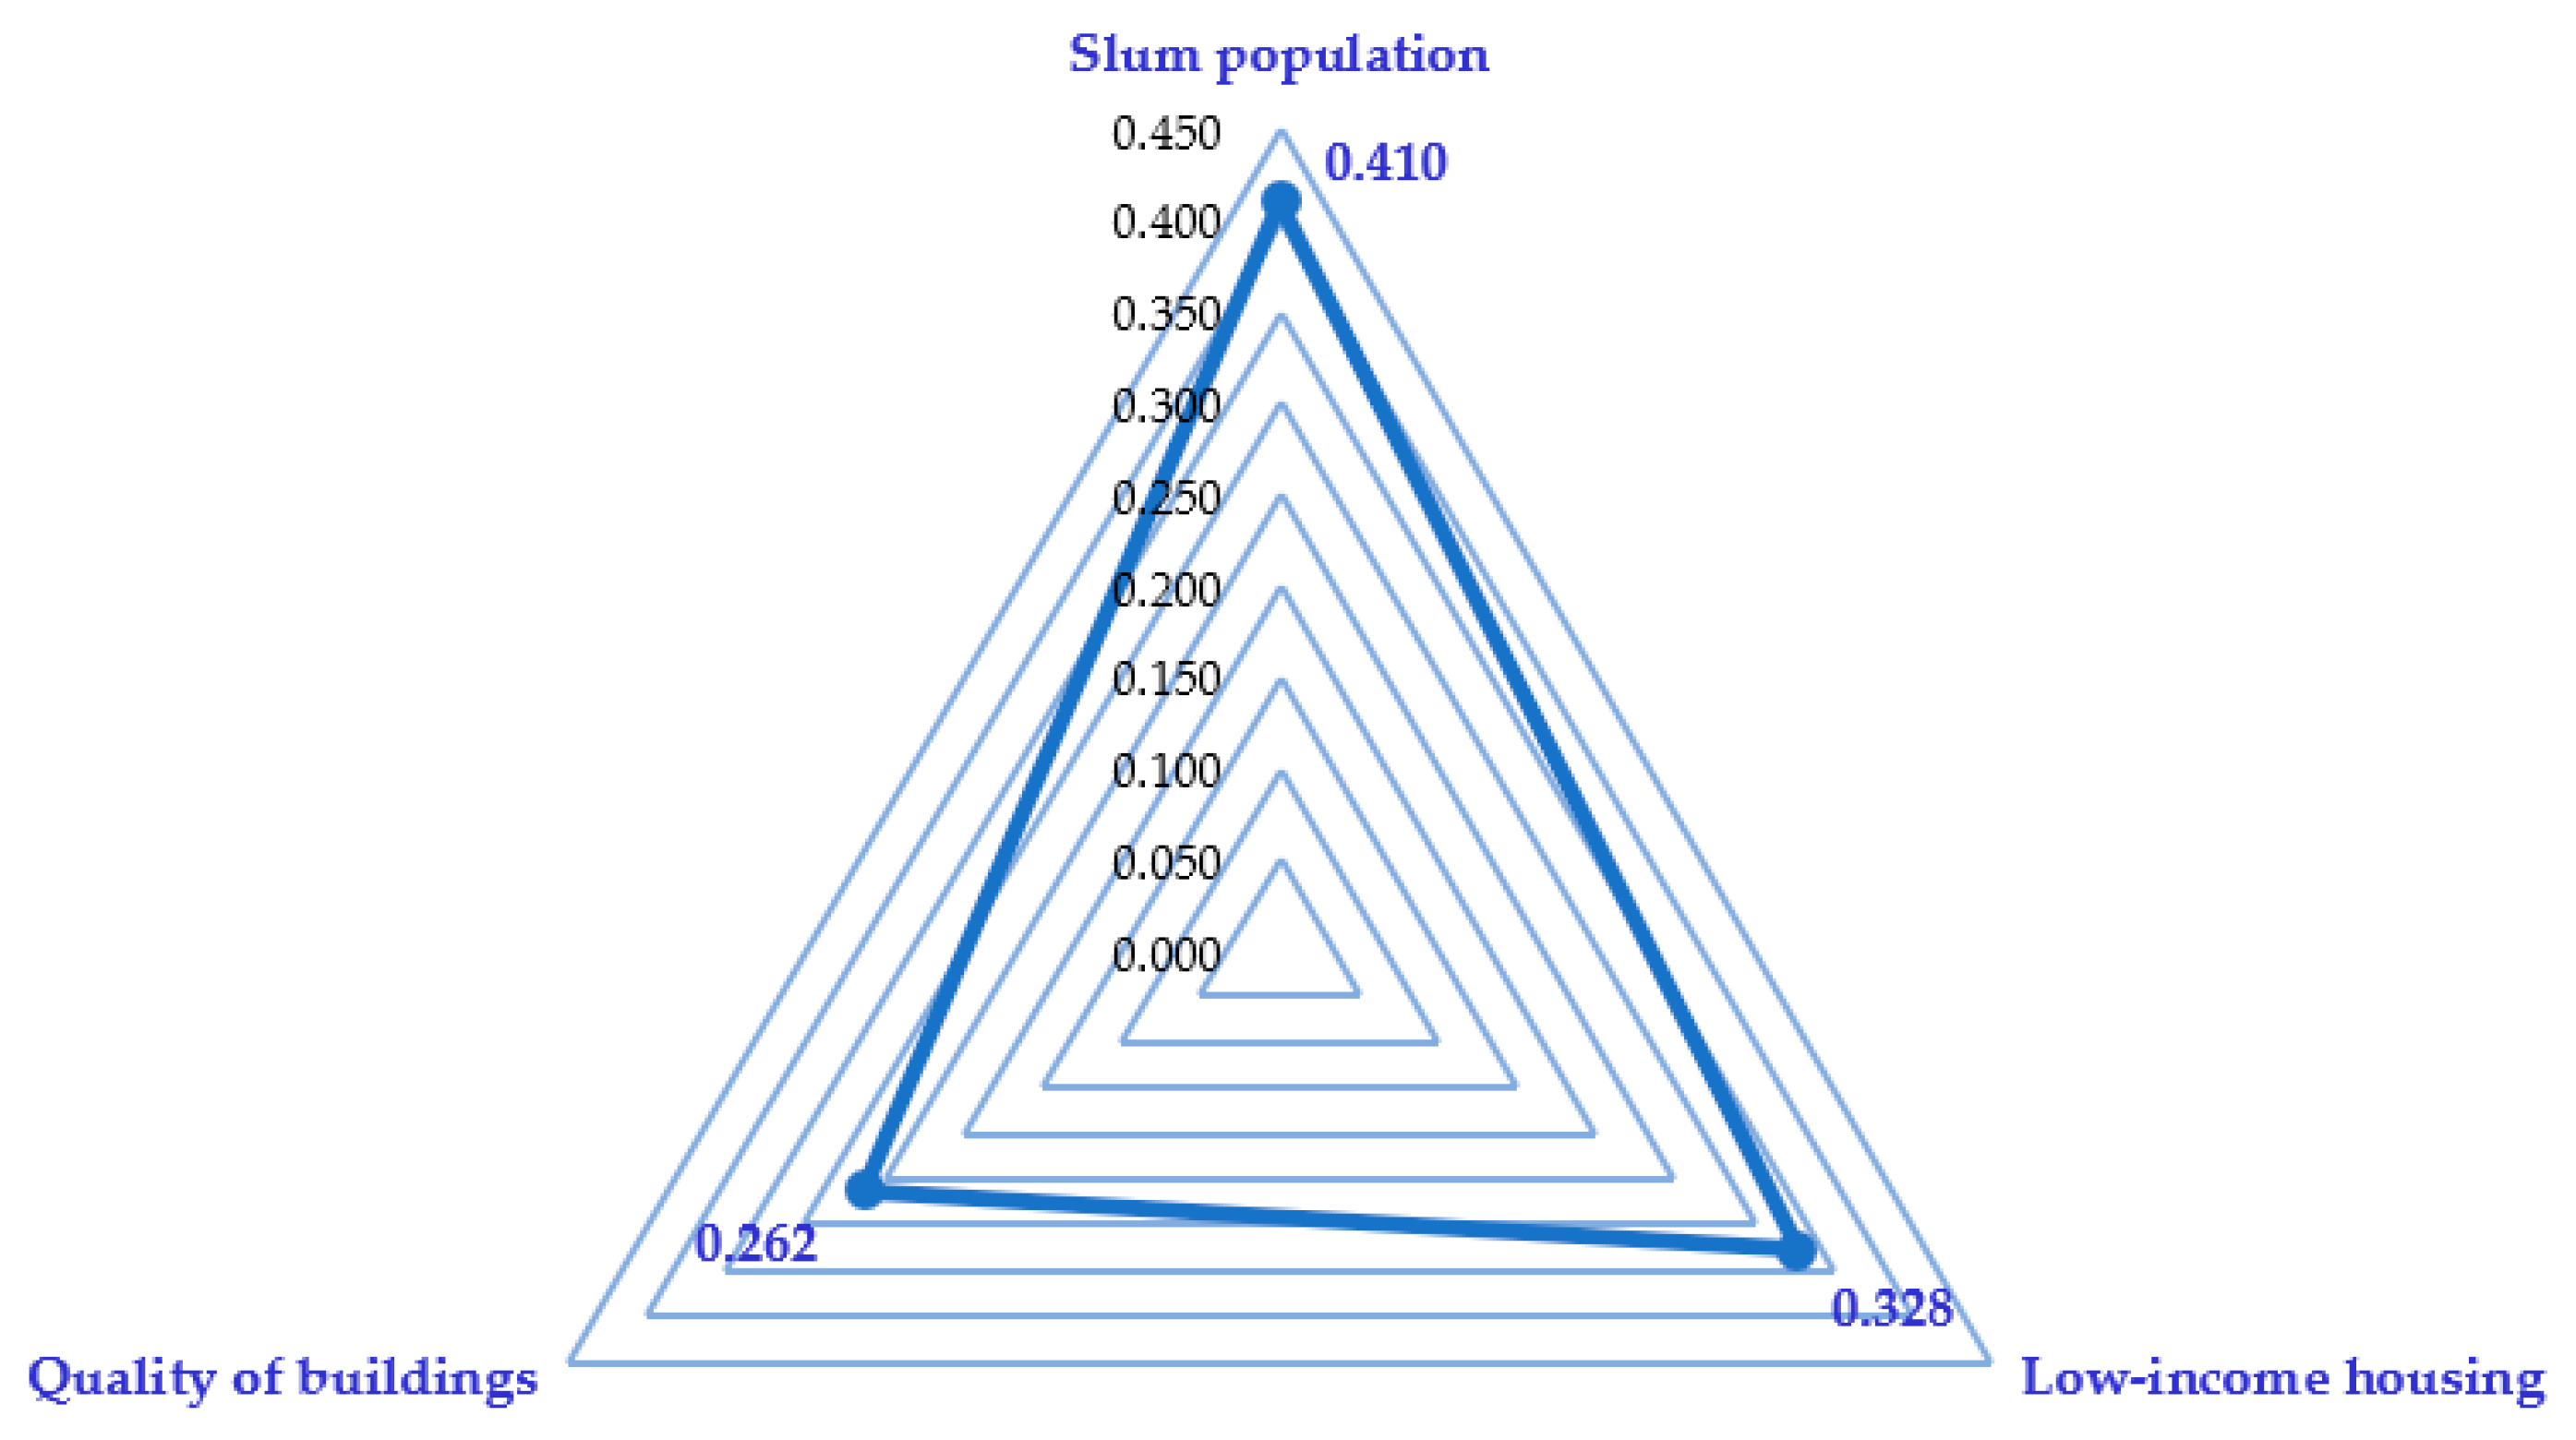
| Housing | Slum population | This indicator assesses the residential and living environment in the city. It measures through a percentage of the population living in slums or informal/unplanned settlements. |
| Low-income housing | This indicator assesses the city government’s efforts in providing affordable housing. It measures through the number, type, and size of the low-income housing development projects. | |
| Quality of buildings | This indicator assesses the quality of buildings in the city focused on residential buildings. It measures through the percentage of the new residential buildings (aged less than 30 years). | |
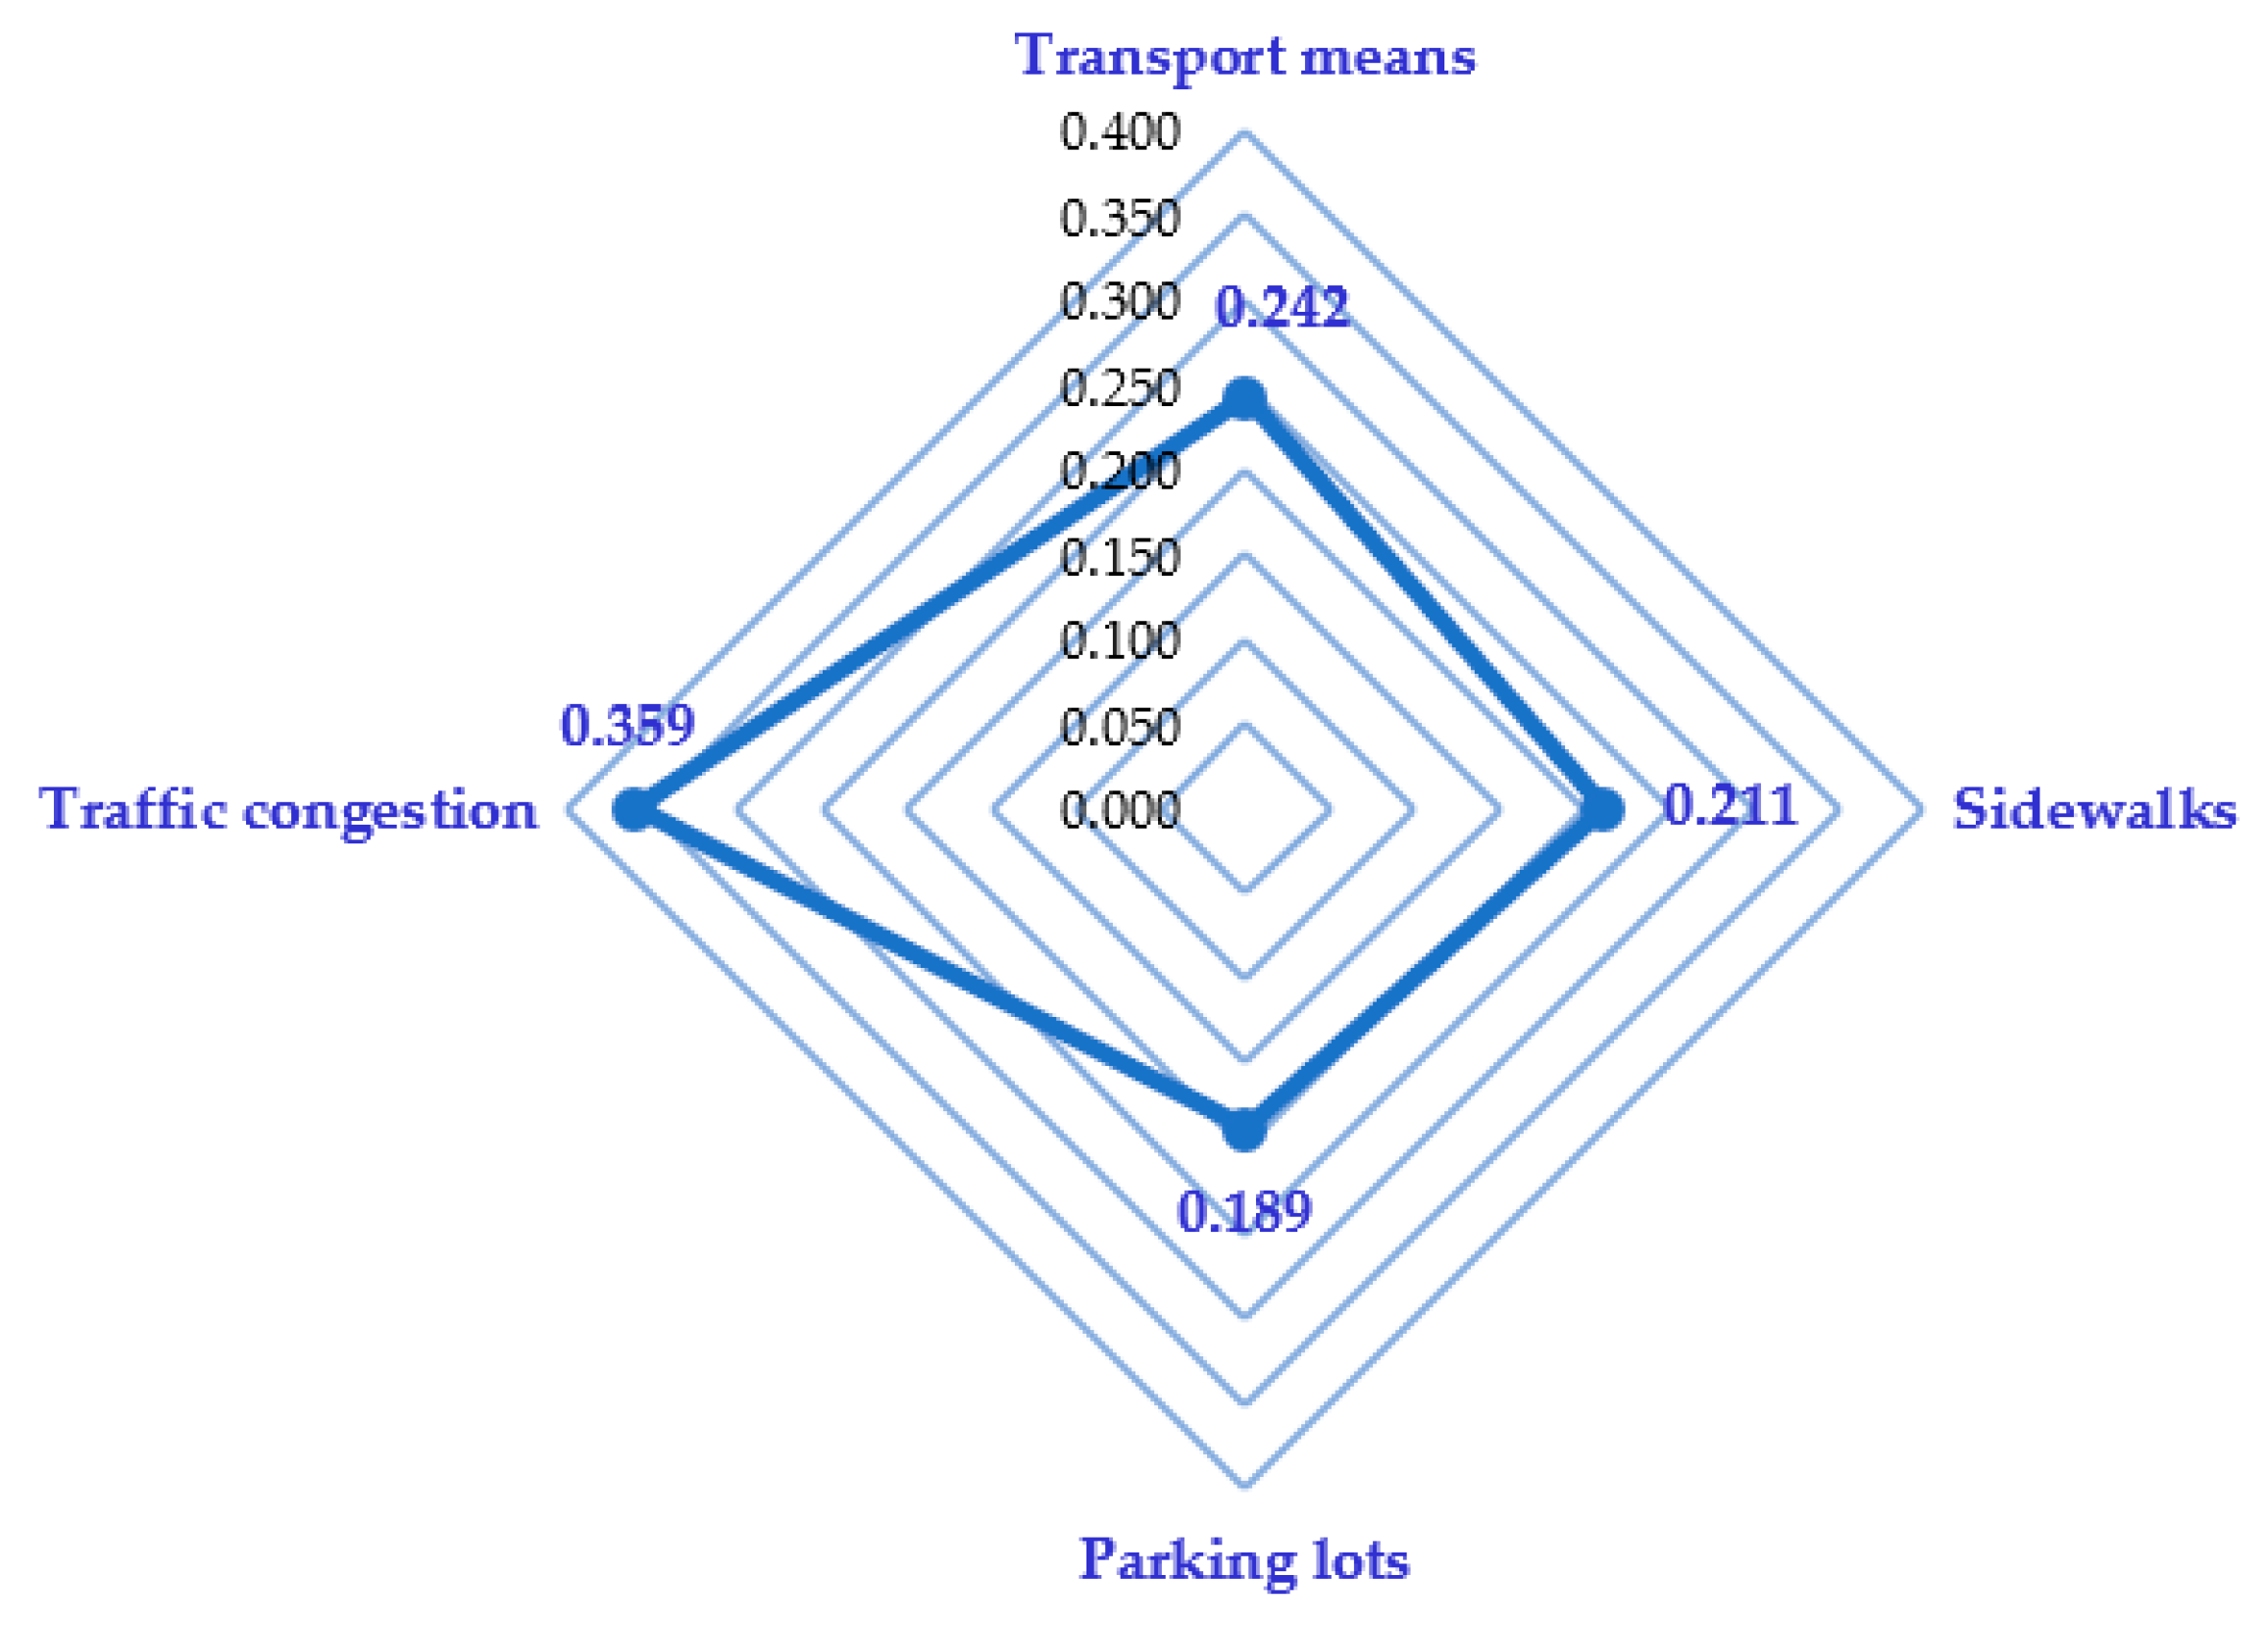
| Transport | Transport means | This indicator assesses the public transport sharing rate in the city. It measures through a percentage of public transport means compared to total transport means in the city. |
| Sidewalks | This indicator assesses the city government’s efforts in improving sidewalks for pedestrians. It measures through the number, type, size of initiated programs or activities for improving sidewalks. | |
| Parking lots | This indicator assesses the parking situation in the city, including the city’s government efforts in improving public parking lots. It measures through the number, type, and size of parking lots and improvement initiatives of the city government. | |
| Traffic congestion | This indicator assesses the city government’s efforts in reducing traffic congestion. It measures through the number, type, and size of initiated programs or activities for reducing traffic congestion. | |
| Safety | Crime prevention | This indicator assesses the city government’s efforts in preventing crimes in the city. It measures through the number and type of measures or initiatives of the city government to prevent crimes. |
| Construction safety | This indicator assesses the city government’s efforts in preventing construction risks. It measures through the number and type of initiated programs or activities to prevent construction risks. | |
| Disaster prevention | This indicator assesses the prevention facilities of the city’s government to prevent disasters. It measures through the number, type, and size of existing disaster prevention facilities. | |
| Insurances | This indicator assesses the social welfare situation in the city. It measures through a percentage of the population registered in the insurance system compared to the total population in the city. | |
| Water Use | Water supply | This indicator assesses the situation of water supply in the city. It measures through a percentage of households with access to potable water supply infrastructure compared to total households. |
| Water consumption | This indicator assesses the situation of water consumption in the city. It measures through an average amount of water consumed by a person or household daily, weekly, or monthly. | |
| Water reservoirs | This indicator assesses the situation of freshwater supply sources in the city. It measures through the number, type, and size of natural or artificial reservoirs in or nearby the city. | |
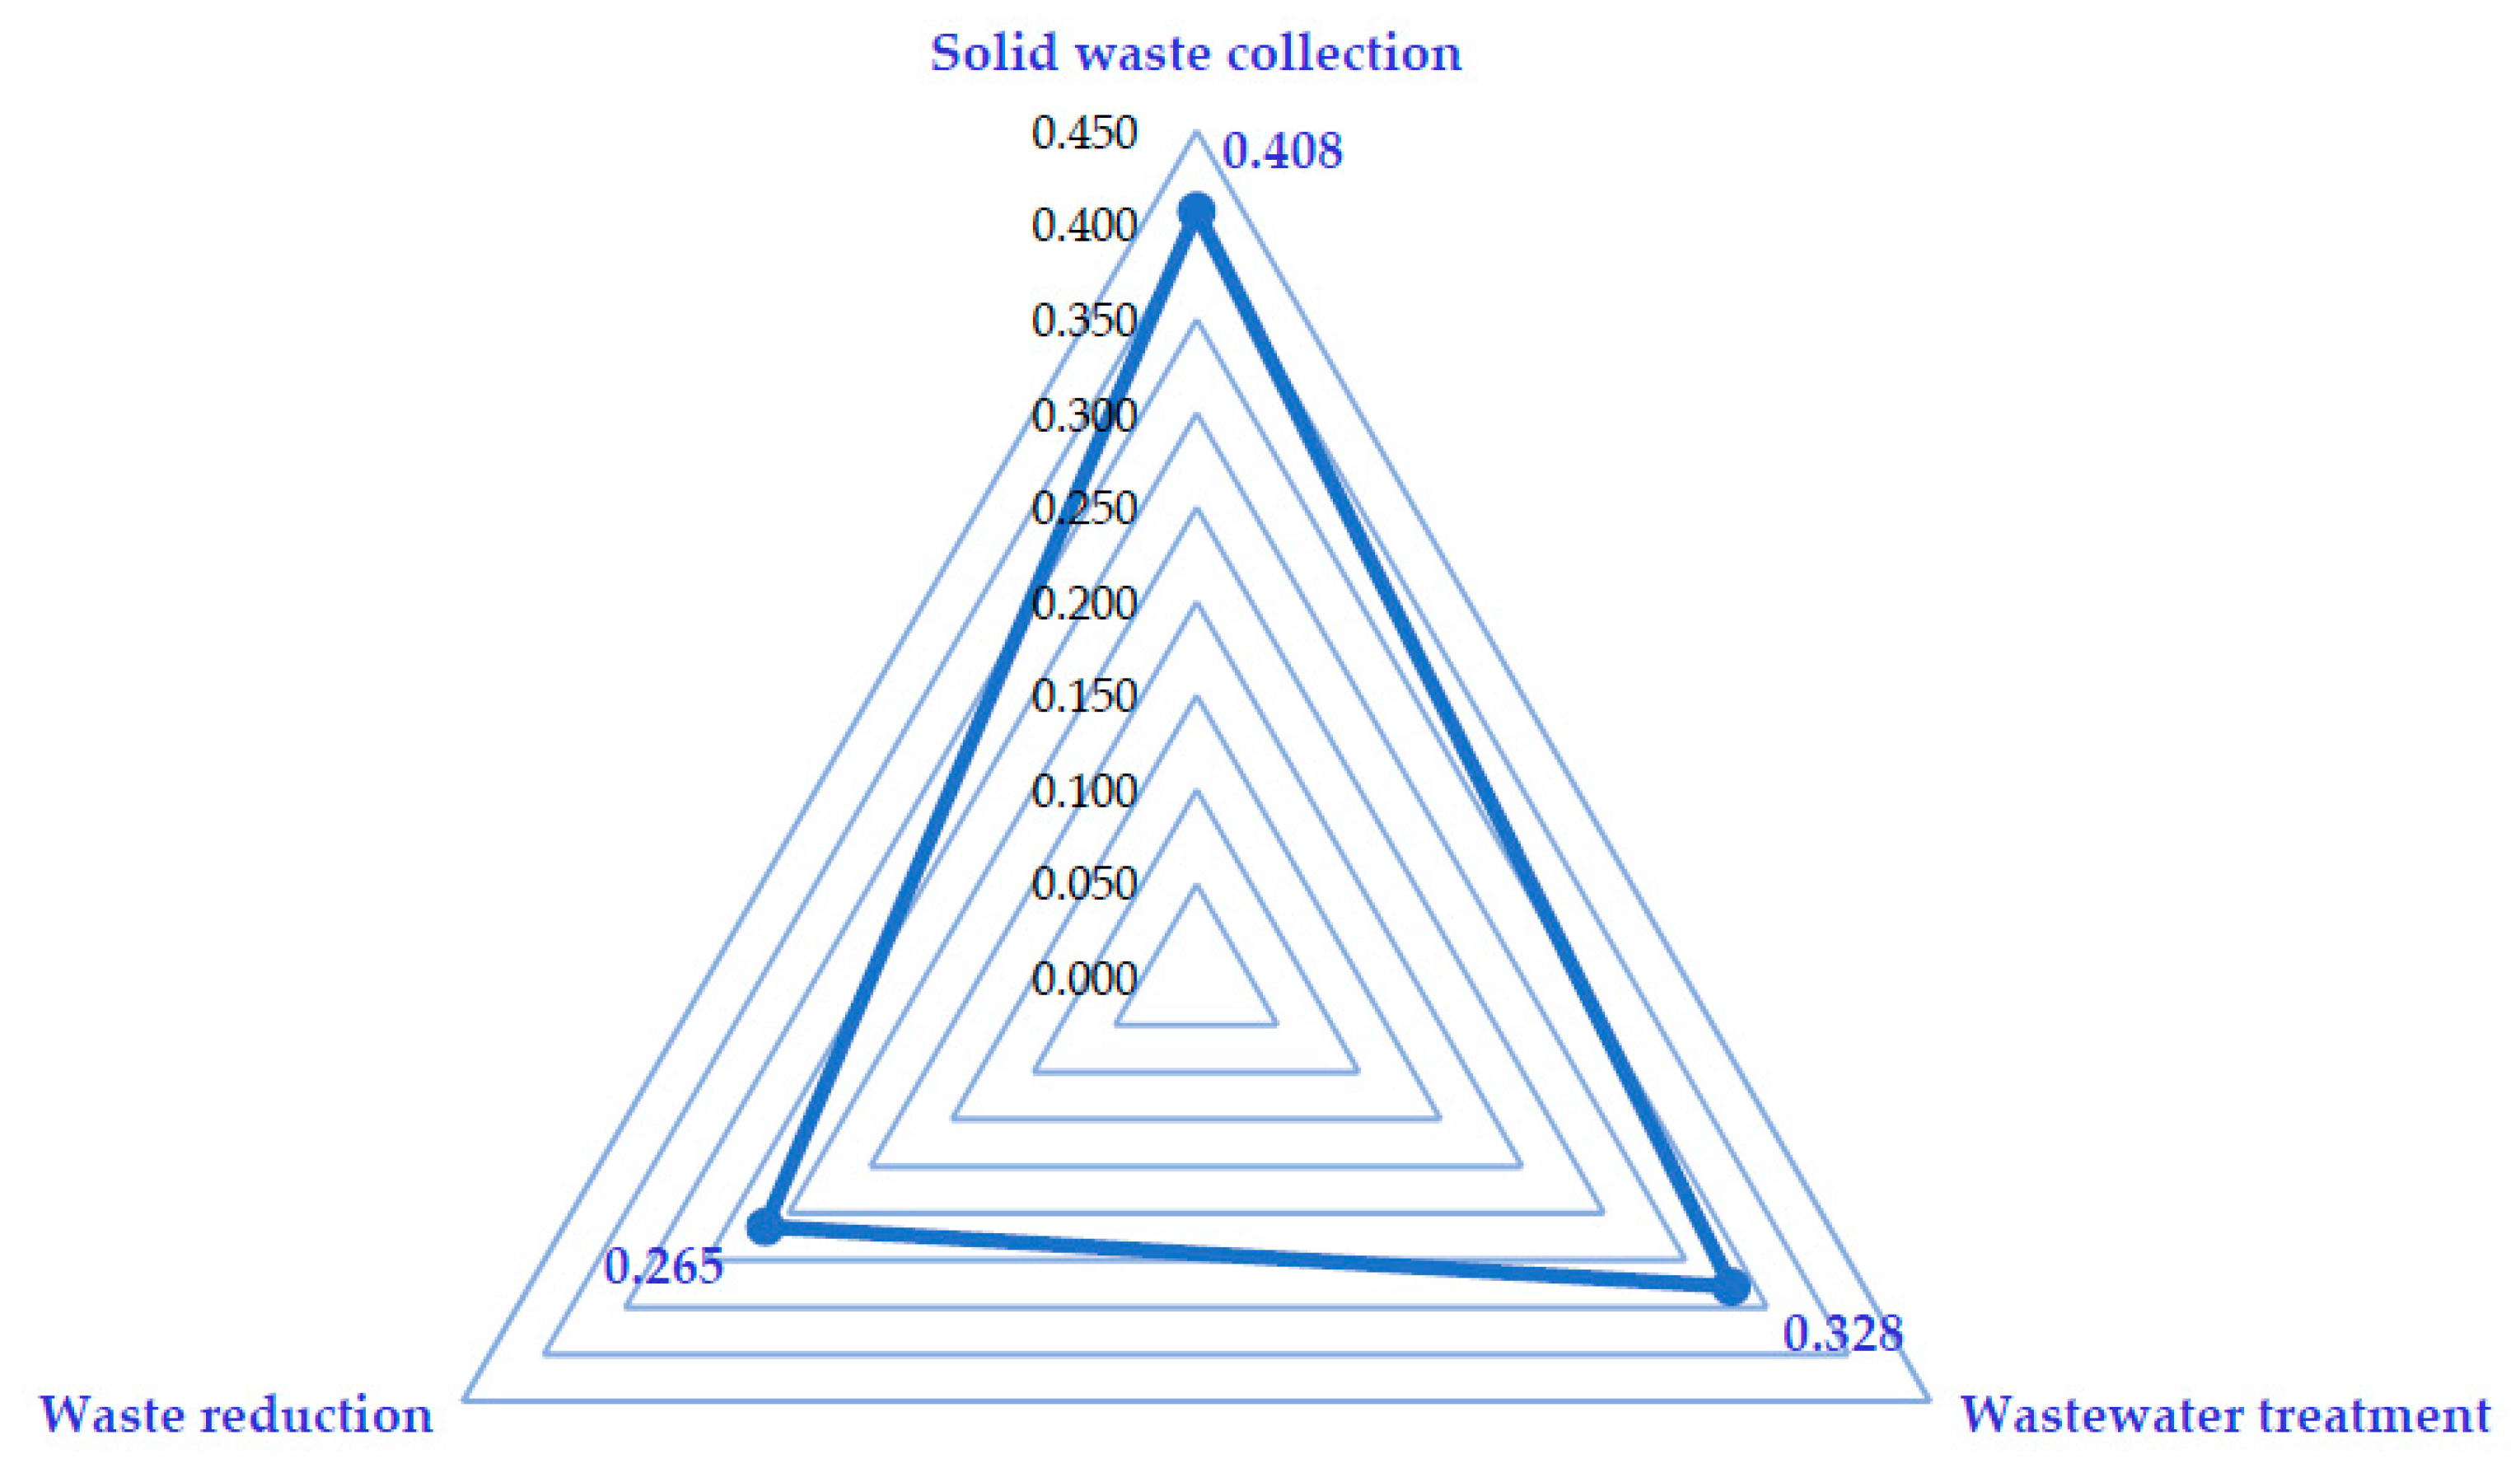
| Waste Management | Solid waste collection | This indicator assesses the public organizations for solid waste collection and the city government’s efforts in improvement. It measures through a percentage of households linked to collecting network and number and type of improvement initiatives. |
| Wastewater treatment | This indicator assesses the situation of wastewater treatment in the city. It measures through the number, type, and size of wastewater treatment plants used for treating wastewater in the city. | |
| Waste reduction | This indicator assesses the city government’s efforts in reducing wastes. It measures through the number, type, and size of initiated programs, activities, or measures to reduce waste in the city. | |
| Air Quality and Energy | Fine dust levels | This indicator assesses the air quality in the city, including the city government’s efforts in reducing greenhouse gases (GHGs). It measures through PM levels and number, type, and size of initiated programs, activities, or measures to reduce GHGs. |
| Urban forest | This indicator assesses the forest cover in the city, including the city government’s efforts in planting trees. It measures through a percentage of total forest cover in the city, and number, type, and size of initiated programs or activities to plant more trees. | |
| Energy consumption | This indicator assesses the situation of energy consumption in the city. It measures through an average amount of electricity consumed by a person or household and number of initiated programs or activities for energy saving in daily life. | |
| Renewable energy | This indicator assesses the renewable energy production and the city’s government efforts for promoting renewable energy. It measures through a percentage of renewable energy contributed to the electricity supply and number, type, and size of the initiatives for promoting renewable energy use and production. | |
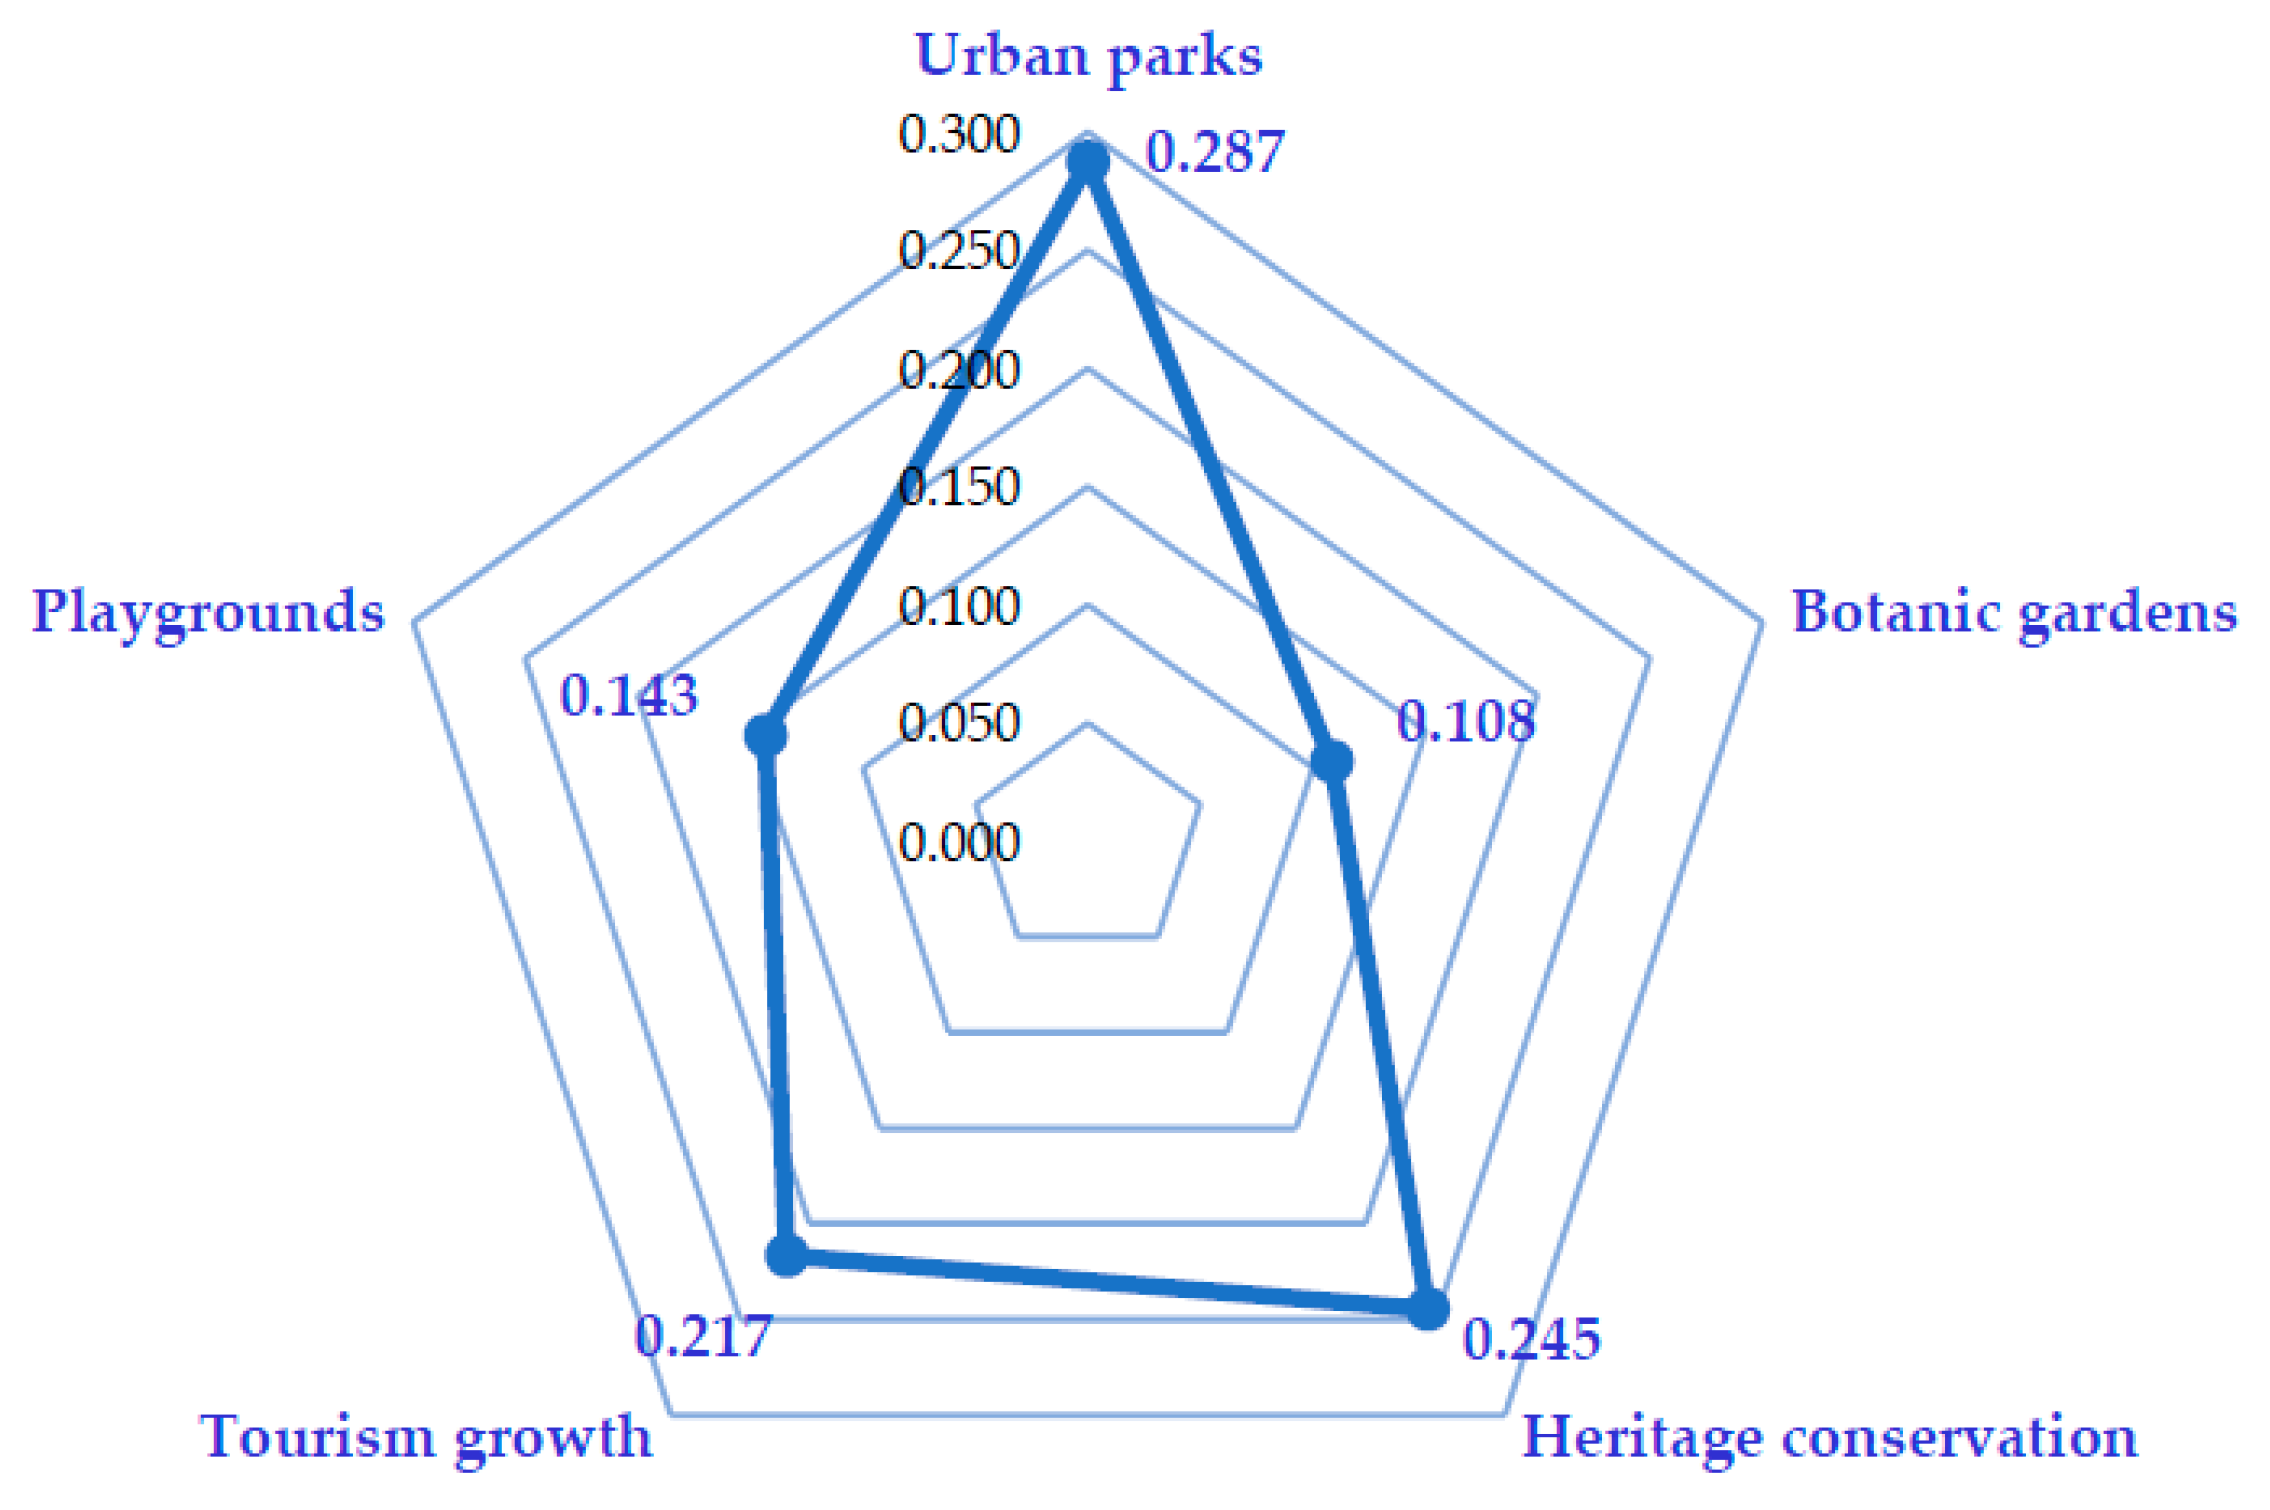
| Urban Spaces and Tourism | Urban parks | This indicator assesses the public green spaces or parks in the city. It measures through the number and size of natural or artificial parks in the city, including their accessibility and cleanliness. |
| Botanic gardens | This indicator assesses the biodiversity gardens created for tourism, education, and conservation purposes in the city. It measures through the number, type, and size of the gardens. | |
| Heritage conservation | This indicator assesses the conservative situation of cultural, historical, and heritage status or buildings in the city. It measures through the numbers of the conserved status or buildings, including budgets allocated to preserve that status or buildings. | |
| Tourism growth | This indicator assesses the tourists’ satisfaction for the city, including the city’s government efforts in attracting more tourists. It measures through tourism growth rate and satisfaction level and the programs or activities initiated to attract more tourists. | |
| Playgrounds | This indicator assesses the situation of playgrounds or leisure areas in the city. It measures through the number, type, and size of the playgrounds and leisure areas in the city. |
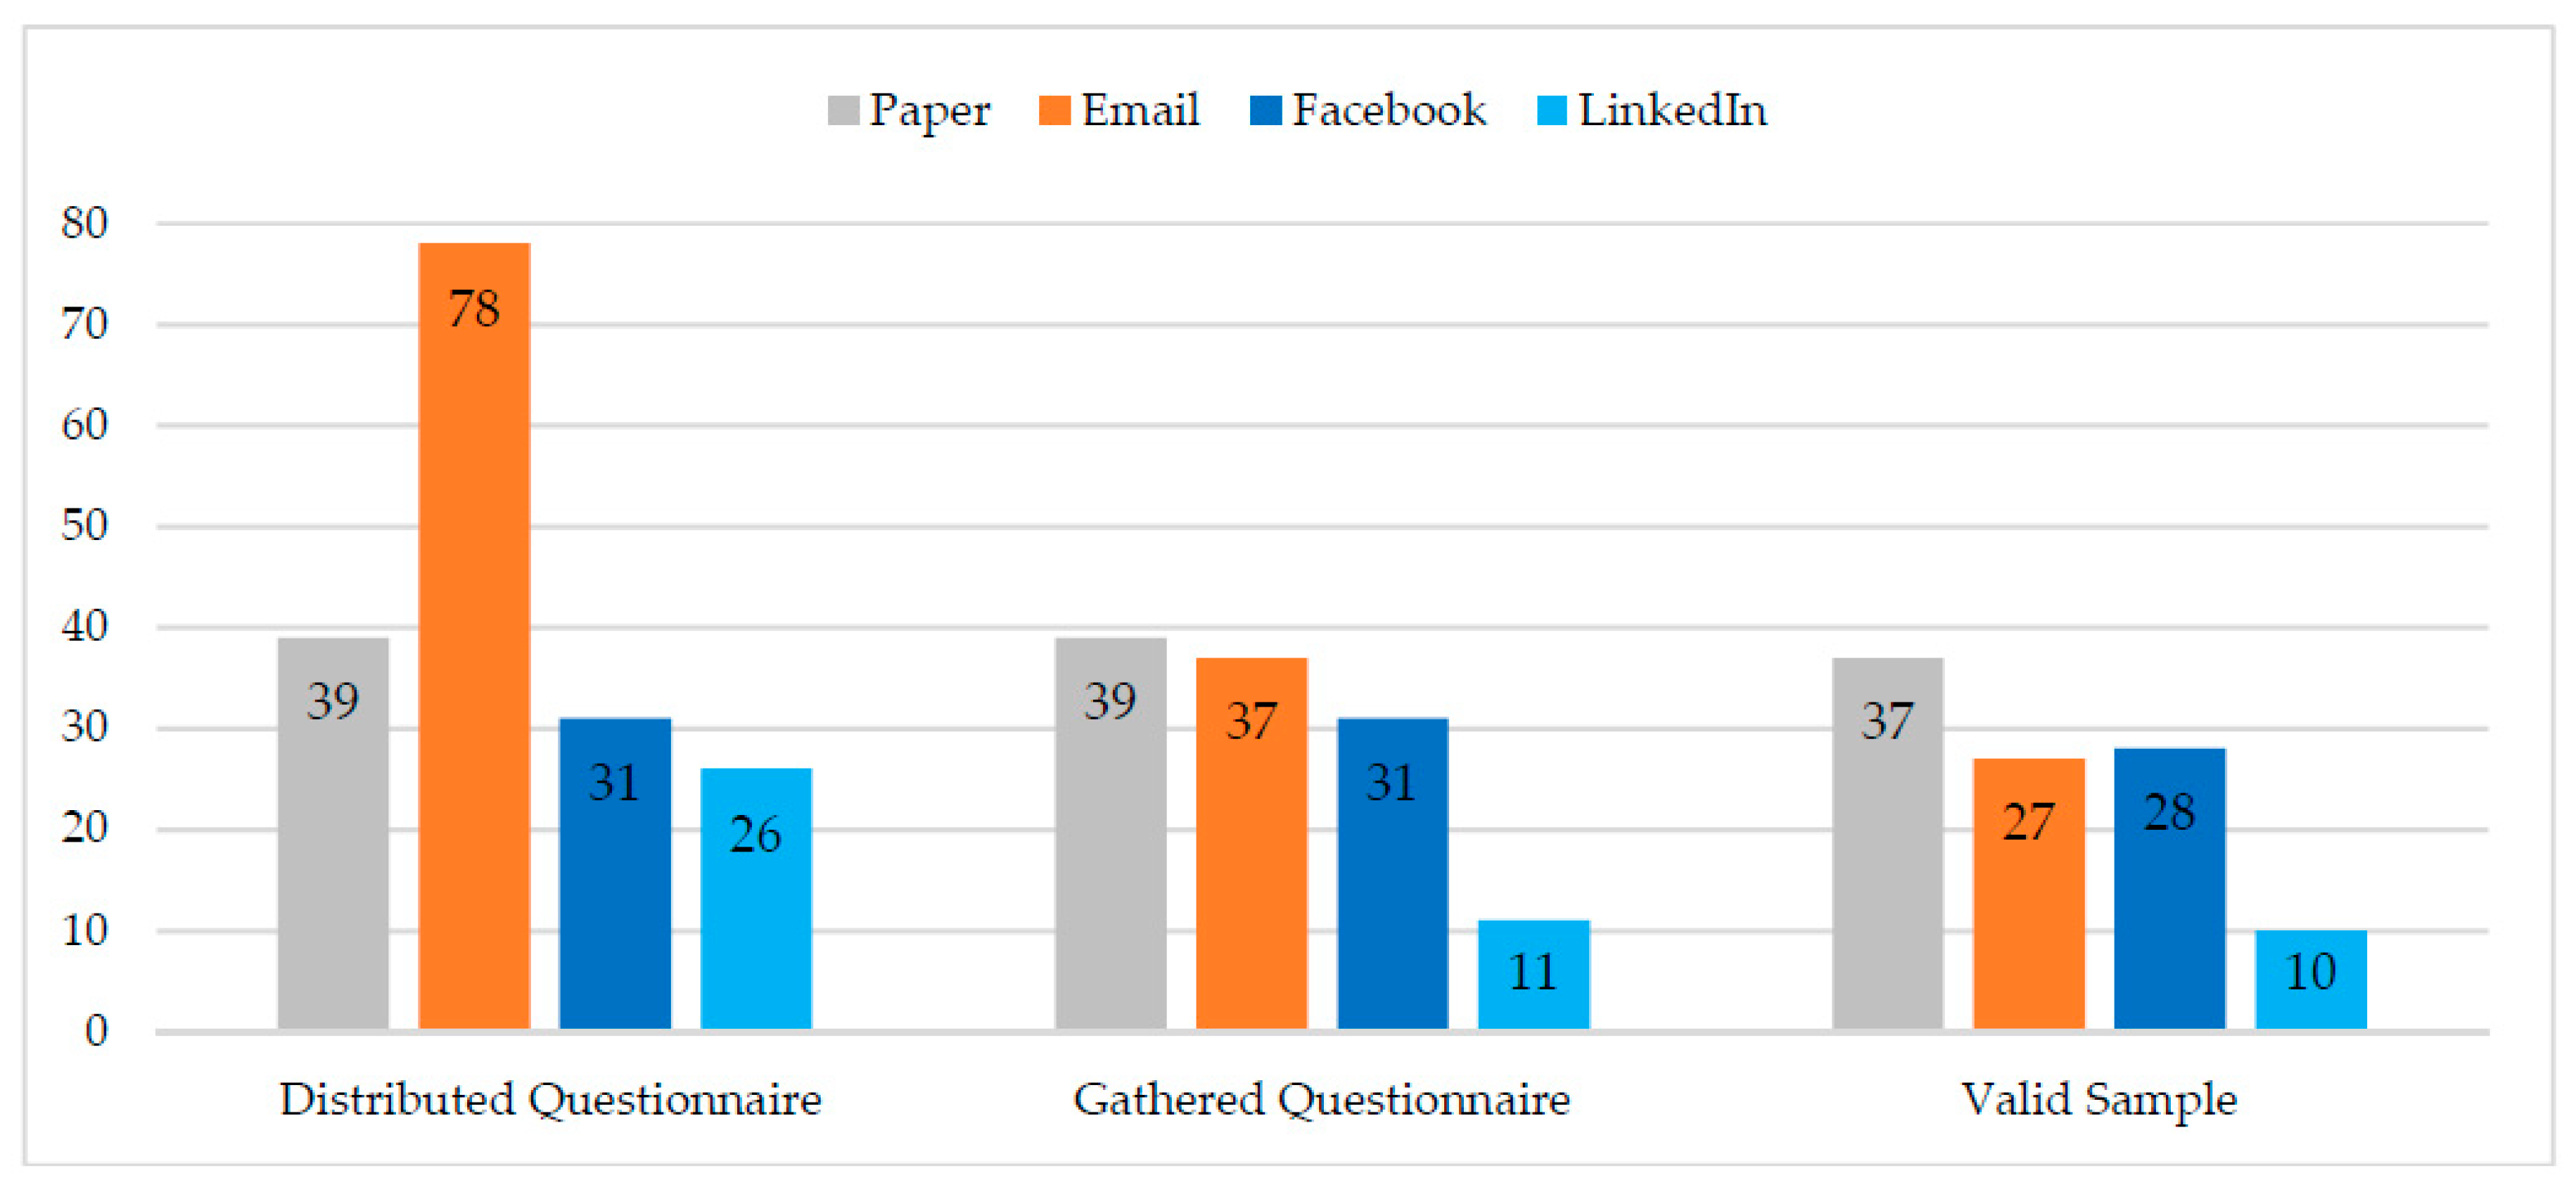
| Survey Methods | Institutions of Respondents | Questionnaires | |||
|---|---|---|---|---|---|
| Distributed | Gathered | Inconsistent | Consistent | ||
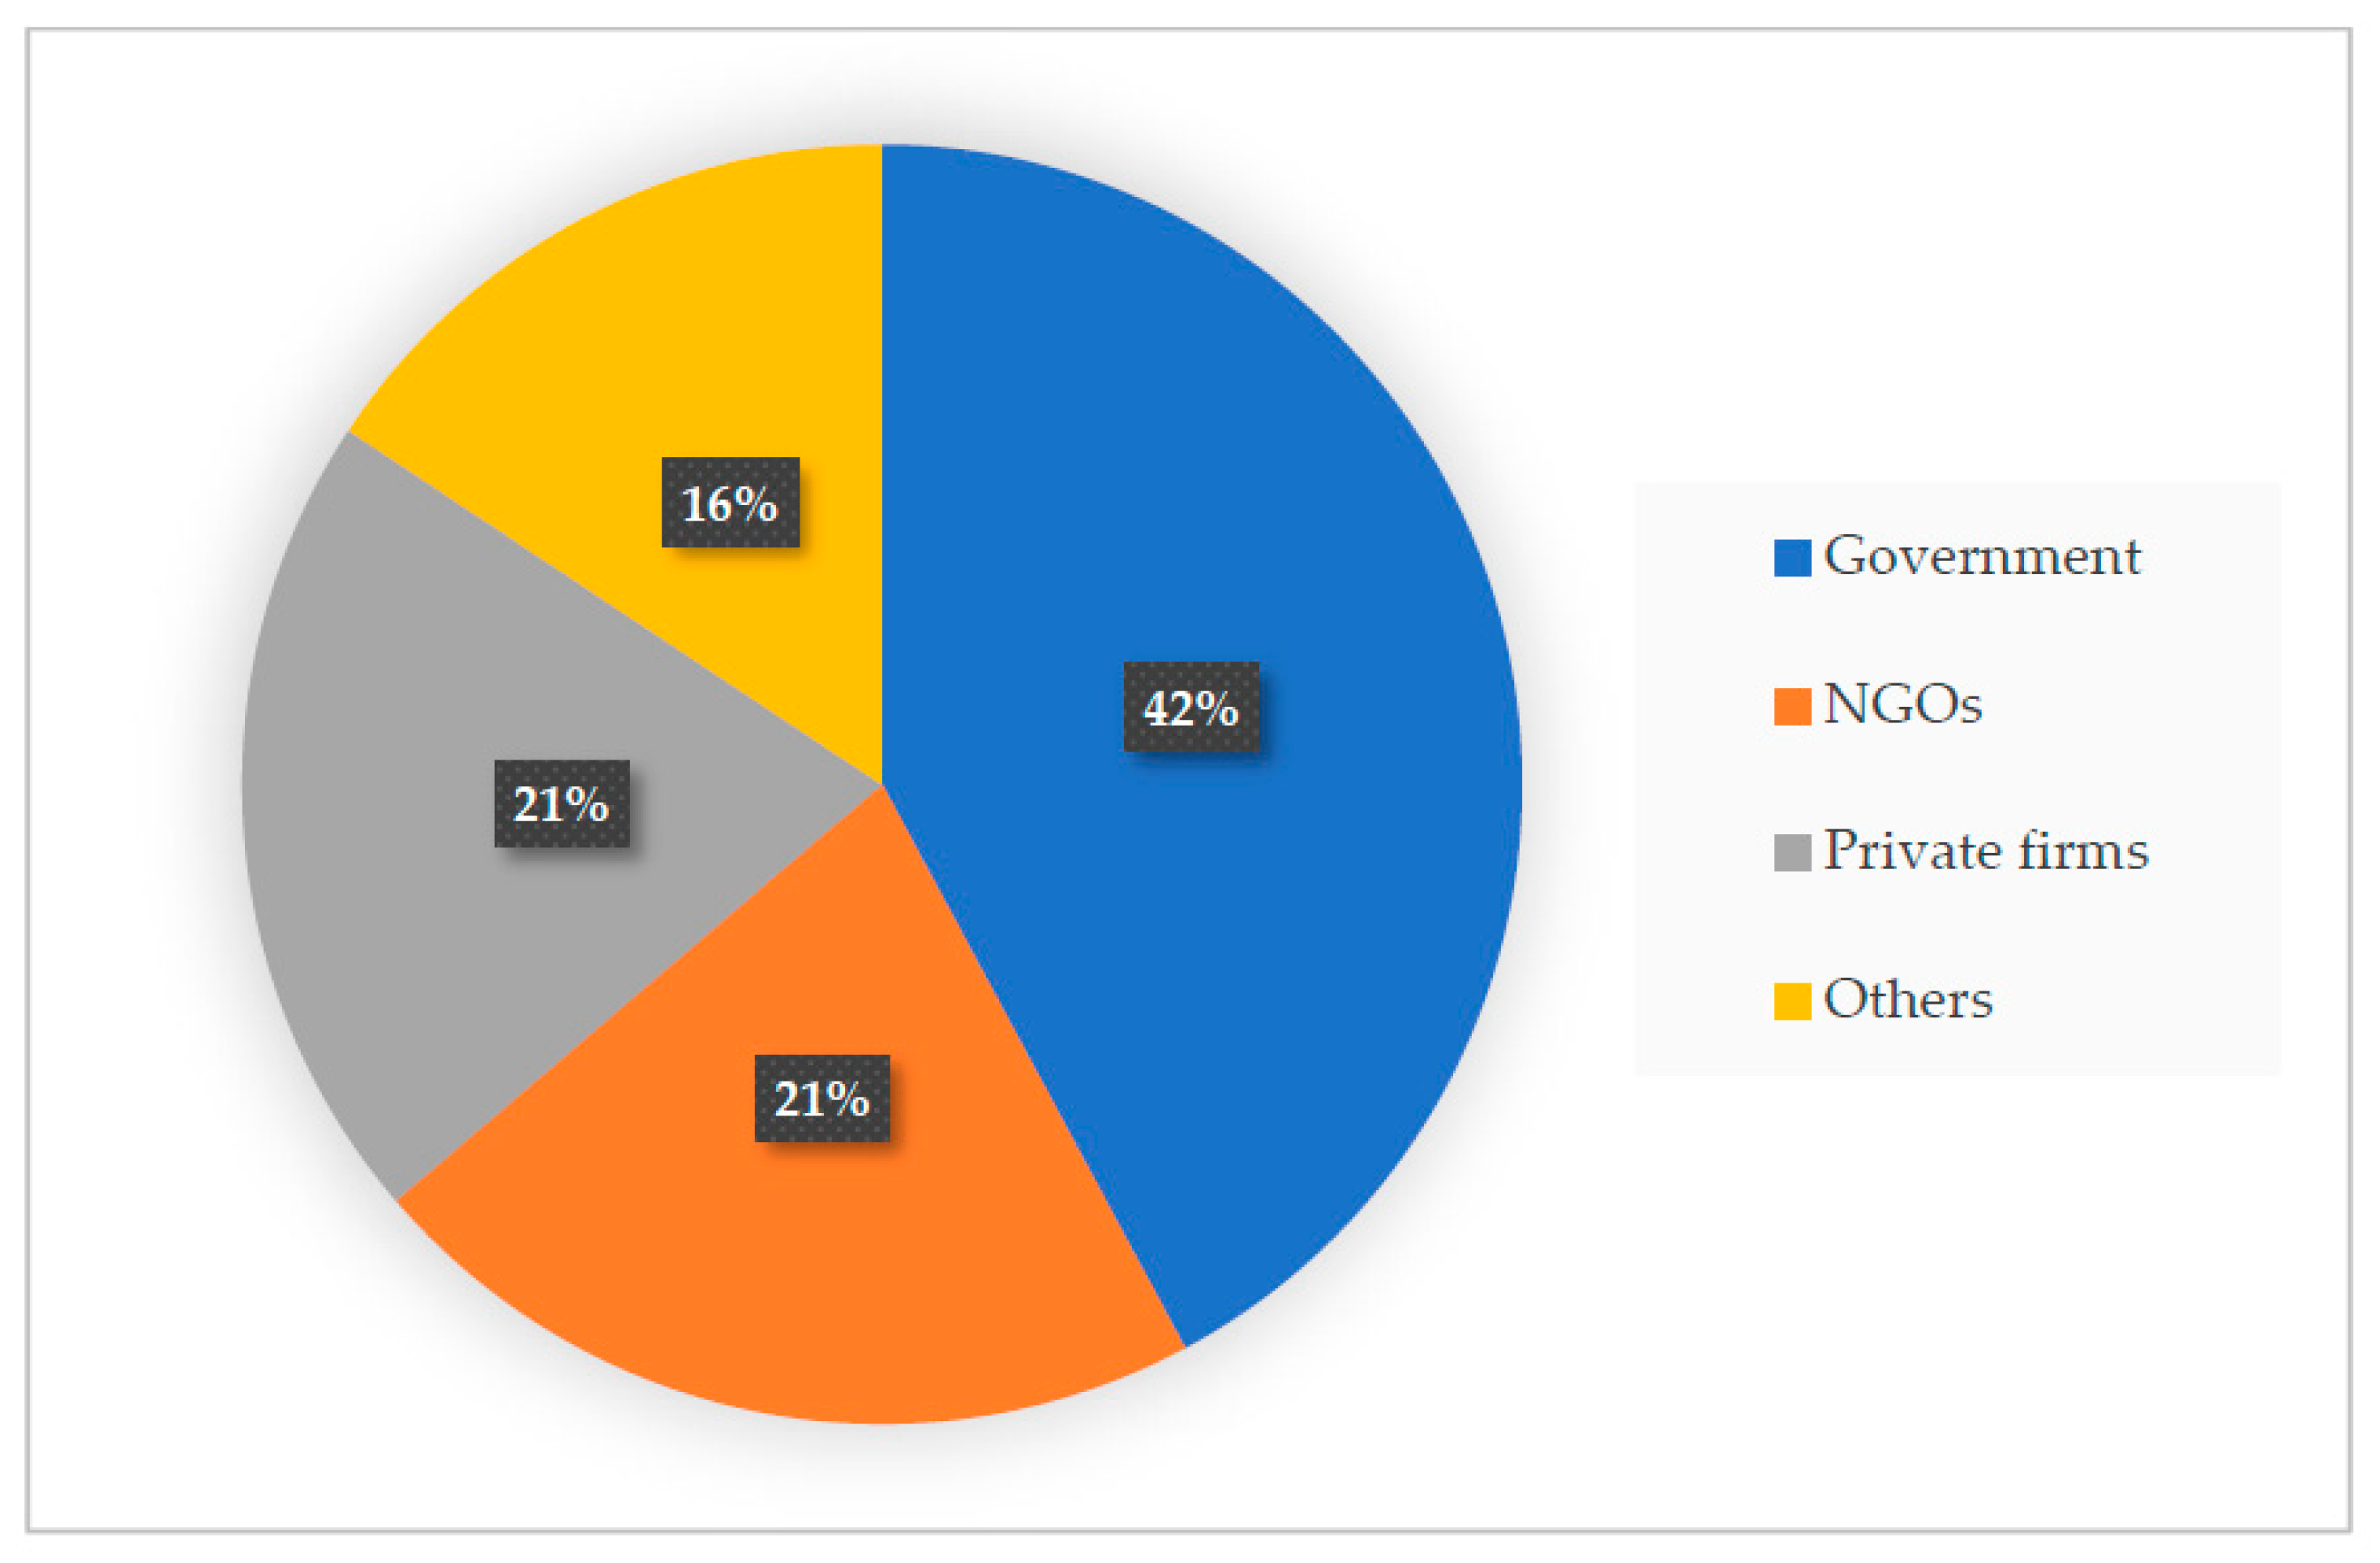
| Paper | Government | 25 | 25 | 1 | 24 |
| NGOs | 8 | 8 | 0 | 8 | |
| Private Firms | 2 | 2 | 0 | 2 | |
| Others | 4 | 4 | 1 | 3 | |
| Total I | 39 | 39 | 2 | 37 | |
| Government | 23 | 13 | 4 | 9 | |
| NGOs | 24 | 16 | 5 | 11 | |
| Private Firms | 19 | 5 | 0 | 5 | |
| Others | 12 | 3 | 1 | 2 | |
| Total II | 78 | 37 | 10 | 27 | |
| Government | 10 | 10 | 0 | 10 | |
| NGOs | 3 | 3 | 0 | 3 | |
| Private Firms | 10 | 10 | 2 | 8 | |
| Others | 8 | 8 | 1 | 7 | |
| Total III | 31 | 31 | 3 | 28 | |
| Government | 0 | 0 | 0 | 0 | |
| NGOs | 0 | 0 | 0 | 0 | |
| Private Firms | 15 | 7 | 1 | 6 | |
| Others | 11 | 4 | 0 | 4 | |
| Total IV | 26 | 11 | 1 | 10 | |
| Total | I+II+III+IV | 174 | 118 | 16 | 102 |
| Criteria | Weight | Indicator | Weight | Total Weight | Rank |
|---|---|---|---|---|---|
| Demography | 0.112 | Population density | 0.260 | 0.0291 | 17 |
| City’s migration | 0.413 | 0.0462 | 5 | ||
| Household income | 0.327 | 0.0366 | 11 | ||
| Employment | 0.128 | Labor forces | 0.328 | 0.0421 | 8 |
| Unemployment | 0.403 | 0.0516 | 2 | ||
| New jobs creation | 0.269 | 0.0345 | 15 | ||
| Housing | 0.136 | Slum population | 0.410 | 0.0557 | 1 |
| Low-income housing | 0.328 | 0.0445 | 6 | ||
| Quality of buildings | 0.262 | 0.0356 | 13 | ||
| Transport | 0.111 | Transport means | 0.242 | 0.0268 | 21 |
| Sidewalks | 0.211 | 0.0234 | 23 | ||
| Parking lots | 0.189 | 0.0209 | 25 | ||
| Traffic congestion | 0.359 | 0.0398 | 10 | ||
| Safety | 0.137 | Crime prevention | 0.342 | 0.0470 | 3 |
| Construction safety | 0.291 | 0.0400 | 9 | ||
| Disaster prevention | 0.199 | 0.0274 | 20 | ||
| Insurances | 0.172 | 0.0237 | 22 | ||
| Water Use | 0.115 | Water supply | 0.407 | 0.0469 | 4 |
| Water consumption | 0.278 | 0.0320 | 16 | ||
| Water reservoirs | 0.315 | 0.0362 | 12 | ||
| Waste Management | 0.107 | Solid waste collection | 0.408 | 0.0437 | 7 |
| Wastewater treatment | 0.328 | 0.0352 | 14 | ||
| Waste reduction | 0.265 | 0.0284 | 19 | ||
| Air Quality and Energy | 0.074 | Fine dust levels | 0.168 | 0.0124 | 30 |
| Urban forests | 0.204 | 0.0150 | 29 | ||
| Energy consumption | 0.386 | 0.0284 | 18 | ||
| Renewable energy | 0.242 | 0.0178 | 27 | ||
| Urban Spaces and Tourism | 0.080 | Urban parks | 0.287 | 0.0229 | 24 |
| Botanic gardens | 0.108 | 0.0086 | 32 | ||
| Heritage conservation | 0.245 | 0.0195 | 26 | ||
| Tourism growth | 0.217 | 0.0173 | 28 | ||
| Playgrounds | 0.143 | 0.0114 | 31 | ||
| Total | 1.000 | - | 9.000 | 1.000 | - |
| Indicator | Priority Weight | In Percentage | Rank |
|---|---|---|---|
| Slum population | 0.0557 | 5.57% | 1 |
| Unemployment | 0.0516 | 5.16% | 2 |
| Crime prevention | 0.0470 | 4.70% | 3 |
| Water supply | 0.0469 | 4.69% | 4 |
| City’s migration | 0.0462 | 4.62% | 5 |
| Low-income housing | 0.0445 | 4.45% | 6 |
| Solid waste collection | 0.0437 | 4.37% | 7 |
| Labor forces | 0.0421 | 4.21% | 8 |
| Construction safety | 0.0400 | 4.00% | 9 |
| Traffic congestion | 0.0398 | 3.98% | 10 |
| Household income | 0.0366 | 3.66% | 11 |
| Water reservoirs | 0.0362 | 3.62% | 12 |
| Quality of buildings | 0.0356 | 3.56% | 13 |
| Wastewater treatment | 0.0352 | 3.52% | 14 |
| New jobs creation | 0.0345 | 3.45% | 15 |
| Water consumption | 0.0320 | 3.20% | 16 |
| Population density | 0.0291 | 2.91% | 17 |
| Energy consumption | 0.0284 | 2.84% | 18 |
| Waste reduction | 0.0284 | 2.84% | 19 |
| Disaster prevention | 0.0274 | 2.74% | 20 |
| Transport means | 0.0268 | 2.68% | 21 |
| Insurances | 0.0237 | 2.37% | 22 |
| Sidewalks | 0.0234 | 2.34% | 23 |
| Urban parks | 0.0229 | 2.29% | 24 |
| Parking lots | 0.0209 | 2.09% | 25 |
| Heritage conservation | 0.0195 | 1.95% | 26 |
| Renewable energy | 0.0178 | 1.78% | 27 |
| Tourism growth | 0.0173 | 1.73% | 28 |
| Urban forests | 0.0150 | 1.50% | 29 |
| Fine dust levels | 0.0124 | 1.24% | 30 |
| Playgrounds | 0.0114 | 1.14% | 31 |
| Botanic gardens | 0.0086 | 0.86% | 32 |
| Total | 1.000 | 100% | - |
| Rank | Indicator | Description |
|---|---|---|
| 1 | Slum population | This indicator assesses the residential and living environment in the city. It measures through a percentage of the population living in slums or informal/unplanned settlements. |
| 2 | Unemployment | This indicator assesses the employment situation in the city. It measures through the unemployment rate. |
| 3 | Crime prevention | This indicator assesses the city government’s efforts in preventing crimes in the city. It measures through the number and type of measures or initiatives of the city government to prevent crimes. |
| 4 | Water supply | This indicator assesses the situation of water supply in the city. It measures through a percentage of households with access to potable water supply infrastructure compared to total households. |
| 5 | City’s migration | This indicator assesses the migration situation in the city. It measures through the rural-urban migration rate in a year. |
| 6 | Low-income housing | This indicator assesses the city government’s efforts in providing affordable housing. It measures through the number, type, and size of the low-income housing development projects. |
| 7 | Solid waste collection | This indicator assesses the public organizations for solid waste collection and the city government’s efforts in improvement. It measures through a percentage of households linked to collecting network and number and type of improvement initiatives. |
| 8 | Labor forces | This indicator assesses the productivity of the city. It measures through the productive population in the labor forces. |
| 9 | Construction safety | This indicator assesses the city government’s efforts in preventing construction risks. It measures through the number and type of initiated programs or activities to prevent construction risks. |
| 10 | Traffic congestion | This indicator assesses the city government’s efforts in reducing traffic congestion. It measures through the number, type, and size of initiated programs or activities for reducing traffic congestion. |
| Rank | Reviewed Indicators | Weight |
|---|---|---|
| 1 | Percentage of the population living in slums or informal settlements | 0.0557 |
| 2 | Unemployment rate | 0.0516 |
| 3 | Percentage of households with access to potable water infrastructure | 0.0469 |
| 4 | Percentage of solid waste regularly collected | 0.0437 |
| 5 | Population density | 0.0291 |
| 6 | Disaster prevention | 0.0274 |
| 7 | Public transport sharing rate | 0.0268 |
| 8 | Budget provided to heritage conservation | 0.0195 |
| 9 | Fine dust levels (PM 2.5 or PM 10) | 0.0124 |
| Indicator | AHP | Delphi | ||
|---|---|---|---|---|
| Weight | Rank | Mean | Rank | |
| Slum population | 0.0557 | 1 | 3.6 | 28 |
| Unemployment | 0.0516 | 2 | 3.5 | 31 |
| Crime prevention | 0.0470 | 3 | 4.2 | 10 |
| Water supply | 0.0469 | 4 | 4.6 | 3 |
| City’s migration | 0.0462 | 5 | 3.6 | 28 |
| Low-income housing | 0.0445 | 6 | 4.7 | 2 |
| Solid waste collection | 0.0437 | 7 | 4.6 | 3 |
| Labor forces | 0.0421 | 8 | 4.2 | 10 |
| Construction safety | 0.0400 | 9 | 3.9 | 18 |
| Traffic congestion | 0.0398 | 10 | 3.8 | 24 |
| Household income | 0.0366 | 11 | 4.2 | 10 |
| Water reservoirs | 0.0362 | 12 | 3.9 | 18 |
| Quality of buildings | 0.0356 | 13 | 3.9 | 18 |
| Wastewater treatment | 0.0352 | 14 | 4.1 | 13 |
| New jobs creation | 0.0345 | 15 | 4.6 | 3 |
| Water consumption | 0.0320 | 16 | 4.5 | 7 |
| Population density | 0.0291 | 17 | 3.9 | 18 |
| Energy consumption | 0.0284 | 18 | 3.9 | 18 |
| Waste reduction | 0.0284 | 19 | 4.3 | 9 |
| Disaster prevention | 0.0274 | 20 | 3.7 | 25 |
| Transport means | 0.0268 | 21 | 3.9 | 18 |
| Insurances | 0.0237 | 22 | 3.5 | 31 |
| Sidewalks | 0.0234 | 23 | 4.8 | 1 |
| Urban parks | 0.0229 | 24 | 4.1 | 13 |
| Parking lots | 0.0209 | 25 | 4.1 | 13 |
| Heritage conservation | 0.0195 | 26 | 3.7 | 25 |
| Renewable energy | 0.0178 | 27 | 3.7 | 25 |
| Tourism growth | 0.0173 | 28 | 4.0 | 17 |
| Urban forests | 0.0150 | 29 | 4.5 | 7 |
| Fine dust levels | 0.0124 | 30 | 4.6 | 3 |
| Playgrounds | 0.0114 | 31 | 3.6 | 28 |
| Botanic gardens | 0.0086 | 32 | 4.1 | 13 |
© 2019 by the authors. Licensee MDPI, Basel, Switzerland. This article is an open access article distributed under the terms and conditions of the Creative Commons Attribution (CC BY) license (http://creativecommons.org/licenses/by/4.0/).
Share and Cite
Chan, P.; Lee, M.-H. Prioritizing Sustainable City Indicators for Cambodia. Urban Sci. 2019, 3, 104. https://doi.org/10.3390/urbansci3040104
Chan P, Lee M-H. Prioritizing Sustainable City Indicators for Cambodia. Urban Science. 2019; 3(4):104. https://doi.org/10.3390/urbansci3040104
Chicago/Turabian StyleChan, Puthearath, and Myeong-Hun Lee. 2019. "Prioritizing Sustainable City Indicators for Cambodia" Urban Science 3, no. 4: 104. https://doi.org/10.3390/urbansci3040104
APA StyleChan, P., & Lee, M.-H. (2019). Prioritizing Sustainable City Indicators for Cambodia. Urban Science, 3(4), 104. https://doi.org/10.3390/urbansci3040104