Abstract
This study investigates the evolution laws and prediction models of anti-skid and wear-resistant performance for asphalt pavements during the operation period. Using a combination of indoor accelerated wear tests and field detection, mixed specimens are prepared with SBS modified asphalt, limestone, and basalt aggregates. Through accelerated wear tests of different durations, the structural depth and friction coefficient are measured. Combined with the field data from the G56 K2319 section of the Hangrui Expressway, the decay laws of anti-skid performance are analyzed, and prediction models are established. The results show that the anti-skid performance of basalt mixtures is superior to that of limestone. The deepened structure technology significantly enhances the performance of basalt but has a negative impact on the pendulum value of limestone. The influence degrees of wear duration, aggregate type, and deepened structure state on structural depth and pendulum value vary. The initial structural depth of basalt mixtures (0.85 mm) is 11.8% higher than that of limestone (0.76 mm). The longitudinal pendulum value of basalt (44) is 10% higher than that of limestone (40), while the transverse pendulum value of limestone (50) is 4.2% higher than that of basalt (48). After 21 h of wear, the structural depth of basalt (0.68 mm) is 4.6% higher than that of limestone (0.65 mm), with a decay rate 23.6% lower. The pendulum value of basalt remains above 50, while limestone’s longitudinal pendulum value drops to 36 (10% lower than its initial value), even below the unmodified state. The influence order for structural depth is deepened structure state > wear duration > aggregate type, and for lateral pendulum value, it is wear duration > deepened structure state > aggregate type. There is a significant linear relationship between structural depth/pendulum value and wear duration, and the prediction models are reliable. The indoor accelerated wear of 44.5 h is equivalent to the field operation wear of 3 years. The research findings provide a theoretical basis for the evaluation of anti-skid performance, maintenance decision-making, and material optimization of asphalt pavements.
1. Introduction
With the continuous growth of transportation demand in China, significant achievements have been made in highway infrastructure construction. By the end of 2024, the total highway mileage in China had exceeded 5.63 × 10⁶ km, with more than 90% of high-grade highways adopting asphalt pavement structures. Asphalt pavements have become the main form of road construction in China due to their advantages, such as convenient construction and driving comfort. However, during long-term service, the degradation of pavement anti-skid performance has become increasingly prominent, emerging as one of the most harmful diseases of asphalt pavements [1]. The degradation of anti-skid performance directly affects driving safety, ride comfort, and service life of roads. Especially under adverse weather conditions such as rain and snow, the slippery pavement surface extends braking distance and significantly increases traffic accident rates. Statistical data show that insufficient anti-skid performance has become one of the important factors causing traffic accidents, imposing immeasurable losses on highway operation management, public driving safety, and socioeconomic development [2].
The decline in anti-skid performance of asphalt pavements is mainly manifested as a reduction in friction coefficient due to wear of surface texture. Existing studies indicate that pavement anti-skid performance primarily depends on surface texture characteristics, including macro-texture depth and micro-texture [3]. Macro-texture affects the mechanical occlusion between tires and the pavement as well as drainage performance, while micro-texture determines the adhesive friction force at the contact surface. In current engineering practice, deepened-texture technology is widely used to improve anti-skid performance, which is achieved by mechanically processing longitudinal grooves on the pavement surface [4]. However, several key issues remain in its practical application: the long-term anti-skid performance differences of different aggregate types after deepened-texture treatment are unclear; the decay law of anti-skid performance for deepened-texture pavements lacks systematic research; and existing prediction models struggle to accurately reflect the evolution process of anti-skid performance under actual service environments [5,6]. These issues restrict the optimized application of deepened-texture technology and affect the scientificity of pavement maintenance decision-making [7].
Pavement anti-skid performance is a key factor ensuring road traffic safety, and numerous scholars have conducted research in this field, covering influencing factors, evaluation methods, prediction models, and improvement measures. Yu et al. [8] (2023) found that the decay rates of British Pendulum Number (BPN), Mean Texture Depth (MTD), and Mean Profile Depth (MPD) of epoxy asphalt mixtures at high and normal temperatures are lower than those of SBS modified asphalt mixtures, demonstrating better long-term anti-skid performance. Kandji et al. [9] (2025) pointed out that the mineral composition, hardness, and particle size of aggregates significantly influence pavement anti-skid performance. Aggregates with more hard minerals and larger particle sizes can form rougher pavement surfaces, contributing to improved anti-skid performance. Cui et al. [10] (2020) showed through research that using steel slag as aggregate can increase the positive texture and peak profile of pavements, thereby enhancing their anti-skid performance. Wang et al. [11] (2025) found that compared with AC-13, 100% recycled asphalt pavement (RAP) exhibits greater deformation amplitude and texture fluctuation during wear, leading to more severe wear and degradation of anti-skid performance. Xue et al. [12] (2022) demonstrated through experiments that silicon carbide/mullite bricks (SMBs) in high-alumina refractory waste can serve as alternative aggregates for high-friction surface treatment (HFST), providing friction equivalent to calcined bauxite.
As a key component of road surfaces, aggregate’s physical properties and mineral composition directly determine the long-term stability of anti-skid performance. Rith et al. [13] (2020) compared the performance of granite, andesite, sandstone, gneiss, and limestone in exposed aggregate concrete pavement (EACP) through accelerated polishing tests and found significant differences in polishing resistance among different aggregates: andesite had the highest BPN (British Pendulum) attenuation rate, while gneiss had the lowest, and a single Los Angeles abrasion test could not accurately reflect the anti-slip durability of aggregates. Zong et al. [14] (2021) further showed that the mineral composition of aggregates has a significant impact on long-term skid resistance in thin wear layers (TFCs). The PSV (polished stone value) of 88 # calcined bauxite is 55, significantly higher than that of 75 # calcined bauxite (45), basalt (43), and limestone (38), due to the high Al2O3 content of 90.29%, and still maintains the highest dynamic friction coefficient after 50,000 polishing cycles.
Wang et al. [15] (2020) studied the effect of compaction degree (97%, 100%, 103%) on texture of AC-13 asphalt concrete and found that increasing compaction degree significantly reduced surface roughness. The average texture depth (MTD), root mean square height (Sq), and surface unfolding area ratio (Sdr) of the 97% compaction degree specimens were higher than those of the 103% compaction degree specimens; after 300,000 cycles of wheel loading, the low-pressure compaction specimen still maintains a higher macroscopic texture, resulting in a high-speed friction coefficient (F60) that is about 15% higher than that of the high-pressure compaction specimen, but the compaction degree has no significant effect on the low-speed anti-skid index (BPN). Rith et al. [13] (2020) compared the long-term anti-skid performance of EACP with groove texture (longitudinal/transverse tinning) and found that the anti-skid decay rate of EACP was lower: the initial SN40 (anti-skid value) was 60.6, and the decay slope after 100,000 wheel loads was 2.59, significantly lower than that of transverse grooves (4.51) and longitudinal grooves (4.60), attributed to the high wear resistance of exposed aggregates, while groove texture rapidly decreased anti-skid due to cement slurry wear.
Sengoz’s [16] (2014) study on high-friction surface treatment (HFST) showed that the type, size, and morphology of aggregates significantly affect the anti-skid performance. Through the analysis of the Aggregate Image Measurement System (AIMS), it was found that the texture before polishing and the edge index jointly affect the anti-slip performance, and the surface texture after polishing becomes the dominant factor. An anti-slip model integrating the two was established, and the goodness of fit was good (MSE = 11.31). Alavi et al. [17] (2025) focused on the influence of aggregate gradation and layer thickness on microsurfacing, and found that the average texture depth (MTD) and BPN of Type III coarse gradation were significantly higher than those of Type II fine gradation and performed the best at a thickness of 10 mm. Ding et al. [18] (2021) used a high-precision laser scanner (LS-40) to reconstruct the 3D texture of the road surface and found that the surface area (SA) of the texture within the depth range of 0.5–2 mm was significantly positively correlated with the anti-skid value (BPN) (R2 ≥ 0.6836), and 2 mm was the effective texture depth threshold. Xue et al. [19] (2023) reconstructed a 3D texture model of wind-blown sand cover on desert road surfaces through digital image processing and Generalized Regression Neural Network (GRNN). They found that sand filling would reduce the texture depth (MTD). When the sand content exceeded 0.625 kg/m2, the BPN tended to stabilize (with a 50% decrease in attenuation rate).
Traffic factors, such as vehicle loads and traffic volume, are critical influencers of pavement anti-skid performance. Wang et al. [20] (2025) revealed through simulated accelerated loading tests that both the friction coefficient and texture characteristics of pavements exhibit a decay trend with increasing loading cycles. Zhu et al. [21] (2023) found in their study on desert-area pavements that increased sand accumulation on pavements under sandstorm conditions significantly deteriorates anti-skid performance. Yu et al. [22] (2023) further demonstrated via orthogonal tests that total traffic volume exerts a significant impact on anti-skid performance, with overload traffic applied in the early stage accelerating the degradation of dynamic friction coefficients and leading to lower final values.
Environmental factors like temperature also profoundly affect pavement anti-skid performance. Yun et al. [8] (2023) showed that the decline rate of Mean Texture Depth (MTD) for SBS modified asphalt mixtures at high temperatures (60 °C) is significantly faster than under other temperature conditions. Peng et al. [23] (2024) noted that in arid desert regions, accumulated sand on pavements due to low precipitation drastically reduces anti-skid performance. Studies have indicated that high temperatures accelerate the decay of anti-skid performance, while increased humidity decreases friction coefficients. Additionally, special environmental conditions such as sandstorms impose adverse effects on anti-skid performance. Chen et al. [24] (2023) pointed out that a larger MTD value indicates more pronounced macro-texture fluctuations and better anti-skid performance.
Regarding prediction models for anti-skid performance, by exploring the relationship between pavement texture characteristics and anti-skid performance, scholars have established corresponding predictive frameworks. Daneshvari et al. [25] (2024) proposed a texture detection method for asphalt pavement based on two-dimensional image blending technology. Yaofei et al. [26] (2024) used accelerated abrasion tests to quantify the degradation rate of the anti-skid performance of high viscosity modified asphalt mixtures, confirming that the texture depth degradation rate of asphalt mixtures is closely related to their anti-skid performance. Yang et al. [27] (2025) employed a Generalized Regression Neural Network (GRNN) to predict pavement texture depth based on texture parameters derived from digital images, thereby enabling the prediction of anti-skid performance. A comprehensive evaluation of pavement anti-skid performance requires integrating multiple indices and testing methods. For example, Yan et al. [28] (2024) found that combining texture indices with friction coefficients and establishing their interrelationship could enhance evaluation reliability. Kane et al. [29] (2022) quantified the long-term polishing effect of traffic loads on road surfaces using the PSRM model, and established a mathematical prediction model for texture attenuation and anti-skid performance. Additionally, Xue et al. [19] (2023) found that digital image processing and neural network technologies enabled multi-faceted assessments of anti-skid performance.
Scholars have developed prediction models by deeply investigating the relationship between pavement texture characteristics and anti-skid performance. Xue et al. [19] (2023) utilized a Generalized Regression Neural Network (GRNN) to predict pavement texture depth based on texture parameters derived from digital images, thereby enabling the prediction of anti-skid performance. To improve model accuracy, researchers have integrated multiple factors such as traffic loads, aggregate properties, and pavement texture. The PSRM model proposed by Fan et al. [30] (2022) couples contact mechanics and wear law equations, comprehensively considering tire operating conditions, pavement texture, and aggregate types to predict the evolution of anti-skid performance.
Guo et al. [31]. (2025) verified the effect of texture on anti-skid performance through 3D reconstruction and printing technology and found that the micro-texture consistency of printed specimens was excellent (roughness of about 100 nm, RSD < 5%). The British Pendulum Value (BPN) in dry state was close to that of real road wet state BPN, while the BPN of printed specimens in wet state was lower but the trend of change was consistent Ren et al. [32] (2024) conducted a study on AC and SMA mixtures, which showed that the average texture depth (MTD) was linearly correlated with MPD. The elevation variance of long wave macroscopic textures (5–50 mm) accounted for more than 70% of the total variance. Pratico et al. [33] (2015) proposed that the macro texture index MPD-1 and micro-texture index can effectively characterize wear characteristics. The anti-slip attenuation rates of AC, SMA, and OGFC decrease in sequence, and the larger the nominal maximum particle size under the same grading, the lower the attenuation rate. The attenuation trend of macro texture is consistent with that of BPN, with significant attenuation of micro-texture in the early stage (<10,000 loads) (a decrease of more than 60%), and stabilization in the later stage.
Selecting appropriate asphalt and aggregates, along with optimizing gradation design, represents a key approach to enhancing anti-skid performance. Yun et al. [34] (2024) found that adjusting asphalt mixture gradation to increase coarse aggregate proportion strengthens the skeleton structure, thereby reducing the decay of pavement roughness and friction coefficients. Zhao et al. [35] (2020) demonstrated that micro-surfacing technology can improve pavement texture and anti-skid performance, with substitute aggregates like steel slag further enhancing this effect. Luo et al. [36] (2024) pointed out that high-alumina refractory waste could serve as an alternative aggregate for high-friction surface treatment (HFST), while nanomaterials and fiber materials have been explored for their potential to improve anti-skid performance.
This study employs a combined approach of laboratory tests and field measurements to systematically investigate the evolution laws of anti-skid and wear-resistant performance for in-service asphalt pavements. SBS modified asphalt and two aggregate types (limestone and basalt) were used to prepare mixture specimens, which underwent accelerated wear tests with and without deepened-texture treatments. The structural depth and friction coefficients at different wear stages were measured to analyze the decay trends and predict the anti-skid performance of deepened-texture asphalt concrete surfaces. The study further evaluates the improvement effects of deepened-texture technology and the influence of aggregate types on anti-skid performance. Field detection data from the G56 K2319 section of the Hangrui Expressway were used to explore anti-skid performance variations at different service stages, which were compared with laboratory test results to validate the simulation accuracy of accelerated wear tests. These findings provide theoretical and data-driven support for anti-skid performance evaluation methods, guiding maintenance decision-making and performance optimization of asphalt pavements. The full flow chat of this paper was shown in Figure 1.
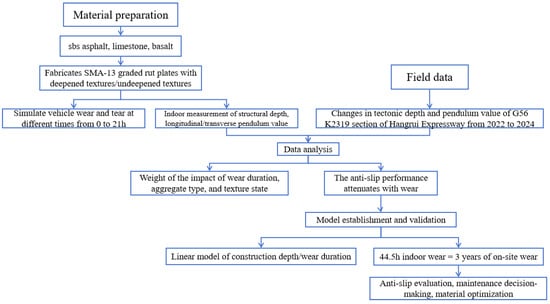
Figure 1.
Flowchart of this paper.
2. Materials and Test Methods
2.1. Raw Materials
In this study, SBS modified asphalt containing 0.6% ultraviolet absorber was selected as the binder for preparing asphalt mixtures, with its basic technical indices listed in Table 1. To better explore the influence of different aggregates on pavement anti-skid performance, basalt and limestone were used as coarse aggregates, limestone as fine aggregate, and limestone mineral powder as filler.

Table 1.
Technical indicators of SBS modified asphalt.
2.2. Test Methods
2.2.1. Preparation of Asphalt Mixture Specimens
In this study, standard rutting plate specimens (300 × 300 × 50 mm3) were used to investigate the anti-skid performance of asphalt concrete surfaces. The commonly used SMA-13 gradation was adopted for preparing asphalt mixtures, with the gradation design shown in Table 2. Two typical aggregates, limestone and basalt, were selected for comparative research. For each combination of aggregate type (limestone/basalt) and texture state (deepened texture via grinding/grooving vs. unmodified texture), 3 parallel rutting plate specimens (300 × 300 × 50 mm3) were prepared, resulting in a total of 12 specimens (2 aggregate types × 2 texture states × 3 replicates). This sample size ensures the reliability and statistical validity of the subsequent indoor accelerated wear tests and anti-skid performance measurements. Based on the results of Marshall tests, the optimal asphalt content was determined to be 5.5%, with lignin fiber used as the additive at a dosage of 0.4% by mass of the mixture. The tests were conducted in accordance with JTGF40-2004 [38] Technical Specifications for Construction of Highway Asphalt Pavements.

Table 2.
Mix proportion of asphalt mixture.
To analyze the anti-skid performance of pavements with different material compositions, indoor wear tests were conducted on pavement surfaces composed of basalt and limestone aggregates. To study the comparative effects of different surface textures, surface grinding and grooving were performed on rutting plate specimens to form various texture configurations, exploring the variation in anti-skid performance of asphalt mixture surfaces under different textural conditions. Basalt and limestone specimens were respectively selected for texture deepening treatment using surface grinding and grooving technology (Figure 2) to investigate the changes in anti-skid performance of specimen surfaces under different wear durations. Figure 2 shows the effect of texture deepening on basalt rutting plate specimens.
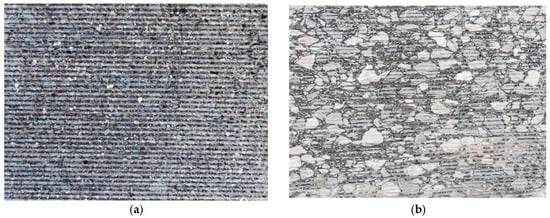
Figure 2.
Schematic diagram of grinding grooves on the surface of the rutting plate specimen. (a) Surface of basalt rutting board specimen; (b) surface of limestone rutting board specimen.
2.2.2. Indoor Accelerated Wear Test
In this study, indoor accelerated wear equipment was used to conduct accelerated wear tests to simulate the wear of pavements caused by vehicles, as shown in Figure 3. The indoor accelerated wear test used a self-developed dual-wheel polishing device (Model: HW-ASP-Ⅱ). Two parallel rubber tires (size: 205/55 R16, tread pattern depth: 8 mm, rubber hardness: 65 Shore A) were arranged symmetrically, with an axle distance of 200 mm. The tire material mimics the friction characteristics of passenger car tires in actual traffic. A pneumatic loading device applies vertical pressure to the tires, adjustable in the range of 0–0.5 MPa. In this study, the contact pressure between the tires and the specimen surface was set to 0.3 MPa via pressure gauge calibration. A variable-frequency motor (power: 1.5 kW) drives the tires to rotate at a controllable speed (50–300 r/min). The rotational speed was fixed at 120 r/min, with the direction of rotation consistent with the longitudinal direction of the rutting plate specimen (300 × 300 × 50 mm3). An environmental chamber encloses the test area, maintaining the temperature at 20 ± 1 °C through a refrigeration/heating module, with real-time temperature monitoring via a thermocouple embedded 5 mm below the specimen surface. A stainless-steel fixture clamps the rutting plate specimen to prevent displacement during wear, ensuring uniform contact between the tires and the specimen surface. The test adopted dual-tire wear with a wheel ground contact pressure of 0.3 MPa, a rotational speed of 120 r/min, and a temperature control of 20 °C. These parameters are consistent with the common tire specifications in actual road traffic, ensuring that the simulated wear effect is more representative of real-world conditions. The wear durations were set as 0 h, 1 h, 3 h, 7 h, 13 h, 19 h, and 21 h so as to better analyze the decay law of the anti-skid performance of the mixture surface and simulate the actual decay of the asphalt concrete surface course.
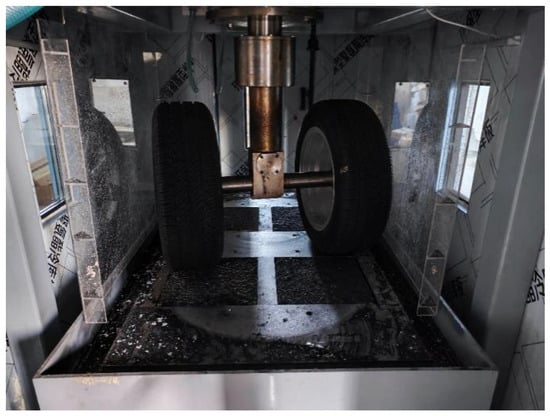
Figure 3.
Indoor simulated accelerated wear test.
2.2.3. Surface Anti-Skid Performance Test
The surface texture depth (TD) of rutting plate specimens was measured by the sand patch method, and the surface friction pendulum values in different directions (longitudinal and transverse) were measured by the pendulum friction test, which were used as the evaluation indices for the surface anti-skid performance of the deepened-texture pavement. The sand patch method for measuring structural depth (TD) followed the specifications of JTG E60-2008 [39] (Standard Test Methods of Bituminous Mixtures for Highway Engineering) with the following detailed steps: Dry the surface of the rutting plate specimen (300 × 300 × 50 mm3) with a hair dryer to remove loose particles. Prepare standard sand (silica sand with particle size 0.15–0.3 mm, bulk density: 1.5 g/cm3) and sieve it to remove impurities. Use a 50 mL graduated cylinder to measure 25 mL of standard sand (mass: ~37.5 g). Place the specimen on a horizontal platform. Hold the graduated cylinder vertically, and slowly pour the 25 mL standard sand onto the center of the specimen surface. Use a flat scraper (stainless steel, 150 × 50 mm2) to gently spread the sand outward in a circular motion, ensuring the sand fills the surface texture without compacting or lifting. Continue spreading until the sand forms a uniform, contiguous patch with no visible gaps. Use a Vernier caliper (accuracy: 0.01 mm) to measure the diameter of the sand patch at 4 orthogonal directions (e.g., 0°, 90°, 45°, 135°). Repeat the test 3 times at different positions on the specimen surface, and take the average value as the final structural depth.
Level the tester using the spirit level; adjust the base screws until the bubble is centered. Ensure the pendulum arm rotates freely, and the rubber slider (size: 63 × 6.3 mm2, hardness: 60 ± 5 Shore A) is clean and undamaged. Release the pendulum with the slider not in contact with the specimen; the pointer should align with 100 on the scale. Calibrate with a standard glass plate (friction coefficient 0.02): The pendulum value should read 5 ± 3, adjusting the counterweight if necessary. Place the rutting plate specimen (300 × 300 × 50 mm3) on the test platform, ensuring the surface is dry and free of debris. Define “longitudinal” as parallel to the length of the specimen (300 mm direction) and “transverse” as parallel to the width (300 mm direction). Position the tester so that the slider contacts the specimen surface at the marked longitudinal direction. Lift the pendulum to the locking position, release it, and record the maximum reading (pendulum value) when the slider swings back. Repeat the measurement 5 times at the same longitudinal position, discarding the first reading (to account for initial slider wear) and averaging the remaining 4 values. Reposition the tester to the transverse direction and repeat steps to obtain the transverse pendulum value. Conduct 3 sets of tests at different positions on the specimen surface and take the overall average as the final longitudinal/transverse pendulum value. The test processes are shown in Figure 4 and Figure 5.
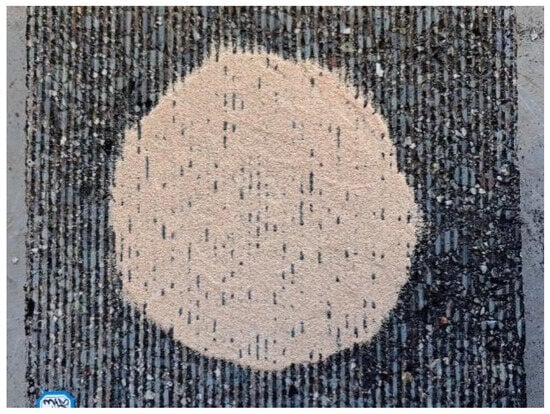
Figure 4.
Surface structure depth test.
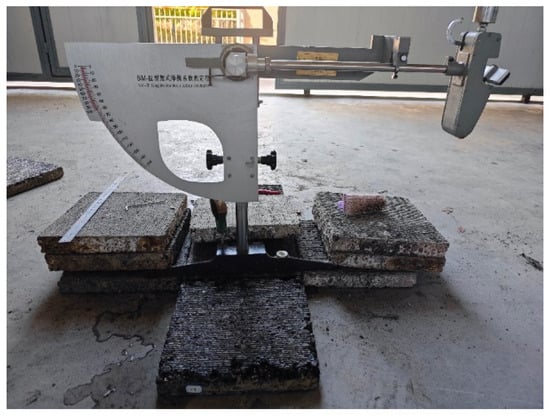
Figure 5.
Pendulum friction test.
3. Results and Discussion
3.1. Analysis of Anti-Skid Performance Decay of Highway Pavements
Figure 6 and Table 3 illustrate the variation laws of structural depth on asphalt mixture surfaces with different aggregates and deepened-texture states versus wear duration. Data from the figure clearly show that all mixture surfaces exhibit high initial structural depths, which continuously decrease with increasing wear duration. The decline rate is faster in the early wear stage: for example, the structural depth of undeepened limestone mixtures decreases from approximately 0.76 mm to 0.73 mm within 0–3 h, demonstrating a significant drop. In the later wear stage (13–21 h), the decline trend flattens, indicating that mixture surfaces are more susceptible to wear in the initial stage, leading to rapid decay of anti-skid performance, which slows down thereafter.
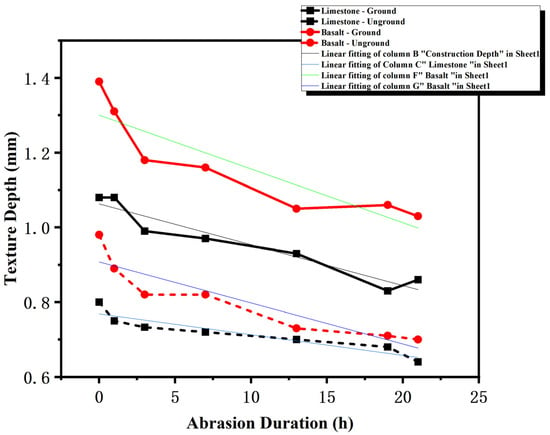
Figure 6.
Constructing a depth decay curve.

Table 3.
Fitting data of structural depth decay curves for different mixtures.
Comparing the two undeepened mixtures, basalt mixtures show a significantly higher initial structural depth (0.85 mm) than limestone mixtures (0.76 mm). The gap between their structural depths gradually narrows with prolonged wear, reaching approximately 0.68 mm for basalt and 0.65 mm for limestone after 21 h of wear. This suggests that basalt mixtures exhibit obvious anti-skid performance advantages under short-term wear without deepened texture, though such advantages weaken over time.
After deepened-texture treatment, the structural depths of both mixtures increase significantly. The initial structural depth of deepened basalt mixtures reaches 1.20 mm and that of limestone mixtures reaches 1.06 mm. Throughout the wear process, basalt mixtures maintain a higher structural depth. For instance, after 13 h of wear, the structural depth of deepened basalt mixtures is approximately 1.07 mm, compared to 0.93 mm for deepened limestone mixtures. This fully demonstrates that deepened-texture technology effectively enhances the structural depth of mixture surfaces, retards performance decay during wear and further confirms that basalt mixtures have superior wear resistance over limestone mixtures.
Figure 7 depicts the variation laws of longitudinal and transverse pendulum values on asphalt mixture surfaces with different aggregates and deepened-texture states versus wear duration, reflecting the dynamic changes in pavement anti-skid performance under different conditions.
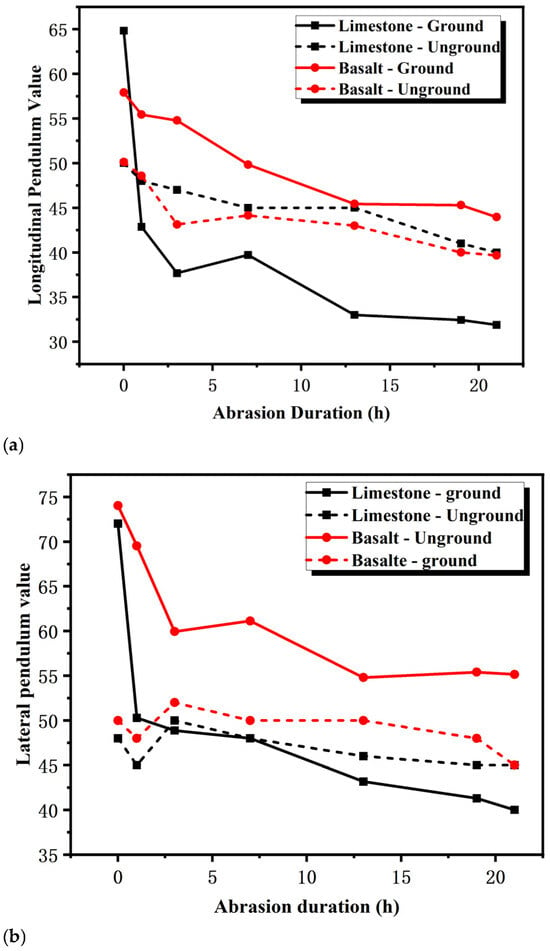
Figure 7.
Swing decay curve. (a) Vertical swing value. (b) Lateral swing value.
The longitudinal and transverse pendulum values of both mixtures remain at low levels initially, decreasing slightly but steadily with increasing wear duration. Specifically, basalt mixtures show higher longitudinal pendulum values than limestone mixtures, while limestone mixtures exhibit higher transverse pendulum values. For example, at 0 h of wear, the longitudinal pendulum value of basalt mixtures is approximately 44, compared to 40 for limestone; the transverse pendulum value is approximately 50 for limestone and 48 for basalt. This indicates that basalt is more conducive to longitudinal anti-skid, while limestone has certain advantages in transverse anti-skid performance without deepened texture.
Deepened-texture treatment significantly improves the initial longitudinal and transverse pendulum values of both mixtures. However, with increasing wear duration, the longitudinal and transverse pendulum values of limestone mixtures decrease sharply, even falling below those of undeepened textures. In contrast, basalt mixtures show a gentler decline and maintain higher pendulum values. After 13 h of wear, the longitudinal pendulum value of limestone mixtures decreases from approximately 40 to 36, and the transverse value decreases from 55 to 48, while those of basalt mixtures remain at approximately 50 and 58, respectively. This suggests that deepened texture significantly enhances the pendulum values and anti-skid performance of basalt mixtures but has a negative impact on limestone mixtures—possibly because the limestone surface loses texture features more easily due to wear, leading to rapid decline in anti-skid performance.
Limestone and basalt exhibit significant differences in mineral composition and hardness, which directly determine their wear resistance. Dominated by calcite (CaCO3) with a Mohs hardness of 3–4, its mineral structure is relatively soft and prone to abrasion and polishing under repeated friction. Composed of pyroxene and plagioclase feldspar with a Mohs hardness of 5–6, its dense crystalline structure and higher hardness enable it to resist wear and maintain surface roughness over time. The deepened-texture technology (grinding/grooving) creates artificial grooves and protrusions on the limestone surface, initially increasing structural depth (to 1.06 mm) and pendulum values. However, during the wear process, the following chain reactions occur due to limestone’s low hardness.
The micro-roughness (micro-texture) on the surface of limestone aggregates is critical for generating friction (reflected by pendulum values). Under the dual-tire wear (0.3 MPa contact pressure, 120 r/min), the soft calcite mineral is quickly polished, smoothing the aggregate surface. This reduces the adhesive friction between the tire and pavement, causing a sharp drop in pendulum values. For example, the longitudinal pendulum value of deepened limestone decreases from 40 to 36 after 13 h of wear—even lower than that of unmodified limestone (which maintains a more stable micro-texture due to less initial protrusion).
The artificially deepened grooves on limestone rely on the strength of the aggregate skeleton to maintain their shape. However, limestone’s soft aggregates cannot withstand repeated tire pressure: the protrusions between grooves are easily crushed or detached, leading to groove deformation and shallowing. This not only fails to sustain the initial structural depth advantage but also creates uneven wear scars, further reducing friction. In contrast, basalt’s high hardness ensures that deepened grooves remain intact longer, preserving both macro-texture (structural depth) and micro-texture (pendulum value).
For basalt, the combination of high mineral hardness and deepened texture forms a synergistic effect. The hard aggregates resist polishing, maintaining micro-texture and thus stable pendulum values (remaining above 50 after 13 h of wear). The deepened grooves retain their structure under wear, sustaining macro-texture depth (1.07 mm after 13 h) and enhancing drainage, which further supports anti-skid performance.
Dominated by calcite (CaCO3) with a Mohs hardness of 3–4, its soft, brittle mineral structure is prone to micro-fracture and polishing under repeated tire friction. During the indoor accelerated wear test, the sharp edges of limestone aggregates (critical for micro-texture) are quickly rounded, reducing the adhesive friction between the tire and pavement (reflected by the rapid drop in pendulum values: longitudinal pendulum value of deepened limestone decreases from 40 to 36 after 13 h of wear).
Composed of pyroxene and plagioclase feldspar (Mohs hardness 5–6), with a dense, interlocking crystalline structure, its high hardness enables basalt to resist abrasion: even after 21 h of wear, its surface retains sharp micro-irregularities, maintaining higher friction (pendulum value remains above 50) and slower texture depth decay (0.68 mm, 4.6% higher than limestone).
Basalt exhibits stronger chemical adhesion with SBS modified asphalt (due to its higher silica content and surface energy), forming a stable asphalt film that binds aggregates tightly. This reduces aggregate detachment during wear, preserving the integrity of the macro-texture (e.g., deepened grooves in basalt remain intact after 13 h of wear, maintaining a texture depth of 1.07 mm). In contrast, limestone (rich in calcium carbonate) has weaker adhesion with asphalt, leading to faster asphalt film abrasion and loose aggregate loss—exacerbating texture depth decay (e.g., unmodified limestone’s texture depth drops from 0.76 mm to 0.65 mm after 21 h).
Overall, although deepened texture improves the initial pendulum values of both mixtures, the subsequent anti-skid performance of limestone mixtures declines significantly, while basalt mixtures maintain better anti-skid performance during wear. This highlights the need to comprehensively consider aggregate types and their wear resistance when selecting pavement materials to fully leverage the anti-skid effect of deepened-texture technology. Due to their excellent wear resistance, basalt mixtures show greater potential in ensuring long-term anti-skid performance of pavements.
Table 4 presents the analysis of variance (ANOVA) results for the effects of wear duration, aggregate type, and deepened-texture state on structural depth and pendulum values under a 95% confidence level, clearly demonstrating the differences in the influence degrees of each factor. The analysis of variance (ANOVA) was performed using IBM SPSS Statistics 26.0, a widely recognized statistical software package in engineering and materials science research, which ensures the reliability of the factor influence analysis. For structural depth, the significance p-values of wear duration, aggregate type, and deepened-texture state are all less than 0.05, indicating that they have very significant effects on the structural depth of the mixture surface. In terms of F-values, the deepened-texture state has the largest F-value of 261.436, followed by wear duration with an F-value of 79.110, and aggregate type with a relatively smaller F-value of 61.927. This suggests that among the factors affecting structural depth, the deepened-texture state plays the most prominent role, capable of significantly changing the magnitude of structural depth; wear duration and aggregate type also have important effects on structural depth, as the structural depth decreases with the increase in wear time, and there are differences in structural depth among different aggregate types.

Table 4.
Analysis results of the inter-subject effect test (α = 0.05).
When the dependent variable is the longitudinal pendulum value, the p-value of wear duration is less than 0.05, indicating a significant effect, with an F-value of 29.166. The p-value of aggregate type is 0.020, which, although larger than that of wear duration, still indicates a certain degree of influence; the p-value of the deepened-texture state is 0.683, greater than 0.05, showing no significant effect on the longitudinal pendulum value. This means that wear duration is the key factor affecting the longitudinal pendulum value, and the longitudinal pendulum value changes significantly with the increase in wear time; the aggregate type also has a certain effect on the longitudinal pendulum value, but the deepened-texture state has no obvious influence on it.
For the transverse pendulum value, the significance p-values of wear duration, aggregate type, and deepened-texture state are all less than 0.05, indicating significant effects. Among them, wear duration has the largest F-value of 14.328, followed by the deepened-texture state with an F-value of 13.387, and aggregate type with a relatively smaller F-value of 13.068. This indicates that wear duration plays a dominant role in influencing the transverse pendulum value, and the transverse pendulum value changes significantly with the increase in wear time; the deepened-texture state and aggregate type also have important effects on the transverse pendulum value, and different deepened-texture states and aggregate types will cause different degrees of changes in the transverse pendulum value.
3.2. Prediction Model for Anti-Skid Performance of Highway Pavement
Table 5 presents the fitting results of structural depth and pendulum values for different asphalt mixtures versus wear duration, revealing the variation laws of different performance indices and mixture types during the wear process. The fitting correlation coefficients between structural depth and wear duration (x) are all greater than 0.87, indicating an obvious linear relationship. Take the limestone mixture with deepened texture as an example, the fitting equation is y = −0.0086x + 1.0246, and R2 reaches 0.9146, suggesting that the structural depth shows a stable linear decline trend with the increase in wear duration, and this model has a high degree of explanation for the change in structural depth. This means that the change in structural depth under different wear durations can be predicted relatively accurately through this linear model. Mixtures with different aggregate types and texture states have different initial values and decline rates of structural depth. The limestone mixture without deepened texture has a relatively low initial structural depth, its fitting equation is y = −0.0045x + 0.7514, and the decline rate is slow, while the basalt mixture with deepened texture has a higher initial structural depth, the fitting equation is y = −0.0084x + 1.2014, and the decline rate is relatively fast.

Table 5.
Fitting results of construction depth and pendulum value.
The fitting correlation coefficients of some pendulum values are slightly lower than those of structural depth. For example, the correlation coefficients of longitudinal pendulum values of limestone (with deepened texture) and basalt (without deepened texture) mixtures are about 0.78, and the correlation coefficient of transverse pendulum values of basalt (with deepened texture) mixture is about 0.72. Nevertheless, on the whole, there is still a good linear relationship between the pendulum value after wear and the wear duration (x). Taking the longitudinal pendulum value as an example, the variation trends of pendulum values of different mixtures with wear duration are different. For the limestone mixture without deepened texture, the fitting equation is y = −0.3690x + 48.250, R2 is 0.9100, its initial pendulum value is high, but the decline rate is relatively slow; for the basalt mixture with deepened texture, the fitting equation is y = −0.5427x + 54.696, R2 is 0.8715, the initial pendulum value is higher, but the decline rate is faster. Similar differences also exist in the transverse pendulum values, reflecting the influence of different aggregate types and texture states on the change in pendulum values.
Both structural depth and pendulum value show a certain linear relationship with wear duration. Although the fitting correlation coefficients of some pendulum values are relatively low, they still indicate that their change laws can be predicted to a certain extent by linear models. These data provide a quantitative basis for in-depth understanding of the anti-skid performance changes of asphalt mixtures during the wear process and have important reference values for pavement design and maintenance decisions, which is helpful to predict the anti-skid performance of pavements under different service durations so as to take corresponding measures in time to ensure road safety.
Figure 8 presents the comparison between the predicted values and measured values of structural depth and pendulum values. Through the comparison of these data, the prediction accuracy of the linear model for the anti-skid performance indices of asphalt pavements can be intuitively evaluated. The correlation coefficient between the predicted value and measured value of structural depth is as high as 0.9893, and the fitting slope is 0.9879, which is extremely close to 1. This means that the fitting curve of structural depth almost coincides with the contour line. In the figure, each data point is closely distributed around the fitting curve, with extremely small dispersion. For example, when the measured structural depth is 0.8 mm, the predicted value is also very close to this value, indicating that the linear model can highly accurately describe the variation law of structural depth with wear duration. This fully shows that the linear model established based on different wear durations has extremely high prediction accuracy for structural depth and can reliably reflect the variation trend of structural depth under the conditions of indoor accelerated wear test, providing strong support for analyzing the decay law of anti-skid performance.
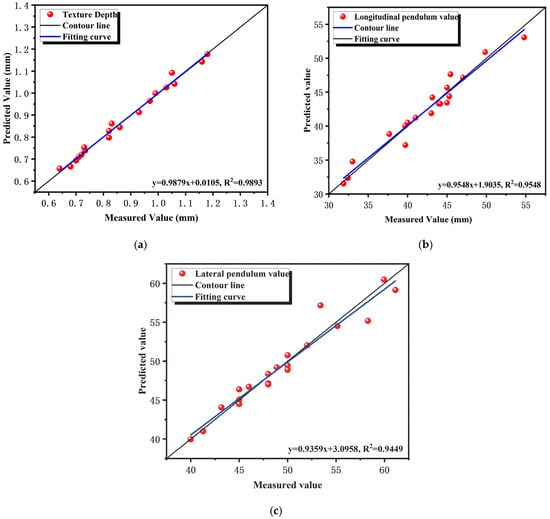
Figure 8.
Comparison between predicted and measured values. (a) Construction depth; (b) longitudinal deflection; (c) lateral deflection.
The predicted values and measured values of longitudinal pendulum values also have high correlation coefficients, and the fitting slopes also tend to 1. Although some data points may have certain deviations from the fitting curve in the figure, the data points are generally concentrated around the fitting curve. For example, when the measured longitudinal pendulum value is in the range of 45–50, the predicted value can well reflect this variation trend, indicating that the linear model also has high accuracy in predicting the change in longitudinal pendulum value and can effectively reflect the variation law of longitudinal pendulum value with wear duration.
The correlation coefficients between the predicted values and measured values of transverse pendulum values are also at a high level, and the fitting slopes are also close to 1. From the data distribution, although there are some fluctuations, the variation trends of predicted values and measured values are basically consistent on the whole. For example, during the increase in wear duration, the measured transverse pendulum value gradually decreases, the predicted value can also show a corresponding downward trend, and the prediction is more accurate at key numerical points, which further proves the effective description and prediction ability of the linear model for the change in transverse pendulum value.
The comparison results between the predicted values and measured values of structural depth and pendulum values in Figure 8 fully prove that the linear fitting model can effectively describe the variation laws of structural depth and pendulum values with wear duration (x). Whether it is structural depth or longitudinal and transverse pendulum values, the model can accurately predict the numerical changes under the conditions of the indoor accelerated wear test to a high degree, providing a reliable basis for in-depth study of the decay law of anti-skid performance, and has important engineering significance for optimizing pavement design and reasonably formulating maintenance strategies.
3.3. Analysis of Anti-Skid and Wear-Resistant Decay Laws of In-Service Highway Asphalt Pavements
In addition to indoor accelerated wear tests, this study comprehensively analyzes the evolution trend of anti-skid performance of asphalt concrete surfaces based on field anti-skid performance detection data from the G56 K2319 section of the Hangrui Expressway in different years, where the coarse aggregates used in the asphalt concrete surface course are all basalt.
3.3.1. Analysis of Structural Depth Decay Law
Figure 9 illustrates the annual structural depth changes in different lanes in the G56 K2319 section of the Hangrui Expressway from 2022 to 2024, clearly showing multi-faceted characteristics in data variations. The structural depths of the surface courses in the overtaking lane and driving lane generally exhibited a downward trend during 2022–2024. In 2022, the structural depths of the surface courses in both lanes were relatively high, with the maximum value of approximately 1.05 mm in the overtaking lane and 0.96 mm in the driving lane, showing similar distribution characteristics due to consistent initial pavement conditions. By 2023, the structural depth at each test point had decreased, and the differences in structural depth between lanes expanded. For example, the structural depth of test point 1 in the overtaking lane decreased from approximately 0.97 mm in 2022 to 0.66 mm in 2023, and that of test point 1 in the driving lane decreased from 0.89 mm to 0.62 mm, indicating that factors such as vehicle loads, driving paths, and speeds gradually influenced the wear of the surface course. By 2024, the decline in structural depth tended to flatten, and slight rebounds were observed in the structural depth of overtaking-lane test point 3, as well as driving-lane test points 2 and 3. The structural depth of overtaking-lane test point 3 rebounded from approximately 0.51 mm in 2023 to 0.59 mm in 2024, and that of driving-lane test point 2 rebounded from 0.49 mm to 0.56 mm, suggesting that surface course wear gradually reached a stable state. In local areas, the structural depth may have recovered due to reduced wear rates or extrusion from vehicle loads.
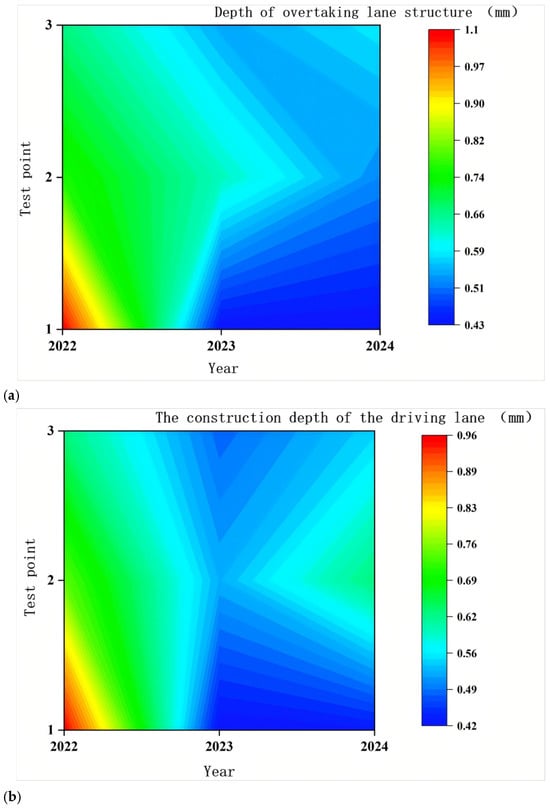
Figure 9.
Annual structural depth attenuation law of G56-K2319 road section. (a) Overtaking lane; (b) driving lane.
In terms of annual averages, the annual average structural depths of the overtaking lane in 2022, 2023, and 2024 were 0.83 mm, 0.53 mm, and 0.51 mm, respectively, while those of the driving lane were 0.78 mm, 0.47 mm, and 0.53 mm. Although the overall trend was a decrease in structural depth, the annual average structural depth of the driving lane in 2024 was slightly higher than that in 2023, further confirming the variation of structural depth in local areas. This variation reflects that during long-term use, although the anti-skid performance of the pavement generally decays, different variation trends occur in specific stages and areas, which are closely related to factors such as vehicle load distribution, traffic flow characteristics, and material properties.
The structural depths of the overtaking lane and driving lane show a decay trend in anti-skid performance due to wear during long-term use. However, after a certain period, pavement wear tends to stabilize, and slight rebounds in structural depth occur in local areas. To enhance the anti-skid performance of basalt asphalt concrete surfaces and delay their decay, measures such as introducing deepened-texture technology, strengthening regular maintenance, and optimizing pavement structure design can be adopted to adapt to the long-term effects of traffic loads and road safety requirements.
3.3.2. Analysis of Pendulum Value Evolution Law
Figure 10 presents the annual pendulum value changes of different lanes in the G56 K2319 section of the Hangrui Expressway from 2022 to 2024, containing rich information that reflects the variation characteristics of pavement anti-skid performance across different lanes and time dimensions.
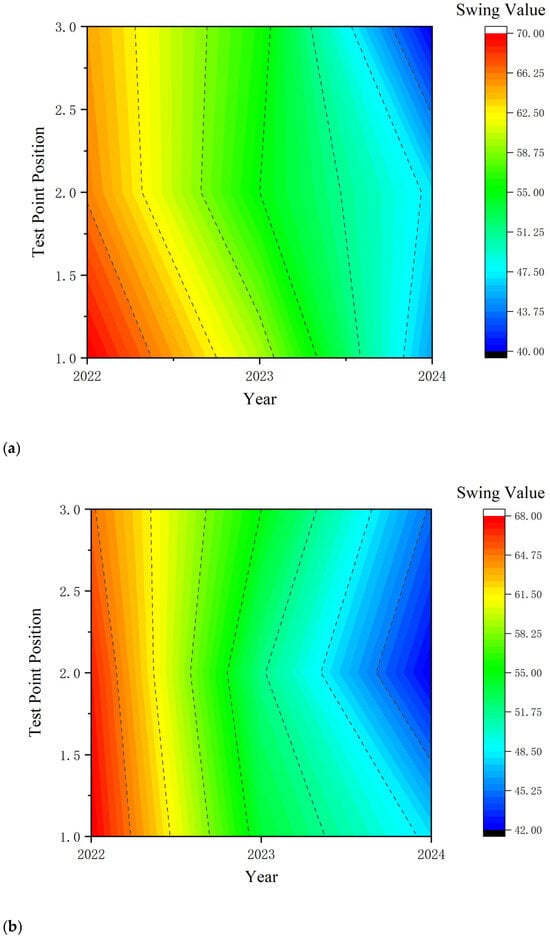
Figure 10.
Annual deflection attenuation law of G56-K2319 road section. (a) Overtaking lane; (b) driving lane.
During 2022–2024, the pendulum values of the surface courses in both the overtaking lane and driving lane showed an overall downward trend. In 2022, the pendulum values of the asphalt pavement surfaces in both lanes were relatively high, with the maximum value reaching 70 in the overtaking lane and 68 in the driving lane, exhibiting distribution characteristics similar to those of structural depth. Since 2023, pendulum values at all test points have decreased, with the decay amplitude in the overtaking lane being milder than that in the driving lane. For example, the pendulum value of test point 1 in the overtaking lane decreased from approximately 68 in 2022 to 61 in 2023, while that of test point 1 in the driving lane decreased from 64 to 58. By 2024, pendulum values in both lanes had dropped to lower levels (minimum 40 in the overtaking lane and 42 in the driving lane), and the decay rate tended to stabilize, indicating that pavement anti-skid performance gradually deteriorates with time and vehicle loads, tending to stabilize in the later stage.
In terms of annual averages, the annual mean pendulum values of the overtaking lane in 2022, 2023, and 2024 were 67, 57, and 44, respectively, while those of the driving lane were 67, 54, and 45. The continuous decline in pendulum values further confirms the annual decay of pavement anti-skid performance. Meanwhile, the slight increase in the driving lane’s pendulum value in 2024, though small, reflects the complexity of anti-skid performance changes, which is closely related to the actual operating environment rather than a single factor. Influenced by vehicle loads, driving paths, and speeds, the overtaking and driving lanes exhibit different wear characteristics during service:
The driving lane, with more large vehicles, stable speeds, and low lane-changing demands, undergoes greater pavement loads, resulting in faster wear, lower pendulum values, and smaller fluctuations.
The overtaking lane, dominated by passenger cars with high driving speeds, experiences relatively slower wear, maintaining higher overall pendulum values with smaller decay amplitudes. However, frequent lane changes by passenger cars lead to greater unevenness in pendulum values—for example, in 2023, pendulum values at each test point in the driving lane were relatively concentrated, while those in the overtaking lane showed larger dispersion.
The data in Figure 10 indicate that anti-skid performance varies significantly between lanes, influenced by multiple comprehensive factors. These variation characteristics provide important references for road management departments to formulate targeted maintenance strategies, helping to promptly implement measures to enhance pavement anti-skid performance and ensure traffic safety.
Basalt’s high hardness prevents groove collapse. The artificially grooved structure (depth ~1.2 mm initially) resists tire pressure, with wear primarily occurring on groove edges—slowing texture depth decay (1.07 mm after 13 h). Limestone’s grooves, however, rely on weak aggregate bonds. Under repeated loading, the groove walls (composed of soft limestone) crumble, causing the grooves to shallow and merge. This leads to a faster drop in texture depth (from 1.06 mm to 0.93 mm after 13 h) and uneven surface morphology, further reducing friction.
Wear is dominated by the flattening of natural aggregate protrusions. Basalt’s harder protrusions wear more slowly (initial texture depth 0.85 mm vs. limestone’s 0.76 mm), maintaining a larger macro-texture for longer. Limestone’s soft surface is quickly smoothed by tire rubber, reducing the “interlocking” effect between tire tread and aggregate micro-roughness. This explains why its pendulum value decays faster than basalt’s (e.g., transverse pendulum value of limestone drops from 50 to 48 after 21 h, while basalt’s remains at 58). Basalt’s hard surface retains micro-roughness, as polishing only removes weak surface layers without eliminating the underlying crystalline irregularities—sustaining higher friction.
The initial asphalt film on both aggregates acts as a lubricant (reducing friction) but is gradually worn off during the early wear stage (0–3 h). For basalt, the remaining asphalt film tightly binds aggregates, minimizing loose particle loss. For limestone, weaker adhesion causes the asphalt film to peel off in larger patches, exposing more soft aggregate surfaces to direct polishing—accelerating both macro- and micro-texture degradation.
3.3.3. Fitting Analysis of Indoor and Field Data on Pavement Surface Anti-Skid and Wear-Resistant Performance
Figure 11 shows the comparison of structural depth data between field detection and indoor accelerated wear tests for basalt (without deepened texture) in the G56 K2319 section of the Hangrui Expressway. Analysis of these data reveals the following variation characteristics:
y = −0.0074x + 0.8496, R2 = 0.92
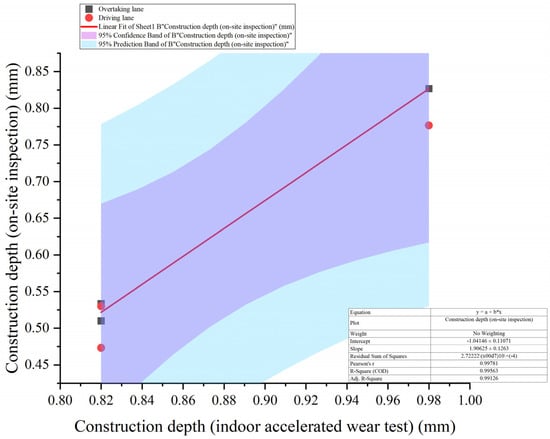
Figure 11.
Comparison and analysis of annual average structural depth indoor and outdoor data.
Although there are certain differences in structural depth between field detection and indoor accelerated wear tests, the two still exhibit a good linear relationship. It can be seen from the figure that the fitting curves of both the overtaking lane and driving lane have high correlation coefficients, indicating that the indoor accelerated wear test can simulate the variation trend of structural depth of actual pavements with time to a certain extent. After three years of operational wear, the average structural depths of the driving lane and overtaking lane measured on site are 0.53 mm and 0.51 mm, respectively. Using the fitting formula of indoor wear time and structural depth (Formula (1)), it is calculated that the average structural depth (0.52 mm) of the measured pavement after three years of operational wear roughly corresponds to the wear effect of asphalt pavement surfaces under 44.5 h of indoor accelerated wear. This indicates that the indoor accelerated wear test has a certain accuracy in predicting the wear condition of actual pavements and can provide a reference for evaluating the anti-skid performance of actual pavements in different service years. The correlation between indoor accelerated wear test data and field detection data provides convenience for researchers and road managers. Through indoor accelerated wear tests, structural depth data under different wear durations can be obtained in a relatively short time, thereby predicting the change in anti-skid performance of actual pavements during long-term use, which helps to formulate reasonable pavement maintenance plans in advance and improve road safety and durability.
Figure 12 focuses on the fitting between the longitudinal deflection values of basalt (undeepened structure) indoor wear specimens and the field data during on-site testing and indoor accelerated wear tests on the K2319 section of Hangrui Expressway (G56). The data variation characteristics are significant, which is of great significance for studying the anti-skid performance of road surfaces.
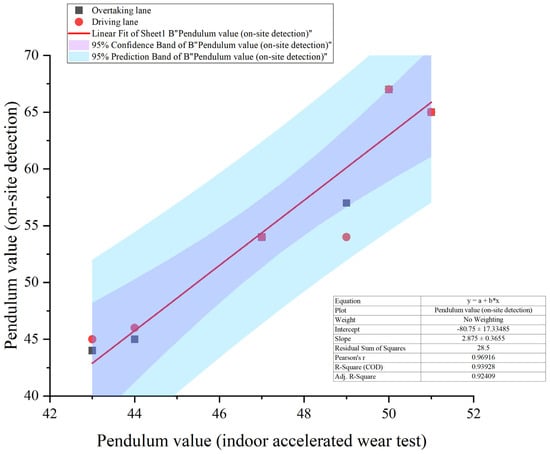
Figure 12.
Comparison and analysis of annual average swing values between indoor and outdoor data.
The on-site measured swing data shows a good linear relationship with the swing data obtained from indoor accelerated wear tests. Among them, the correlation coefficient of the fitting curve of the overtaking lane reached 0.9034, indicating a high degree of fitting between the indoor and on-site swing data of the overtaking lane. The indoor acceleration wear test has a good simulation effect on the trend of the overtaking lane swing value change. Although the correlation between the lane fitting curve is slightly weak, with a correlation coefficient of 0.7737, overall it still reflects a linear correlation between the two. This means that it is feasible to study the changes in road surface deflection and predict the actual anti-skid performance of the road surface through indoor accelerated wear tests.
Based on the measured data, taking the minimum swing value of asphalt pavement worn out in three years of operation as 40 (the minimum swing value of overtaking lane in 2024) as an example, using the existing prediction formula between indoor acceleration wear duration and swing value (y = −0.2330x + 44.924, R2 = 0.7842), it is calculated that the wear effect of asphalt pavement worn out in three years is equivalent to about 21.1 h of indoor acceleration wear. This data provides a quantitative basis for evaluating the degradation of anti-skid performance of actual road surfaces under different service years, which helps road management departments and researchers to intuitively understand the degree of change in anti-skid performance of road surfaces.
The data variation characteristics in Figure 12 not only confirm the linear relationship between on-site and indoor swing data but also provide an effective method for predicting road anti-skid performance. By conducting indoor accelerated wear tests, it is possible to simulate wear conditions of different durations in a laboratory environment. Combined with on-site data fitting analysis, it is possible to more accurately grasp the changes in road anti-skid performance over time. This has important guiding significance for formulating road maintenance plans in advance, arranging maintenance measures reasonably, and ensuring road driving safety, which helps to improve the scientificity and economy of road maintenance.
A comparative analysis of the two sets of data on the structural depth and pendulum values of asphalt pavement surfaces after three years of operation reveals that when indoor accelerated wear achieves effects comparable to field-measured data, a longer accelerated wear time is required when using the structural depth evaluation index, whereas a shorter accelerated wear time is needed when using the pendulum value evaluation index. This is because the wear of structural depth is more difficult, which is closely related to factors such as aggregate properties, vehicle loads, and the external environment. The pendulum value index, which characterizes the anti-skid performance of asphalt pavements, is not only affected by the wear of the pavement surface but also, more significantly, by the polishing of the pavement surface. This leads to the decay rate of the pavement’s anti-skid performance being faster than the wear rate of the structure. Therefore, when using indoor accelerated wear test data to predict the anti-skid and wear-resistant performance of asphalt pavements during actual operation, it is recommended to adopt the most unfavorable conditions; that is, use the predicted values of pendulum values while taking the predicted values of structural depth as an auxiliary decision-making basis for improving the anti-skid and wear-resistant performance of pavements. Through the above analysis, the indoor accelerated wear test can provide an effective basis for predicting the long-term anti-skid performance of pavements and offer a theoretical foundation for formulating pavement maintenance measures at different wear stages.
4. Conclusions
Through comparative studies on the anti-skid and wear-resistant performance of asphalt pavement surfaces in laboratory and field conditions, combined with indoor accelerated wear tests and field measurements, this study explored the decay laws of anti-skid and wear-resistant performance of asphalt mixture surfaces under different wear durations, aggregate types, and deepened-texture states via grinding and grooving. The decay laws of anti-skid and wear-resistant performance of asphalt pavements in different lanes and service years based on field detection were clarified. The main conclusions are as follows.
(1) Basalt mixtures exhibit superior anti-skid and wear-resistant performance compared to limestone mixtures. The initial structural depth of basalt mixtures (0.85 mm) is 11.8% higher than that of limestone (0.76 mm), and after 21 h of wear, their structural depth (0.68 mm) shows a 23.6% lower decay rate. Deepened-texture technology significantly enhances basalt performance, with its pendulum value remaining above 50 after 13 h of wear, while limestone mixtures show a sharp decline in pendulum value (from 40 to 36) due to low mineral hardness, limiting the applicability of deepened-texture technology for limestone.
(2) The influence of factors on anti-skid performance varies by index: structural depth is most affected by deepened-texture state (F-value = 261.436), followed by wear duration and aggregate type; transverse pendulum value is jointly influenced by wear duration (F-value = 14.328), deepened-texture state, and aggregate type; longitudinal pendulum value is primarily affected by wear duration (F-value = 29.166).
(3) Structural depth and pendulum values show significant linear relationships with wear duration, with prediction models demonstrating high reliability (structural depth R2 > 0.87, pendulum values R2 > 0.71). Indoor accelerated wear tests effectively simulate field conditions: 44.5 h of indoor wear corresponds to 3 years of field service for structural depth and 21.1 h for pendulum values.
(4) Field data from the G56 K2319 section reveal differential wear characteristics between lanes: the driving lane exhibits faster structural depth decay due to heavier loads, while the overtaking lane maintains higher pendulum values with slower decay. Maintenance should be initiated when structural depth ≤ 0.6 mm or pendulum value ≤ 45 (equivalent to ~13 h of indoor wear) to prevent rapid performance degradation.
Author Contributions
Conceptualization, S.Z., P.H. and Z.Z.; methodology, L.C.; software, J.M.; validation, S.Z., P.H. and J.M.; formal analysis, J.M.; investigation, Z.Z.; resources, S.Z.; data curation, L.C.; writing—original draft preparation, Z.Z.; writing—review and editing, Z.Z.; visualization, Z.Z.; supervision, S.Z., P.H. and J.M.; project administration, Z.Z.; funding acquisition, J.M. All authors have read and agreed to the published version of the manuscript.
Funding
This research was funded by the Yunnan Provincial Department of Transportation Science and Technology Innovation and Demonstration Project, 2022-81; the post-doctoral research and development project of Yunnan Transportation Planning and Design Institute Co., Ltd. (YJSJ-BSHYF-2022-01); the Science and Technology Plan Project of Yunnan Provincial Department of Science and Technology (202401AT070060); and the Science and Technology Plan Project of Yunnan Provincial Department of Science and Technology (202301AT070413).
Data Availability Statement
The original contributions presented in this study are included in the article. Further inquiries can be directed to the corresponding author.
Conflicts of Interest
Shaopeng Zheng, Zilong Zhang and Jian Ma were employed by the company Construction Project Headquarters of Nujiang Beautiful Highway Greenway. Shaopeng Zheng and Liangliang Chen were employed by the company Yunnan Provincial Transportation Planning and Design Research Institute Co., Ltd. The remaining authors declare that the research was conducted in the absence of any commercial or financial relationships that could be construed as a potential conflicts of interest.
References
- Zheng, N.; Bi, J.; Dong, S.; Lei, J.; He, Y.; Cui, Z.; Chen, L. Testing and evaluation for long-term skid resistance of asphalt pavement composite seal using texture characteristics. Constr. Build. Mater. 2022, 356, 129241. [Google Scholar] [CrossRef]
- Li, S.; Liu, Z. Using bauxite as alternative for coarse aggregate in asphalt mixture: Improving skid resistance. Constr. Build. Mater. 2023, 394, 131915. [Google Scholar] [CrossRef]
- Xiao, M.; Cheng, W. Mechanism analysis of anti-skid performance attenuation of wet pavement based on micro-interface. Int. J. Pavement Res. Technol. 2024, 17, 1180–1192. [Google Scholar] [CrossRef]
- Wang, W.; Liu, B.; Jin, D.; Yu, M.; Zeng, J. Durability Investigation of Ultra-Thin Polyurethane Wearing Course for Asphalt Pavement. Materials 2024, 17, 4977. [Google Scholar] [CrossRef]
- Wang, Y.; Li, R.; Chen, R.; Huang, R. Experimental Analysis on the Friction Performance of Improved Soil Stabilized by Lime in Subgrade. J. Frict. Wear 2024, 45, 245–253. [Google Scholar] [CrossRef]
- Wang, T.; Ma, J.; Ma, J.; Cai, X.; Cui, Y.; Ning, R.; Li, J. Understanding progressive aging of bitumen-rubber composite binder and its separate phases considering biphase interactions. Mater. Struct. 2024, 57, 176. [Google Scholar] [CrossRef]
- Wang, H.; Qian, J.; Liu, J.; Nan, X.; Qu, S.; Li, X.; Liu, Y. Wear resistance analysis of steel slag aggregates based on morphology characteristics. Constr. Build. Mater. 2023, 409, 133649. [Google Scholar] [CrossRef]
- Yu, Y.; Tang, S.; Xu, G.; Fan, Y.; Wu, Y.; Wang, H.; Yang, J. Investigations on the long-term skid resistance of epoxy asphalt mixture based on accelerated loading test. Constr. Build. Mater. 2023, 365, 130150. [Google Scholar] [CrossRef]
- Kandji, M.; Fournier, B.; Duchesne, J.; Doucet, F. Effect of polishing time, mechanisms and mineralogy on the microtexture evolution and polishing resistance of pavement surface aggregates. Constr. Build. Mater. 2025, 476, 141105. [Google Scholar] [CrossRef]
- Cui, P.; Wu, S.; Xiao, Y.; Yang, C.; Wang, F. Enhancement mechanism of skid resistance in preventive maintenance of asphalt pavement by steel slag based on micro-surfacing. Constr. Build. Mater. 2020, 239, 117870. [Google Scholar] [CrossRef]
- Wang, C.; Lan, X.; Cong, Y.; Peng, S.; Huang, S.; Chen, Q. Evaluation of skid resistance of pavement maintenance energy-absorbing seal based on surface texture characteristics. Measurement 2025, 245, 116588. [Google Scholar] [CrossRef]
- Xue, X.; Zheng, X.; Guan, B.; Liu, J.; Ding, D.; Xiong, R.; Zhao, H.; Wei, F. Long-term skid resistance of high-friction surface treatment of pavement using high-alumina refractory waste. Constr. Build. Mater. 2022, 351, 128961. [Google Scholar] [CrossRef]
- Rith, M.; Kim, Y.K.; Lee, S.W. Characterization of long-term skid resistance in exposed aggregate concrete pavement—ScienceDirect. Constr. Build. Mater. 2020, 256, 119423. [Google Scholar] [CrossRef]
- Zong, Y.; Li, S.; Zhang, J.; Zhai, J.; Xiong, R. Effect of aggregate type and polishing level on the long-term skid resistance of thin friction course. Constr. Build. Mater. 2021, 282, 122730. [Google Scholar] [CrossRef]
- Wang, Y.; Lai, X.; Zhou, F.; Xue, J. Evaluation of Pavement Skid Resistance Using Surface Three-Dimensional Texture Data. Coatings 2020, 10, 162. [Google Scholar] [CrossRef]
- Sengoz, B.; Onsori, A.; Topal, A. Effect of aggregate shape on the surface properties of flexible pavement. KSCE J. Civ. Eng. 2014, 18, 1364–1371. [Google Scholar] [CrossRef]
- Alavi, M.Z.; Ahmadi, A.; Movahed, F.V. How aggregate gradation and layer thickness influence asphalt microsurfacing texture and skid resistance. Constr. Build. Mater. 2025, 481, 141482. [Google Scholar] [CrossRef]
- Ding, S.; Wang, K.C.P.; Yang, E.; Zhan, Y. Influence of effective texture depth on pavement friction based on 3D texture area. Constr. Build. Mater. 2021, 287, 123002. [Google Scholar] [CrossRef]
- Xue, Y.; Li, P.; Jiang, S.; Thom, N.; Yang, X. Evaluation of skid resistance of asphalt pavement covered with aeolian sand in desert areas. Wear 2023, 516–517, 204620. [Google Scholar] [CrossRef]
- Wang, H.; Fan, W.; Chi, M.; Li, Y.; Zhang, X.; Xu, Z.; Jiang, S. Wear resistance and skid resistance of 100% reclaimed asphalt pavement. Constr. Build. Mater. 2025, 468, 140373. [Google Scholar] [CrossRef]
- Zhu, S.; Ji, X.; Yuan, H.; Li, H.; Xu, X. Long-term skid resistance and prediction model of asphalt pavement by accelerated pavement testing. Constr. Build. Mater. 2023, 375, 131004. [Google Scholar] [CrossRef]
- Yu, M.; Yang, Z.; You, Z.; Luo, Y.; Li, J.; Yang, L. Laboratory investigation of traffic effect on the long-term skid resistance of asphalt pavements. Constr. Build. Mater. 2023, 401, 132642. [Google Scholar] [CrossRef]
- Peng, W.; Li, P.; Gao, J.; Liu, Z.; Wang, X.; Wang, S.; Wu, W. Long-term skid resistance evolution and influence mechanism of asphalt pavement based on self-developed wear equipment. Constr. Build. Mater. 2024, 453, 139085. [Google Scholar] [CrossRef]
- Chen, W.; Zhang, J.; Qi, X.; Tian, P.; Feng, Z.; Qin, W.; Wu, D.; Liu, L.; Wang, Y. Recent Progress on Anti-Slip and Highly Wear-Resistant Elastic Coatings: An Overview. Coatings 2023, 14, 47. [Google Scholar] [CrossRef]
- Daneshvari, M.H.; Mojaradi, B.; Ameri, M.; Nourmohammadi, E. Hybrid texture analysis of 2D images for detecting asphalt pavement bleeding and raveling using tree-based ensemble methods. Alex. Eng. J. 2024, 107, 150–164. [Google Scholar] [CrossRef]
- Yaofei, L.; Xingchen, Z.; Ke, Z.; Xiaoge, S.; Guanghui, L. Research on skid-resistance durability of high viscosity modified asphalt mixture by accelerated abrasion test. Case Stud. Constr. Mater. 2024, 20, e02878. [Google Scholar] [CrossRef]
- Yang, L.; Liu, J.; Tu, H.; Gong, H.; Li, H. Optimizing pavement skid resistance measurement with texture resolution sensitivity indices. Measurement 2025, 249, 116986. [Google Scholar] [CrossRef]
- Yan, C.; Li, Q.; Wang, J.; Yang, H.; Wu, Y. Evaluation for long-term skid resistance of ultra-thin asphalt overlay based on texture characteristics. Constr. Build. Mater. 2024, 438, 137151. [Google Scholar] [CrossRef]
- Kane, M.; Lim, M.; Do, M.T.; Edmondson, V. A new predictive skid resistance model (PSRM) for pavement evolution due to texture polishing by traffic. Constr. Build. Mater. 2022, 342, 128052. [Google Scholar] [CrossRef]
- Fan, J.; Jiang, Y.; Yi, Y.; Tian, T.; Yuan, K.; Xue, J. Effects of load and environment on the durability and anti-skid performance of road heat-reflective coating. Constr. Build. Mater. 2022, 346, 128520. [Google Scholar] [CrossRef]
- Guo, F.; Zhang, J.; Pei, J.; He, H.; Yao, T.; Wang, D. Impact of Macrotexture and Microtexture on the Skid Resistance of Asphalt Pavement Using Three-Dimensional (3D) Reconstruction and Printing Technology. Materials 2025, 18, 2597. [Google Scholar] [CrossRef] [PubMed]
- Ren, W.; Li, J.; Zhang, Y.; Wang, X.; Shao, R. Road Surface Texture Evaluation and Relation to Low-Speed Skid Resistance for Different Types of Mixtures. Coatings 2024, 14, 1367. [Google Scholar] [CrossRef]
- Pratico, F.G.; Vaiana, R. A study on the relationship between mean texture depth and mean profile depth of asphalt pavements. Constr. Build. Mater. 2015, 101, 72–79. [Google Scholar] [CrossRef]
- Yun, D.; Tang, C.; Gao, J.; Ran, M.; Zhou, X. Effect of asphalt mixture gradation characteristics on long-term skid resistance under high temperature and heavy load. Constr. Build. Mater. 2024, 441, 137386. [Google Scholar] [CrossRef]
- Zhao, W.; Zhang, J.; Lai, J.; Shi, X.; Xu, Z. Skid resistance of cement concrete pavement in highway tunnel: A review. Constr. Build. Mater. 2023, 406, 133235. [Google Scholar] [CrossRef]
- Luo, H.; Chen, S.; Zheng, Y.; Wu, X.; Chen, C.; Huang, X. Improving skid-resistance durability of ultra-thin friction course in asphalt pavements through recycled steel slags as basalt replacements. Constr. Build. Mater. 2024, 426, 136138. [Google Scholar] [CrossRef]
- JTG E20-2011; Test Code for Asphalt and Asphalt Mixtures in Highway Engineering. People’s Communications Press: Beijing, China, 2011.
- JTG F40-2004; Technical Specification for Asphalt Pavement Construction on Highways. People’s Communications Press: Beijing, China, 2004.
- JTG E60-2008; On Site Testing Procedures for Highway Subgrade and Pavement. People’s Communications Press: Beijing, China, 2008.
Disclaimer/Publisher’s Note: The statements, opinions and data contained in all publications are solely those of the individual author(s) and contributor(s) and not of MDPI and/or the editor(s). MDPI and/or the editor(s) disclaim responsibility for any injury to people or property resulting from any ideas, methods, instructions or products referred to in the content. |
© 2025 by the authors. Licensee MDPI, Basel, Switzerland. This article is an open access article distributed under the terms and conditions of the Creative Commons Attribution (CC BY) license (https://creativecommons.org/licenses/by/4.0/).