Abstract
Rail corrugation and roughness represent typical irregularities on railway and tramway tracks, which cause increased dynamic forces, high-frequency vibrations, reduced riding comfort, shorter track lifespan, higher maintenance costs, and increased noise levels. Roughness and corrugation can be measured by evaluating the unevenness of the rail longitudinal running surface, which can be conducted using handheld devices or trolleys (directly on the track). Alternatively, vehicle or track-based indirect methods offer practical solutions for determining the condition of the rail running surface. This paper presents a methodology for rail corrugation and roughness evaluation, using bogie frame vibration data from an instrumented in-service tramway vehicle operating on Zagreb’s tramway network. Furthermore, it investigates the effects of various factors on the evaluation method, including wheel roughness, lateral positioning, signal processing methods, horizontal geometry, wheel–rail contact force, and tramway vehicle vibroacoustic characteristics. It was concluded that a simplified methodology that did not include transfer functions or wheel roughness measurements yielded relatively good results for evaluating rail corrugation and roughness across several wavelength bands. To improve the presented methodology, future research should assess the vehicle’s vibroacoustic characteristics with experimental hammer impact tests, measure the influence of wheel roughness on wheel–rail contact and bogie vibrations, and refine the measurement campaign by increasing test runs, limiting speed variation, and conducting controlled tests.
1. Introduction
Traffic noise and vibration can have a big influence on the living standard in urban areas. It is important to find solutions that can effectively define sources of noise and vibration, measure their magnitude, and use effective prevention and mitigation measures. The tramway network in the city of Zagreb runs through the tight city streets close to residential and business buildings, and thus tramway traffic-induced noise and vibration have a significant influence on the residents as well as passengers who are using public transport [1]. Rail irregularities and defects are identified as one of the main causes of noise and vibration generated at the wheel–rail interface, which can lead to disturbances for the occupants in the nearby buildings [2,3], deteriorate ride quality [4], and increase maintenance costs for the track and the vehicles. Such irregularities directly result from wheel–rail contact, when a railway vehicle operates on the rail or tramway network [5,6,7,8,9].
Determining and detecting the source of noise and vibration on the track is a big challenge, especially for large rail networks. To find a more efficient method for rail corrugation detection, the growth rate of corrugation, and maintenance of the track, tramway in-service vehicle bogie frame acceleration measurements were used to evaluate the condition of the railhead running surface on the tram network in the city of Zagreb.
1.1. Rail Corrugation and Rail Roughness
Rail corrugation represents one of the most common irregularities found on railway tracks, particularly tram tracks, due to their unique geometry with very tight curves implemented to integrate tram tracks into existing urban road networks. It is a phenomenon where regular wavelength roughness patterns are formed on the railhead running surface by passing vehicles. Corrugation can be evaluated by measuring the rail unevenness of the track, according to the rail grinding and reprofiling criteria (EN 13231-3 standard) [10], and additionally, according to the acoustic rail roughness measurement in third-octave bands (EN 15610 standard) [11].
One type of rail corrugation, so-called “rutting” (short pitch) corrugation, is exceedingly widespread on railway and tramway tracks, both on ballasted and ballastless tracks. It has the characteristic appearance of shiny crests and worn troughs (of about 50 mm wavelengths), which spread out onto the whole width of the railhead [12]. Usually, it can be found in curves, at braking sites, and stations, especially if the rotation of the wheels is constrained [5,7,13,14].
The abovementioned type of corrugation is of the highest interest for measurements and analysis of railhead running surface on tramway (urban) tracks, and in that way is directly connected to the research presented in this paper. In [15], as a part of the research on rail corrugation forming on the tram track, the formation of corrugation was analyzed at different micro-locations on the tramway track in Zagreb. It was confirmed that rutting corrugation (Figure 1) occurs in curves with smaller radii (below 300 m), more often on the lower rail, and in the tramway station areas, most likely due to decelerating/braking.
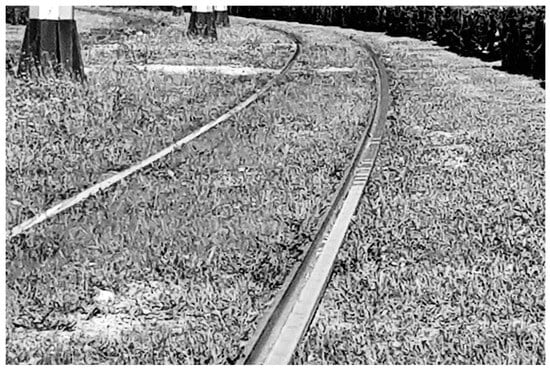
Figure 1.
Corrugated railhead running surface on a tramway track in the city of Zagreb.
Furthermore, the development of rutting corrugation was investigated on a straight track, where traction or braking is particularly severe [16], as well as on the low rail of a small radius curve, using numerical simulation, field, and laboratory data [5,7,13]. In [6], different track configurations were tested to inspect and predict rail corrugation growth, as well as different rail metallurgies (head-hardened rails) [16,17].
There have been many approaches for preventing corrugation [13], but when corrugation already exists, rail grinding is the only option that is generally advised [17], as a mere strategy to lower the impact of the problem. The cost of the grinding process has led to the development of new, more affordable preventative measures, such as modifying the characteristics of axles and bogies [13] or actively managing railway vehicles [18], as well as unsprung mass modification. Lubrication control [19], change of the friction coefficient [20], and wheel–rail conformity [21] represent techniques for modifying wheel–rail contact. Furthermore, the authors used various numeric models of the railway track and vehicle [19], different types of rail pads with varying stiffness [22], as well as measuring and modeling dynamic wheel–rail contact forces, to investigate the effect of the aforementioned parameters on the growth of rail corrugation [23,24].
1.2. Evaluation of Rail Corrugation and Rail Roughness
There are two different approaches to measuring rail roughness and rail corrugation: direct measurements and indirect measurements. Direct measurements represent railhead running surface roughness estimations in absolute terms; they are unaffected by railway-related disturbances and enable the separation of rail and wheel contributions. However, for some direct measurement methods, it is often necessary to stop railway or tramway traffic in the measurement zone. The acquisition in both space and time is constrained by this, as well as the operational limitations imposed by direct measuring devices [24]. Both rail roughness and corrugation can be measured with a manual device placed directly on the rail head and handheld [15,25], but also with trolley-type devices that are pushed continuously on the track and can use either acceleration or a displacement sensor for measurements [9,26]. The main drawback of handheld devices is that, while they can be used for long-term monitoring and measurement of long railway or tramway sections, their use is exceedingly time-consuming and inadequate for continuous, long-term measurements compared with indirect methods [15].
A trolley-type device with an acceleration sensor assesses the condition of the railhead running surface by calculating the double integral of the acceleration value [26], and also different types using displacement sensors and multiple sensors with the chord-based sensor, used as a part of the research [27]. However, the methodology for converting acceleration to displacement using double integration has limitations such as low-frequency drift, sensor constraints, and baseline errors. This can be mitigated by using high-pass filtering, advanced signal processing (e.g., wavelet denoising, Kalman filtering), and sensor calibration [28]. Additionally, baseline errors are addressed through quality checks that evaluate results to known reference data, as well as the use of statistical methods to detect and correct outlier data segments [16,27]. Some alternative direct contactless methods rely on optical methods or sensors that are physically mounted to wheels [29], as well as image classification-based methods for identifying defects (ultrasonic sensors) [30].
On the other hand, indirect measurements concentrate on characteristics originating from wheel–rail interaction, such as noise in the bogie area or wheelset vibrations (from which combined (effective) roughness can be determined), and noise and vibrations measured on the track or close to the track. There are two different types of indirect measurements: 1. Vehicle-based indirect measurements—dependent on various mounting positions of installed accelerometers [23,24,26,31,32] or microphones [33,34,35]. 2. Track-based indirect measurements—if the accelerometers are mounted on the track, along with microphones installed in the close vicinity to the track [36,37,38].
In this research, vehicle-based indirect measurements were used to derive combined effective roughness from bogie frame accelerations. Combined effective roughness describes the combined influence of rail and wheel roughness on the overall performance of the vehicle’s vertical motion [39], and it was represented as vertical displacement data in this paper.
1.3. Vehicle-Based Indirect Measurements
When imperfections in the wheel and track’s running surfaces are excited, an accelerometer registers the vertical motion of the axle-box (or bogie frame). There are several approaches to analyzing vibrations coming from the axle-box (or bogie frame) accelerations, and their connection with the condition of the track, that researchers have inspected in recent years [40,41,42,43,44]. Measurements on the longer railway sections could be possible with indirect measurement systems, something that contributes to overcoming the constraints of direct measurement systems regarding measured track length. Axle-box accelerometers are widely used in several vehicle-based indirect measurement systems to inspect the general condition of the track and vibration response connected to the rail running surface condition [4,45,46]. However, there are some shortcomings with current vehicle-based indirect measurement methods, obscuring the signal from other vibration sources, as well as acoustic and vibration disturbances [31].
To derive rail roughness spectra from on-board acoustic recordings, frequency-dependent transfer functions have recently been presented, along with the development of a technical report with guidelines for measuring combined effective roughness, track decay rate, and determination of transfer functions [45,47]. Furthermore, the frequency range can have a huge influence on axle-box acceleration data accuracy, and consequently on the accuracy of transfer functions that are measured during calibration tests, as well as the unpredictability of track dynamics parameters that can also have a significant impact on the abovementioned transfer functions [24,48].
There are several measuring systems and methodologies that vary in the placement and number of sensors [27,49], as well as in the calculation approach for transfer functions [38]. Detection and classification of different track singularities and vibration modes in both time and frequency domains were presented in [50]. The method that estimates the time series of the roughness from the time series of axle—box acceleration (ABA) and is based on a previously developed time-domain model “WERAN” [51] for high-frequency wheel–rail interaction, is described in [51,52]. Simple root mean square (RMS) analyses [53] have also been used to examine ABA measurements. Several improvements to identify defects, such as corrugation and squats, were made as a part of ABA measurements on Dutch railways [54]. However, because rail roughness and rail corrugation depend on vehicle speed, the dynamic characteristics of the vehicle and track, as well as wheel roughness, vehicle-based indirect measurements alone cannot estimate rail surface roughness or evaluate rail corrugation in absolute terms.
1.4. Deriving Rail Roughness from Axle-Box Acceleration
The methodology of estimating rail roughness using vehicle-based indirect measurements is illustrated in Figure 2 as a part of the research in [24]. They used a multi-sensor approach, numerical and experimental approaches to estimate transfer function, and inspected the influence of various track parameters to find the most suitable method for deriving the rail roughness from vibroacoustic signals. To calculate rail roughness, ABA measurements had to be processed, which required an understanding of vertical vehicle-track dynamics [48,55,56].
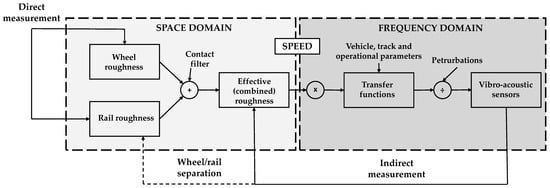
Figure 2.
Simplified model of railway noise generation; Space domain (light grey); Frequency domain (dark grey) [24].
Furthermore, to derive rail roughness from effective combined roughness (indirect measurements), two parameters were needed: 1. Wheel roughness and transfer functions for resilient wheel, and 2. Propagation of vibration from the contact point (wheel–rail) to the axle-box or bogie frame, where accelerometers are installed [24,43,57].
2. Materials and Methods
As a part of the research on the Zagreb tramway network, with a final goal to derive rail roughness from bogie frame accelerations, vehicle-based indirect measurements have been conducted on an instrumented in-service tramway vehicle. Additionally, rail roughness measurements were made directly on the railhead running surface (with a handheld device) for validation.
To investigate rail corrugation, an initial visual and experiential identification of potential corrugation sites was used, followed by direct measurements and precise positioning within vibration signals on the selected measurement locations. The vibration signals were then processed and validated with direct measurements to ensure the accuracy and reliability of evaluating rail corrugation and rail roughness based on bogie frame acceleration.
2.1. Measurement Locations
The measurement section is a 108 m long horizontal curve with a radius of R = 205 m. The first location (L1) of the measurement section is located in the middle of the curve, while the second location (L2) is located at the end of the curve (Figure 3a), and the track geometry characteristics for the measurement track segment (Ls = 108 m) are shown in Figure 3b.
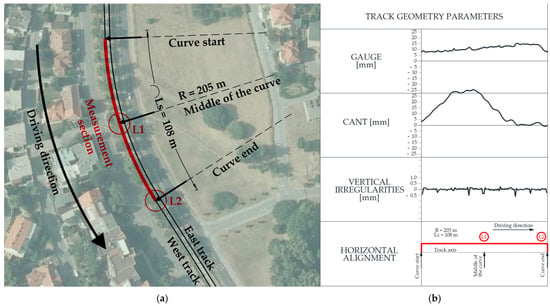
Figure 3.
(a) Measurement section (L1 and L2) with horizontal alignment parameters; (b) track geometry parameters of the section.
The chosen locations provided the opportunity to gain a more in-depth understanding of corrugation development trends, considering variations in track geometry, operating speed, and vehicle dynamics throughout the curve, all of which can have a significant impact on corrugation development. Moreover, by comparing data from multiple curve locations, it is possible to evaluate the reliability and consistency of the indirect bogie acceleration measurement methodology used for rail corrugation and rail roughness evaluation.
The tramway track structure on both locations (L1 and L2) is a narrow gauge (1000 mm) continuous slab track. Grooved rails (head hardened (HH)) are discretely fastened to the reinforced concrete (RC) slab using micro synthetic concrete bearers and DEPP fastening system [58], assembled of SKL-1 clip, and two neoprene rubber rail pads (Figure 4b), with a total vertical stiffness of DEPP fastening system being 40 MN/m. The longitudinal distance between support blocks is one meter. The track is positioned in a dedicated corridor and covered with 16 to 31.5 mm ballast to the top of rail height to support service and maintenance vehicles’ traffic (Figure 4a).

Figure 4.
Cross-section of the track superstructure (a) with the detail of DEPP fastening system (b).
2.2. Data Acquisition
Both indirect (bogie frame acceleration) and direct measurements (rail roughness) were conducted on two selected locations (L1 and L2) of the measurement section. It is important to emphasize that the methodology did not include the implementation of transfer functions (the vehicle’s and track’s vibroacoustic properties) or wheel roughness.
As a result, the main objective of the research was to investigate the efficiency of a simplified methodology in evaluating the condition of the rail running surface using indirect, vehicle-based measurements, without incorporating transfer functions and wheel roughness.
2.2.1. Indirect Measurements—Vibration Monitoring System Description
Zagreb’s tramway network is being continuously monitored using an instrumented in-service vehicle, covering a total of 114 km of tracks, gathering vibration data that occurs as a result of tram–track interaction in standard operation (Figure 5). Multiple variables were automatically gathered and saved to the cloud as part of condition monitoring, including bogie frame acceleration data in both time and frequency domains, tramway operating speed, tramway vehicle operating speed, and GNSS data used for positioning of the instrumented vehicle.
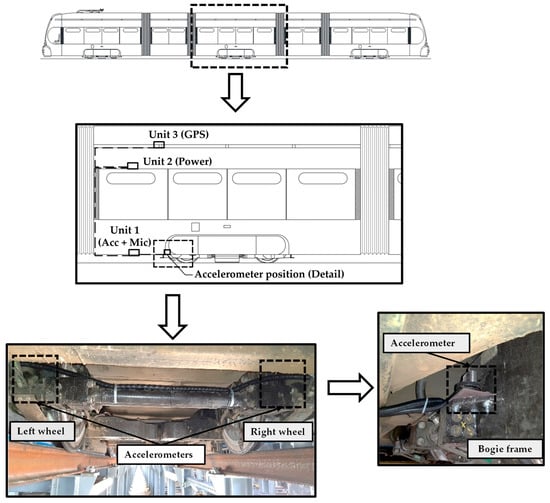
Figure 5.
Instrumented TMK 2200 tram on the Zagreb tramway network (ZET) with positions of the measurement units and detail of the mounted accelerometers near left and right wheel.
The instrumented in-service tramway vehicle is a low-floor tram, made of five-part welded steel construction with three powered bogies [59]. Rubber cushioned (resilient) wheels [60] are directly mounted onto the bogie frame, where the left and right wheels are not connected with an axle. Furthermore, the instrumented Končar TMK 2200 tramway vehicle has an increased unsprung mass compared with vehicles with axles and wheelsets, resulting in a more rigid structure on which the resilient wheels are mounted (the most significant damping is produced through the wheel’s damping properties).
The vehicle was instrumented with a measurement system that consisted of three units: Unit 1—acceleration data acquisition, mounted on the bottom side of the tram chassis together with two accelerometers (Acc.) and a microphone (Mic.), mounted on a bogie frame, as close as possible to the wheel to get the most reliable data; Unit 2—power supply, connected to the tram power supply and mounted inside the tram passenger compartment, including battery backup designed to overcome short power drops during tram operation; and Unit 3—communication and positioning, mounted atop the tram chassis to acquire GNSS data and communicate with a remote cloud for data collecting and storage.
2.2.2. Direct Measurements—RAILPROF 1000 Handheld Device
To validate the indirectly measured effective combined roughness and processed displacement data, direct rail roughness measurements were conducted on both measurement locations using a RAILPROF 1000 device (Figure 6a,b), which is suitable for measuring rail roughness [11], rail corrugation [10], and weld geometry evaluation [61]. The device measures 1 m of the rail running surface, with the possibility of measuring wavelengths from 1 cm to 40 cm, and has a vertical measurement accuracy of ±0.03 mm.
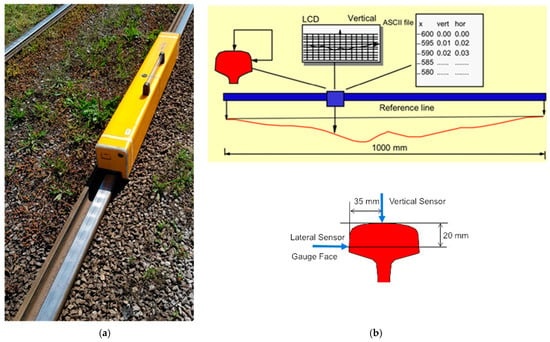
Figure 6.
RAILPROF 1000 handheld device on the measurement section (a) with data acquisition scheme (b); Red line in (b) representing the measured data/rail roughness profile.
Wavelength span and measurement length can be increased using an overlap with several 1.0 m measurements. For this research, three consecutive 1.0 m measurements were performed (with 20 cm overlap), and in that way, it was possible to increase the possibility of measuring the wavelengths up to 63 cm.
2.3. Data Processing
To get the processed bogie frame acceleration data that could be referential and comparable to the validation rail roughness dataset (direct measurements), extensive signal processing and data processing techniques were used.
Raw bogie frame acceleration data was acquired in the time domain a (t), at selected locations. The collected acceleration data was filtered and integrated twice, yielding vertical displacement data y (t). Direct measurements involved acquiring rail roughness data, r (x), with a handheld device RAILPROF 1000.
A complete flowchart of the processing methods for direct and indirect measurements is presented in Figure 7. The operating speed connects the wavelength and frequency domains, while using equation λ = v/f enables the transformation of the data from frequency to wavelength domain and vice versa.
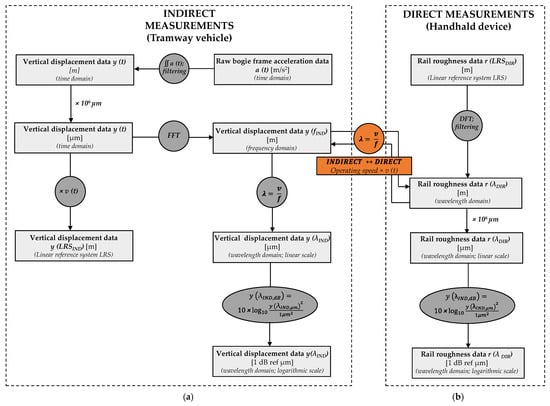
Figure 7.
Indirect (a) and direct data processing flowchart (b); ∫∫ a (t) represents the operation of double integer of acceleration; × v (t) represents the transformation from time domain into spatial domain (LRS); FFT represents Fast Fourier transformation; DFT represents Discrete Fourier transformation; Equation λ = v/f represents speed dependency between different frequencies and wavelengths, allowing data to be transformed from frequency to wavelength domain and vice versa. Datasets that are being transformed this way are highlighted in orange brackets: (1) vertical displacement data in frequency domain y (fIND) and (2) rail roughness data in wavelength domain r (λDIR).
2.3.1. Indirect Measurements—Vehicle-Based Bogie Frame Vibrations
Using in-service vehicle-based track monitoring and collected data, it was possible to identify locations with increasing vibration levels and determine that the cause is connected to a track irregularity or defect. However, for certain track irregularities, such as roughness and corrugation, individual raw signal segments had to be analyzed in more detail.
The main goal of signal processing was to convert the raw bogie frame acceleration data into a format for validation based on directly measured rail roughness data. To differentiate between long-term monitoring and individual indirect measurements at specific locations, a flow chart of operations has been created (Figure 8).
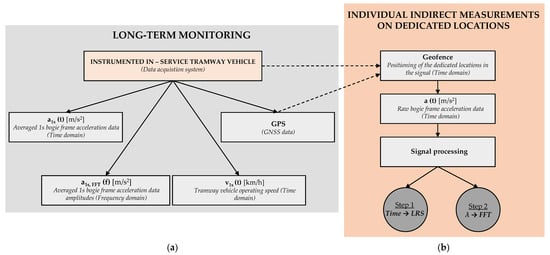
Figure 8.
Bogie frame acceleration data acquisition for long-term monitoring (a) and individual indirect measurements using instrumented in-service tramway vehicle (b).
In long-term monitoring, an instrumented in-service tramway vehicle collects averaged 1s bogie frame acceleration data in the time domain a1s (t) and frequency domain a1s, FFT (f), as well as GNSS data and the tramway vehicle’s operating speed v1s (t) (Figure 8a). Individual indirect measurements use geofencing to trigger raw signal recording on specific track locations in the time domain, at which raw bogie frame acceleration data a (t) was collected with a high sampling rate (32 kHz) and stored in lossless audio format (FLAC) (Figure 8b).
Acquired data was then processed following two steps using the tramway operating speed: Step 1: Displacement data conversion from time (t) to spatial domain (linear reference system—LRS), and analogously. Step 2: Transfer from frequency (f) to wavelength (λ) domain (Figure 9).
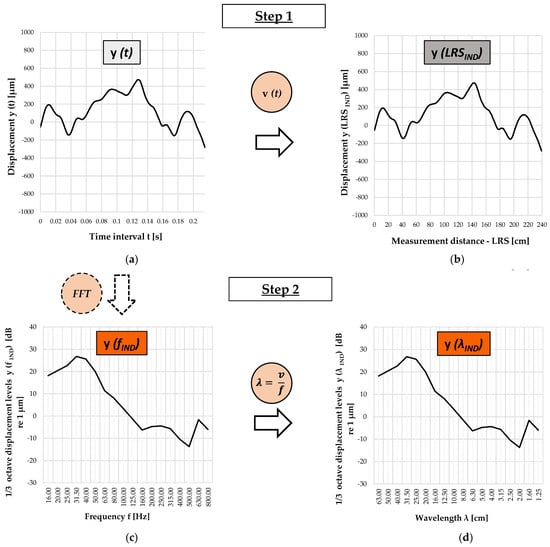
Figure 9.
Signal processing methods—Step 1: Time →LRS (a,b); Step 2: Frequency →Wavelength (c,d). (a) Displacement y (t) in the time domain, (b) Displacement y (LRSIND) in spatial (LRS) domain, (c) 1/3 octave displacement levels y (fIND) in the frequency domain, (d) 1/3 octave displacement levels y (λIND) in the spatial (wavelength) domain.
In Step 1, double integration was performed on the raw bogie acceleration signal to get vertical displacement data in the time domain. The double integration of raw acceleration data processing was chosen because it gives the vertical displacement data as a result, which can be directly compared with the directly measured data from the rail running surface. The vertical displacement data represents the vertical movement of the accelerometer on the bogie frame, which is a direct consequence to the wheel–rail contact. After integration, displacement data y (t) was converted from the time domain—time interval t [s] into the LRS—measurement distance [cm].
Audio (FLAC) file was transformed into a waveform file and imported into NI DIAdem software for further signal processing. As double integration of acceleration data can amplify low-frequency noise and introduce drift [62], a bandwidth filter from 4 Hz to 2000 Hz was applied to improve accuracy of the wanted data and to remove low-frequency drift. The chosen band-pass filter range of 4 to 2000 Hz reliably covers the excitation frequencies—from about 6.6 Hz to 1390 Hz—generated by tram speeds between 15 km/h and 50 km/h for rail corrugation wavelengths of 1 cm to 63 cm on the Zagreb tramway network.
For the precise positioning of the corrugation pattern within the integrated acceleration signal (LRS), the GNSS signal and a comparison of the corrugation pattern within the directly and indirectly recorded roughness were used (Figure 10). To start the process, the precise positions of 2.4 m measurement lengths (specified in direct measurements) were identified in the signal using information about a tram’s operating speed from the GNSS data to determine the time interval in seconds, which varied for each test run.
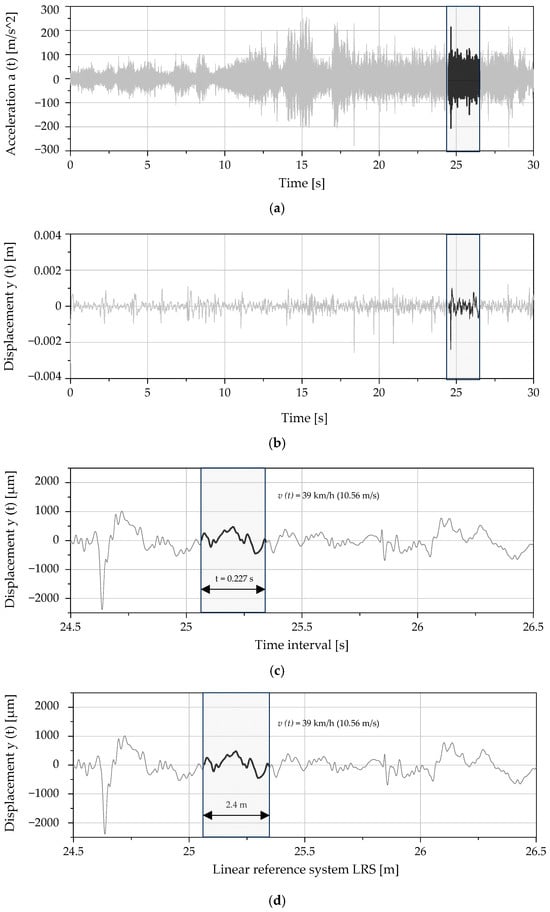
Figure 10.
Step 1: Signal processing procedure, which includes bogie frame acceleration data (a), vertical displacement (2nd integer of acceleration) in the time domain (b,c), and spatial domain (LRS) (d); acceleration signal on the 2.4 m long measurement section marked with thick black line in a grey rectangle.
Step 2 included transforming data from the LRS to the frequency (f) domain, followed by transfer from the frequency (f) to the wavelength (λ) domain, depending on the operating speed. Amplitude values for each third-octave frequency band were calculated using peak amplitude values with a Hanning window function, without averaging.
Frequency bands were transferred to wavelength bands (λ) according to the operating speed using the relation for obtaining vertical displacement data y (λIND) as a function of
where fc is the center band frequency of a given one-third octave band in Hz, and v is the train operating speed in m/s.
λ = v/fc,
For various speeds, the displacement spectrum shifts along the frequency axis as a function of frequency. The displacement frequency spectrum has been transformed into a wavelength spectrum (LRtot (λ)) using (1). Typically, the wavelengths λ generated through this transformation won’t coincide with common wavelengths λC. The mentioned transformation (from frequency to wavelength domain) was made according to the CEN/TR 16891 technical report [45,47], and EN 15610 standard [11], closely dependent on the different operating speeds of the tram.
Standard one-third octave bands that were used in this paper and an example of calculated third-octave wavelength bands for v = 37 km/h (10.56 m/s) are given in Table 1. To get the vertical displacement values at desirable standard wavelengths λC, the displacement levels derived from neighboring wavelengths around the standard wavelength were used. First, the neighboring wavelengths resulting from the frequency-to-wavelength transformation were located, which were named λ− and λ+ such that λ− < λC < λ+. Then, the displacement level at wavelength λC was calculated:
where l represents the lower limit of the corresponding wavelength band, and u represents the upper limit of the corresponding wavelength band.

Table 1.
Standard third-octave wavelength bands (Railway applications—Acoustics—Measurement Method for combined roughness, track decay rates and transfer functions CEN/TR 16891:2016 [45,47]) and calculated third-octave wavelength bands (v = 37 km/h).
The described transformation was carried out for all tram test runs that were analyzed, and an adequate wavelength range for this particular application was obtained.
2.3.2. Direct Measurements—Validation
To validate the indirectly measured and processed bogie frame acceleration data, direct rail roughness measurements were conducted on the same measurement locations using the RAILPROF 1000 device.
Rail roughness r (x) is measured as a variation in the height of the running surface expressed as a function of distance x along the running surface (spatial domain) (Figure 11a). To compare directly measured rail roughness data to indirectly obtained data from the tramway vehicle, the amplitude of the roughness data, (λ), was expressed as a function of the wavelength λ (Figure 11b). Directly measured rail roughness data r (x) was transferred from LRS to (λDIR) (Figure 11b), allowing for comparison with vertical displacement data y (λIND) and validation of the indirect measurements.
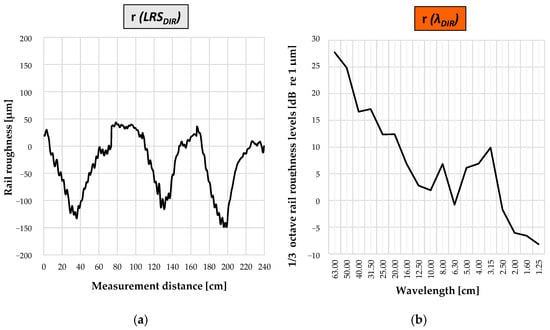
Figure 11.
Rail roughness r (x) as a function of the distance x (a) and third-octave rail roughness amplitude spectrum (λDIR) as a function of wavelength λ (b).
Before calculating the wavelength spectrum, the data was processed in three stages according to the EN 15610 standard [11]: First, data analysis of direct measurements and visual inspection of the section was performed to ensure no rail joints, rail head defects, and welds are present in the signal. No discontinuities were included in the data that could affect the final spectrum analysis. Secondly, narrow upward spikes were removed, as they are linked with the presence of small particles of foreign matter on the rail surface—“spike removal”—and lastly, the small radius of the sensor tip compared with that of the wheel was taken into account while processing the data—“curvature processing”—all according to [11].
After the removal of pits and spikes, roughness data was post-processed in MATLAB to merge the rail roughness data from 1.0 m segments to a defined 2.4 m measurement length. Data was further processed using Discrete Fourier transform (DFT), to obtain the results in third-octave wavelength bands, following the EN 15610 standard [11].
Rail roughness levels (amplitudes) are expressed in decibels (Figure 11b) on the ordinate axis, given by the following formula:
where
- Lr is the rail roughness level in dB
- rRMS is the root mean square roughness in μm
- r0 is the reference roughness; r0 = 1 μm
while the third-octave wavelength bands are expressed in cm on the abscissa axis.
3. Results
To analyze the relationship between indirectly measured bogie acceleration data (transformed into vertical displacement data) and directly measured rail roughness data, a segment of 240 cm was analyzed on two distinct locations, on both left rail (LR) and right rail (RR) separately, and in both spatial domain (LRS) and wavelength domain (third-octave bands). This approach aimed to explore the characteristics of both indirect and direct datasets.
Indirectly measured bogie acceleration data was analyzed based on a total of 15 test runs on both locations (L1 and L2), with variable operating speeds for each test run, all of which were recorded during a one-day service of the conventional (in-service) instrumented vehicle type Končar TMK 2200 (Table 2).

Table 2.
List of recorded Končar TMK 2200 instrumented tram test runs and their operating speed.
In the first analysis, a statistical approach was employed to assess the variability and confidence interval of the indirectly acquired vertical displacement data. The second analysis looked at the effects of repeated test runs at equivalent speeds, while the third looked at the impacts of minimum and highest recorded operating speeds on the results and their deviation from the overall mean value. The fourth analysis investigated how horizontal alignment and rail-side influences vertical displacement and rail roughness at two specific locations. The fifth and final analysis focused on waveform similarities (dominant wavelengths), comparing data from indirect and direct measurements at both locations, and evaluated the potential benefit of indirect measurements for determining rail corrugation and roughness.
3.1. Analysis 1—Statistical Analysis of Vertical Displacement Data Across Third Octave Wavelength Bands
The statistical analysis investigated how vertical displacement levels varied with wavelength over two defined locations, analyzing every rail independently, for a total of 15 runs with varying operating speed. Boxplots were created for each of the 1/3-octave wavelength bands, which ranged from 63 cm to 1.25 cm, presenting the interquartile range (IQR: 25th–75th percentiles); midlines inside the boxplots show the median, “×” marks the mean, whiskers the range between min and max values, and circles show outliers (Figure 12).
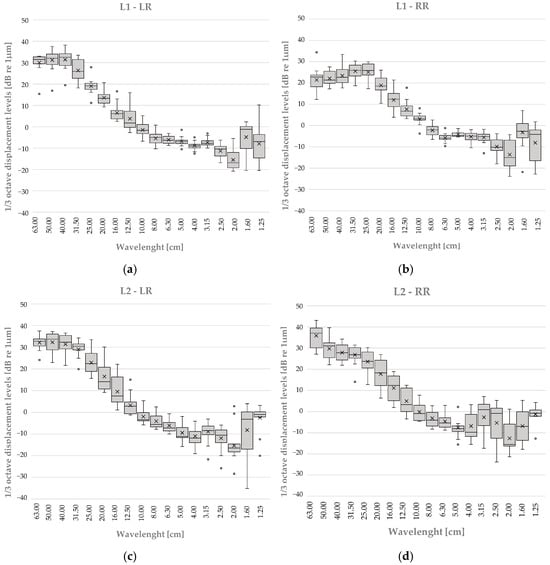
Figure 12.
Vertical displacement values (dB re 1 μm) displayed as boxplots in 1/3-octave bands over 15 test runs at different speeds. Boxes show the interquartile range (IQR: 25th–75th percentiles), midlines show the median, “×” marks the mean, whiskers the range between min and max values, and circles “°” show outliers; (a) L1—RR, (b) L1—LR, (c) L2—LR, (d) L2—RR.
The primary goal of the research was to explain the central tendency, variability, and statistical confidence intervals (CI) associated with these indicators, thus providing insight into the results’ reliability and comparability across different experimental conditions. Despite acquiring data in varying conditions or locations (L2 vs. L1, LR vs. RR), the overall shape and trend of the vertical displacement-wavelength relation were consistent across all graphs.
The IQR in a boxplot represented the range within which the middle 50% of the data fell, describing spread or variability. A higher average IQR across wavelengths indicates that the data is more dispersed and inconsistent. Because confidence intervals quantify an estimate’s precision (similar to the median), greater variability results in wider confidence intervals. In particular, the width of the confidence interval for the median can be approximated as proportionate to the IQR divided by the square root of the sample size [63,64]:
for a 95% CI and n = 15 sample size.
Thus, configurations with average IQR, avg = 15.2 dB (like L2-RR) will have wider confidence intervals, reflecting lower statistical confidence in the median estimates. Conversely, configurations like L1-LR with the narrowest total IQR, avg = 9.4 dB will have tighter confidence intervals and higher confidence in their central measurements (Table 3).

Table 3.
Comparative interquartile range and confidence interval widths for median displacement across locations.
Narrow boxes at longer wavelengths (16 cm to 63 cm) indicated higher confidence in median or central values, whereas wider data spread at shorter wavelengths (1.25 cm to 3.15 cm) suggested lower statistical confidence.
The basic calculation for CI for each wavelength was based on non-parametric methods—specifically, the 95% confidence interval for the median expanded from the 4th to the 12th ranked value among the sorted vertical displacement datasets (n = 15) for each wavelength band. The L1-LR (Figure 12a), L1-RR (Figure 12b), and L2-LR (Figure 12c) graphs showed similar trends, with data for L1-LR being slightly more reliable than the other two at shorter wavelengths due to fewer outliers. On the other hand, L2-RR (Figure 12d) showed the most variability and the widest confidence intervals of any graph at the shortest wavelengths, leading to the lowest statistical confidence.
3.2. Analysis 2—Tram Test Runs with Equivalent Speed
The second analysis targeted to investigate vertical displacement data variation in third-octave wavelength bands throughout multiple test runs (TR) with equivalent operating speeds: location L1 v = 40 km/h (Figure 13a,b) and location L2 v = 38 km/h (Figure 13c,d), in comparison with their mean value (y (λIND)—Mean EQ (v)).
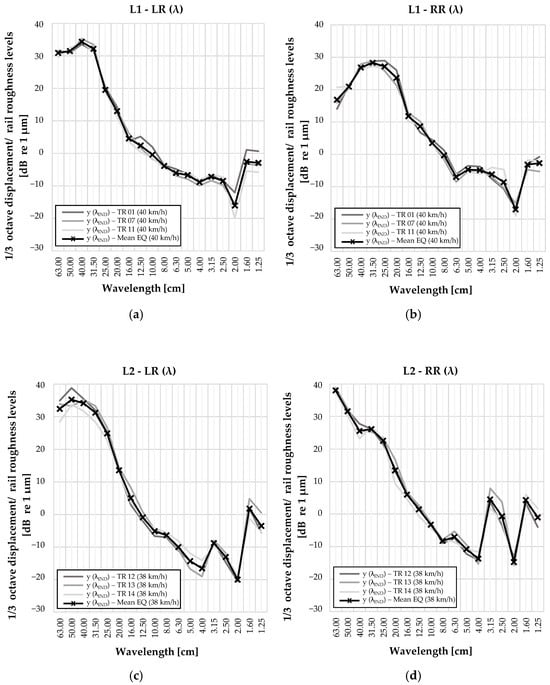
Figure 13.
Vertical displacement data of three individual test runs y (λIND) TR with equivalent speed and their mean value y (λIND) Mean EQ presented in the wavelength (λ) domain: (a) L1—LR, (b) L1—RR, (c) L2—LR, (d) L2—RR.
For most of the third-octave wavelength bands, the deviation between the values from the individual test runs and their mean value was below 2.0 dB at location L1 (76.4% of the values on both rails on average), and below 2.0 dB at location L2 (56.7% of the values). However, on both locations, several values in some third-octave wavelength bands had more significant deviations between the data from the individual test runs and their mean value (Table 4).

Table 4.
Overview of largest value deviations of vertical displacement datasets between individual test runs with equivalent speed (y (λIND) TR) and their average (y (λIND) Mean EQ).
The difference in displacement values between individual test runs with equivalent operating speeds and their mean values at L1 and L2 indicates that variables other than operating speed have a significant effect on rail corrugation evaluation using indirect vehicle-based measurements.
3.3. Analysis 3—Tram Test Runs in Extreme Operating Speed Conditions (Min/Max Speed)
In the third analysis, deviation of the values acquired during the test runs in extreme operating speed conditions—minimum (vmin) and maximum (vmax) operating speed was inspected. Analyzed datasets included the following: 1. Vertical displacement data acquired during the test runs with maximum y (λIND) vmax. 2. Minimum operating speed y (λIND) vmin. 3. Mean value of vertical displacements y (λIND) Mean TOTAL for a total of 15 test runs.
Analysis of the vertical displacement data from two test runs with the maximum and minimum operating speed that was recorded (28 km/h and 45 km/h) is shown with third-octave displacement/rail roughness amplitudes in dB [re 1 µm] on the ordinate axis, and third-octave wavelength bands in cm on the abscissa (location L1—Figure 14a,b). The same analysis was carried out for location L2, with minimum operating speed vmin = 17 km/h and vmax = 43 km/h (Figure 14c,d).
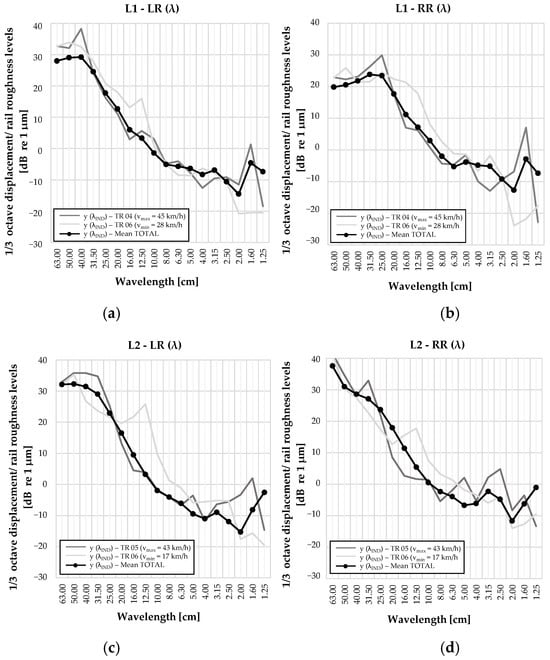
Figure 14.
Comparison of displacement data (indirect) and direct rail roughness in third-octave wavelength bands on both rails: for different tramway test runs with maximum (TR 04; 45 km/h) and minimum (TR 06; 28 km/h) operating speed on Location L1 (a,b), and TR 05 with vmax = 43 km/h and TR 06 with vmin = 17 km/h on Location L2 (c,d).
At both locations, displacement values related to maximum operating speed coincided better with the mean value in the longer wavelength bands (λ > 10 cm), while values for test runs with minimum speed corresponded better with the mean value in the shorter wavelength bands (λ < 10 cm). The deviation between values for test runs with maximum and minimum operating speed compared with mean values at location L1—middle of the curve was less pronounced than at location L2 in all wavelength bands. Also, mean values showed a more consistent relationship with both max and min curves across most of the wavelength bands, which indicates a more stable dynamic behavior in the middle of the curve (L1), possibly due to more uniform lateral forces (centrifugal force) in comparison to the end of the curve (L2).
3.4. Analysis 4—Horizontal Alignment and Rail-Side Effects on Vertical Displacement and Rail Roughness
In the presented analysis, horizontal alignment and rail-side effects on vertical displacement and rail roughness on two chosen locations was examined. The variations between the rail roughness and vertical displacement datasets associated with the horizontal alignment placement of the locations (L1: middle of the curve; L2: end of the curve) were also examined (Figure 15, Table 5).
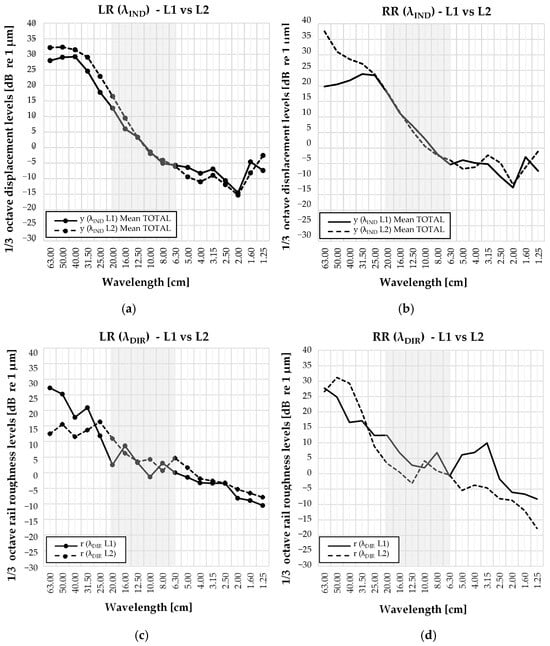
Figure 15.
Comparison of vertical displacement y (λIND) and rail roughness r (λDIR) datasets between the two measurement locations L1 and L2 for both rails individually; (a) LR (λIND), (b) RR (λIND), (c) LR (λDIR), (d) RR (λDIR); 6.3–20 cm wavelength range where there are no dominant wavelengths for displacement data is marked with grey rectangle.

Table 5.
Overview of the values deviations between L1 and L2 considering vertical alignment on both rails and dominant wavelengths in the 6.3–20 cm wavelength range.
Figure 15 shows an analysis of the location’s horizontal alignment influence on the results (L1—middle of the curve, L2—end of the curve). There were substantial variations in the values between two locations with regard to RR results for both rail roughness and displacement data (Figure 15b,d). This was caused by differences in the horizontal geometry of the measuring locations: L1 is in the middle of the curve, whereas L2 is at the end of the curve. As previously mentioned in the second analysis, in the middle of the curve, there is also a much more pronounced influence of the centrifugal force, which means that there is a greater force on the wheel–rail contact.
The outer rail (RR) showed a higher deviation between L1 and L2 for both vertical displacement and rail roughness, indicating more pronounced corrugation development and a greater number of dominant wavelengths. The inner rail (LR) exhibits less deviation and fewer dominant wavelengths, with the datasets being closer together.
For vertical displacement, both rails display a linear trend (no dominant wavelengths) in the 6.3–20 cm range, suggesting the tram’s dynamic response does not amplify displacements in this band. On the other hand, for rail roughness, dominant wavelengths were present in the marked 6.3–20 cm wavelength range, especially noticeable on the outer rail (RR) at both locations.
The dominant wavelengths on the rail surface indicated rail corrugation (r (λDIR), which should contribute to wheel–rail to wheel–rail interaction forces, but the corrugation was not recognizable in the displacement graphs (y (λIND) Mean TOTAL).
3.5. Analysis 5—Dominant Wavelengths: Indirect and Direct Measurements
The fifth and final analysis aimed to evaluate dominant wavelengths of rail corrugation in the wavelength domain, comparing average vertical displacement values (y (λIND) Mean TOTAL) of the total number of recorded test runs (n = 15) and directly measured rail roughness values r (λDIR) (Figure 16, Table 6). This was performed to inspect the similarities and/or differences in the wavelength shapes of both indirect and direct datasets, and variations between vertical displacement and rail roughness data in the wavelength domain.
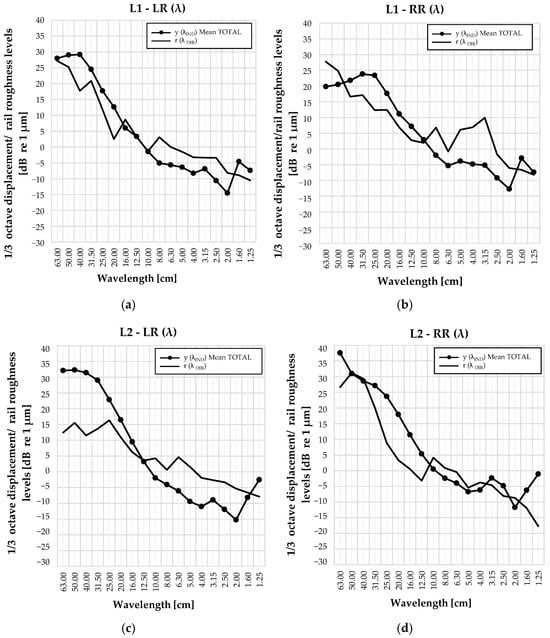
Figure 16.
Vertical displacement (indirect) y (λIND) Mean TOTAL and rail roughness data (direct) r (λDIR) comparison in wavelength domain for both rails on the analyzed locations: (a) L1—LR, (b) L1—RR, (c) L2—LR, (d) L2—RR.

Table 6.
Overview of average, minimum, and maximum value deviations of vertical displacement datasets between the vertical displacement data of n = 15 averaged test runs, y (λIND) Mean TOTAL, and rail roughness data r (λDIR).
Generally, on both locations (L1, L2) and each rail-side (LR, RR), in longer wavelength bands (10.0 cm to 63.0 cm), indirectly acquired data showed a trend with higher values; around the 10 cm wavelength band, the indirect and direct data were closely matched; and for shorter wavelength bands (1.0 cm to 8.0 cm), the direct dataset showed higher values.
Additionally, to evaluate rail corrugation based on direct and indirect datasets, an overview table of dominant wavelengths in long (10.0 < λ < 63.0 cm) and short (1.25 < λ < 8.0 cm) wavelength ranges for all conducted measurements was created (Figure 17). To define dominant wavelengths, two guidelines were used: 1) wavelengths with the highest amplitudes (typically longer wavelengths ranging from 31.5 cm to 63.0 cm); and 2) local peaks associated with wavelength bands with significantly higher amplitudes than the surrounding bands.

Figure 17.
An overview of rail corrugation dominant wavelengths based on both direct r (λDIR) and indirect measurements y (λIND) Mean TOTAL.
The key observations included a significant coincidence of dominating wavelengths at 3.15 cm throughout nearly all measurements, as well as coincidences at longer wavelengths (λ = 31.5 cm for location L1 and λ = 50.0 cm for location L2).
The overview table confirmed observations that were made based on the displacement graphs in Figure 16. The area without dominant wavelengths of displacement data (indirect measurements) in the wavelength range 6.3 cm < λ < 20 cm is marked with a bold dotted rectangle in Figure 17.
For wavelength bands λ < 3.15 cm, there were some dominant wavelengths for vertical displacement data y (λIND) (λ = 1.6 cm at Location L2), but no dominant wavelengths for rail roughness dataset r (λDIR). There are several possible explanations for these deviations, and they are further investigated in the discussion.
4. Discussion
Several analyses presented in the previous chapter looked into the possibility of evaluating rail corrugation and roughness, as well as the effect of various parameters on the calculation of indirectly obtained and processed vertical displacement data using bogie frame acceleration measurements. This chapter is going a step forward to discuss how these criteria can be identified and quantified. More importantly, it describes how their assessment may affect the bogie frame acceleration data, with the long-term goal of evaluating the condition of the railhead running surface using vehicle-based indirect measurements, thereby reducing the need for labor- and time-consuming direct measurements (handheld and trolley-type devices).
4.1. Wheel Roughness and Lateral Positioning of the Wheel–Rail Contact Point
A comparison of three independent test runs with the equivalent tramway vehicle operating speed at both locations (Analysis 2, Figure 13) revealed some deviations between displacement data for individual test runs y (λIND)—TR and their mean value y (λIND)—Mean EQ (v). Given that the test runs concluded at equivalent running speeds, it is clear that the deviations from the values associated with the individual test runs and their mean values are influenced by other contributing parameters. These deviations of the displacement values observed in the particular third-octave wavelength bands could provide useful information about how different positions of the wheel roughness and later positioning of the wheel–rail contact point affect the intensity and trend of the indirectly acquired vertical displacement data.
4.1.1. Wheel Roughness
Significant displacement value deviations can be observed in Figure 13, where individual wavelength bands were constantly dominant, regardless of the measurement location. Concretely, on the outer rail (RR), there were deviations up to 2 dB in the shorter wavelengths bands λ = 1.6 cm and λ = 2.0 cm, and also λ = 1.25 cm and λ = 3.15 cm on the inner rail (LR). By confirming the deviations at both locations in the same wavelength bands, it was possible to establish that the horizontal alignment and the running speed (EQ) do not affect the value deviations in those wavelength bands, implying that knowing wheel roughness could be the logical solution to the problem.
A similar observation was made in the overview table (Figure 17) in which it is evident that there are some dominant wavelengths of vertical displacement mean values y (λIND) Mean TOTAL in the shorter wavelength range λ < 3.15 cm: λ = 1.6 cm at location L1 and λ = 1.6 cm at location L2 on both rails, but there are none for the rail roughness dataset. An explanation for this could also be connected to wheel roughness and its dominant wavelengths in the shorter wavelength range (λ < 3.15 cm).
The presented challenge could be solved by measuring wheel roughness to know its contribution to the combined effective roughness (measured as bogie frame acceleration, i.e., vertical displacement data), or by making measurements with new wheels to eliminate this parameter for calibration of the evaluation of the rail running surface from bogie frame accelerations. Wheel roughness can be easily measured with a handheld device and thus contributes to the effectiveness of evaluating rail corrugation and rail roughness from vehicle-based indirect measurements [38,57,65,66].
4.1.2. Lateral Positioning
The topic of lateral positioning was examined through both Analysis 2: Analyzing multiple runs with equivalent speed (Figure 13) and Analysis 4: Analyzing deviations between locations L1 and L2 (Figure 15). These observed deviations can be explained by a phenomenon known as the “hunting” of tramway vehicles, which refers to the tram’s lateral oscillation as it passes along the track. This hunting behavior can cause variations in the wheel–rail contact position between test runs [67,68]. The wheel tread, i.e., the segment of the wheel that contacts the rail (wheel running surface), does not consistently run along the same line on the rail running surface in repeated test runs. This inconsistency arises because both the railhead running surface (rail roughness) and the wheel tread (wheel roughness) profiles vary across their lateral width [5,66]. “Hunting” is more pronounced at the change in horizontal geometry (i.e., end of the curve—L2) than in the middle of the curve (L1), where the radius is constant and centrifugal force has its maximum value (Figure 13c,d), resulting in a higher load on the rails and preventing a significant lateral movement [68]. A similar conclusion can be drawn from the statistical analysis (Section 3.1), where the lowest CI was calculated for L1—RR (Figure 12d)
A solution to these two presented challenges could be implementing a longer measurement section with more test runs and averaging them. By measuring wheel roughness and conducting the measurements in relatively stable operating conditions (more test runs at constant speed without passengers, the challenge of different wheel contact points and tram loading conditions could be annulled.
4.2. The Influence of Vehicle Speed Variations on Wheel–Rail Dynamics
In Analysis 3 (Figure 14), various observations were made in relation to the extreme speed conditions and variations in the vertical displacement values, comparing them with the average values of all test runs in the experiment.
At lower speeds, the vehicle–track system behaves more linearly because the suspension system effectively reduces the impact of short-wavelength irregularities. This is confirmed by studies that show that lower speeds result in less dynamic amplification and closer alignment of displacement data to mean values in some wavelength bands [69,70]. Accordingly, dynamic amplification of rail irregularities increases with speed, particularly for shorter wavelengths. Maximum speed test runs (TR 05 at 43 km/h) in the wavelength range 1.25 cm < λ < 8.0 cm result in much larger deviations from the mean (Figure 14c,d). Such amplification can be attributed to the nonlinear interaction between vehicle dynamics and track irregularities, as previously observed in [71].
The graphs also show that deviations are more pronounced at Location L2 (Figure 14c,d) than at Location L1 (Figure 14a,b), indicating that end-of-curve dynamics are more complex and speed-dependent [68].
The results and literature support the hypothesis that considerable deviations between minimum and maximum operating speeds (e.g., Δvmin/max (L1) = 17 km/h and Δvmin/max (L2) = 26 km/h in the presented research) lead to increased value deviations in specific wavelength bands. Studies have shown that changes in train speeds cause various dynamic reactions, modifying rail corrugation and rail roughness spectra, therefore increasing wear rates [56].
4.3. Variations in Signal Processing Methods
Another parameter that influences the difference between values of indirect and direct measurements is the type of Fast Fourier Transform (FFT) that is used in the analysis. As directly measured rail roughness data was analyzed through FFT in third-octave bands (according to HRN EN 15610 [11]), third-octave bands were also used to analyze acceleration data as a part of this paper. However, results that were analyzed in third-octave bands could be misleading, because the narrow bands could have a high influence on the deviation of the results. This problem is also discussed in [72].
A good example of this is shown in Figure 16b (L1—RR), where amplitudes of mean effective (combined) roughness have two dominant peaks at 25.0 cm and 31.5 cm wavelength bands, but directly measured acoustic rail roughness has only one peak at 31.5 cm. If the FFT analyses were to be conducted without third-octave bands (according to HRN EN 15610 [11]), it could represent a more detailed comparison between direct and indirect rail roughness measurements. A similar type of FFT analysis was performed on the Midway metro line in the UK [55].
4.4. Vibroacoustic and Dynamic Characteristics of the Tramway Vehicle—Wheel–Rail Contact to Bogie Frame Transfer Function
The transfer function that takes into consideration the transfer of vibrations from wheel–rail contact to bogie frame accelerometer position has a significant influence on altering the displacement values in different wavelength bands. Looking at the analyses of vertical displacement data in the wavelength domain that were carried out in this paper, and according to the current modal analysis of resilient wheels [23,32,38,73,74], the transfer function should damp and amplify vertical displacement data in certain frequency bands, so a better fit to direct measurement is expected.
In the 6.3 cm < λ < 20 cm range, the dominant wavelengths measured directly on the rail surface indicate rail corrugation, which should contribute to wheel–rail contact forces, but are not recognizable in the displacement graphs based on the indirect measurements (Analysis 4, Figure 15a,b and Figure 17). These do not translate into dominant vertical displacement wavelengths due to dynamic filtering by the tram’s vibroacoustic system [52,75], which underscores the need for integrated analyses of both track and vehicle vibroacoustic properties when assessing wheel–rail interactions. Additionally, the difference between vertical displacement and rail unevenness data in this wavelength range could be attributed to the tram vehicle’s vibroacoustic behavior, which includes suspension, wheel–rail contact dynamics, and structural resonances. The wheel–rail contact force is influenced by both rail roughness and vehicle dynamics. If the tram’s vibroacoustic system has natural frequencies outside the 6.3 cm < λ < 20 cm range, roughness-induced forces may not be effectively transmitted to identifiable displacements [52,75]. Furthermore, track dynamics (connected to rail pad stiffness or sleeper spacing) might influence how roughness translates into displacement [52]. Structural resonance frequencies of the tram vehicle may amplify or dampen values in specific wavelength bands. If no resonance corresponds with the 6.3 cm < λ < 20 cm range, displacement levels will remain negligible, despite relating dominant rail roughness wavelengths [76] (Figure 17). Implementing the wheel–rail contact to bogie frame (accelerometer position) transfer function could address this challenge and result in considerably closer displacement results with rail roughness [32,77,78].
Based on the graphs with averaged indirect displacement dataset and direct rail roughness data in Figure 16, it was concluded that indirect measurements generally showed higher values at longer wavelengths, whereas direct measurements were higher at shorter wavelengths, with both measurement methods closely matched around the 10.0 cm wavelength band. These data deviations might also be dealt with by implementing a transfer function, which would amplify amplitudes in some wavelength bands while dampening them in others. Furthermore, because the handheld instrument used for direct measurements could not measure wavelengths above 63.0 cm, it was not able to validate the vertical displacement data above this threshold. Implementing transfer functions in indirect measurements should narrow the measurement gap by introducing valuable data on bogie-frame and wheel dynamics.
All of the analyzed results confirm that vehicle-specific vibroacoustic characteristics have a substantial effect on how rail roughness translates into measurable bogie frame accelerations (displacement). This emphasizes the significance of understanding vehicle dynamics and wheel–rail interaction when evaluating rail corrugation and rail roughness based on tramway vehicle vibrations. To better understand this phenomenon, future studies could analyze tram suspension properties and natural frequencies, model wheel–rail interaction using detailed vibroacoustic simulations, investigate whether track parameters (e.g., rail pad stiffness and track superstructure) contribute to dynamic filtering effects of the vibrations.
4.5. Influence of the Horizontal Alignment and Centrifugal Forces on the Vehicle-Based Vibration Measurements
In the fifth analysis, datasets from both locations were compared to demonstrate the repeatability of indirect measurements on L1 and L2, as well as to compare the datasets for the outer (RR) and inner (LR) rails on the same graphs, both for direct (rail roughness) and indirect measurements (vertical displacement). The analysis in Figure 15 showed significant differences between the results from the two locations, particularly for the RR (Figure 15b,d), due to differences in the horizontal geometry of the measuring locations. In the middle of the curve (L1), the centrifugal force has a greater influence, resulting in higher loading on the outer rail and faster development of corrugation [5]. The outer rail (RR) exhibits a higher number of dominant wavelengths compared with the inner rail (LR), indicating greater deviation between locations due to differences in load distribution and the lateral trajectory of the vehicle in the middle and end of the curve.
In terms of overall corrugation, the outer rail (RR) at L2 exhibits a higher number of dominant wavelengths compared with the inner rail (LR) (Figure 17), indicating greater variability in the data due to changes in load distribution and vehicle trajectory as it exits the curve. This suggests that the end of the curve experiences different dynamic conditions that affect rail corrugation development [79]. This is also evident in the first analysis (Section 3.1), which concluded that L2-RR (Figure 12d) had the greatest spread and lowest measurement consistency, directly implying that it also has the widest CI (lowest precision), whereas L1-LR’s narrow spread (Figure 12a) corresponded to the tightest confidence intervals (highest precision).
4.6. Evaluation of Rail Corrugation (Dominant Wavelengths) Based on Both Direct and Indirect Measurements
An overview table of dominant rail corrugation wavelengths presented in the fifth analysis (Figure 17) revealed a significant coincidence of dominant wavelengths at 3.15 cm across both rail roughness (direct) and vertical displacement (indirect) datasets, with additional coincidences at longer wavelengths (31.5 cm and 50.0 cm) at locations L1 and L2. However, there was a notable absence of dominant wavelengths in the displacement data for the range 6.3 cm < λ < 20 cm, which was already discussed in the previous Section 3.4.
For wavelengths less than 3.15 cm, some dominant wavelengths were observed in vertical displacement data (λ = 1.25 cm at L1 and λ = 1.6 cm at L2), but none were found for the direct rail roughness dataset.
The contact of the wheel and rail might cause vibrations that are not directly related to rail corrugation or rail roughness. This contact can produce frequencies that are not recorded in rail roughness (direct) measurements but are detected by bogie frame acceleration [65]. The absence of wheel roughness data could add to these disparities, as wheel roughness can alter the bogie frame acceleration data [66]. The average operating speed vAVG ~ 37 km/h (for the total of 15 test runs recorded), as well as the low-floor tram’s resilient wheel design, may have an impact on how vibrations are generated and transmitted. Different speeds and vehicle designs might amplify wheel–rail contact forces (and subsequently bogie frame vibrations) in various frequency (wavelength) bands in the bogie frame/axle-box vibration spectra [66,67].
5. Conclusions
Rail corrugation represents a common issue on tram tracks, especially in urban areas like Zagreb, where narrow streets and close proximity to surrounding buildings lead to noise and vibration disturbances affecting residents and passengers. As existing direct measurement methods for evaluating rail corrugation and roughness are limited by operational constraints, the demand for novel methods, such as indirect vehicle-based methods to assess rail running surface condition, is on the increase.
Several analyses were undertaken to determine how parameters such as operating speed, vehicle and track vibroacoustic properties, wheel roughness, and horizontal geometry influence the evaluation of rail corrugation and roughness using bogie frame acceleration data. In addition, the efficiency of the proposed methodology was validated by comparing vertical displacement data to directly measured rail roughness, with the most important conclusions and observations based on the performed results analysis as follows:
- Statistical analysis indicated that, across all measurement sections, confidence intervals for the median displacement were most narrowed at longer wavelengths—especially in the middle of the curve (L1-LR and L1-RR), signifying high precision and low variability. On the other hand, at shorter wavelengths, particularly near the end of the curve (notably L2-RR), confidence intervals were significantly wider, indicating increased data dispersion and reduced measurement reliability.
- Changes in lateral position of the wheel–rail contact, as well as unknown wheel roughness data, may explain alterations of the data in the second analysis, where vertical displacement throughout multiple test runs at equivalent operating speed was analyzed.
- Considerable differences in operating speed between two test runs (y (λIND) vmin and y (λIND) vmax) could have significantly affected the results, amplifying the influence of extreme speed conditions, especially in certain wavelength bands while dampening it in others.
- Significant variations between locations, particularly evident on the outer rail, occur due to differences in horizontal geometry and centrifugal forces, leading to more pronounced corrugation development and a higher number of dominant wavelengths on the outer rail compared with the inner rail.
- There was a good coincidence of both vertical displacement data y (λIND) Mean TOTAL and rail roughness data r (λDIR) showed similar wave shapes observed in the spatial domain (LRS) and corresponding dominant wavelengths in the wavelength domain (λ). However, there were some differences, especially in the 6.3 cm < λ < 20 cm range, highlighting the complex interaction between wheel–rail contact dynamics and vehicle vibroacoustic properties.
The next step in the research will be to assess the vehicle’s vibroacoustic characteristics by implementing a transfer function based on experimental hammer impact tests into the methodology. Additionally, wheel roughness should be measured to see how it affects wheel–rail contact forces and, as a result, bogie frame vibrations. To improve on indirect measurement results, several steps could be implemented in future studies to the bogie frame vibrations measurement campaign to account for the effect of running speed on the results. This includes increasing the number of test runs for in-service conditions (minimum of 30), limiting the dispersion of various operational speeds for individual test runs (maximum deviation of 20 km/h between minimum and maximum operating speed) and performing multiple test runs in controlled operating conditions with equivalent speed and no passengers (“laboratory conditions”).
The study underlines the importance of a comprehensive data processing approach and suggests further steps with a goal of developing a straightforward and time-saving method for evaluating rail corrugation and roughness using vehicle-based indirect vibration measurements.
Author Contributions
Investigation, K.B. and I.H.; methodology, K.B. and I.H.; project administration, I.H.; data analysis and signal processing: K.B., supervision: I.H. and K.V., writing—original draft, K.B.; writing—review and editing, K.B., I.H. and K.V. All authors have read and agreed to the published version of the manuscript.
Funding
The measurements conducted for writing this paper, as well as the publication fee, were funded by the “URITMIS—Urban railway infrastructure predictive maintenance system based on monitoring of vibroacoustic properties” project NPOO.C3.2.R2.I1.06.0001 that is funded as part of Development and research grants from the national plan of recovery and resilience, financed by the EU Commission.
Institutional Review Board Statement
Not applicable.
Informed Consent Statement
Not applicable.
Data Availability Statement
The data presented in this study are available from the corresponding author upon reasonable request.
Acknowledgments
This paper was written as a part of the Croatian science foundation project “HRZZ—Young Researchers’ Career Development Project—Development of DIV Elastic Rail Fastening” DOK-2021-02-9981, and as a part of the “URITMIS—Urban railway infrastructure predictive maintenance system based on monitoring of vibroacoustic properties” project NPOO.C3.2.R2.I1.06.0001 that is funded as a part of Development and research grants from national plan of recovery and resilience, financed by EU-Commission. Special thanks to the Zagreb Electric Tram (ZET), a tram network operator in the city of Zagreb, for providing the ability to use the monitoring data from in-service tram vehicles to analyze accelerations, and to the company Sensornet, for providing bogie accelerations raw data acquired in the scope of the aforementioned monitoring campaign.
Conflicts of Interest
The authors declare no conflicts of interest.
References
- Haladin, I.; Bogut, M.; Lakušić, S. Analysis of tram traffic-induced vibration influence on earthquake damaged buildings. Buildings 2021, 11, 590. [Google Scholar] [CrossRef]
- Lakušić, S.; Haladin, I.; Bogut, M. Analysis of tram induced vibration influence on underground garage structure through exploitation. In Proceedings of the 21st International Congress on Sound and Vibration ICSV 21, Beijing, China, 13–17 July 2014. [Google Scholar]
- Haladin, I.; Burnać, K.; Vranešić, K. Monitoring of vibrations on earthquake-damaged masonry structures induced by tram traffic. In Proceedings of the 28th International Congress on Sound and Vibration ICSV 28, Singapore, 25–27 July 2022. [Google Scholar]
- Haladin, I.; Lakušić, S.; Bogut, M. Overview and analysis of methods for assessing ride comfort on tram tracks. Gradjevinar 2019, 71, 901–921. [Google Scholar] [CrossRef]
- Torstensson, P.T.; Schilke, M. Rail corrugation growth on small radius curves-Measurements and validation of a numerical prediction model. Wear 2013, 303, 381–396. [Google Scholar] [CrossRef]
- Ng, A.K.; Martua, L. Analysis and prediction of rail corrugation growth and axle box acceleration signals for different railway track configurations. In Proceedings of the 7th International Conference on Control, Automation and Robotics ICCAR 2021, Singapore, 23–26 April 2021. [Google Scholar] [CrossRef]
- Kaewunruen, S. Monitoring of rail corrugation growth on sharp curves for track maintenance prioritisation. Int. J. Acoust. Vib. 2018, 23, 35–43. [Google Scholar] [CrossRef]
- Collina, A.; Corradi, R.; Di Gialleonardo, E.; Li, Q. Analysis of the Effect of Running Speed and Bogie Attitude on Rail Corrugation Growth in Sharp Curves. In Noise and Vibration Mitigation for Rail Transportation Systems; Degrande, G., Lombaert, G., Anderson, D., de Vos, P., Gautier, P.-E., Iida, M., Nelson, J.T., Nielsen, J.C.O., Thompson, D.J., Tielkes, T., et al., Eds.; Notes on Numerical Fluid Mechanics and Multidisciplinary Design; Springer: Cham, Switzerland, 2021; Volume 150, pp. 303–311. [Google Scholar] [CrossRef]
- Jeong, W. Spectral characteristics of rail surface by measuring the growth of rail corrugation. Appl. Sci. 2021, 11, 9568. [Google Scholar] [CrossRef]
- EN 13231-2:2020; Railway Applications-Track-Acceptance of Works-Part 2: Acceptance of Reprofiling Rails in Plain Line, Switches, Crossings and Expansion Devices. European Committee for Standardization (CEN): Brussels, Belgium, 2020.
- EN 15610:2019; Railway Applications-Noise Emission-Rail Roughness Measurement Related to Rolling Noise Generation (CEN). European Committee for Standardization: Brussels, Belgium, 2019.
- Grassie, S.L.; Kalousek, J. Rail Corrugation: Characteristics, Causes and Treatments. Inst. Mech. Eng. F J. Rail Rapid Transit. 1993, 207, 57–68. [Google Scholar] [CrossRef]
- Matsumoto, A.; Sato, Y.; Tanimoto, M.; Oka, Y.; Miyauchi, E. Formation Mechanism of Rail Corrugation on Curved Track. Trans. Jpn. Soc. Mech. Eng. Ser. C 1998, 64, 2625–2632. [Google Scholar] [CrossRef][Green Version]
- Sun, Y.Q.; Cole, C.; McClanachan, M.; Wilson, A.; Kaewunruen, S.; Kerr, M.B. Rail Short-wavelength Irregularity Identification based on Wheel-Rail Impact Response Measurements and Simulations. In Proceedings of the Ninth International Heavy Haul Conference, Shanghai, China, 22–25 June 2009; Available online: https://ro.uow.edu.au/engpapers/488 (accessed on 1 July 2023).
- Burnac, K.; Haladin, I. Analysis of Rail Roughness on Tramway Track. In Proceedings of the 33rd International DAAAM Virtual Symposium ‘Intelligent Manufacturing & Automation’, Vienna, Austria, 27–28 October 2022; pp. 536–540. [Google Scholar] [CrossRef]
- Ng, A.K.; Bin Alias, Z.; Chassin, J.F.; Yebra, J.H. Managing rail corrugation through modelling, simulation, and instrumentation technologies. In Proceedings of the IEEE International Conference on Intelligent Rail Transportation ICIRT 2016, Birmingham, UK, 23–25 August 2016; pp. 307–314. [Google Scholar] [CrossRef]
- Grassie, S.L. Rail irregularities, corrugation and acoustic roughness: Characteristics, significance and effects of reprofiling. Proc. Inst. Mech. Eng. F J. Rail Rapid Transit. 2012, 226, 542–557. [Google Scholar] [CrossRef]
- Suda, Y. Effects of vibration system and rolling conditions on the development of corrugations. Wear 1991, 144, 227–242. [Google Scholar] [CrossRef]
- Ahlbeck, D.R.; Daniels, L.E. Investigation of rail corrugations on the Baltimore Metro. Wear 1991, 144, 197–210. [Google Scholar] [CrossRef]
- Eadie, D.T.; Kalousek, J.; Chiddick, K.C. The role of high positive friction (HPF) modifier in the control of short pitch corrugations and related phenomena. Wear 2002, 253, 185–192. [Google Scholar] [CrossRef]
- Kalousek, J.; Johnson, K.L. An Investigation of Short Pitch Wheel and Rail Corrugations on the Vancouver Mass Transit System. Proc. Inst. Mech. Eng. F J. Rail Rapid Transit. 1992, 206, 127–135. [Google Scholar] [CrossRef]
- Ilias, H. The influence of railpad stiffness on wheelset/track interaction and corrugation growth. J. Sound Vib. 1999, 227, 935–948. [Google Scholar] [CrossRef]
- Hiensch, M.; Nielsen, J.C.O.; Verheijen, E. Rail corrugation in The Netherlands—Measurements and simulations. Wear 2002, 253, 140–149. [Google Scholar] [CrossRef]
- Tufano, A.R.; Chiello, O.; Pallas, M.A.; Faure, B.; Chaufour, C.; Reynaud, E.; Vincent, N. Numerical and Experimental Analysis of Transfer Functions for On-Board Indirect Measurements of Rail Acoustic Roughness. In Noise and Vibration Mitigation for Rail Transportation Systems; Degrande, G., Lombaert, G., Anderson, D., de Vos, P., Gautier, P.-E., Iida, M., Nelson, J.T., Nielsen, J.C.O., Thompson, D.J., Tielkes, T., et al., Eds.; Notes on Numerical Fluid Mechanics and Multidisciplinary Design; Springer: Cham, Switzerland, 2021; Volume 150, pp. 295–302. [Google Scholar] [CrossRef]
- Lakušić, S.; Haladin, I.; Jukić, A.; Andraši, N.; Piplica, P. Rail roughness measurement and analysis in frame of rail vehicle pass-by noise measurements. In Proceedings of the 2nd International Conference on Road and Rail Infrastructure CETRA 2012, Dubrovnik, Croatia, 7–9 May 2012. [Google Scholar]
- Tanaka, H.; Shimizu, A. Practical Application of Portable Trolley for the Continuous Measurement of Rail Surface Roughness for Rail Corrugation Maintenance. Q. Rep. RTRI 2016, 57, 118–124. [Google Scholar] [CrossRef] [PubMed]
- Jeong, D.; Choi, H.S.; Choi, Y.J.; Jeong, W. Measuring acoustic roughness of a longitudinal railhead profile using a multi-sensor integration technique. Sensors 2019, 19, 1610. [Google Scholar] [CrossRef]
- Karpenko, M.; Ževžikov, P.; Stosiak, M.; Skačkauskas, P.; Borucka, A.; Delembovskyi, M. Vibration Research on Centrifugal Loop Dryer Machines Used in Plastic Recycling Processes. Machines 2024, 12, 29. [Google Scholar] [CrossRef]
- Mauz, F.; Wigger, R.; Wahl, T.; Kuffa, M.; Wegener, K. Acoustic Roughness Measurement of Railway Tracks: Implementation of a Chord-Based Optical Measurement System on a Train. Appl. Sci. 2022, 12, 11988. [Google Scholar] [CrossRef]
- Dang, D.Z.; Lai, C.C.; Ni, Y.Q.; Zhao, Q.; Su, B.; Zhou, Q.F. Image Classification-Based Defect Detection of Railway Tracks Using Fiber Bragg Grating Ultrasonic Sensors. Appl. Sci. 2023, 13, 384. [Google Scholar] [CrossRef]
- Phamová, L.; Bauer, P.; Malinský, J.; Richter, M. Indirect Method of Rail Roughness Measurement—VUKV Implementation and Initial Results. In Noise and Vibration Mitigation for Rail Transportation Systems; Nielsen, J.C.O., Anderson, D., Gautier, P.-E., Iida, M., Nelson, J.T., Thompson, D., Tielkes, T., Towers, D.A., de Vos, P., Eds.; Notes on Numerical Fluid Mechanics and Multidisciplinary Design; Springer: Berlin/Heidelberg, Germany, 2015; Volume 126, pp. 189–196. [Google Scholar] [CrossRef]
- Rita Tufano, A.; Chiello, O.; Agnès Pallas, M.; Faure, B.; Chaufour, C.; Augez, R.; Reynaud, E.; Vincent, N. Calibration of transfer functions on a standstill vehicle for on-board indirect measurements of rail acoustic roughness. In Proceedings of the Forum Acusticum, Lyon, France, 7–11 December 2020. [Google Scholar]
- Peng, H.; Yao, Y.; Cai, X.; Zhong, Y.; Sun, T. Field measurement analysis and control measures evaluation of metro vehicle noise caused by rail corrugation. Appl. Sci. 2021, 11, 11190. [Google Scholar] [CrossRef]
- Tufano, A.R.; Chiello, O.; Pallas, M.-A.; Reynaud, E.; Vincent, N. On-board indirect measurements of the acoustic quality of railway track: State-of-the art and simulations. In Proceedings of the INTER-NOISE and NOISE-CON Congress and Conference, Madrid, Spain, 16–19 June 2019; Volume 259, pp. 4010–4019. [Google Scholar]
- Hardy, A.E.J.; Jones, R.R.K.; Turner, S. The influence of real-world rail head roughness on railway noise prediction. J. Sound Vib. 2006, 293, 965–974. [Google Scholar] [CrossRef]
- Horizon 2020; TRANSIT Project Shift2Rail. Train Pass-By Noise Source Characterization and Separation TOOLS for Cost-Effective Vehicle Certification. Available online: https://transit-prj.eu/ (accessed on 7 July 2023).
- Dittrich, M.G.; Janssens, M.H.A. Improved measurement methods for railway rolling noise. J. Sound Vib. 2000, 231, 595–609. [Google Scholar] [CrossRef]
- Li, Q.; Thompson, D.J.; Toward, M.G. Estimation of track parameters and wheel–rail combined roughness from rail vibration. Proc. Inst. Mech. Eng. Part F J. Rail Rapid Transit. 2018, 232, 1149–1167. [Google Scholar] [CrossRef]
- Dittrich, M.G.; Létourneaux, F.; Dupuis, H. Background for a New Standard on Pass-By Measurement of Combined Roughness, Track Decay Rate and Vibroacoustic Transfer Functions. In Noise and Vibration Mitigation for Rail Transportation Systems; Notes on Numerical Fluid Mechanics and Multidisciplinary Design; Springer: Berlin/Heidelberg, Germany, 2015; Volume 126, pp. 197–204. [Google Scholar] [CrossRef]
- Höjer, M.; Almgren, M. Monitoring system for track roughness. In Proceedings of the EuroNoise 2015, Maastricht, The Netherlands, 1–3 June 2015. [Google Scholar]
- Vinkó, Á. Monitoring and condition assessment of tramway track using in-service vehicle. Pollack Period. 2016, 11, 73–82. [Google Scholar] [CrossRef]
- Tanaka, H.; Matsumoto, M.; Harada, Y. Application of axle-box acceleration to track condition monitoring for rail corrugation management. In Proceedings of the 7th IET Conference on Railway Condition Monitoring RCM 2016, Birmingham, UK, 27–28 September 2016. [Google Scholar]
- Faccini, L.; Karaki, J.; Di Gialleonardo, E.; Somaschini, C.; Bocciolone, M.; Collina, A. A Methodology for Continuous Monitoring of Rail Corrugation on Subway Lines Based on Axlebox Acceleration Measurements. Appl. Sci. 2023, 13, 3773. [Google Scholar] [CrossRef]
- Jovanović, S.; Guler, H.; Čoko, B. Track degradation analysis in the scope of railway infrastructure maintenance management systems. J. Croat. Assoc. Civ. Eng. 2015, 67, 247–258. [Google Scholar] [CrossRef]
- Fidler, P.R.A.; Hartley, S.; Talbot, J.P. Project VIMTO: A new system for the vibration and impact monitoring of tram operations. In Proceedings of the 8th International Conference on Structural Health Monitoring of Intelligent Infrastructure, Brisbane, Australia, 5–8 December 2017. [Google Scholar] [CrossRef]
- Bongini, E.; Grassie, S.L.; Saxon, M.J. ‘Noise Mapping’ of a Railway Network: Validation and Use of a System Based on Measurement of Axlebox Vibration. In Noise and Vibration Mitigation for Rail Transportation Systems; Maeda, T., Gautier, P.-E., Hanson, C.E., Hemsworth, B., Nelson, J.T., Schulte-Werning, B., Thompson, D., Vos, P., Eds.; Notes on Numerical Fluid Mechanics and Multidisciplinary Design; Springer: Tokyo, Japan, 2012; Volume 118, pp. 505–513. [Google Scholar] [CrossRef]
- CEN/TR 16891; Railway Applications-Acoustics-Measurement Method for Combined Roughness, Track Decay Rates and Transfer Functions. European Committee for Standardization: Brussels, Belgium, 2017.
- Czechyra, B.; Komorski, P.; Nowakowski, T. The impact of changes in the dynamic characteristic of a tram wheels on vibroacoustic effects generated by tram. In Proceedings of the 23rd International Congress on Sound & Vibration ICSV 23, Athens, Greece, 10–14 July 2016. [Google Scholar]
- Zheng, S.; Zhong, Q.; Chen, X.; Peng, L.; Cui, G. The Rail Surface Defects Recognition via Operating Service Rail Vehicle Vibrations. Machines 2022, 10, 796. [Google Scholar] [CrossRef]
- Salvador, P.; Naranjo, V.; Insa, R.; Teixeira, P. Axlebox accelerations: Their acquisition and time-frequency characterisation for railway track monitoring purposes. Measurement 2016, 82, 301–312. [Google Scholar] [CrossRef]
- Pieringer, A. Time-Domain Modelling of High-Frequency Wheel/Rail Interaction. Ph.D. Thesis, Chalmers University of Technology, Chalmers, Sweden, 2011. [Google Scholar]
- Pieringer, A.; Kropp, W. Model-based estimation of rail roughness from axle box acceleration. Appl. Acoust. 2022, 193, 108760. [Google Scholar] [CrossRef]
- Bocciolone, M.; Caprioli, A.; Cigada, A.; Collina, A. A measurement system for quick rail inspection and effective track maintenance strategy. Mech. Syst. Signal Process 2007, 21, 1242–1254. [Google Scholar] [CrossRef]
- Li, Z.; Molodova, M.; Nunez, A.; Dollevoet, R. Improvements in axle box acceleration measurements for the detection of light squats in railway infrastructure. IEEE Trans. Ind. Electron. 2015, 62, 4385–4397. [Google Scholar] [CrossRef]
- Carrigan, T.D.; Talbot, J.P. Addressing challenges in measuring rail roughness using axle-box accelerometers on trains. In Proceedings of the 28th International Conference on Sound and Vibration ICSV28, Singapore, 25–27 July 2022. [Google Scholar]
- Carrigan, T.D.; Fidler, P.R.A.; Talbot, J.P. On the derivation of rail roughness spectra from axle-box vibration: Development of a new technique. In Proceedings of the International Conference on Smart Infrastructure and Construction ICSIC 2019: Driving Data-Informed Decision-Making, Cambridge, UK, 8–10 July 2019; ICE Publishing: London, UK; pp. 549–557. [Google Scholar] [CrossRef]
- Carrigan, T.D.; Talbot, J.P. Extracting information from axle-box acceleration: On the derivation of rail roughness spectra in the presence of wheel roughness. In Noise and Vibration Mitigation for Rail Transportation Systems; Degrande, G., Lombaert, G., Anderson, D., de Vos, P., Gautier, P.-E., Iida, M., Nelson, J.T., Nielsen, J.C.O., Thompson, D.J., Tielkes, T., et al., Eds.; Notes on Numerical Fluid Mechanics and Multidisciplinary Design; Springer: Cham, Switzerland, 2021; Volume 150, pp. 286–294. [Google Scholar]
- Lakušić, S.; Haladin, I.; Ahac, M. The Effect of Rail Fastening System Modifications on Tram Traffic Noise and Vibration. Shock. Vib. 2016, 2016, 4671302. [Google Scholar] [CrossRef]
- Končar Electric Vehicle (Končar KEV). Končar tramway vehicle type TMK 2200—Vehicle properties. Technol. Rep. 2024, 1, 1–3. [Google Scholar]
- Lakušić, S.; Haladin, I.; Ahac, M. Influence of covered mileage on tram wheel wear. In Proceedings of the Conference Railway Engineering, London, UK, 29–30 June 2011. [Google Scholar]
- HRN EN 14730-2; Railway Applications-Track-Aluminothermic Welding of Rails-Part 2: Qualification of Aluminothermic Welders, Approval of Contractors and Acceptance of Welds. European Committee for Standardization (CEN): Brussels, Belgium, 2006.
- Bracciali, A.; Piccioli, F.; De Cicco, T. Measurement and analysis of mid wavelength rail irregularity. In Proceedings of the Railway Engineering, London, UK, 24–25 June 2009. [Google Scholar]
- Fisher, N.I.; Chambers, J.M.; Cleveland, W.S.; Kleiner, B.; Tukey, P.A. Graphical Methods for Data Analysis. Biometrics 1984, 40, 567–568. [Google Scholar] [CrossRef]
- Mcgill, R.; Tukey, J.W.; Larsen, W.A. Variations of Box Plots. Am. Stat. 1978, 32, 12–16. [Google Scholar] [CrossRef]
- Komorski, P.; Nowakowski, T.; Firlik, B.; Szymański, G.M. Analysis of wheel and track irregularities impact on the vibroacoustic signals emission in rail vehicles. In Proceedings of the 25th International Congress on Sound and Vibration ICSV 25, Hiroshima, Japan, 8–12 July 2018. [Google Scholar]
- Lutzenberger, S.; Létourneaux, F.; Aubin, F.; Jones, C.; Eichenlaub, C.; Stegemann, B.; Czolbe, C. Revision of EN 15610 standard: Wheel roughness measurements. In Proceedings of the Euronoise 2018, Crete, Greece, 27–31 May 2018. [Google Scholar]
- Wei, Z. Modelling and Monitoring of Dynamic Wheel-Rail Interaction at Railway Crossing. Ph.D. Thesis, Delft University of Technology, Delft, The Netherlands, 2018. [Google Scholar]
- Sun, J.; Meli, E.; Song, X.; Chi, M.; Jiao, W.; Jiang, Y. A novel measuring system for high-speed railway vehicles hunting monitoring able to predict wheelset motion and wheel/rail contact characteristics. Veh. Syst. Dyn. 2023, 61, 1621–1643. [Google Scholar] [CrossRef]
- Ralbovsky, M.; Morga, M. Dynamic train wheel forces: Numerical parameter study. In Proceedings of the conference ISMA, Leuven, Belgium, 17–19 September 2012. [Google Scholar]
- Semenov, S.; Mikhailov, E.; Kovtanets, M.; Sergienko, O.; Dižo, J.; Blatnický, M.; Gerlici, J.; Kostrzewski, M. Kinematic running resistance of an urban rail vehicle undercarriage: A study of the impact of wheel design. Sci. Rep. 2023, 13, 10856. [Google Scholar] [CrossRef]
- Chiengson, C.; Kaewunruen, S.; Aikawa, A. Nonlinear phenomena of short and long wavelength rail defects on vehicle-track interaction. In Proceedings of the 13th World Congress on Computational Mechanics (WCCM XIII), New York, NY, USA, 22–27 July 2018; pp. 1388–1399. [Google Scholar]
- Mauz, F.; Wigger, R.; Wahl, T.; Kuffa, M.; Wegener, K. Acoustic roughness measurement of railway tracks: Implementation of an optical measurement approach & possible improvements to the standard. Proc. Inst. Mech. Eng. F J. Rail Rapid Transit. 2022, 236, 1210–1217. [Google Scholar] [CrossRef]
- Balekwa, B.M.; Von Kallon, D.V. Correlation of Short Pitch Rail Corrugation with Railway Wheel-Track Resonance at Low Frequencies of Excitation. Vibration 2020, 3, 491–520. [Google Scholar] [CrossRef]
- Suarez, B.; Chover, J.A.; Rodriguez, P.; Gonzalez, F.J. Effectiveness of resilient wheels in reducing noise and vibrations. Proc. Inst. Mech. Eng. F J. Rail Rapid Transit. 2011, 225, 545–565. [Google Scholar] [CrossRef]
- Desanghere, G.; Stallaert, B.; Masoumi, H. Simulation of railway rolling noise emission: Determination of the average wheel roughness of a vehicle. In Proceedings of the conference ISMA 2014, Leuven, Belgium, 15–17 September 2014; pp. 3459–3474. [Google Scholar]
- Ramos, A.C.R.; Santos, R.B.; Melo, C.A.P.; Perez, I.C.S. Vibroacoustic Transfer Function Study in the Design of Vehicle Suspensions; SAE Technical Papers; SAE International: Warrendale, PA, USA, 2016. [Google Scholar] [CrossRef]
- Janssens, M.H.A.; Dittrich, M.G.; De Beer, F.G.; Jones, C.J.C. Railway noise measurement method for pass-by noise, total effective roughness, transfer functions and track spatial decay. J. Sound. Vib. 2006, 293, 1007–1028. [Google Scholar] [CrossRef]
- Jansen, H.W.; Dittrich, M.G. Separation of Rolling Noise and Aerodynamic Noise by In-Service Measurement of Combined Roughness and Transfer Functions on a High Speed Slab Track. In Noise and Vibration Mitigation for Rail Transportation Systems; Notes on Numerical Fluid Mechanics and Multidisciplinary Design; Springer: Cham, Switzerland, 2012; Volume 118, pp. 479–486. [Google Scholar] [CrossRef]
- Chiello, O.; Le Bellec, A.; Pallas, M.-A.; Munoz, P.; Janillon, V. Characterisation of wheel/rail roughness and track decay rates on a tram network. In Proceedings of the 48th International Congress and Exposition on Noise Control Engineering (Inter-Noise 2019), Madrid, Spain, 16–19 June 2019; Available online: https://hal.science/hal-02305430v1 (accessed on 5 July 2023).
Disclaimer/Publisher’s Note: The statements, opinions and data contained in all publications are solely those of the individual author(s) and contributor(s) and not of MDPI and/or the editor(s). MDPI and/or the editor(s) disclaim responsibility for any injury to people or property resulting from any ideas, methods, instructions or products referred to in the content. |
© 2025 by the authors. Licensee MDPI, Basel, Switzerland. This article is an open access article distributed under the terms and conditions of the Creative Commons Attribution (CC BY) license (https://creativecommons.org/licenses/by/4.0/).