

3D Modular Construction Made of Precast SFRC-Stiffened Panels
 , , , ,
Abstract
1. Introduction
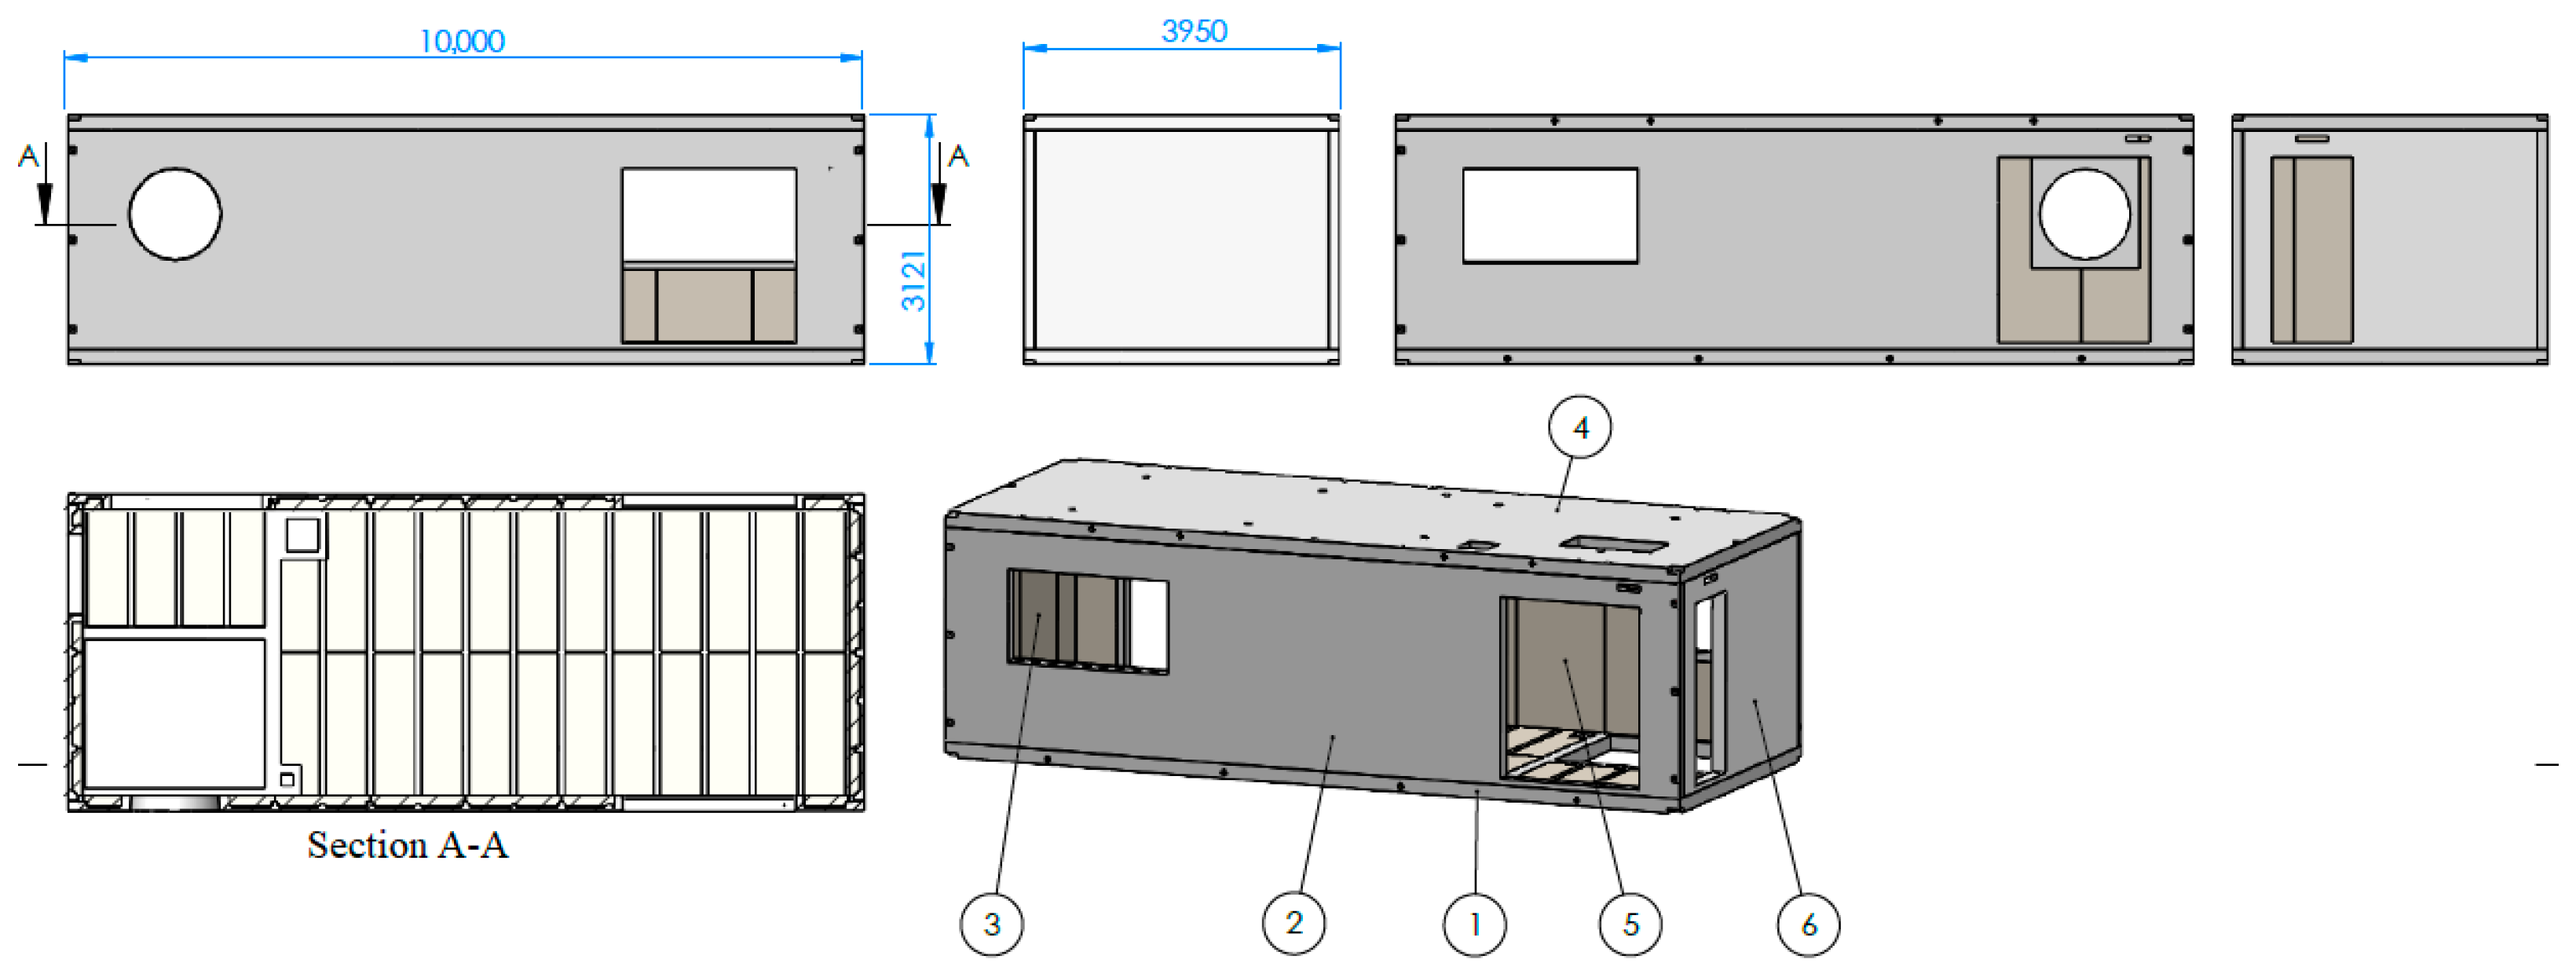
2. Modular Unit Definition
3. Mechanical Characterization of SFRC Material
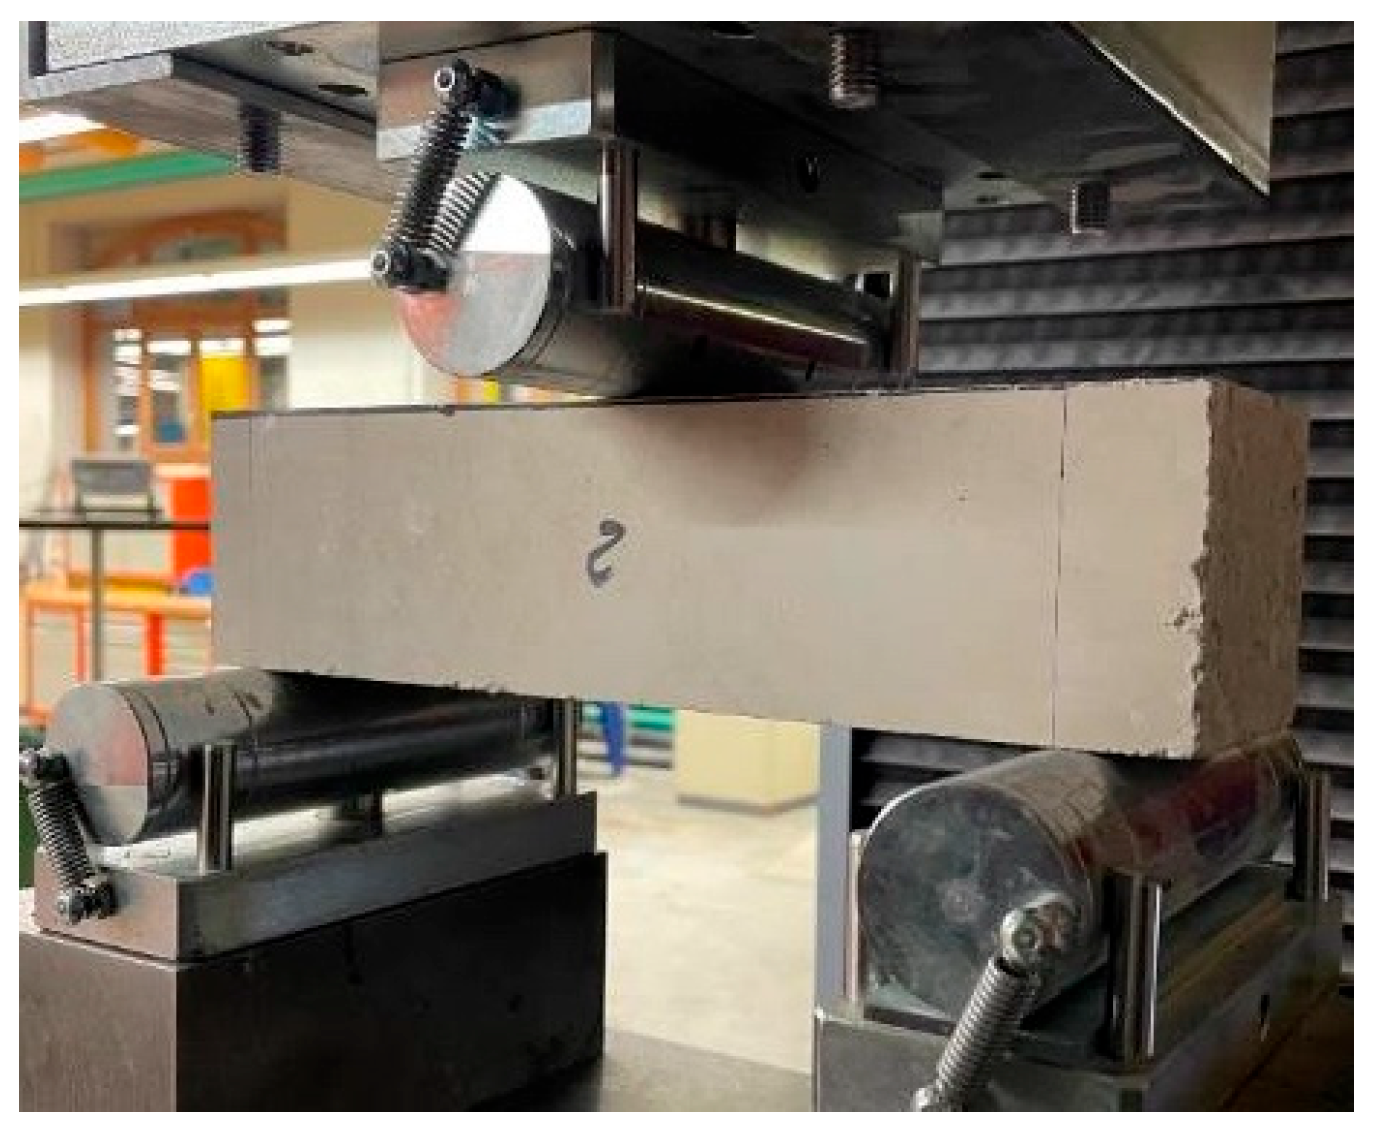
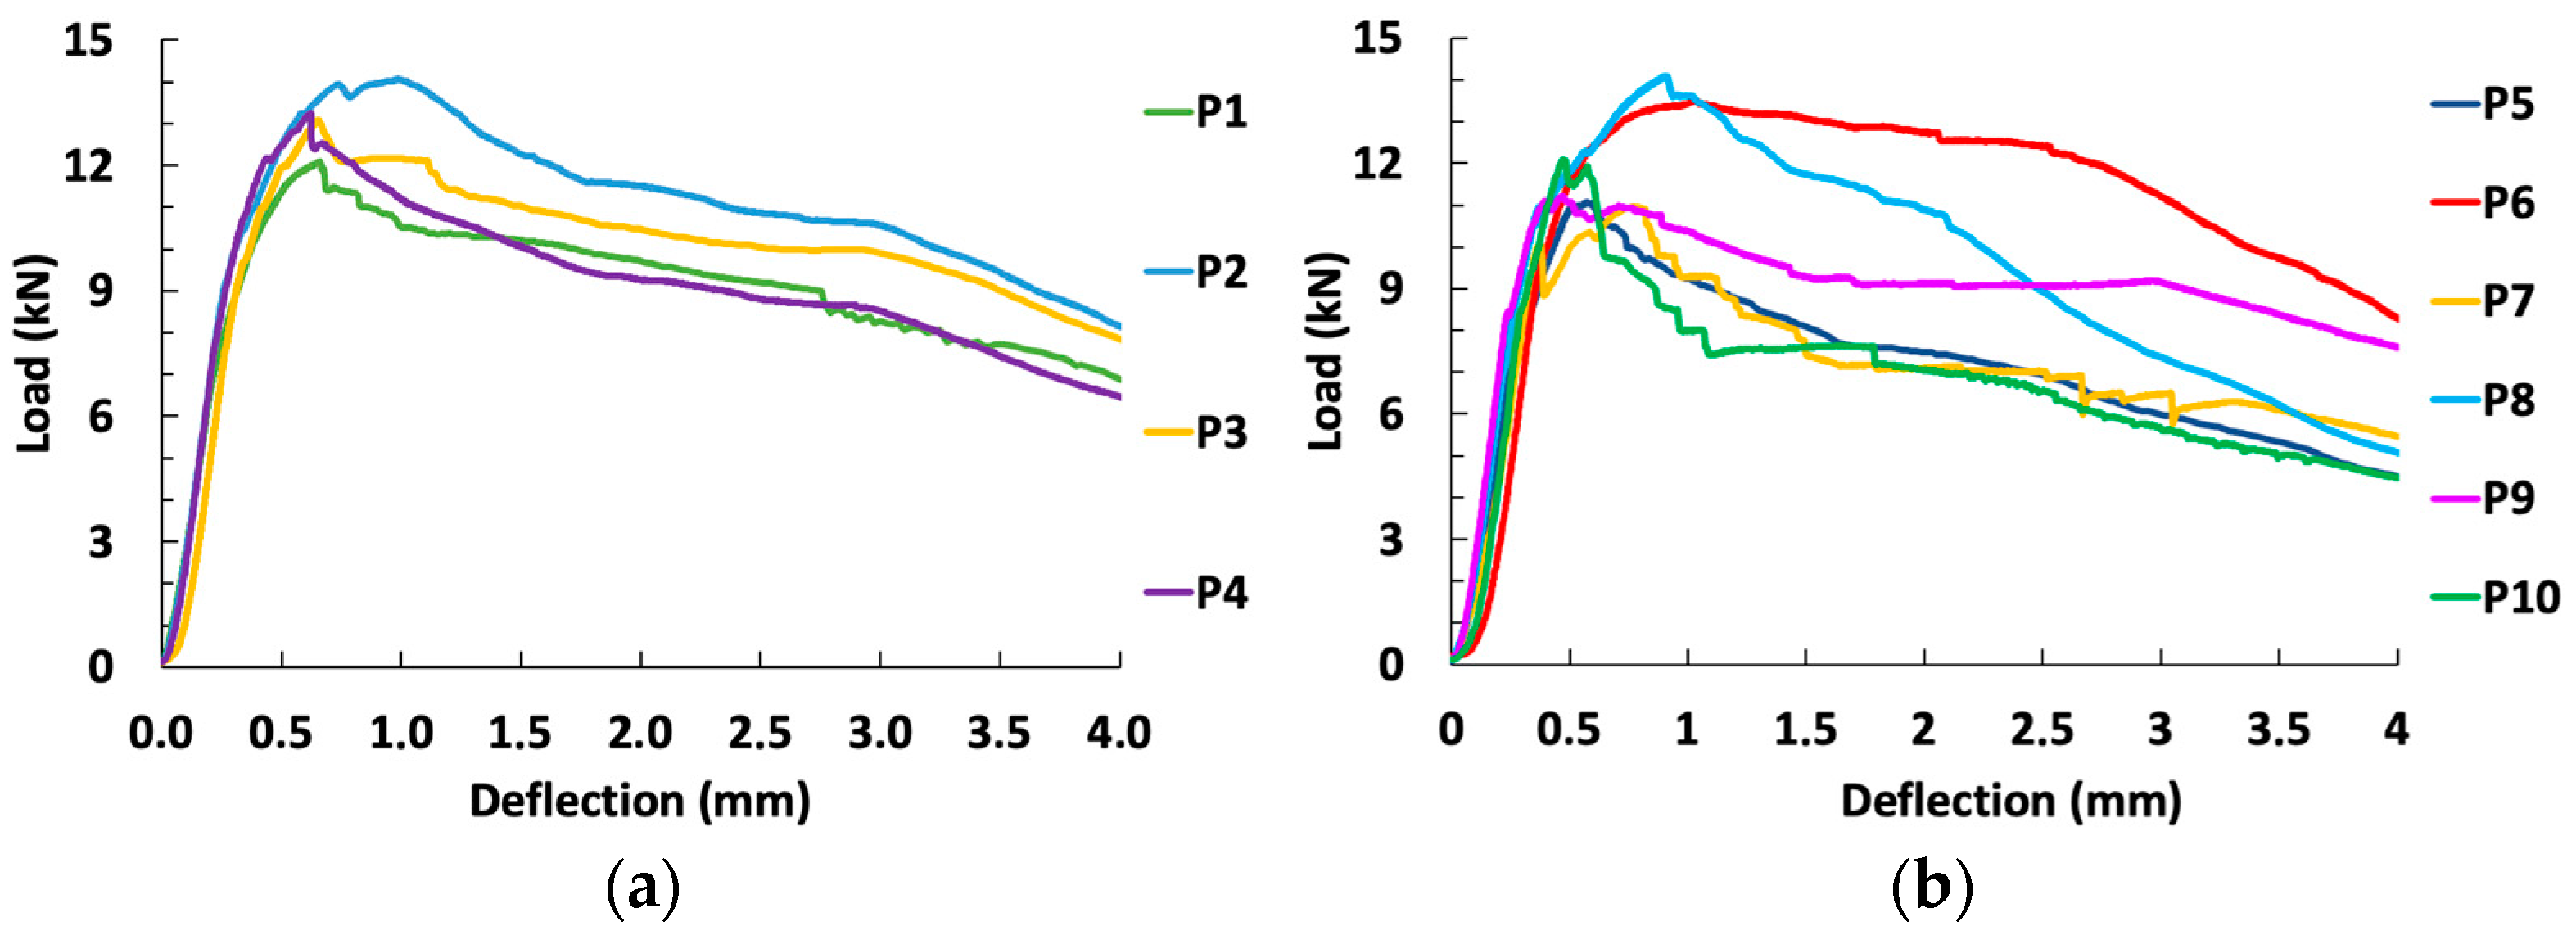
3.1. Three-Point Bending on 7 cm × 7 cm × 28 cm Prismatic Specimens
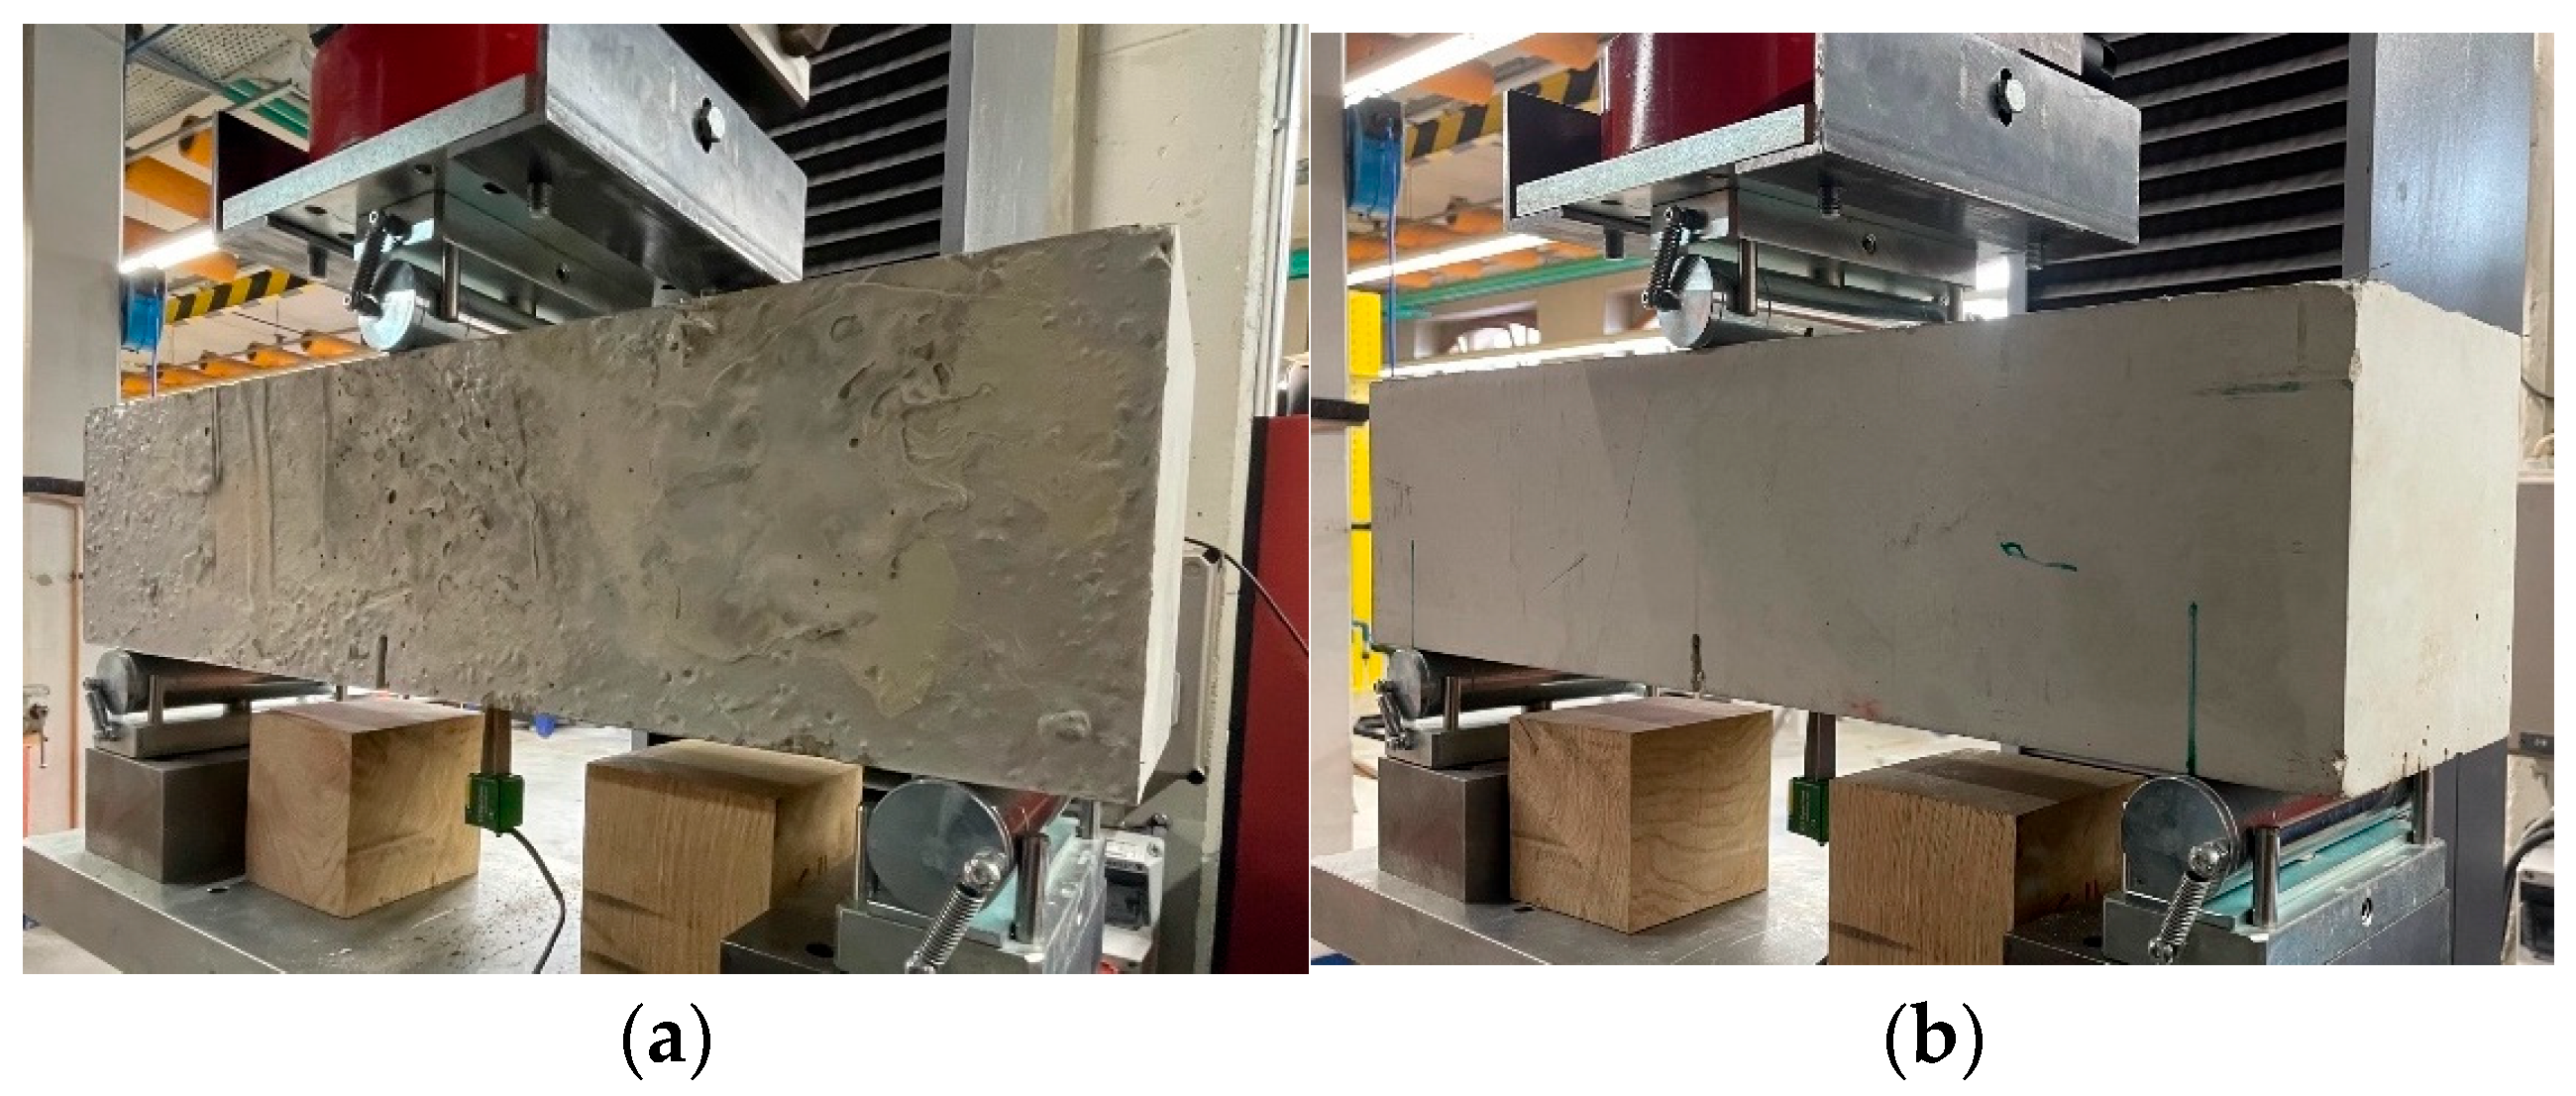
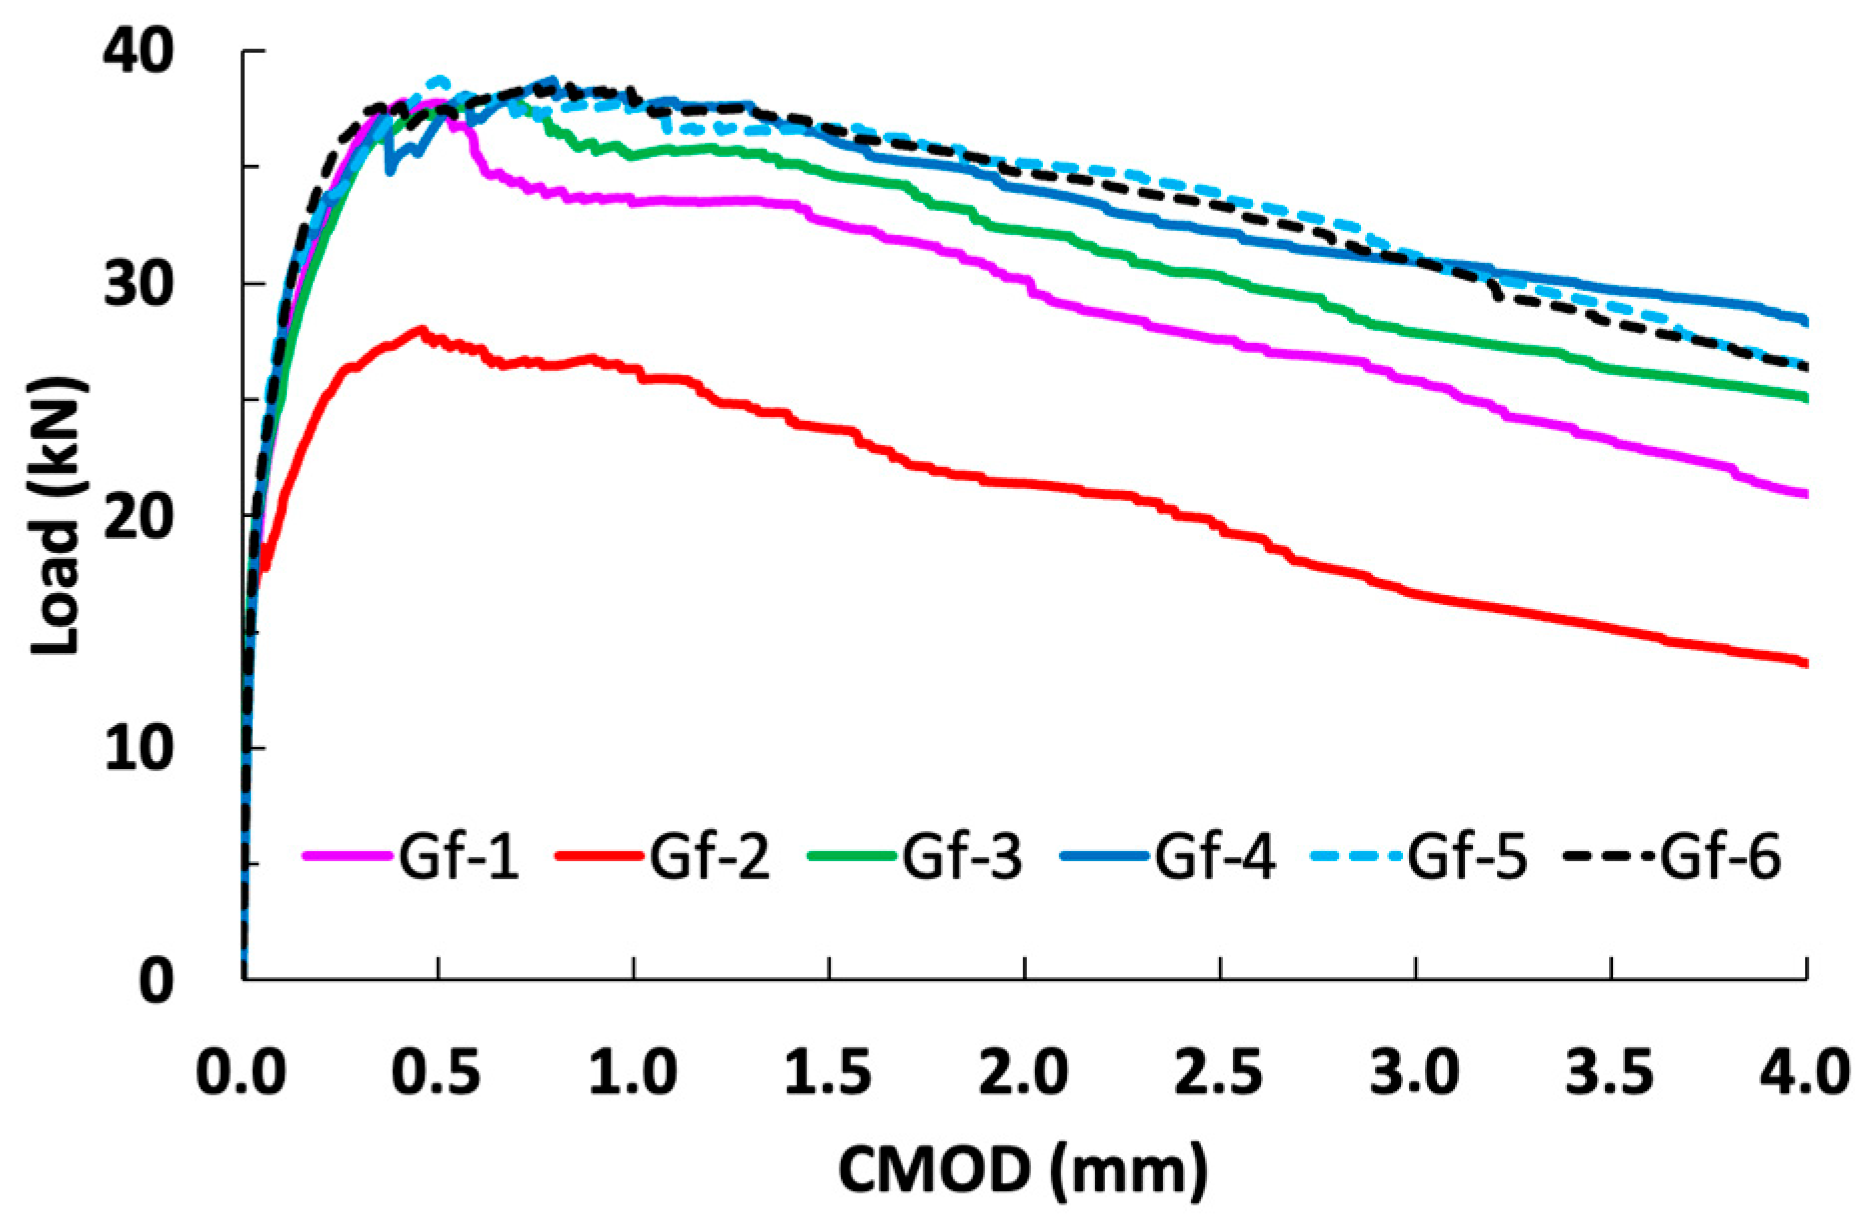
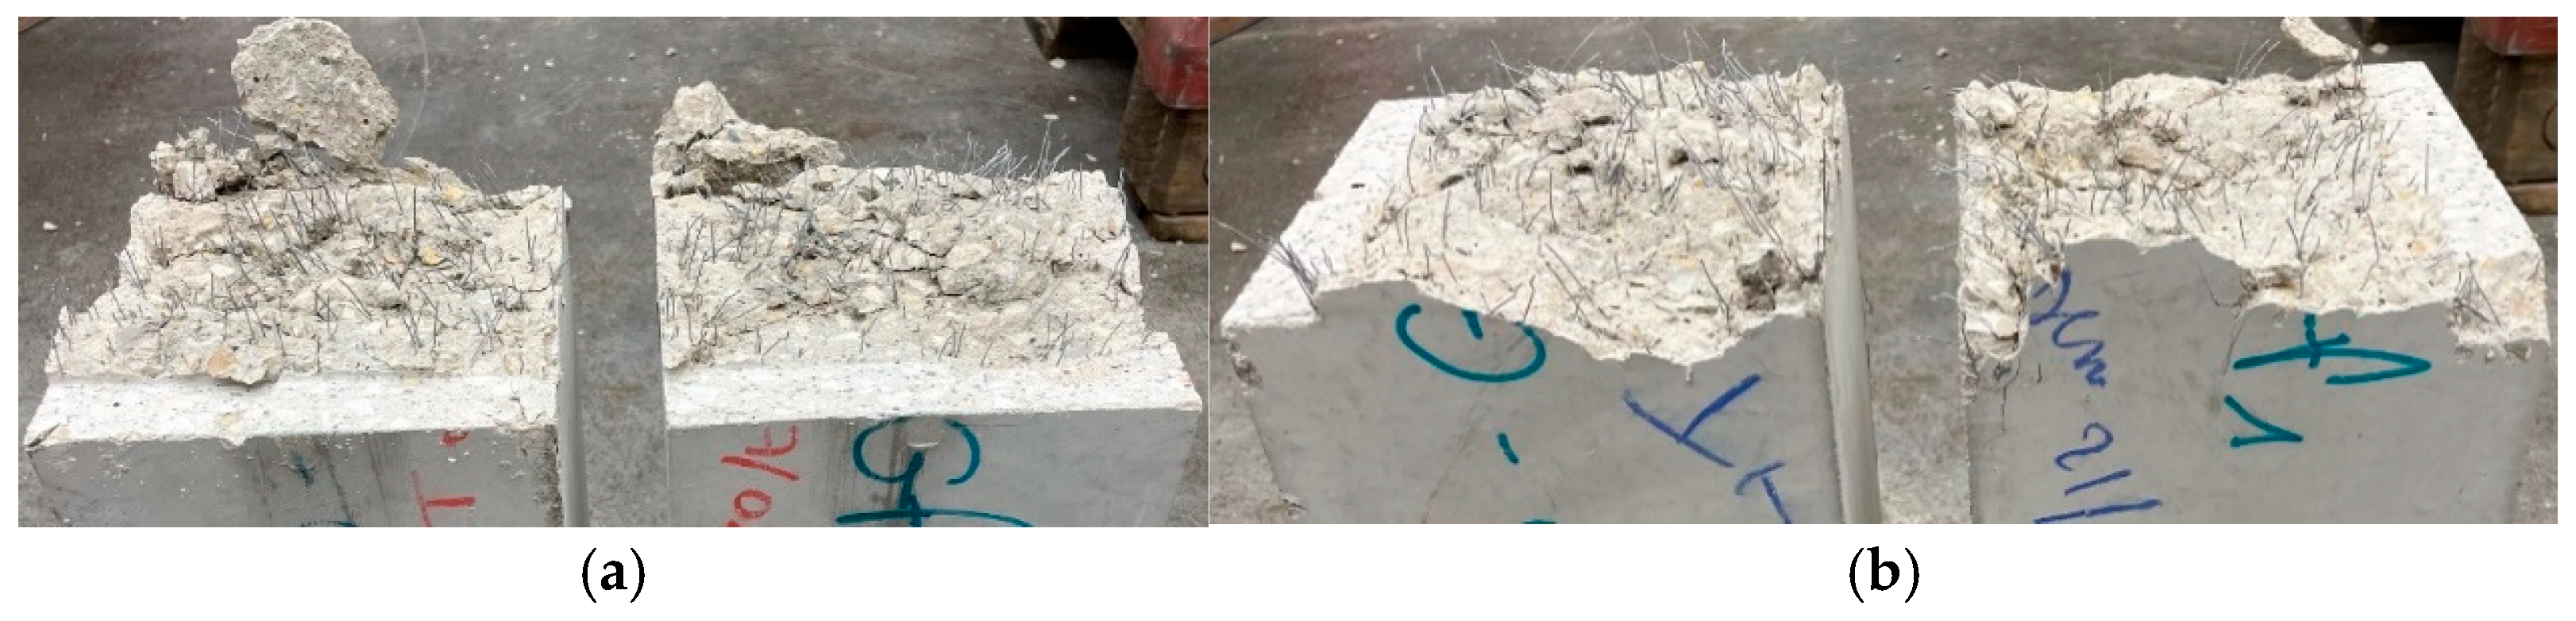
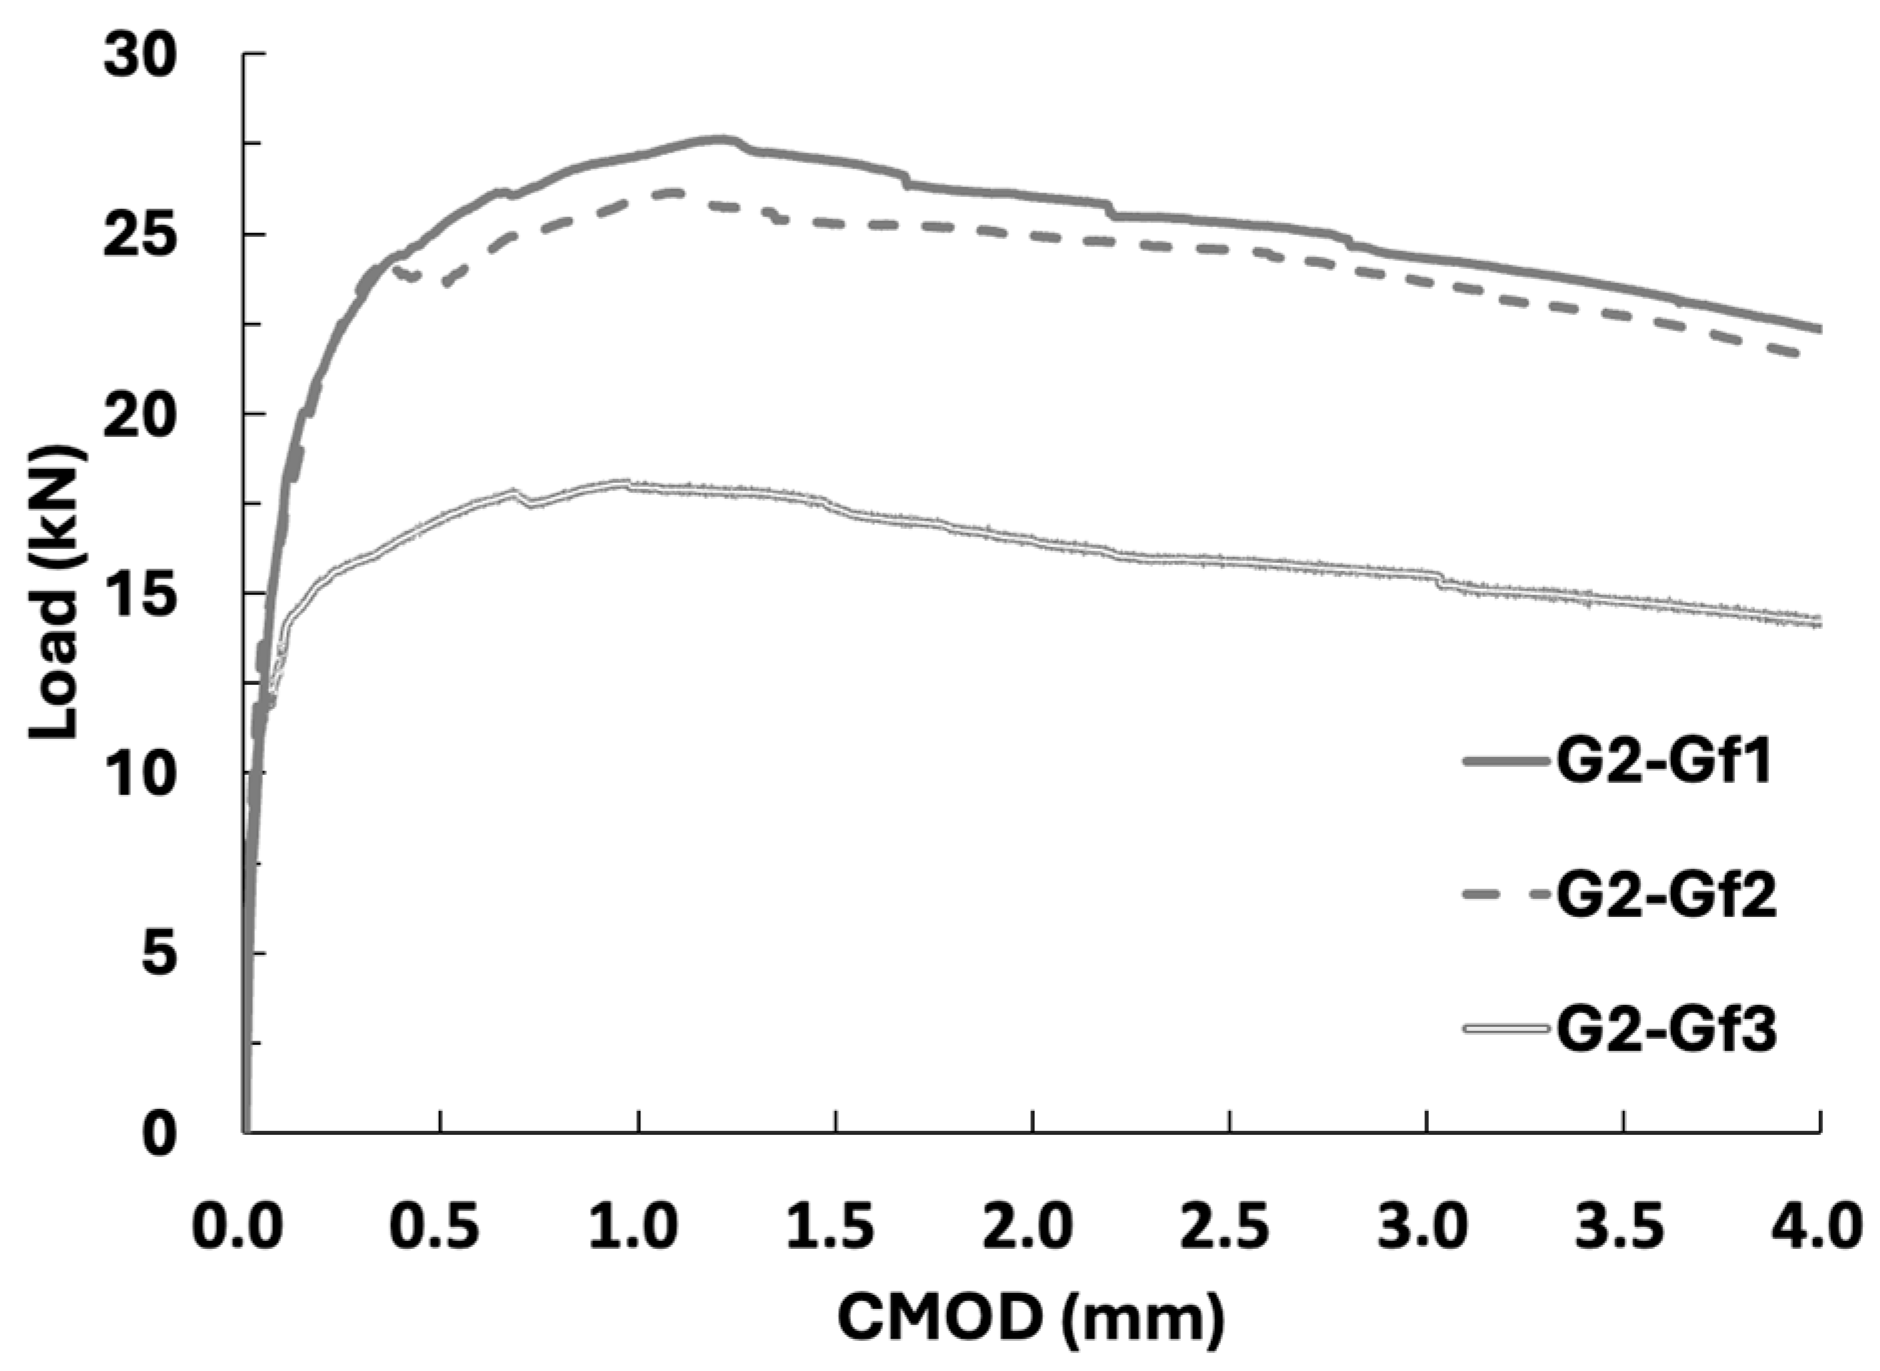
3.2. Three-Point Bending on Prismatic Specimens of 15 cm × 15 cm × 60 cm
4. Mechanical Characterization of the 3D Module Constitutive Slabs: Experiments
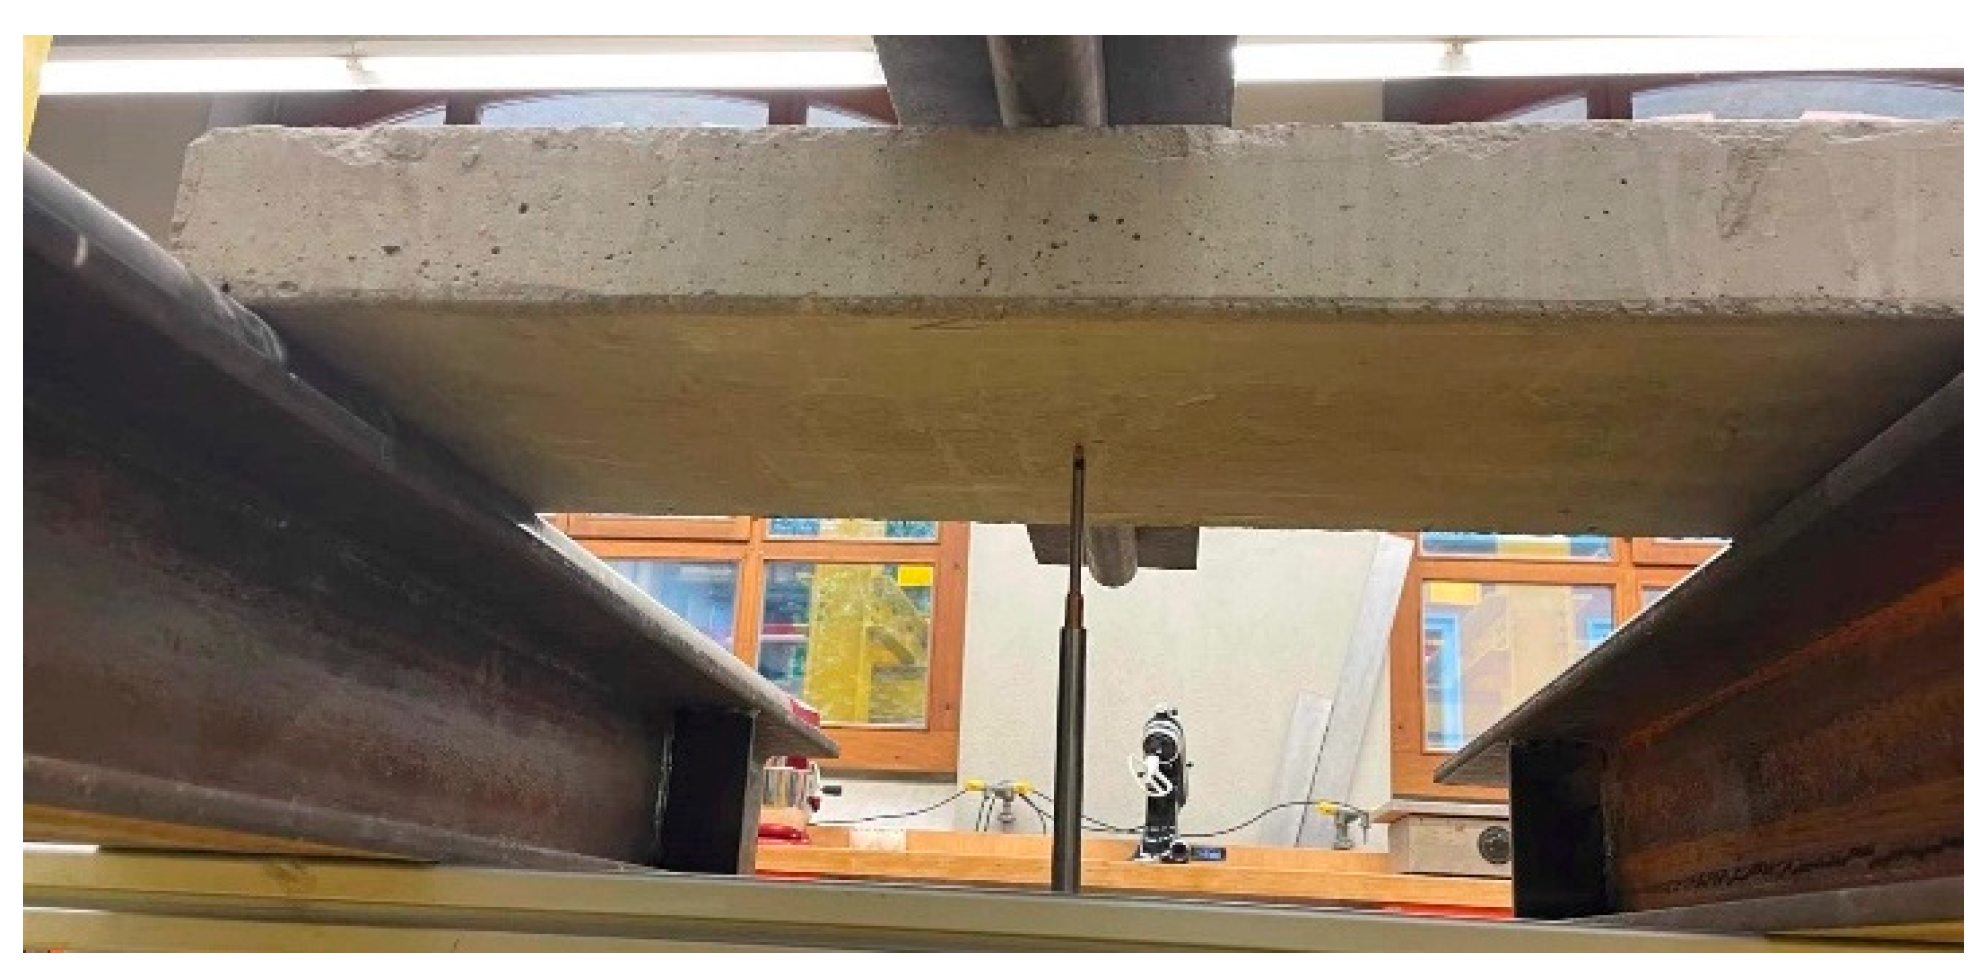
4.1. Unstiffened Slab
4.2. Stiffened Slab
5. Finite Element Modeling
5.1. Discretization: Choice of Element Type
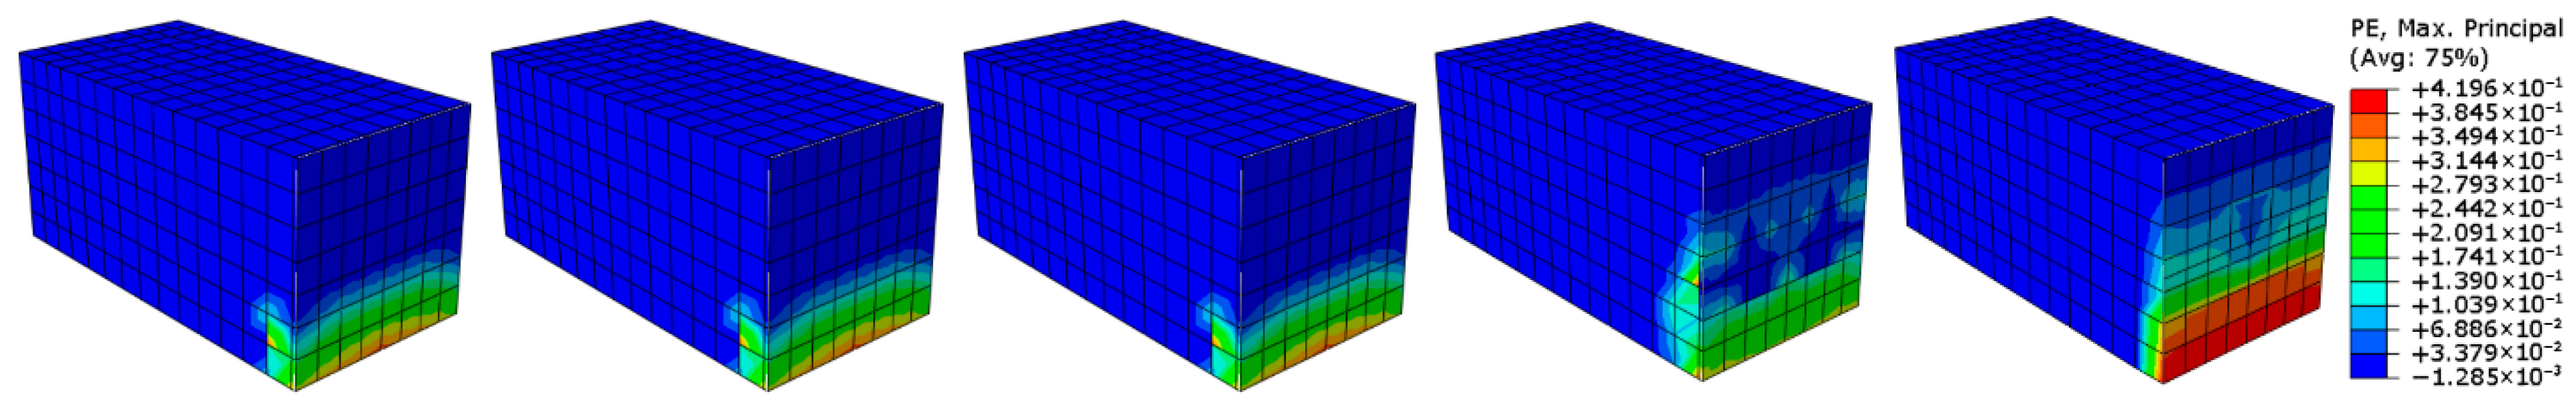
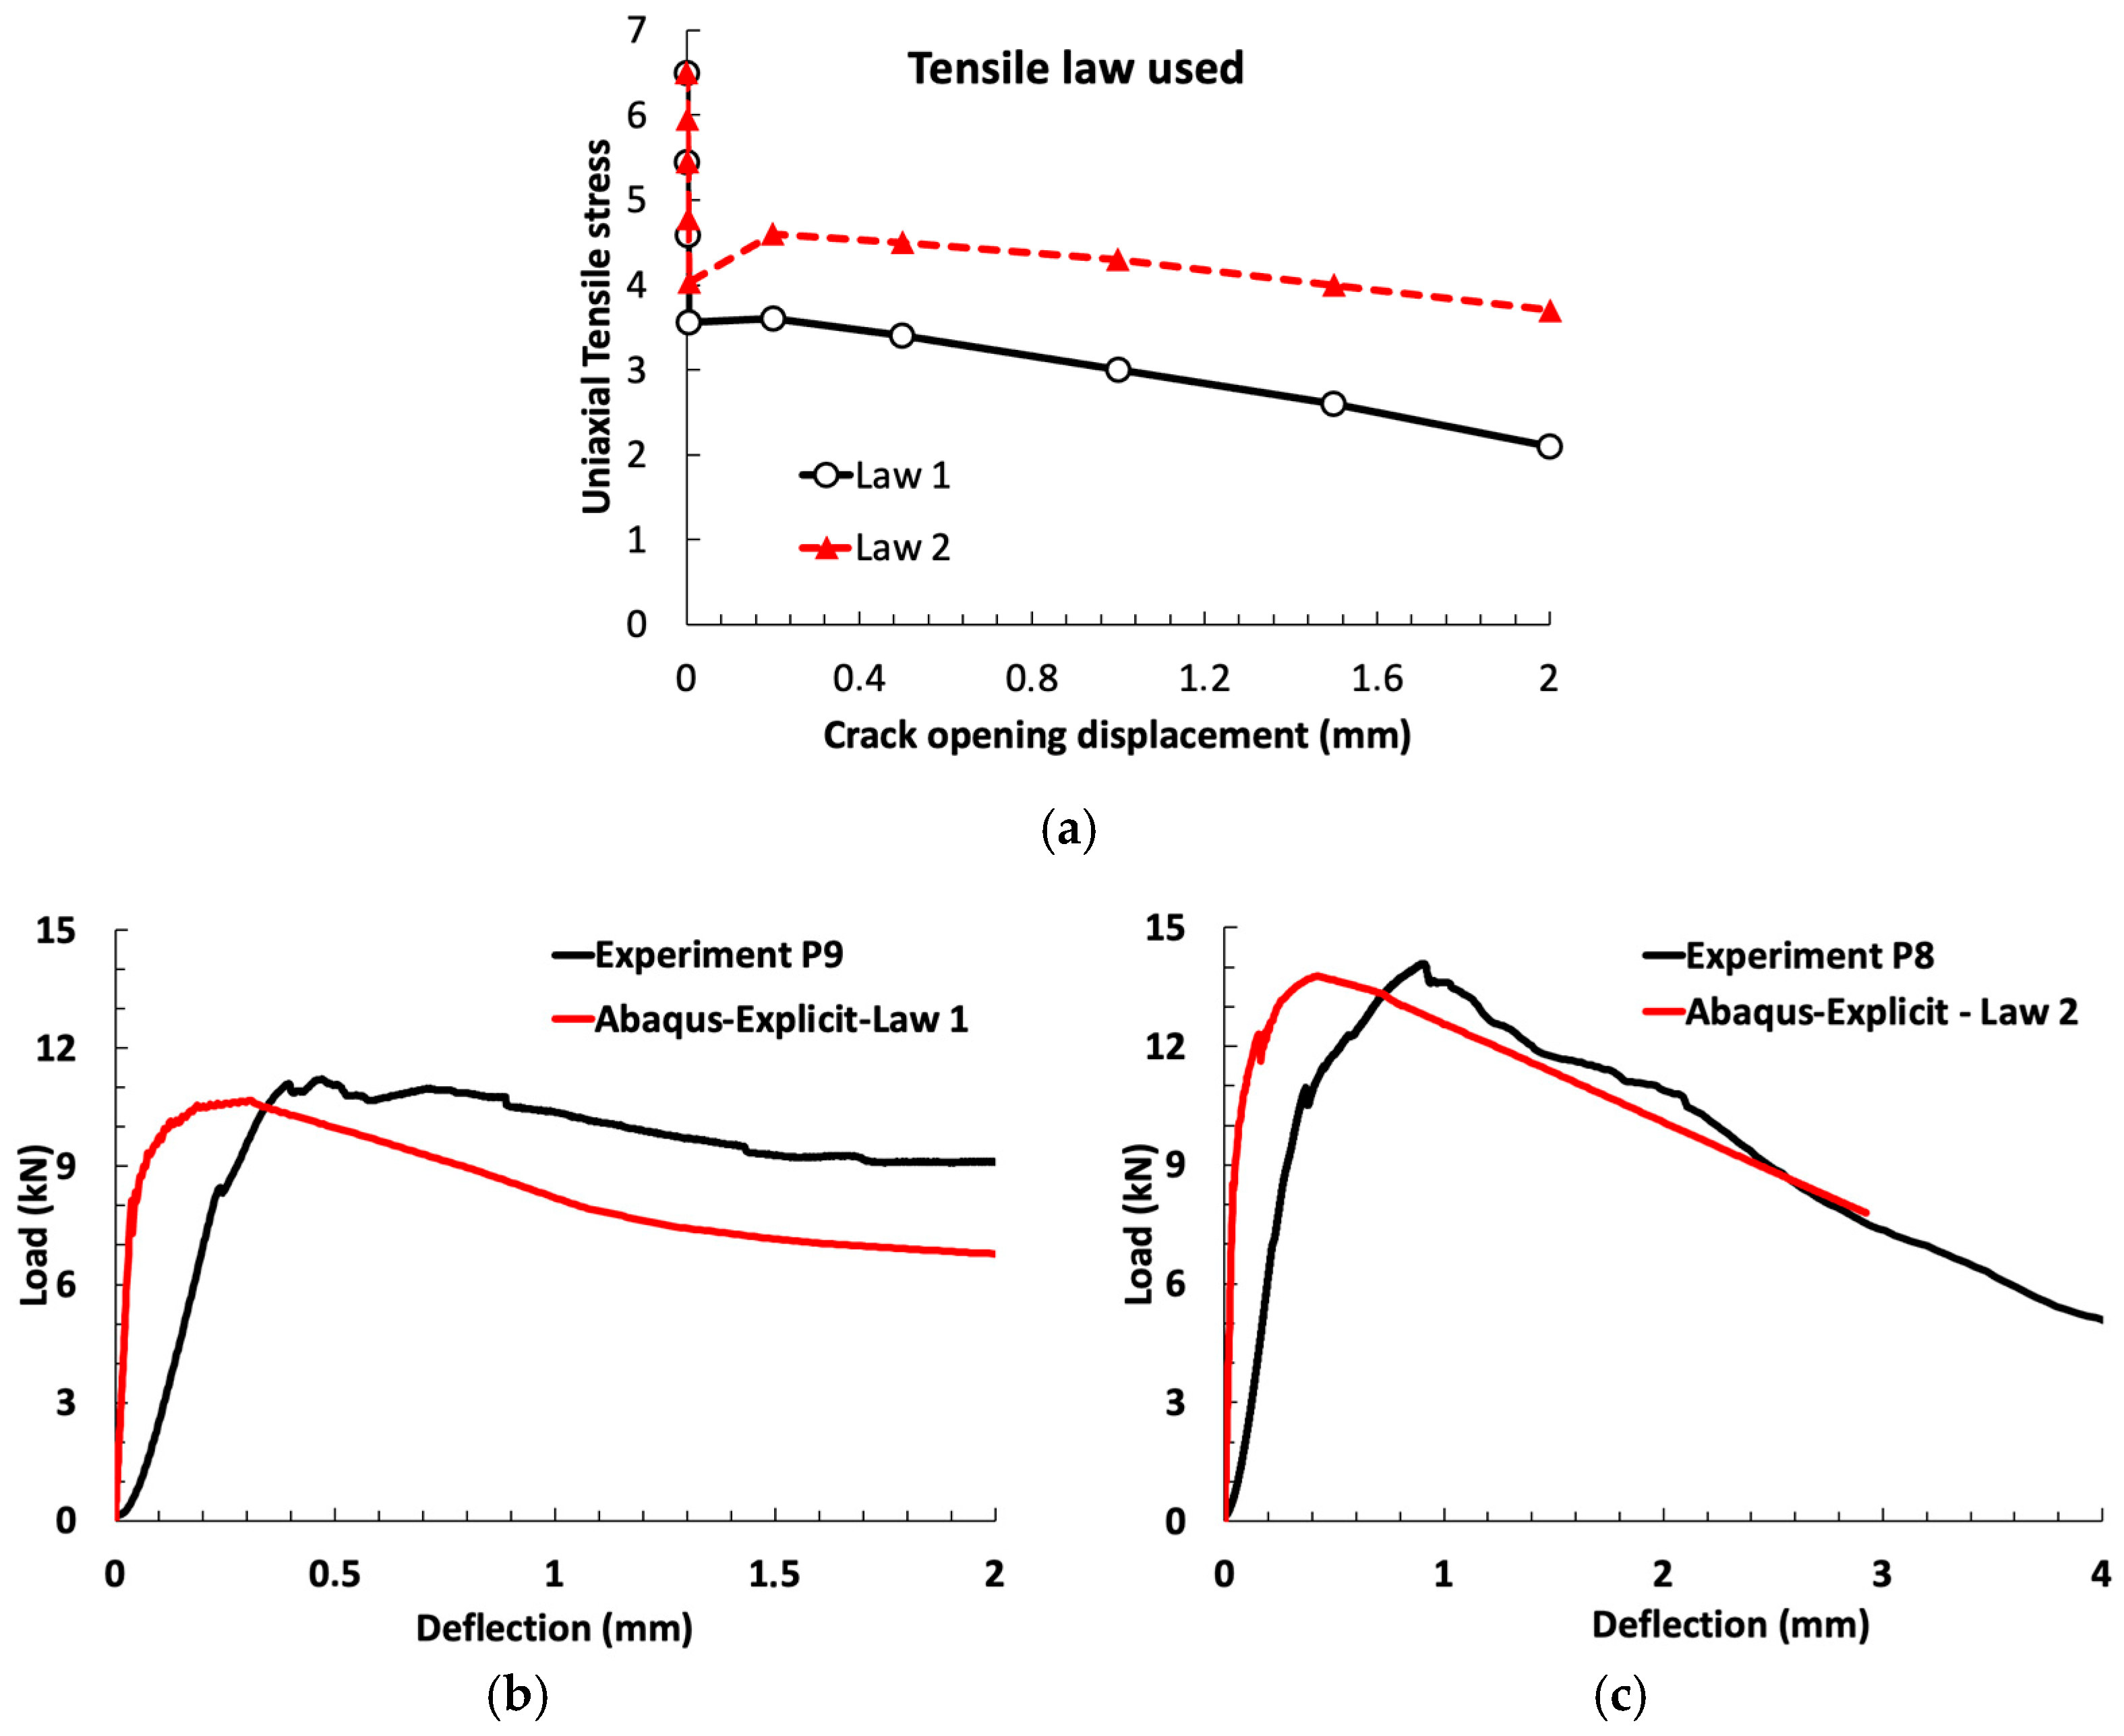
5.2. Three-Point Bending Tests for Prisms of 7 cm × 7 cm × 28 cm
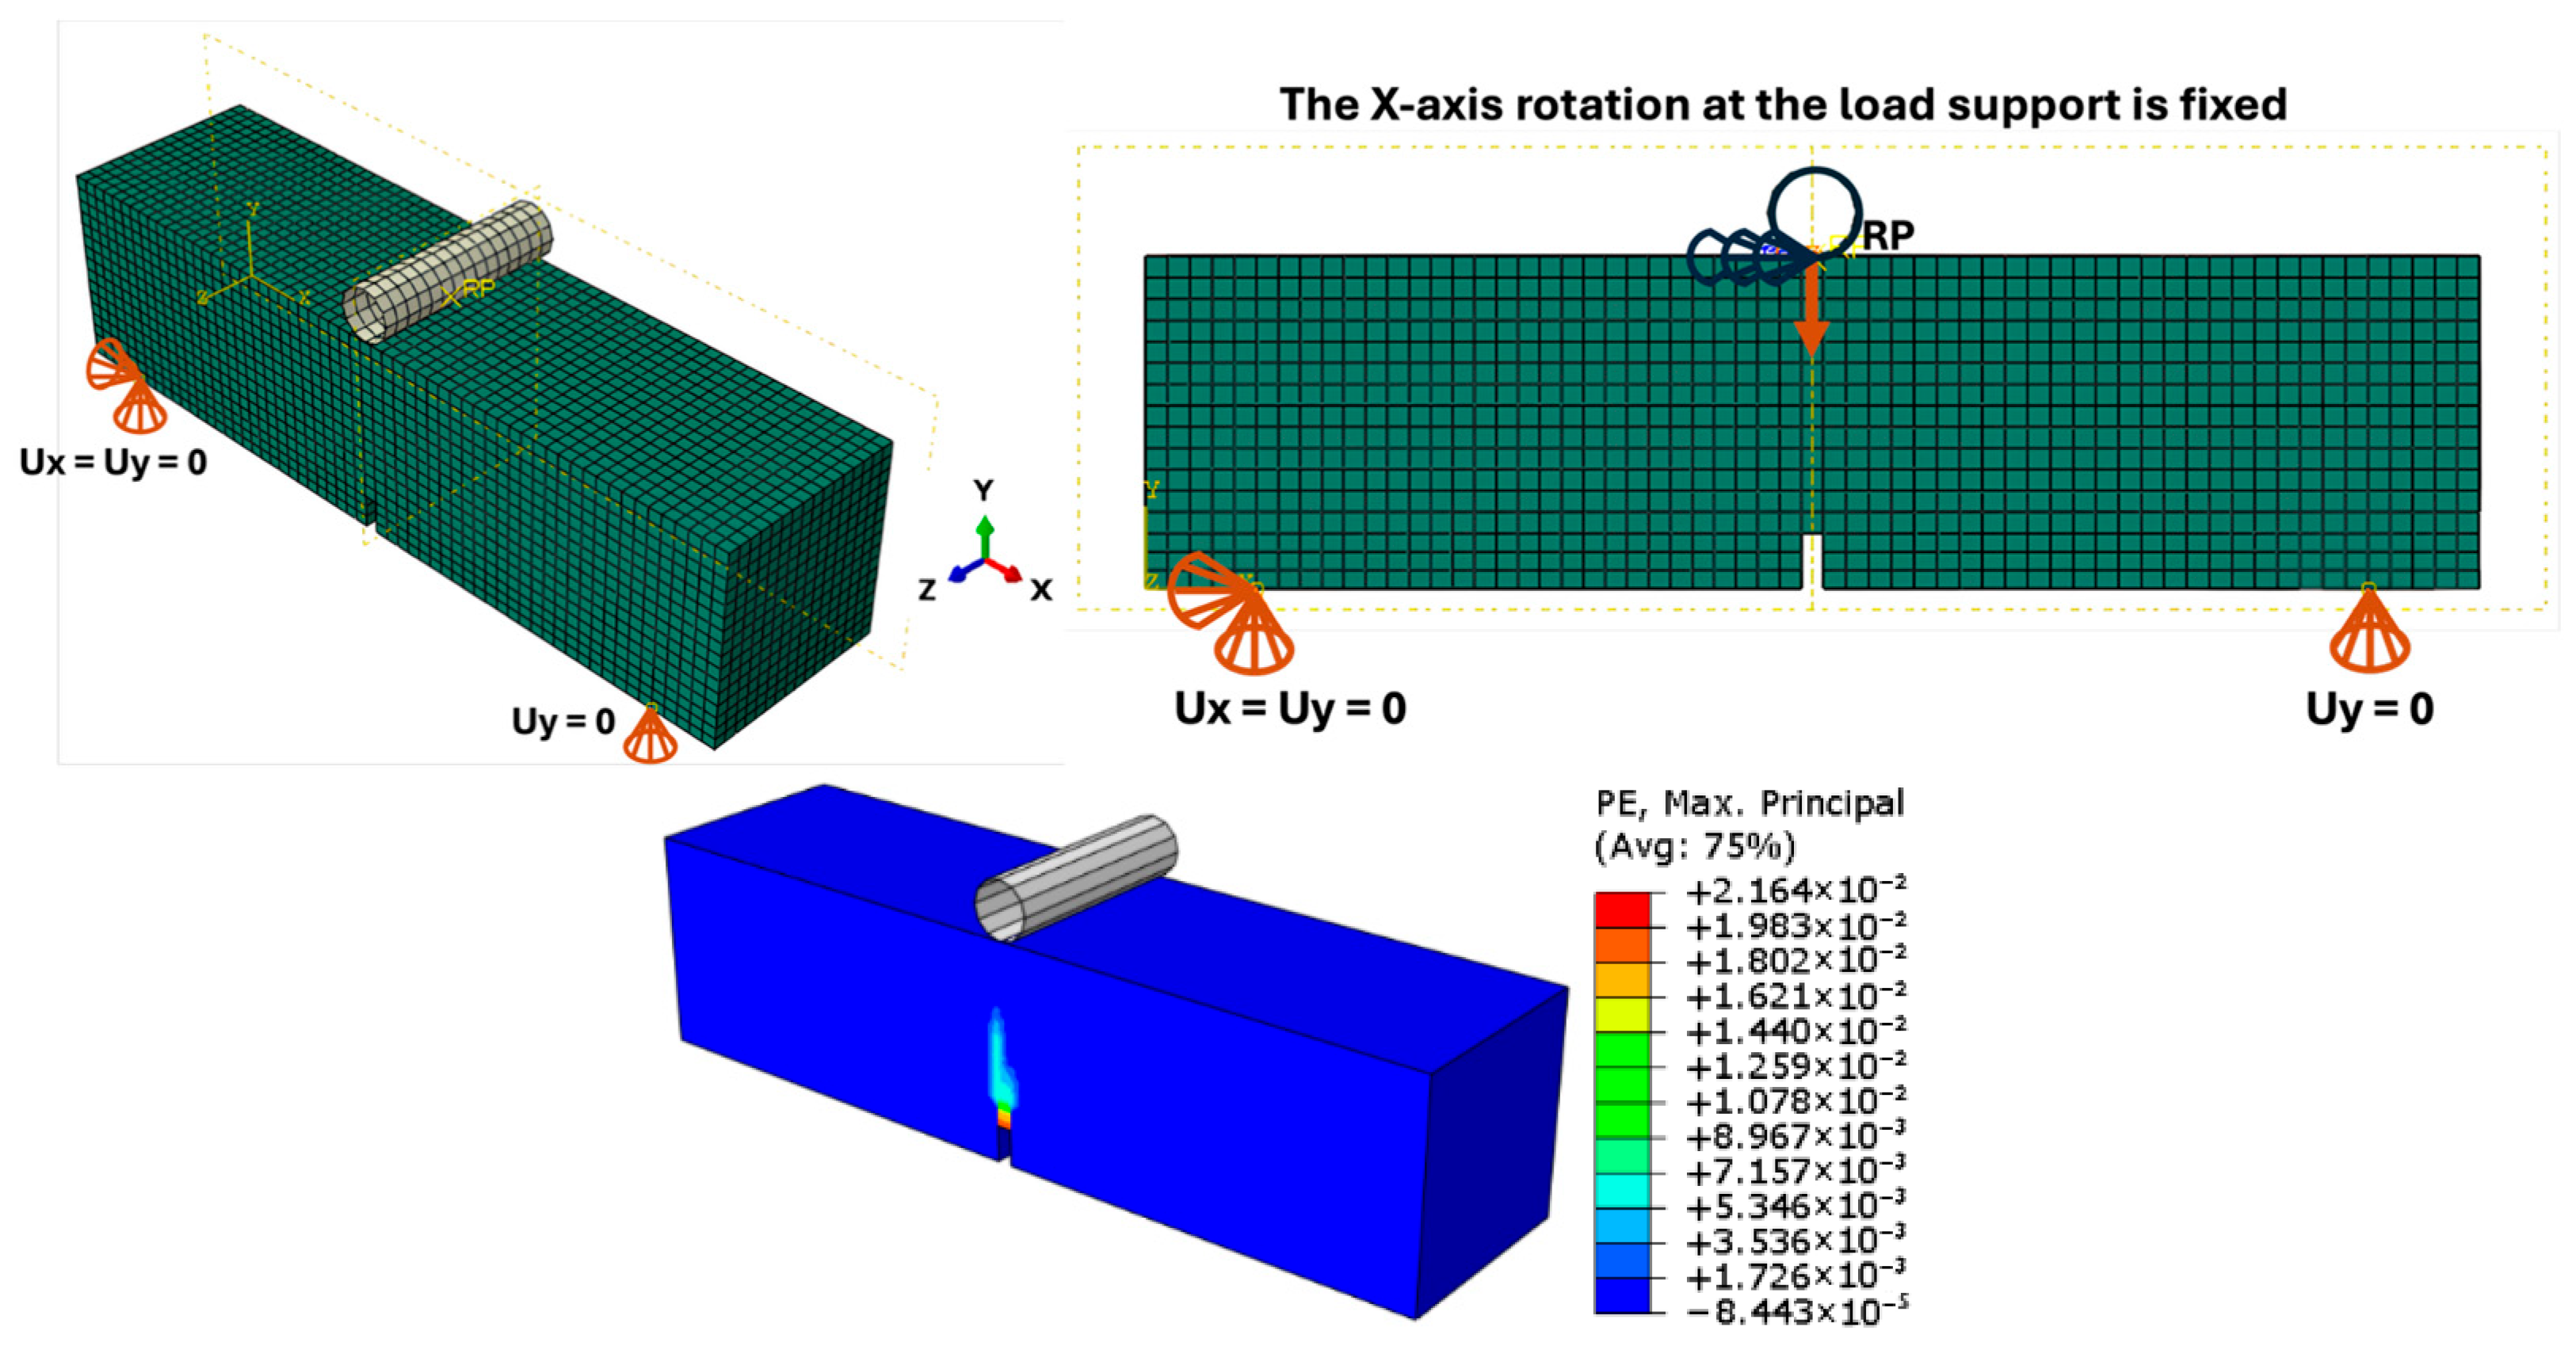
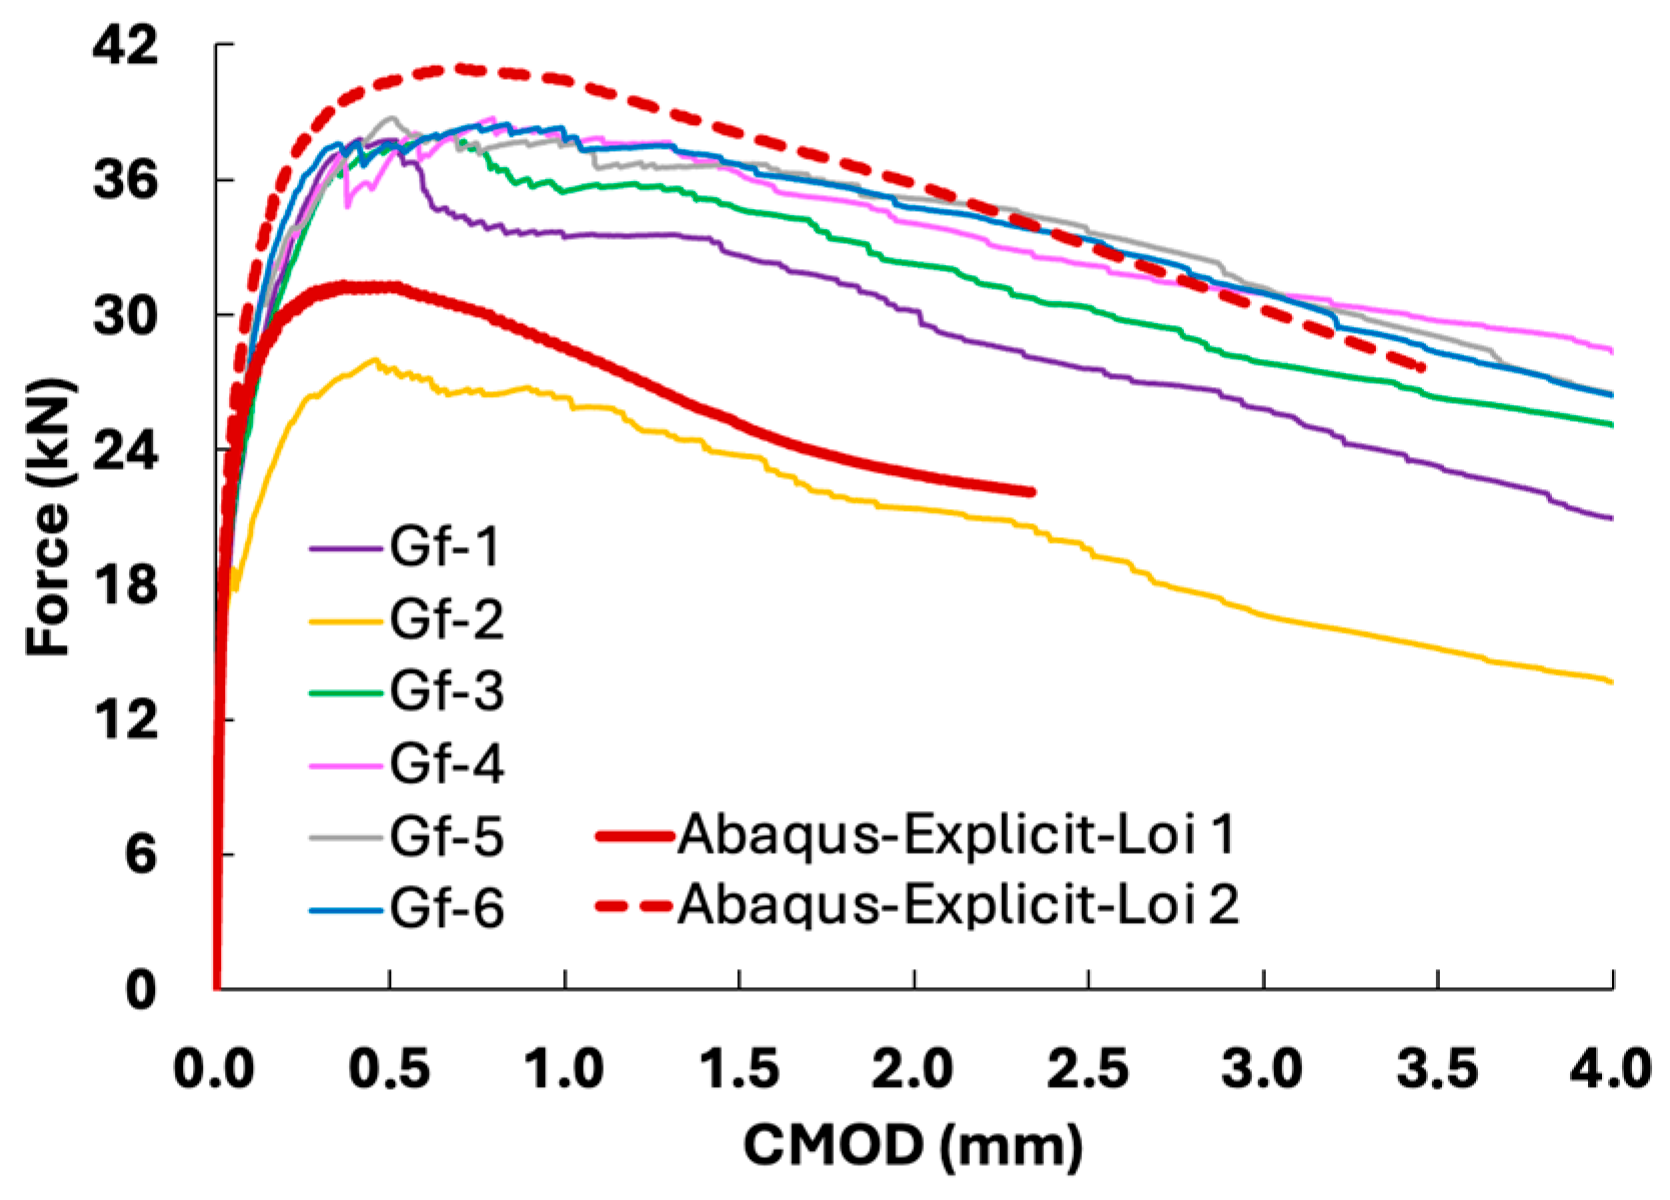
5.3. Three-Point Bending of Prisms 15 cm × 15 cm × 60 cm
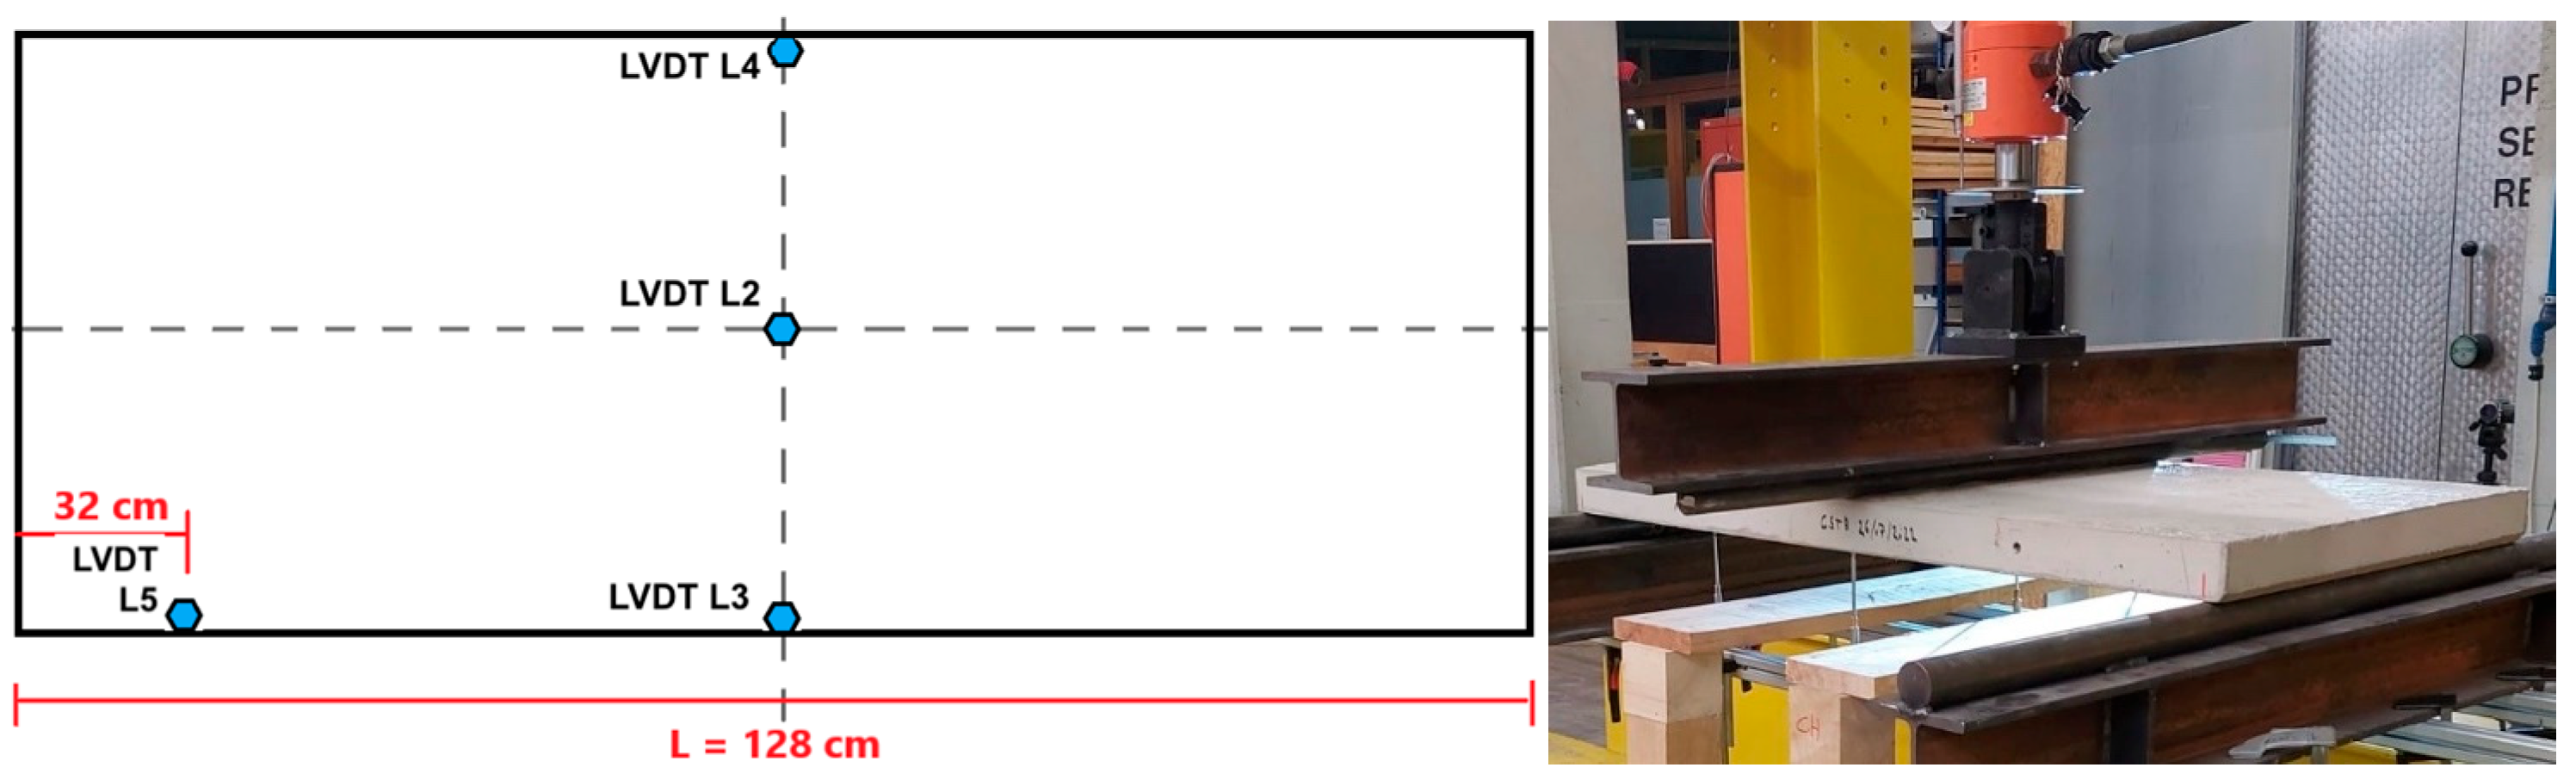
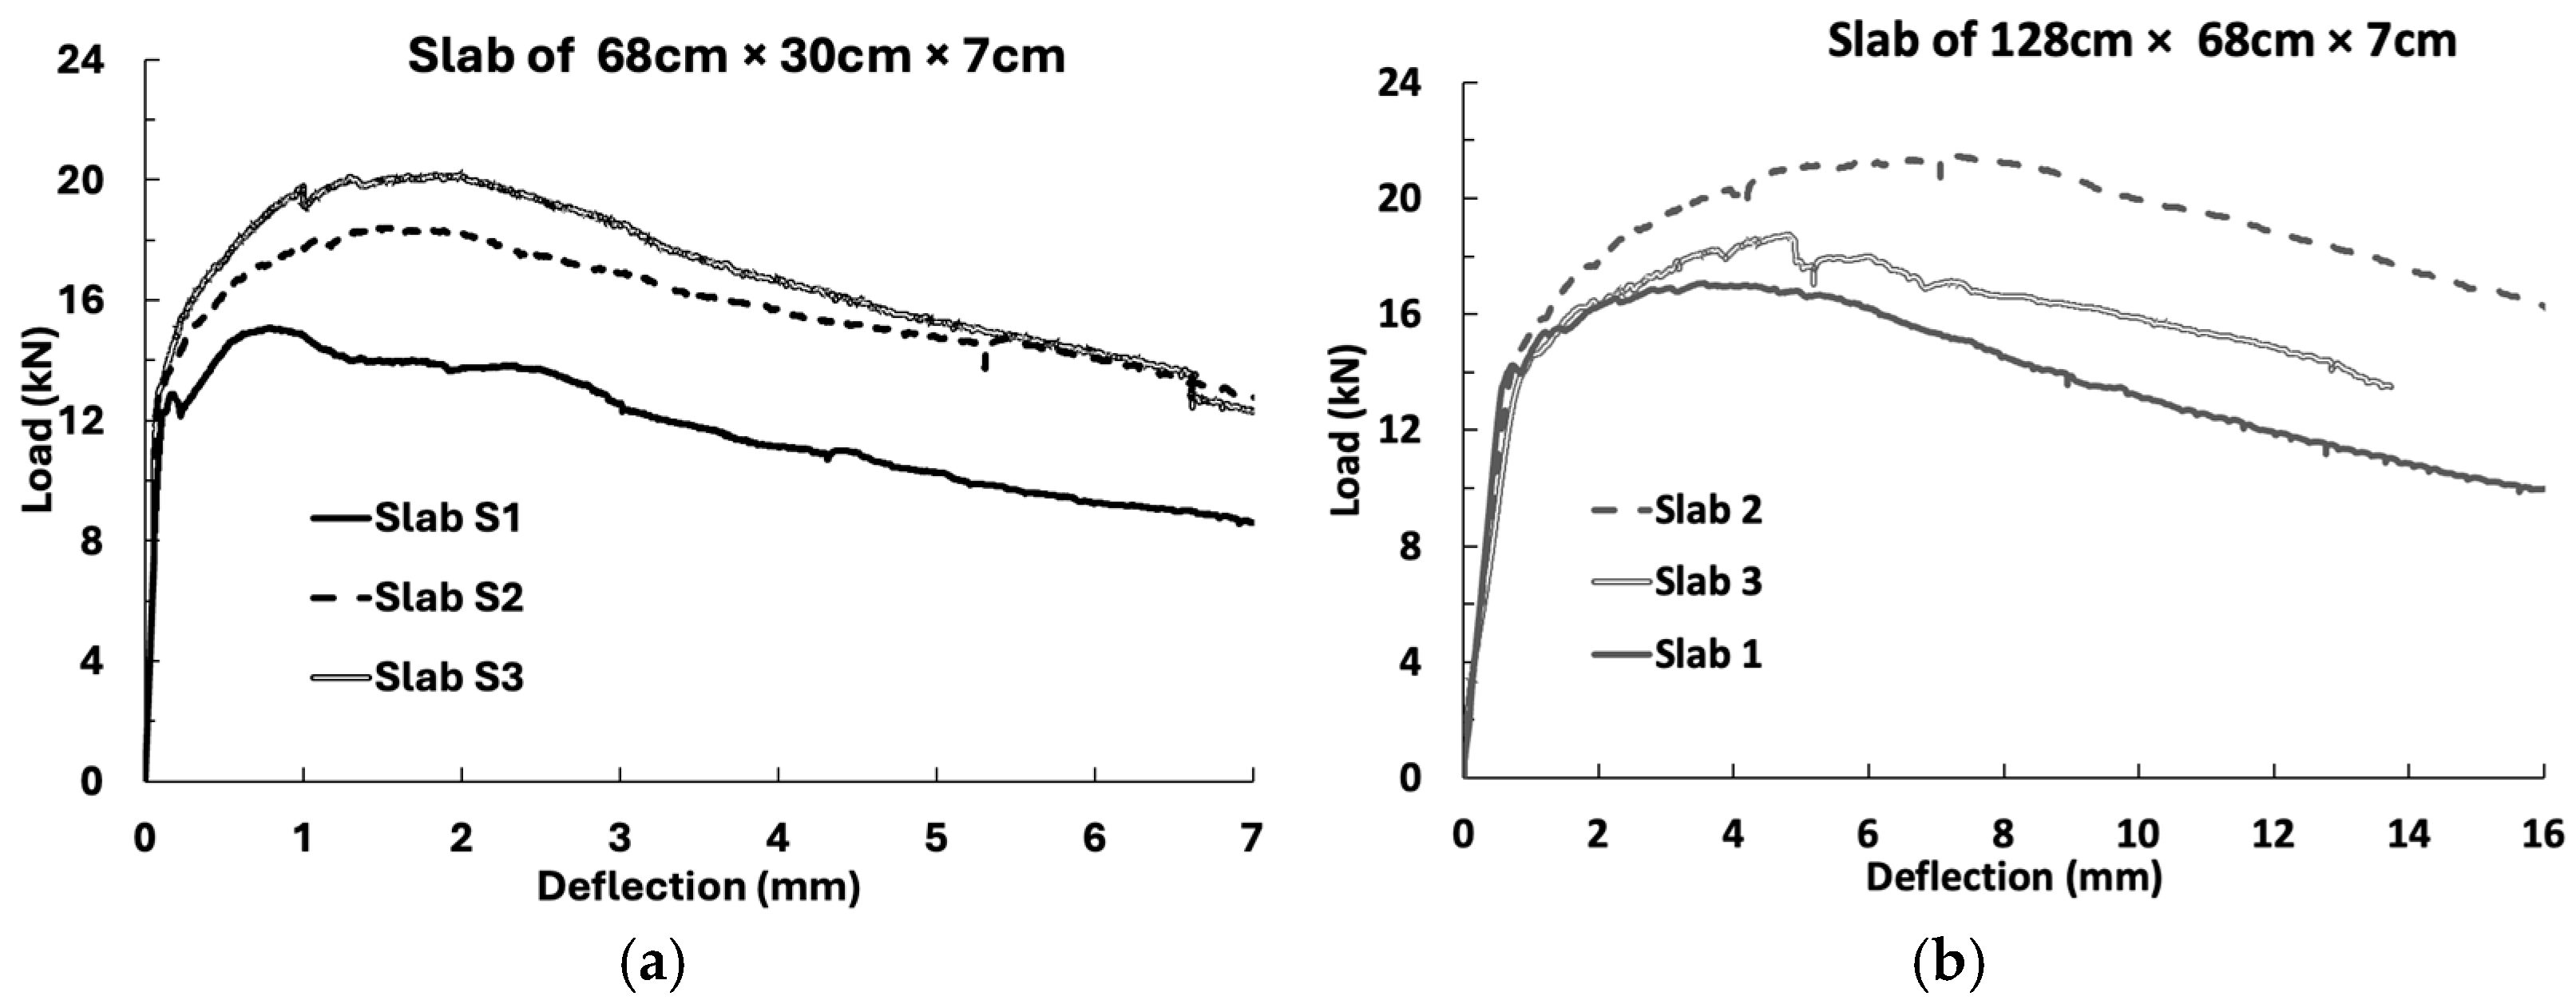
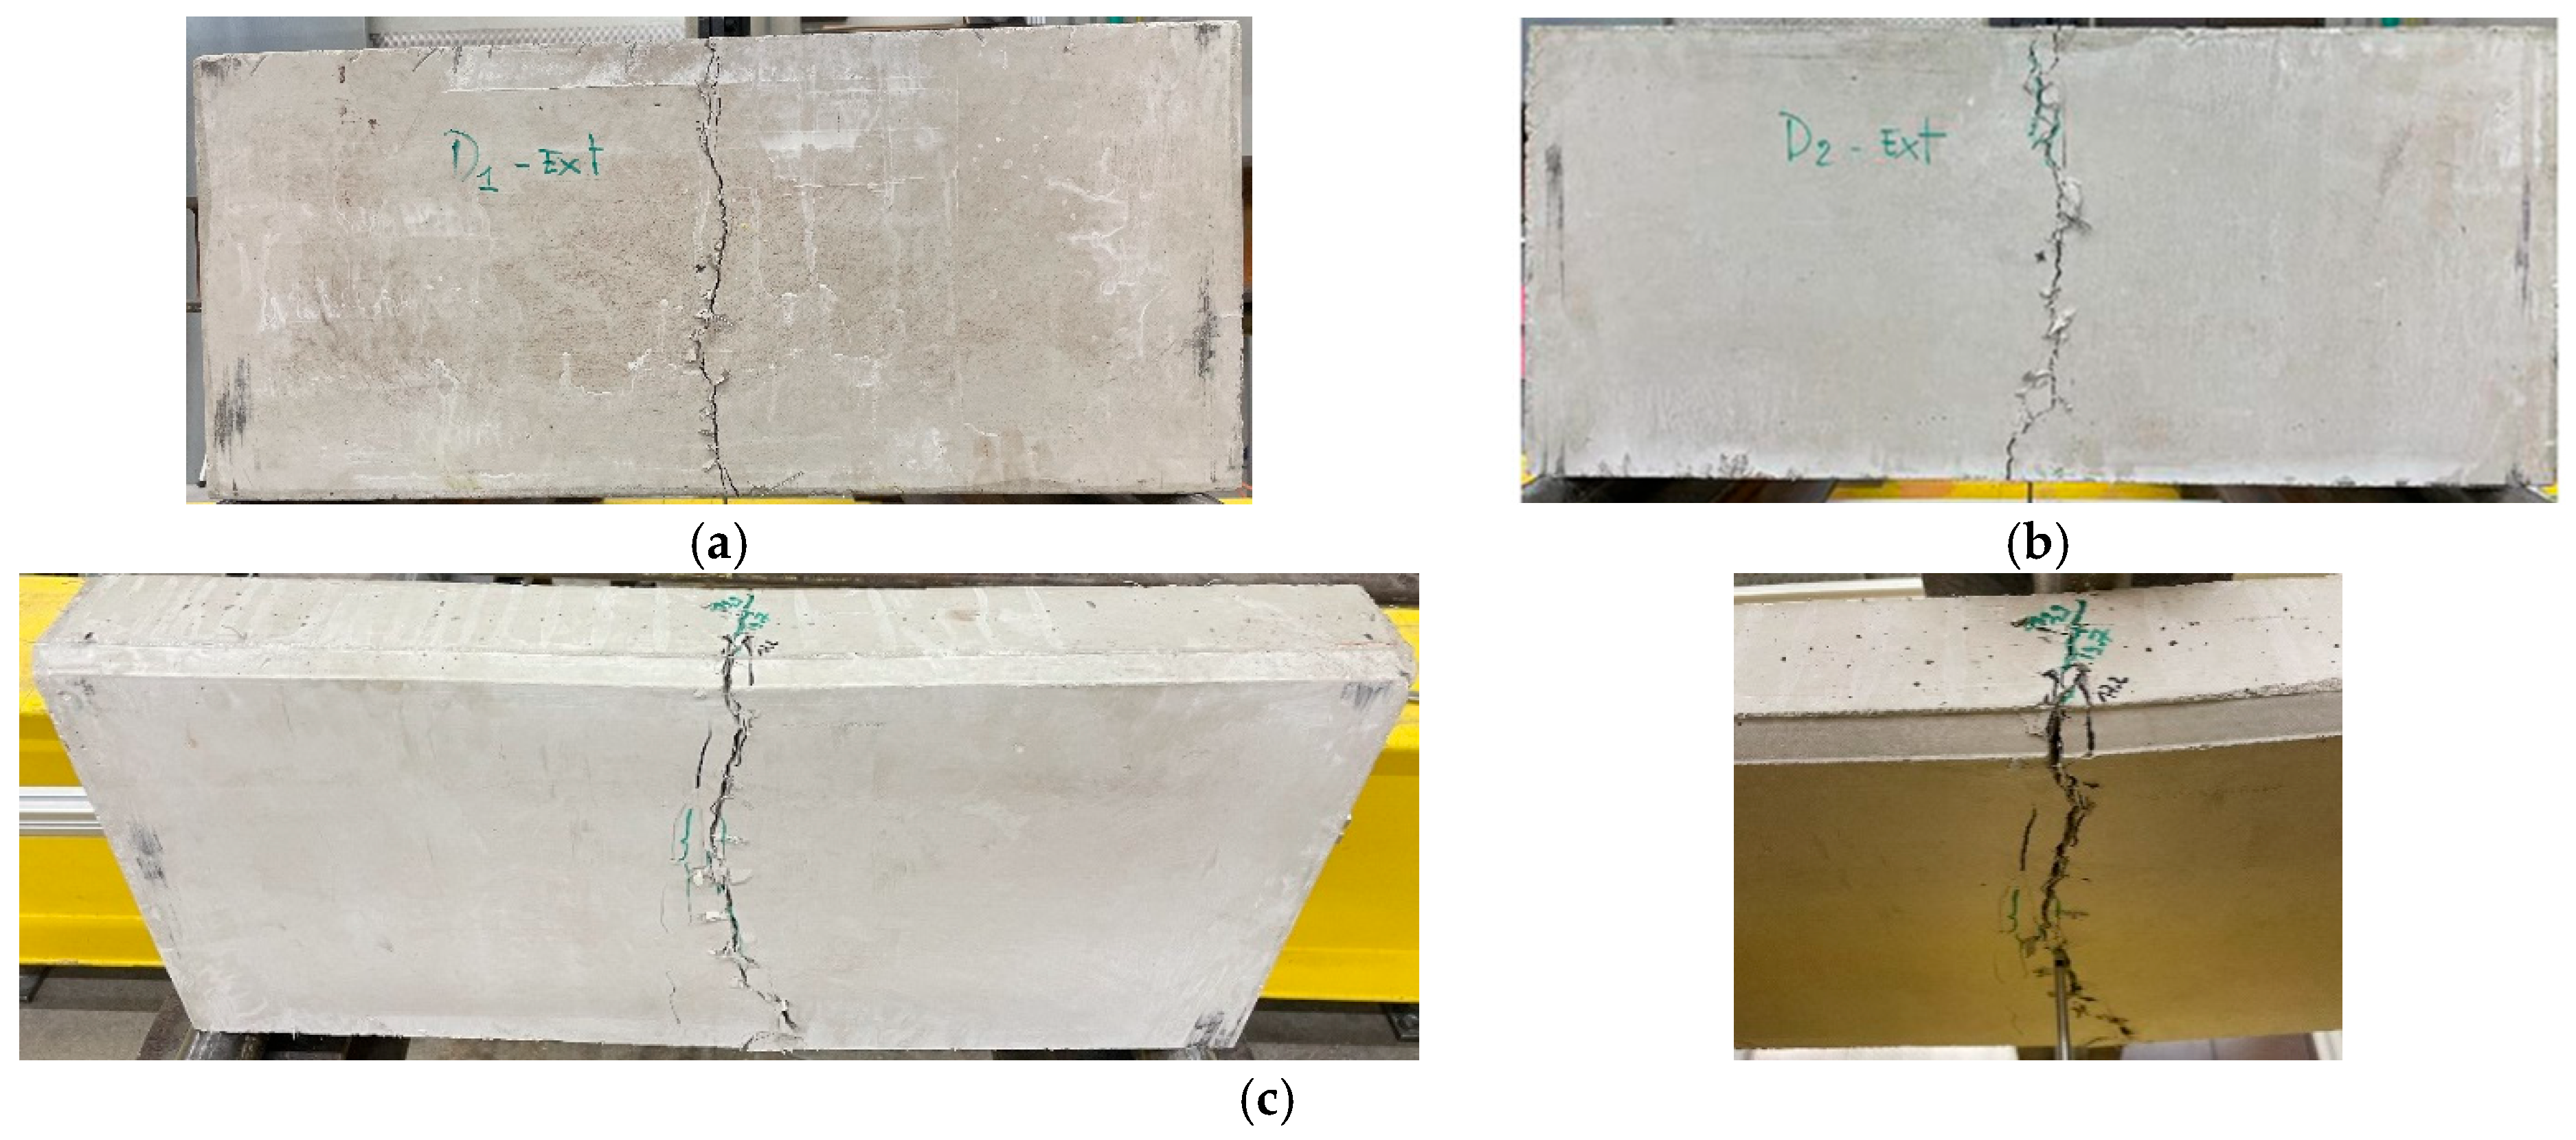
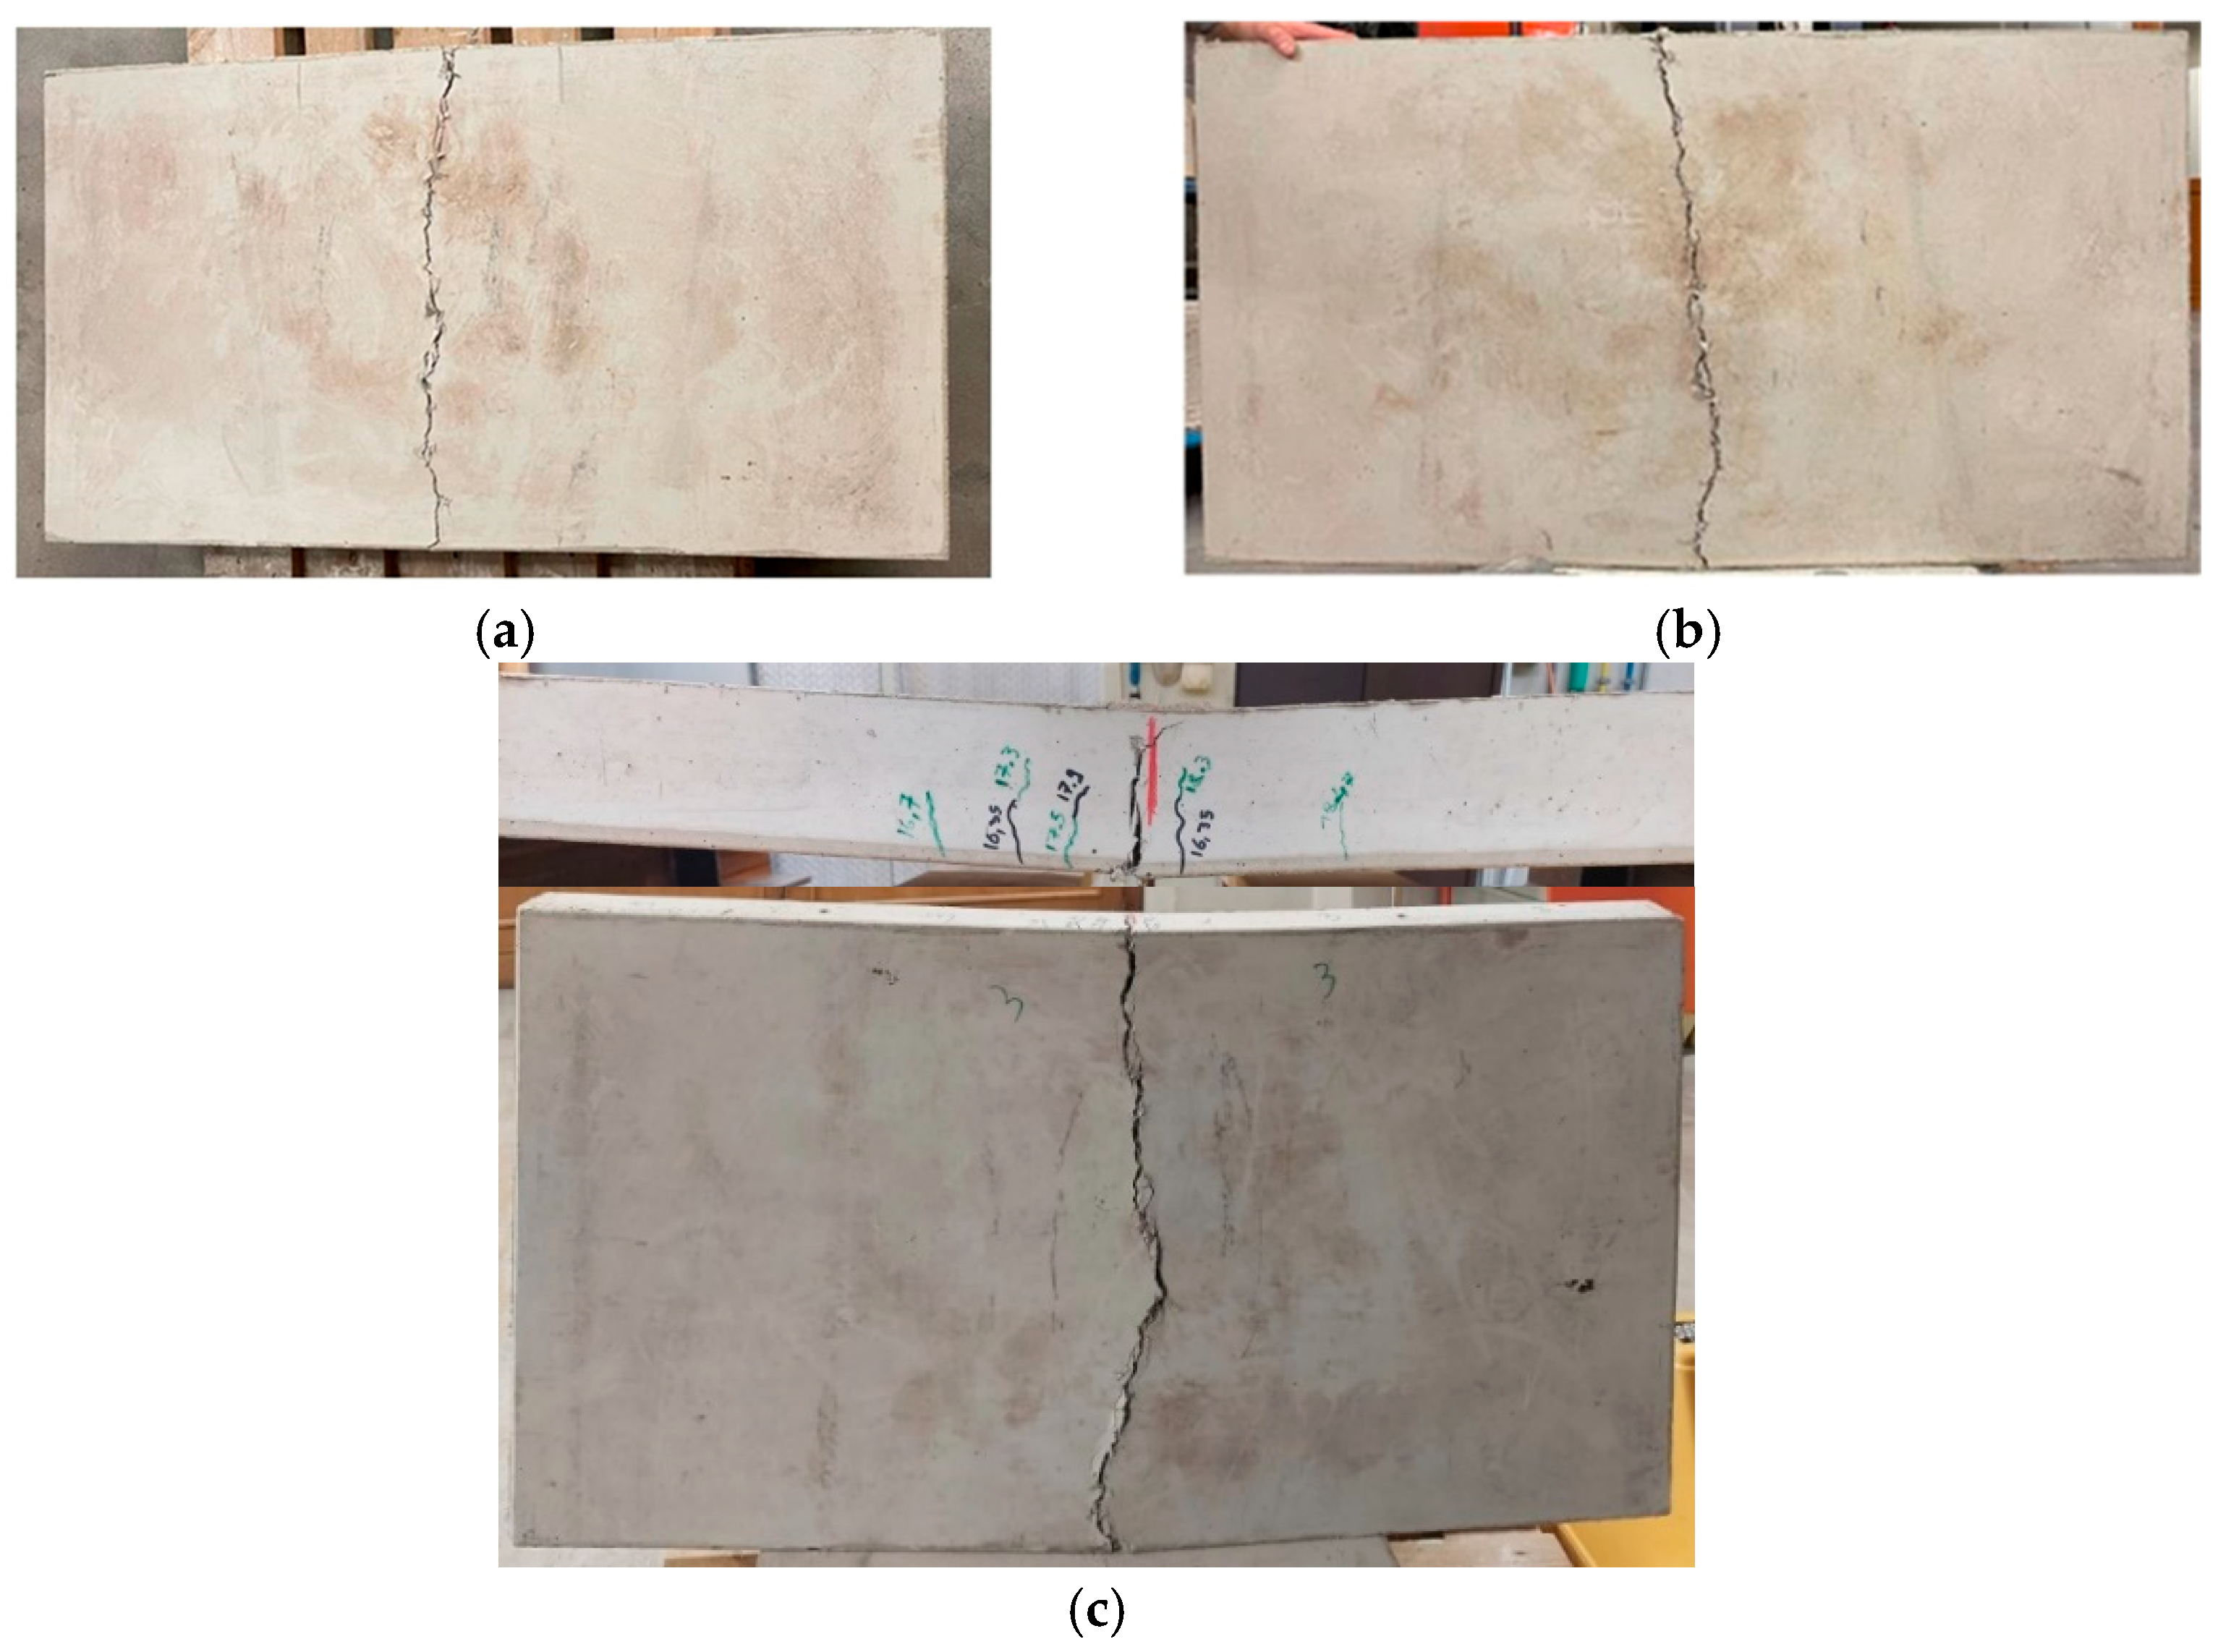
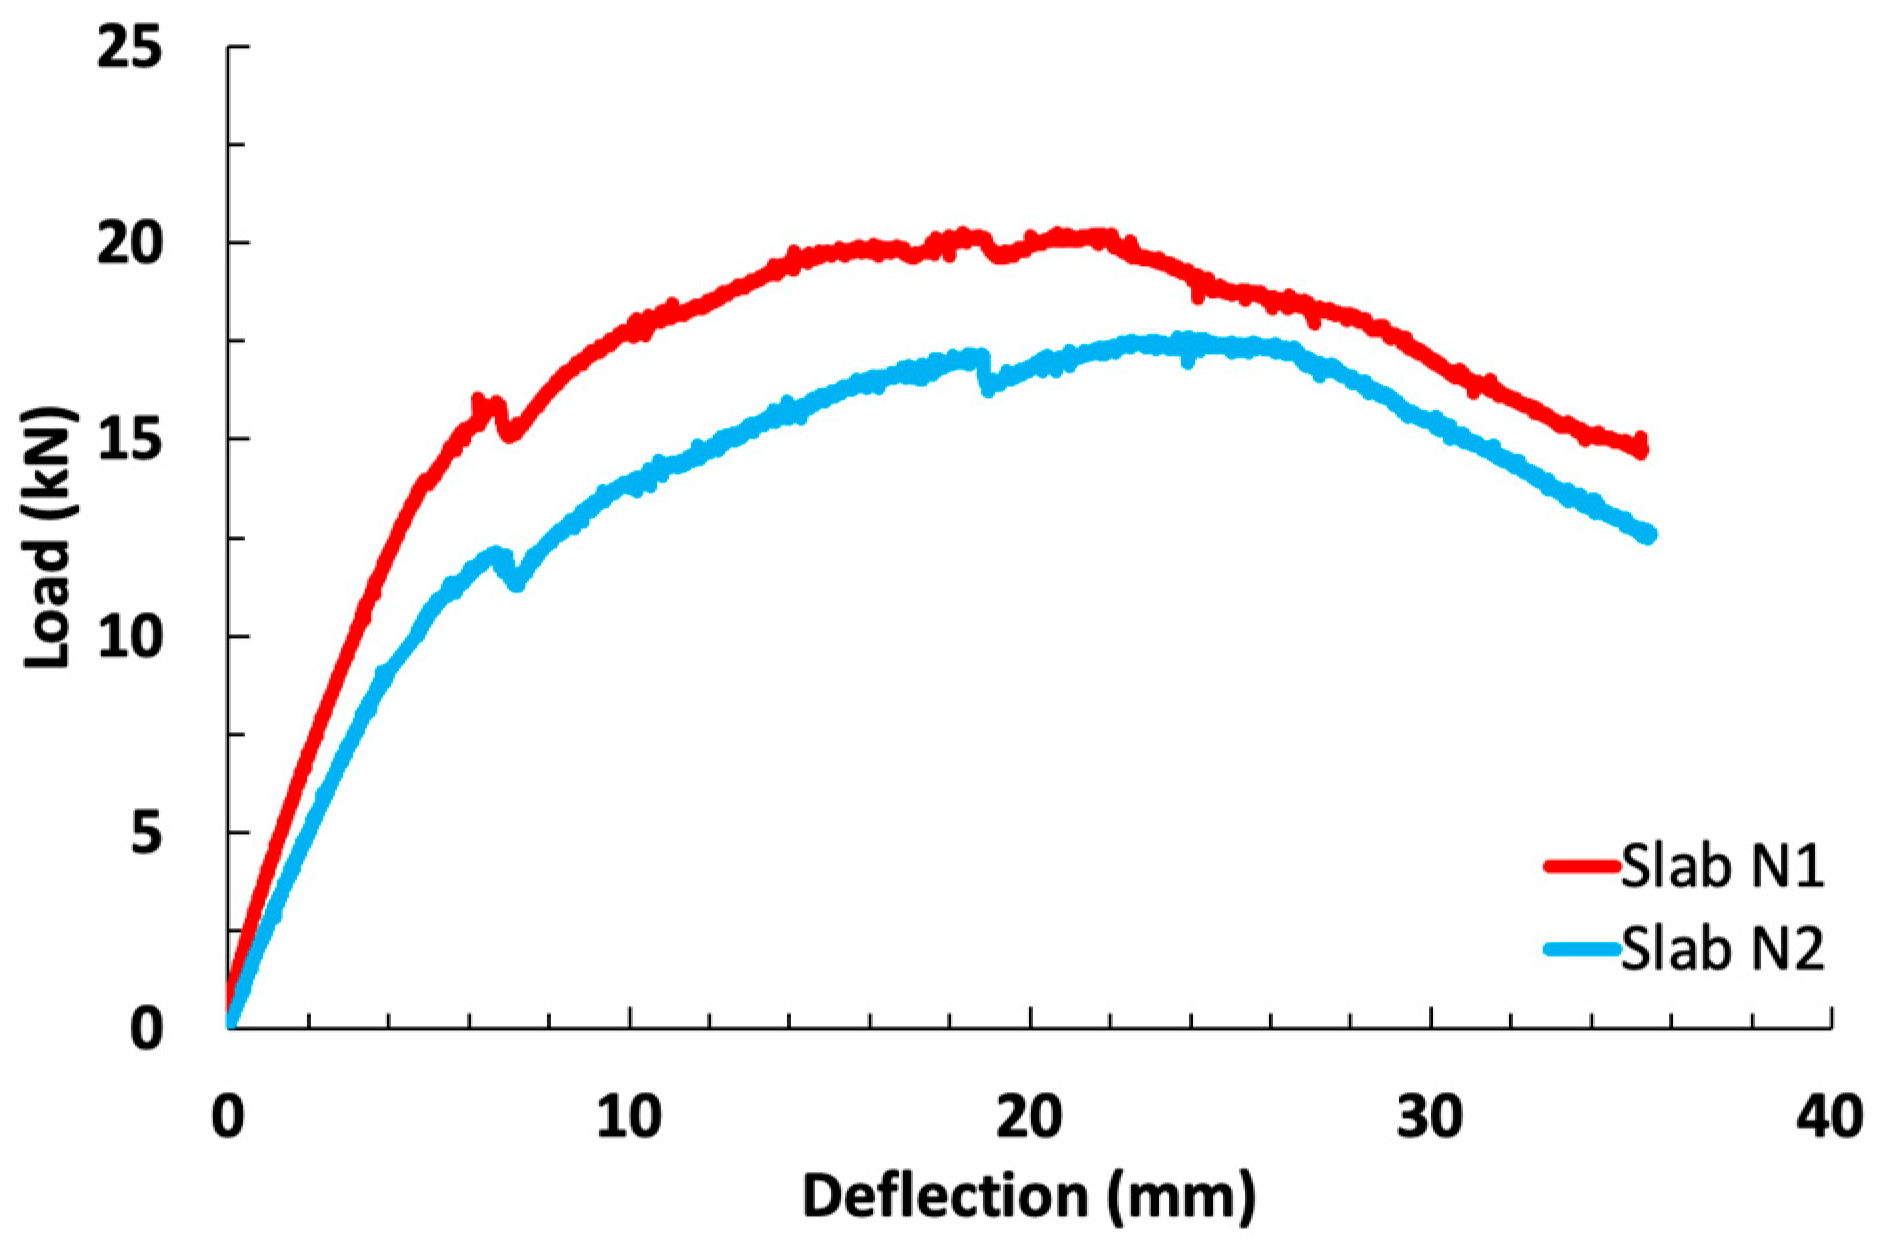
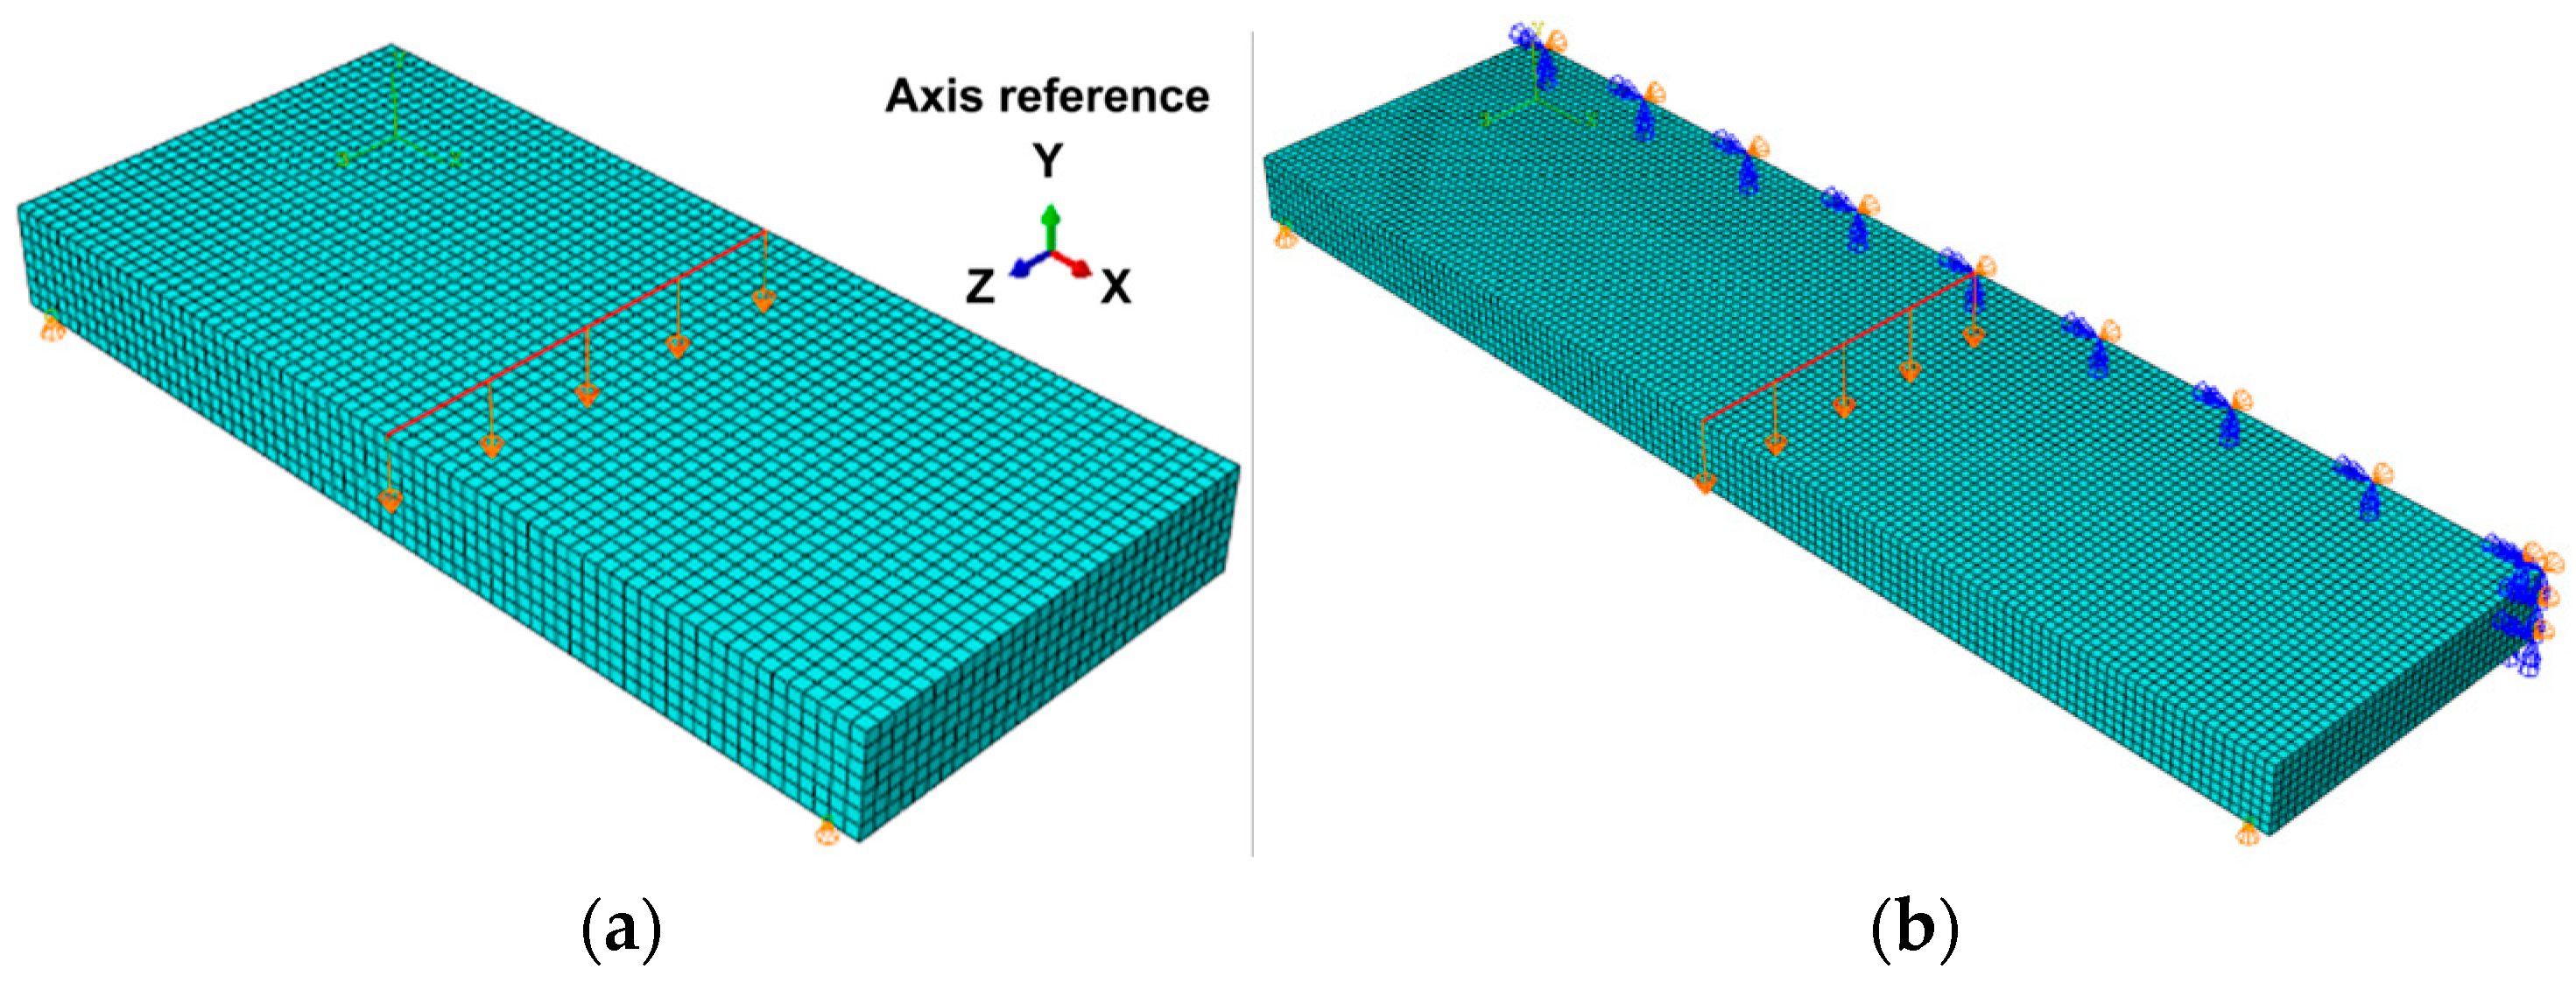
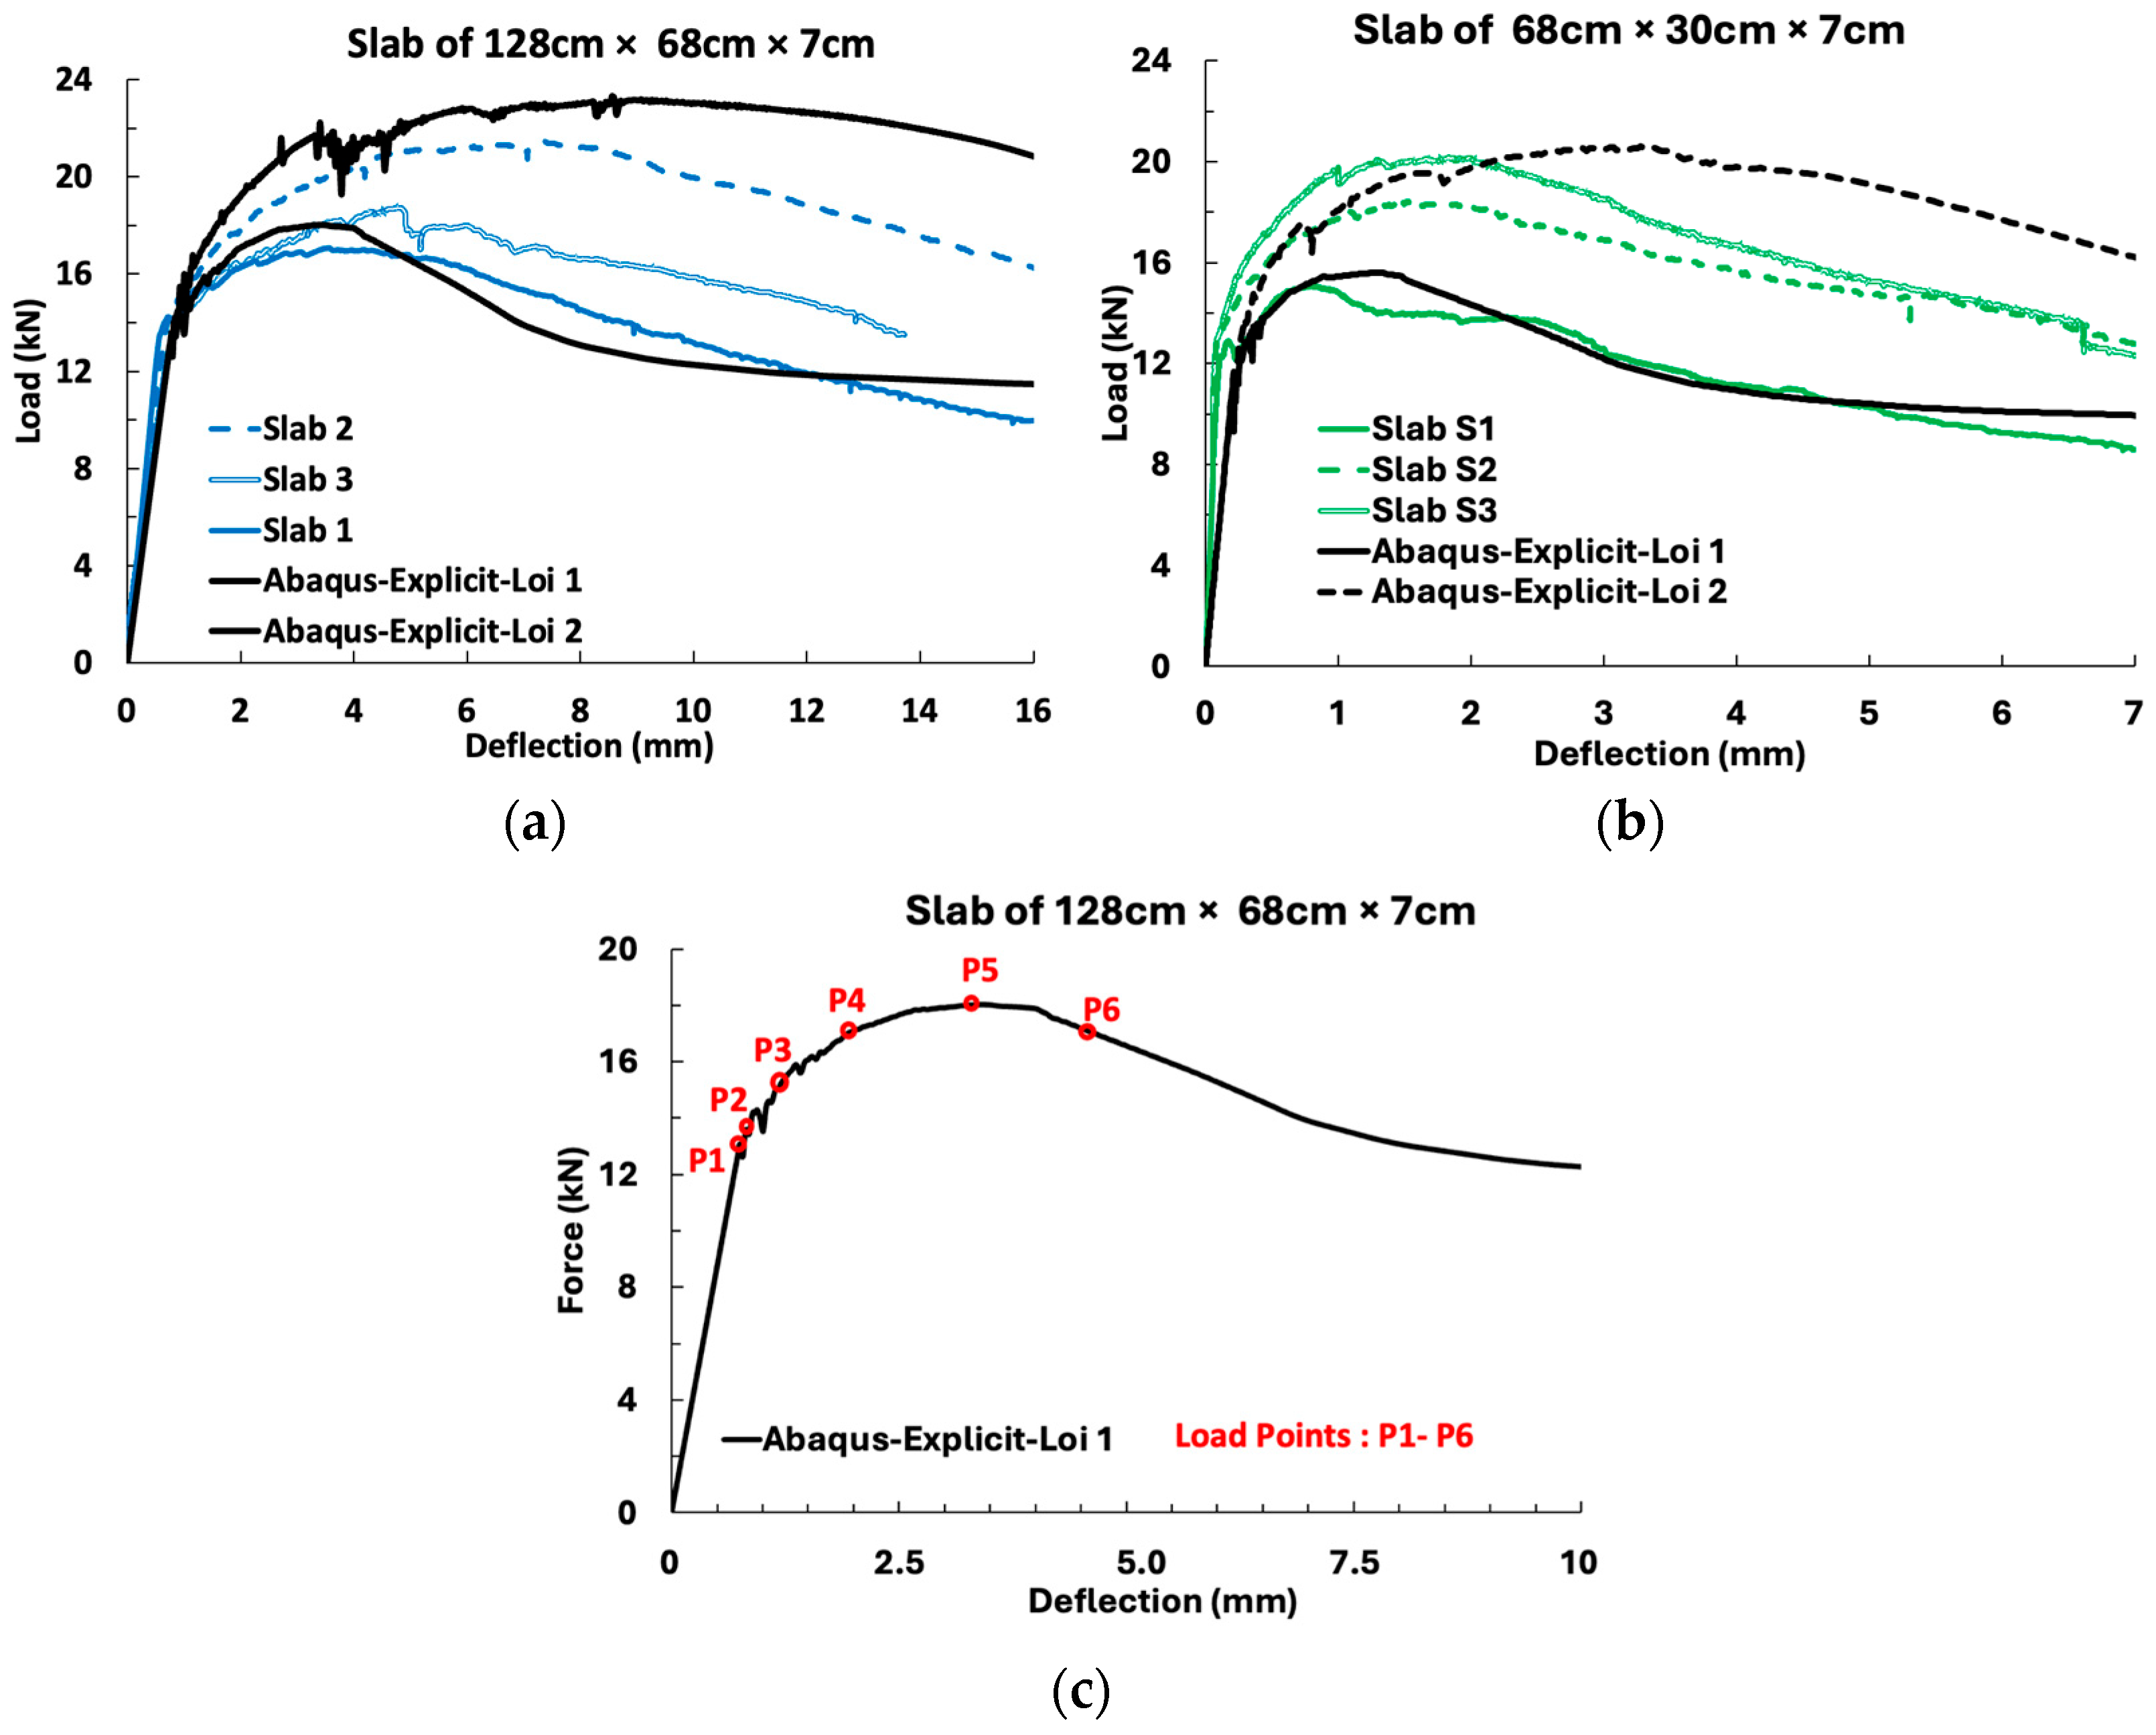
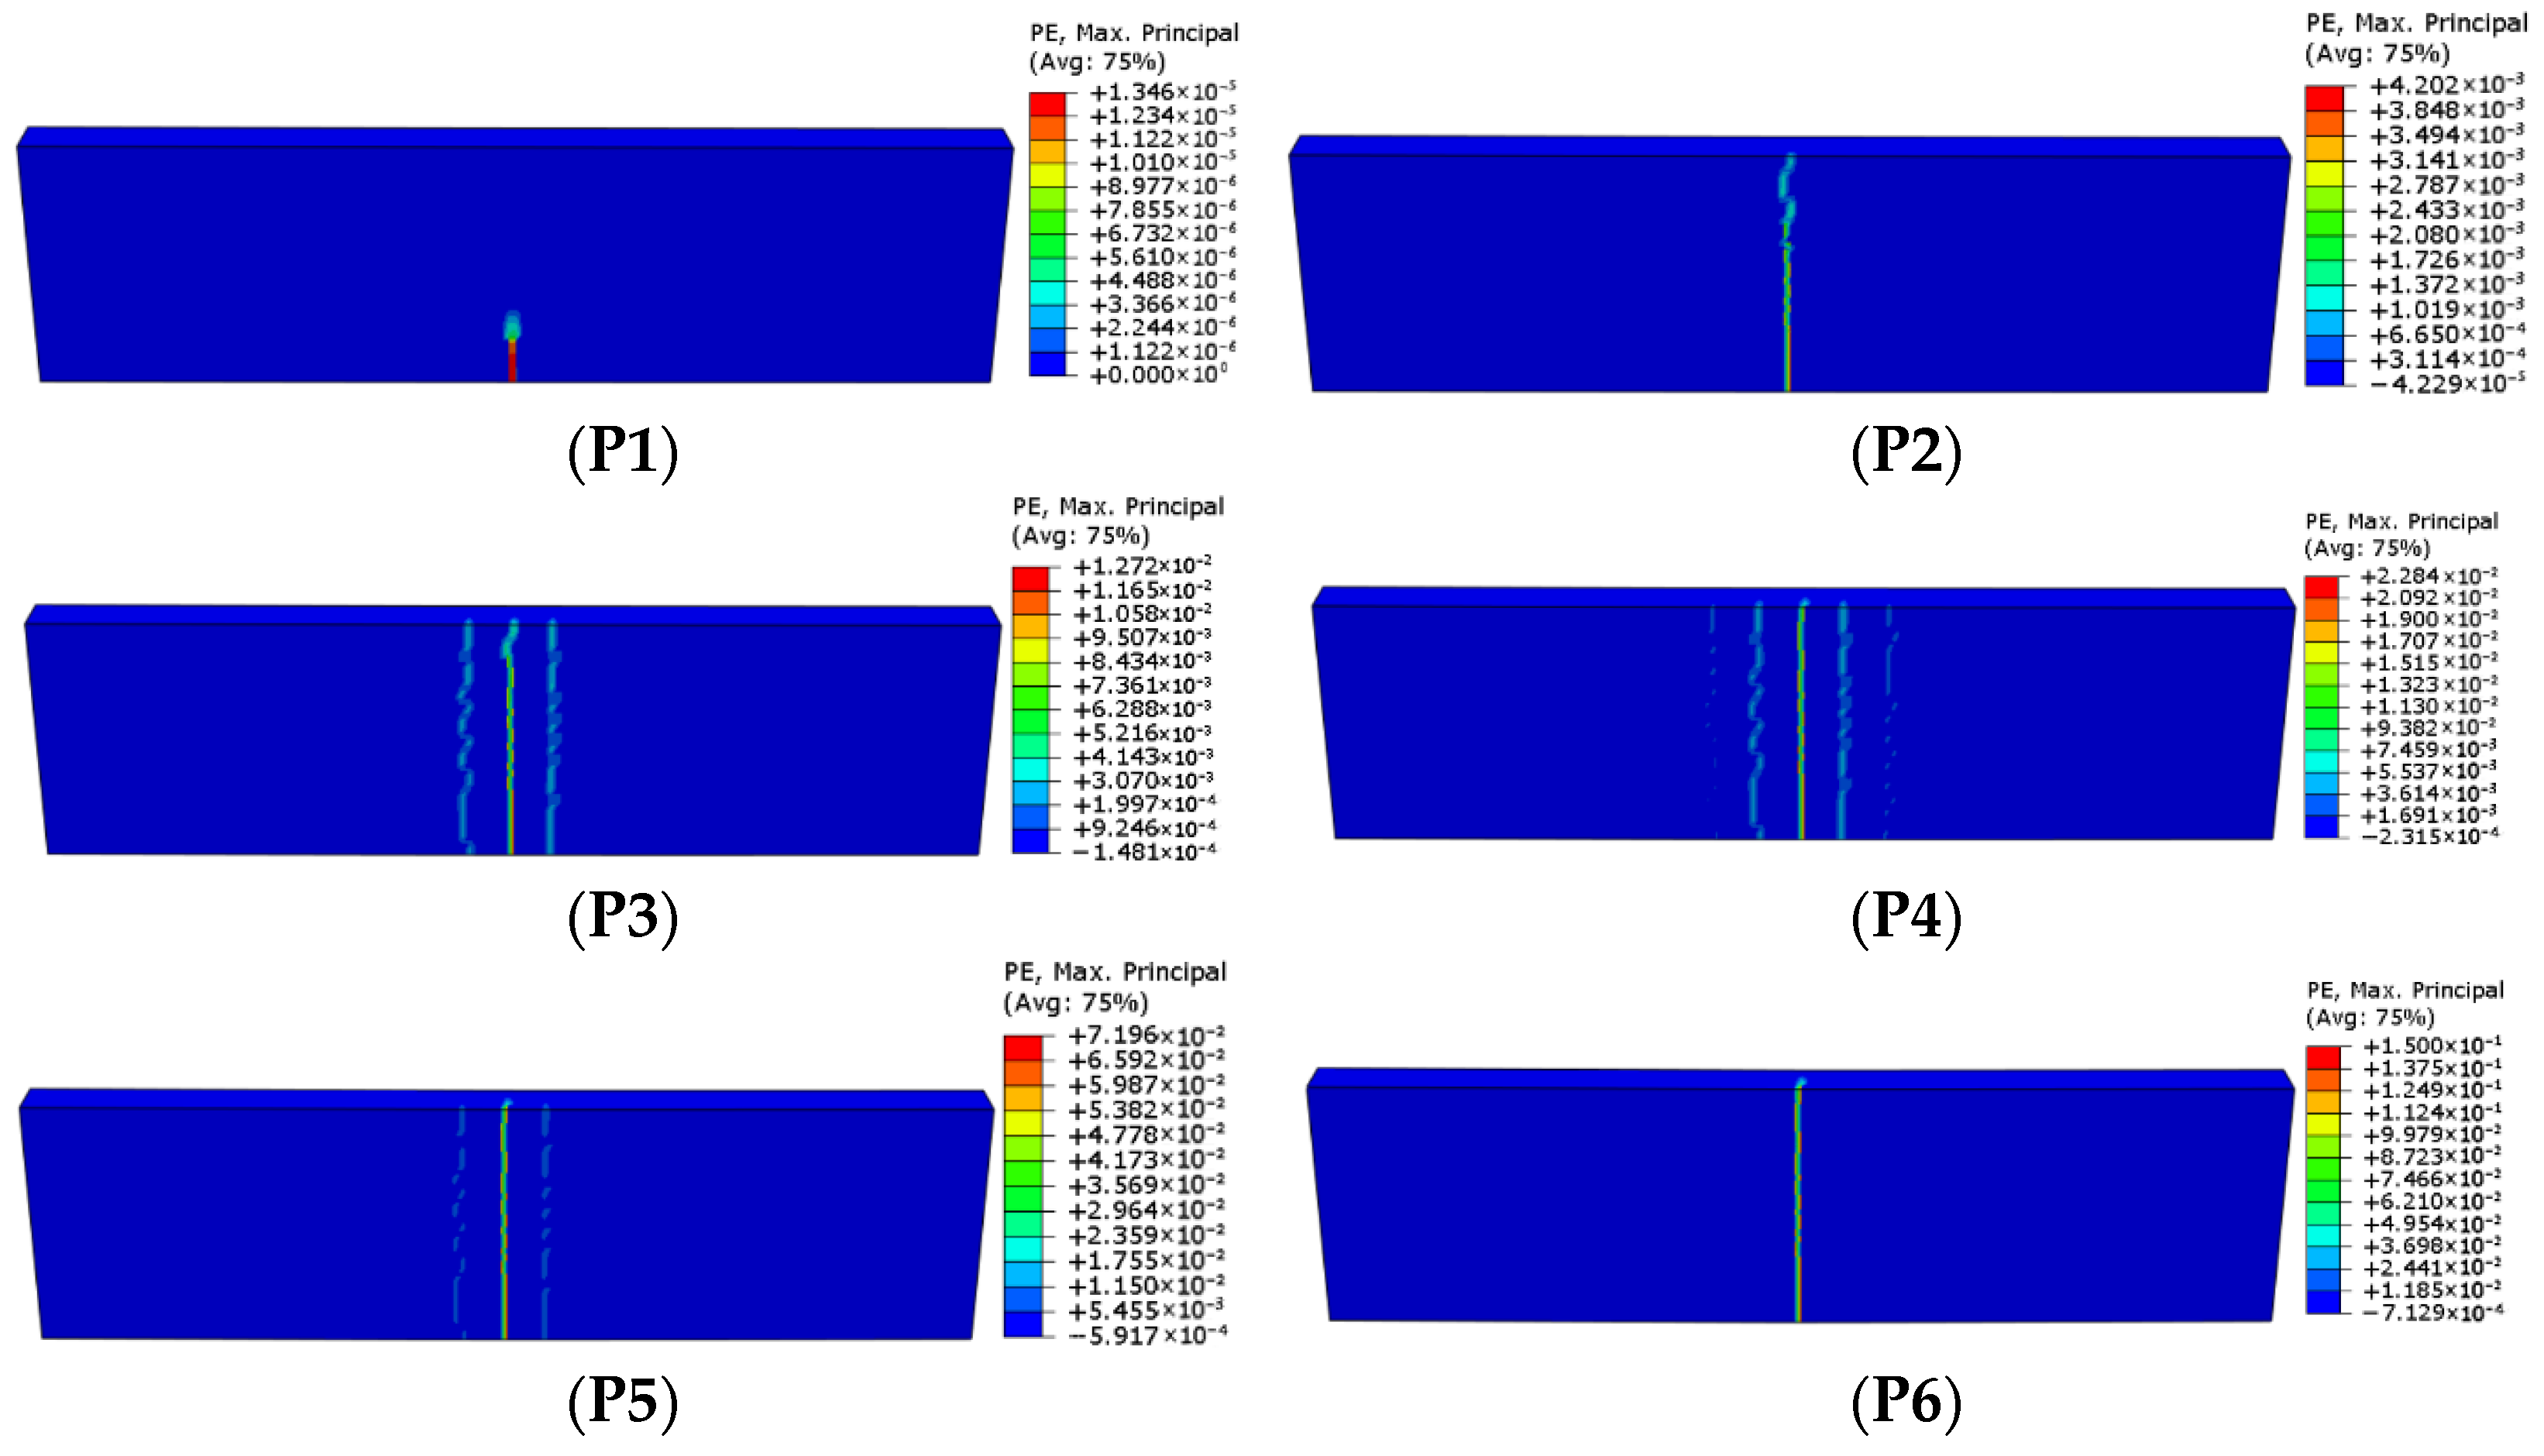
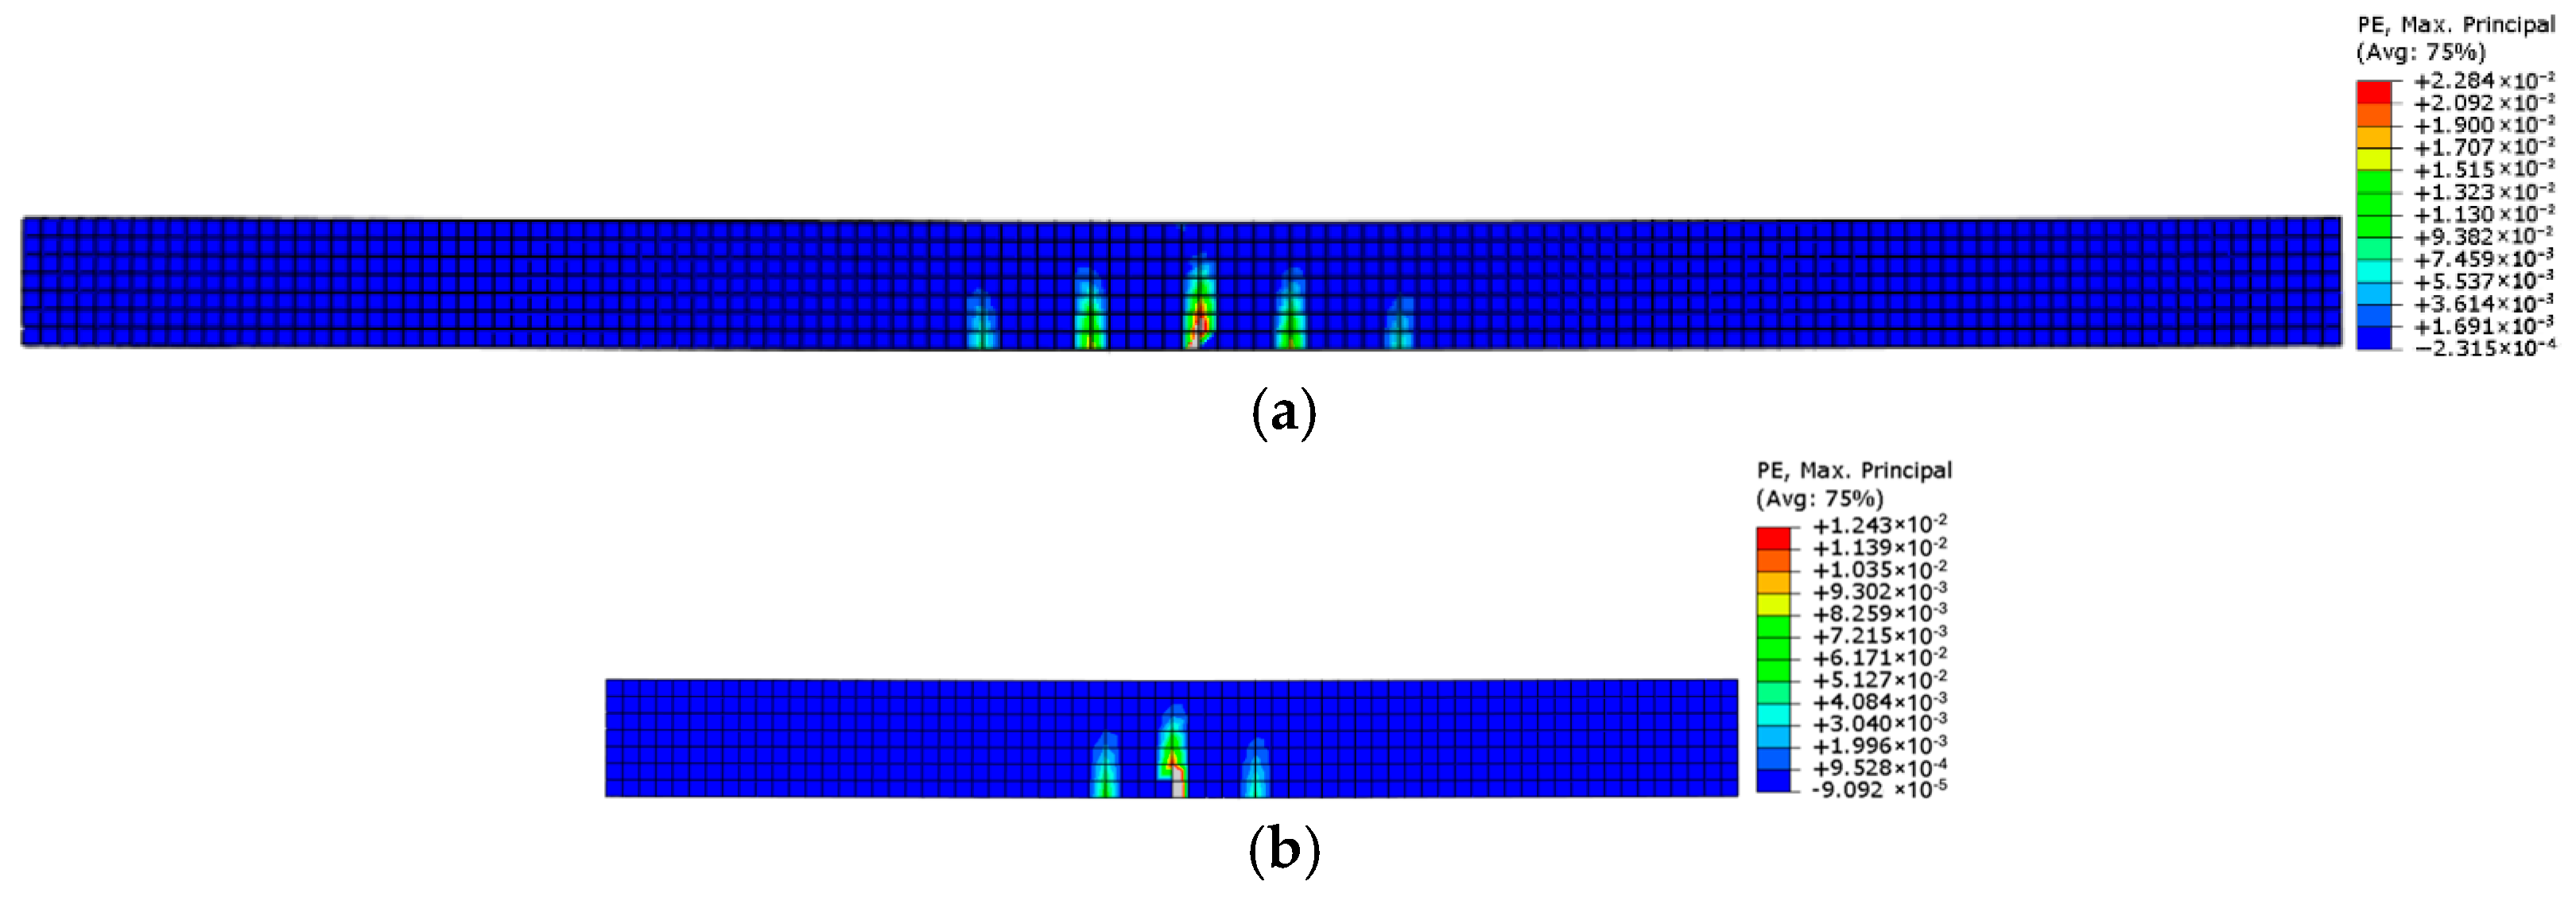
5.4. Three-Point Bending on Slabs of 68 cm × 30 cm × 7 cm and 128 cm × 68 cm × 7 cm
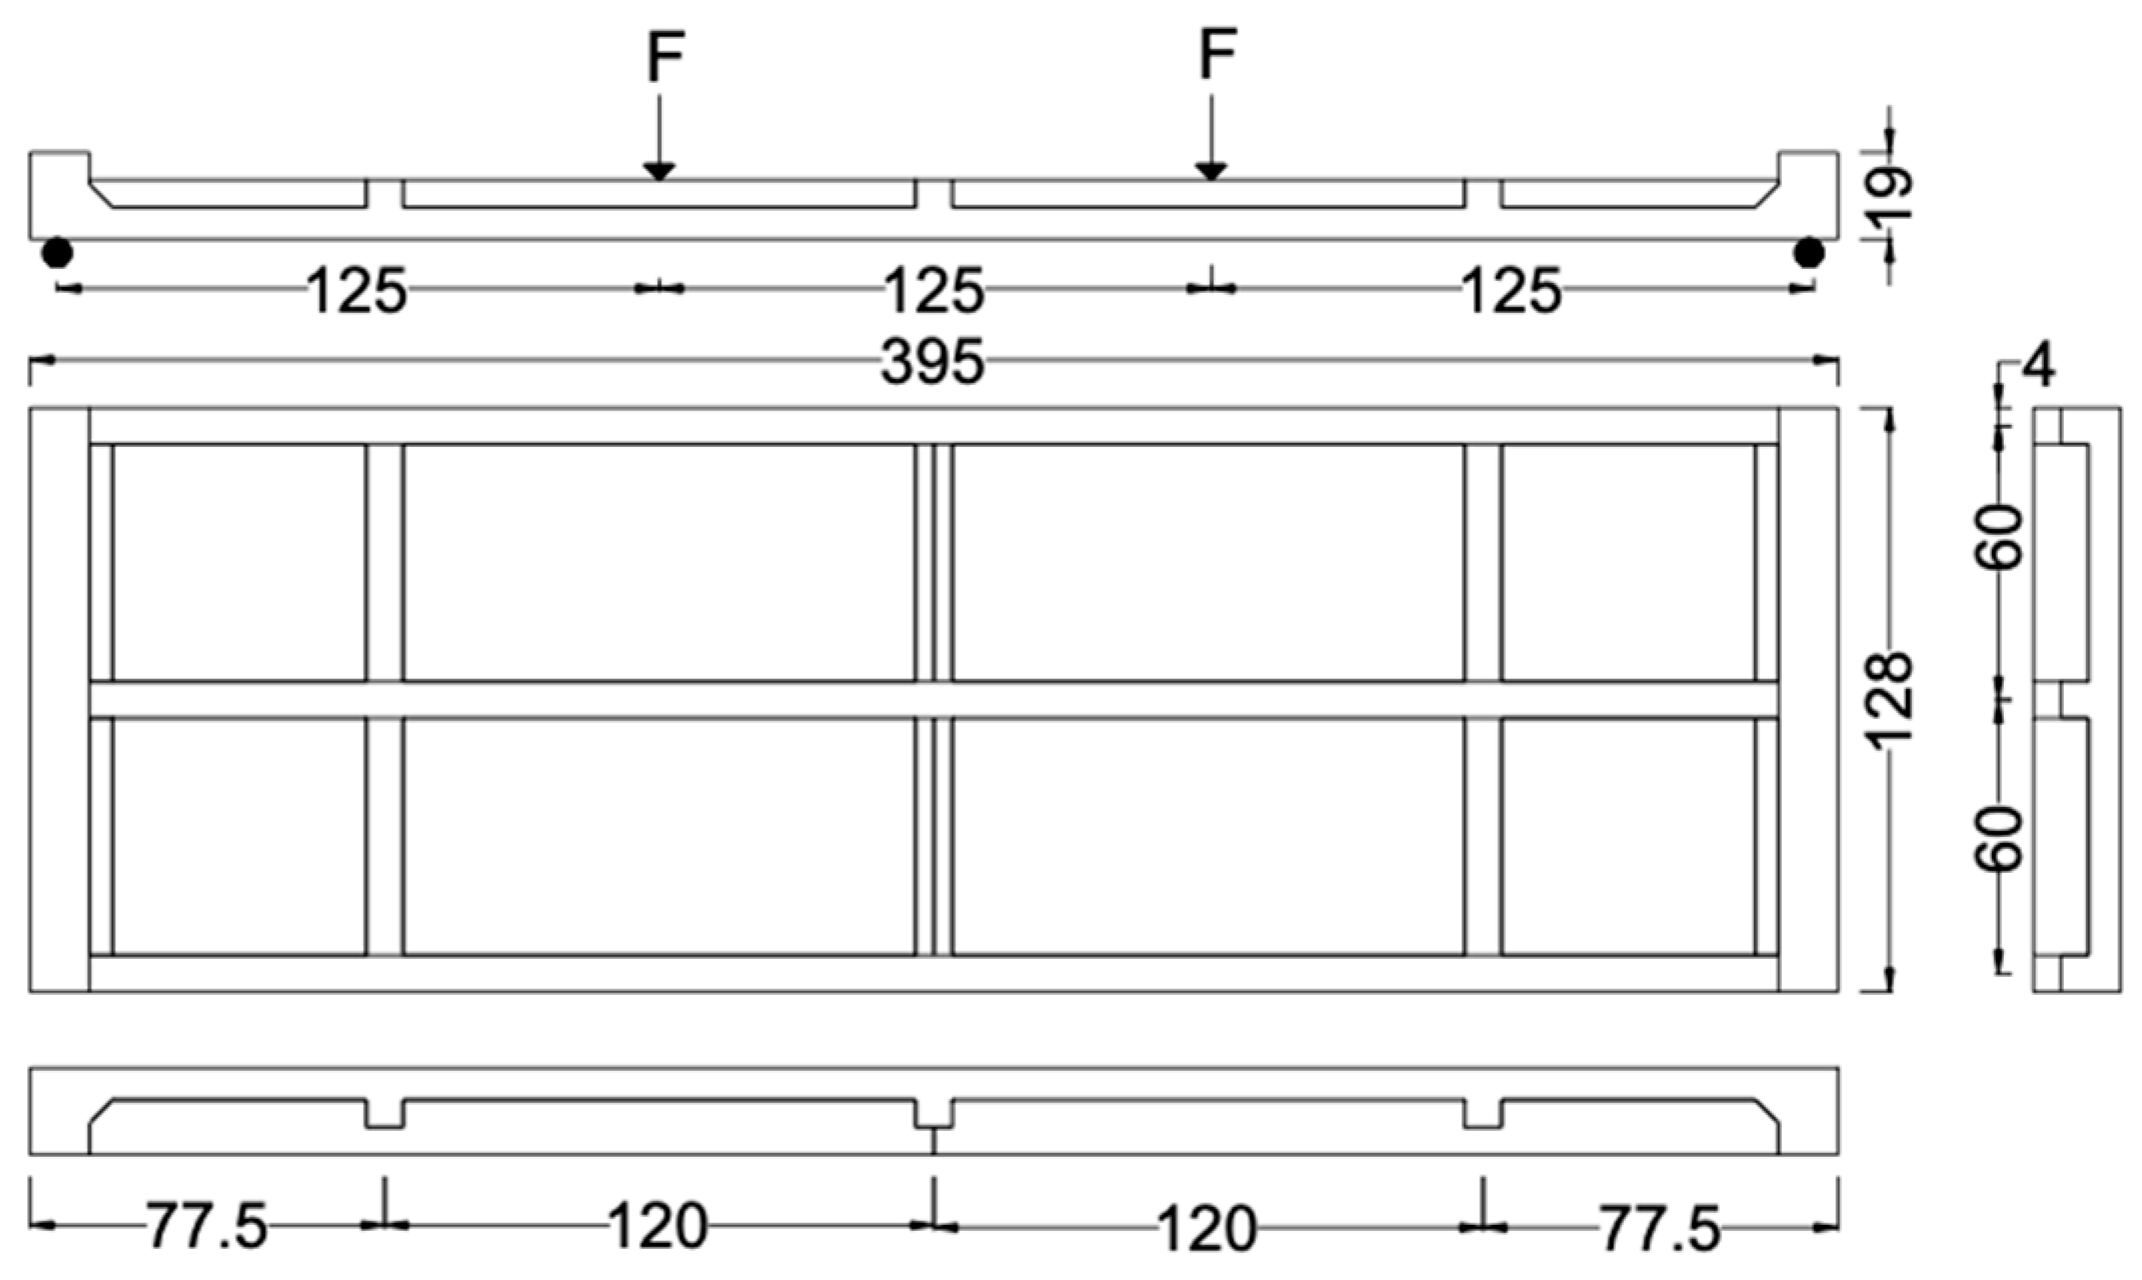
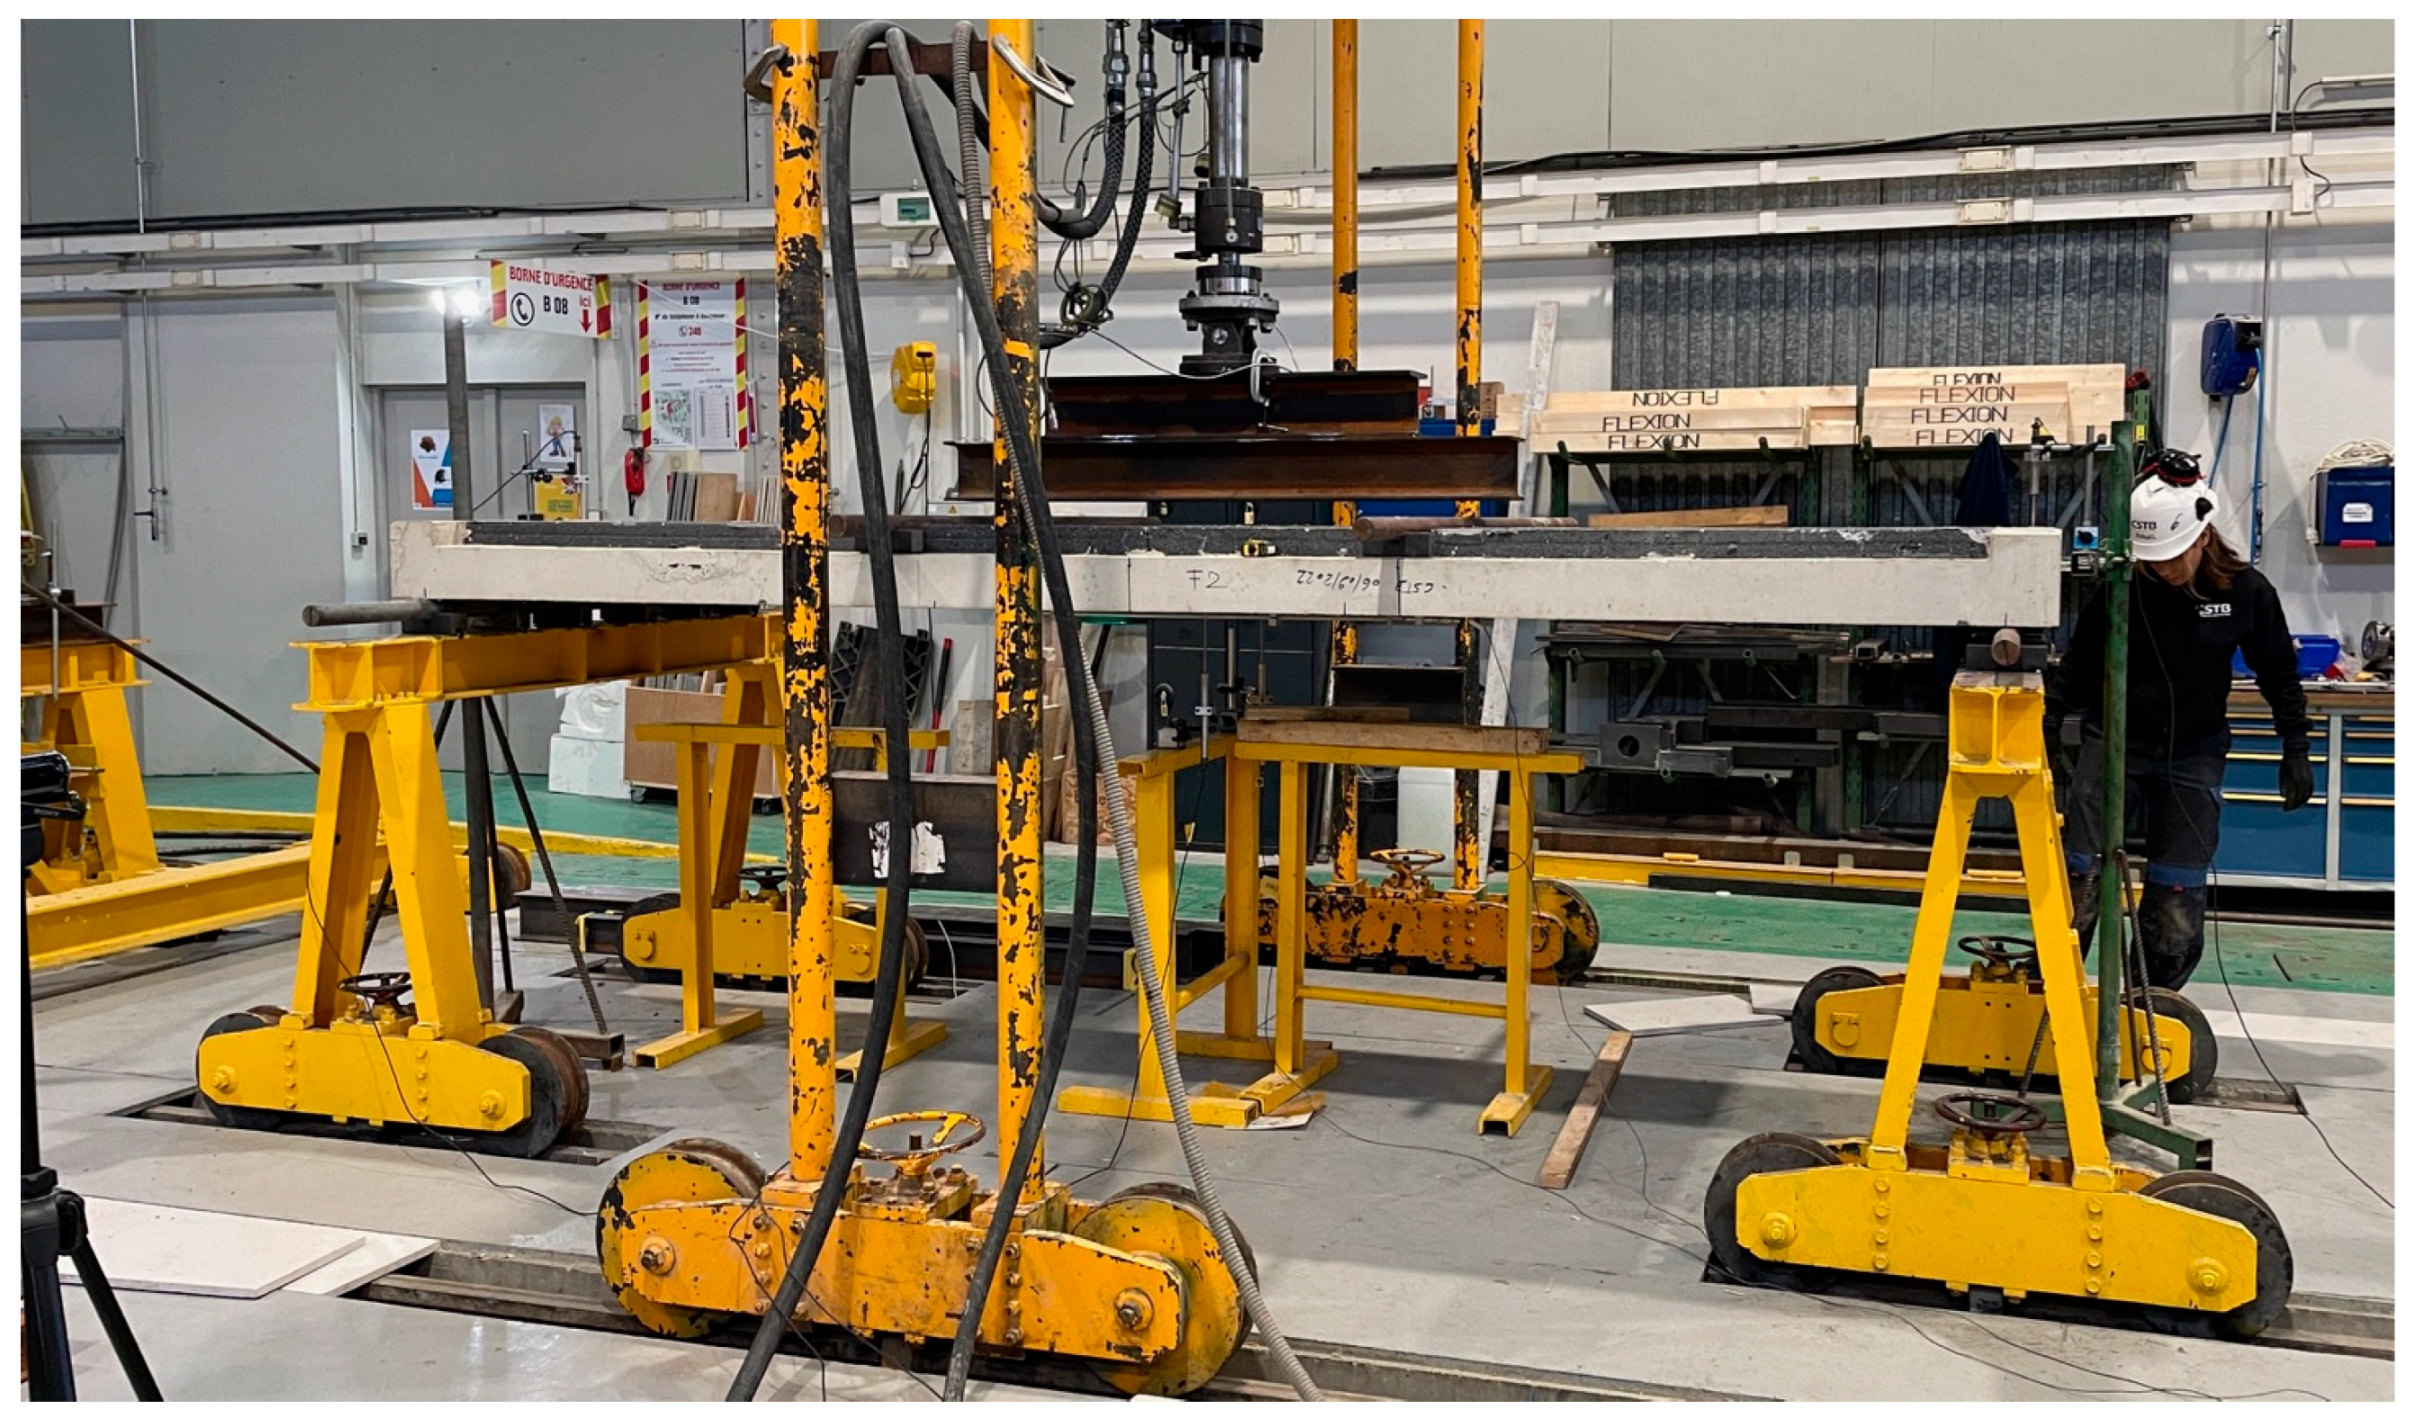
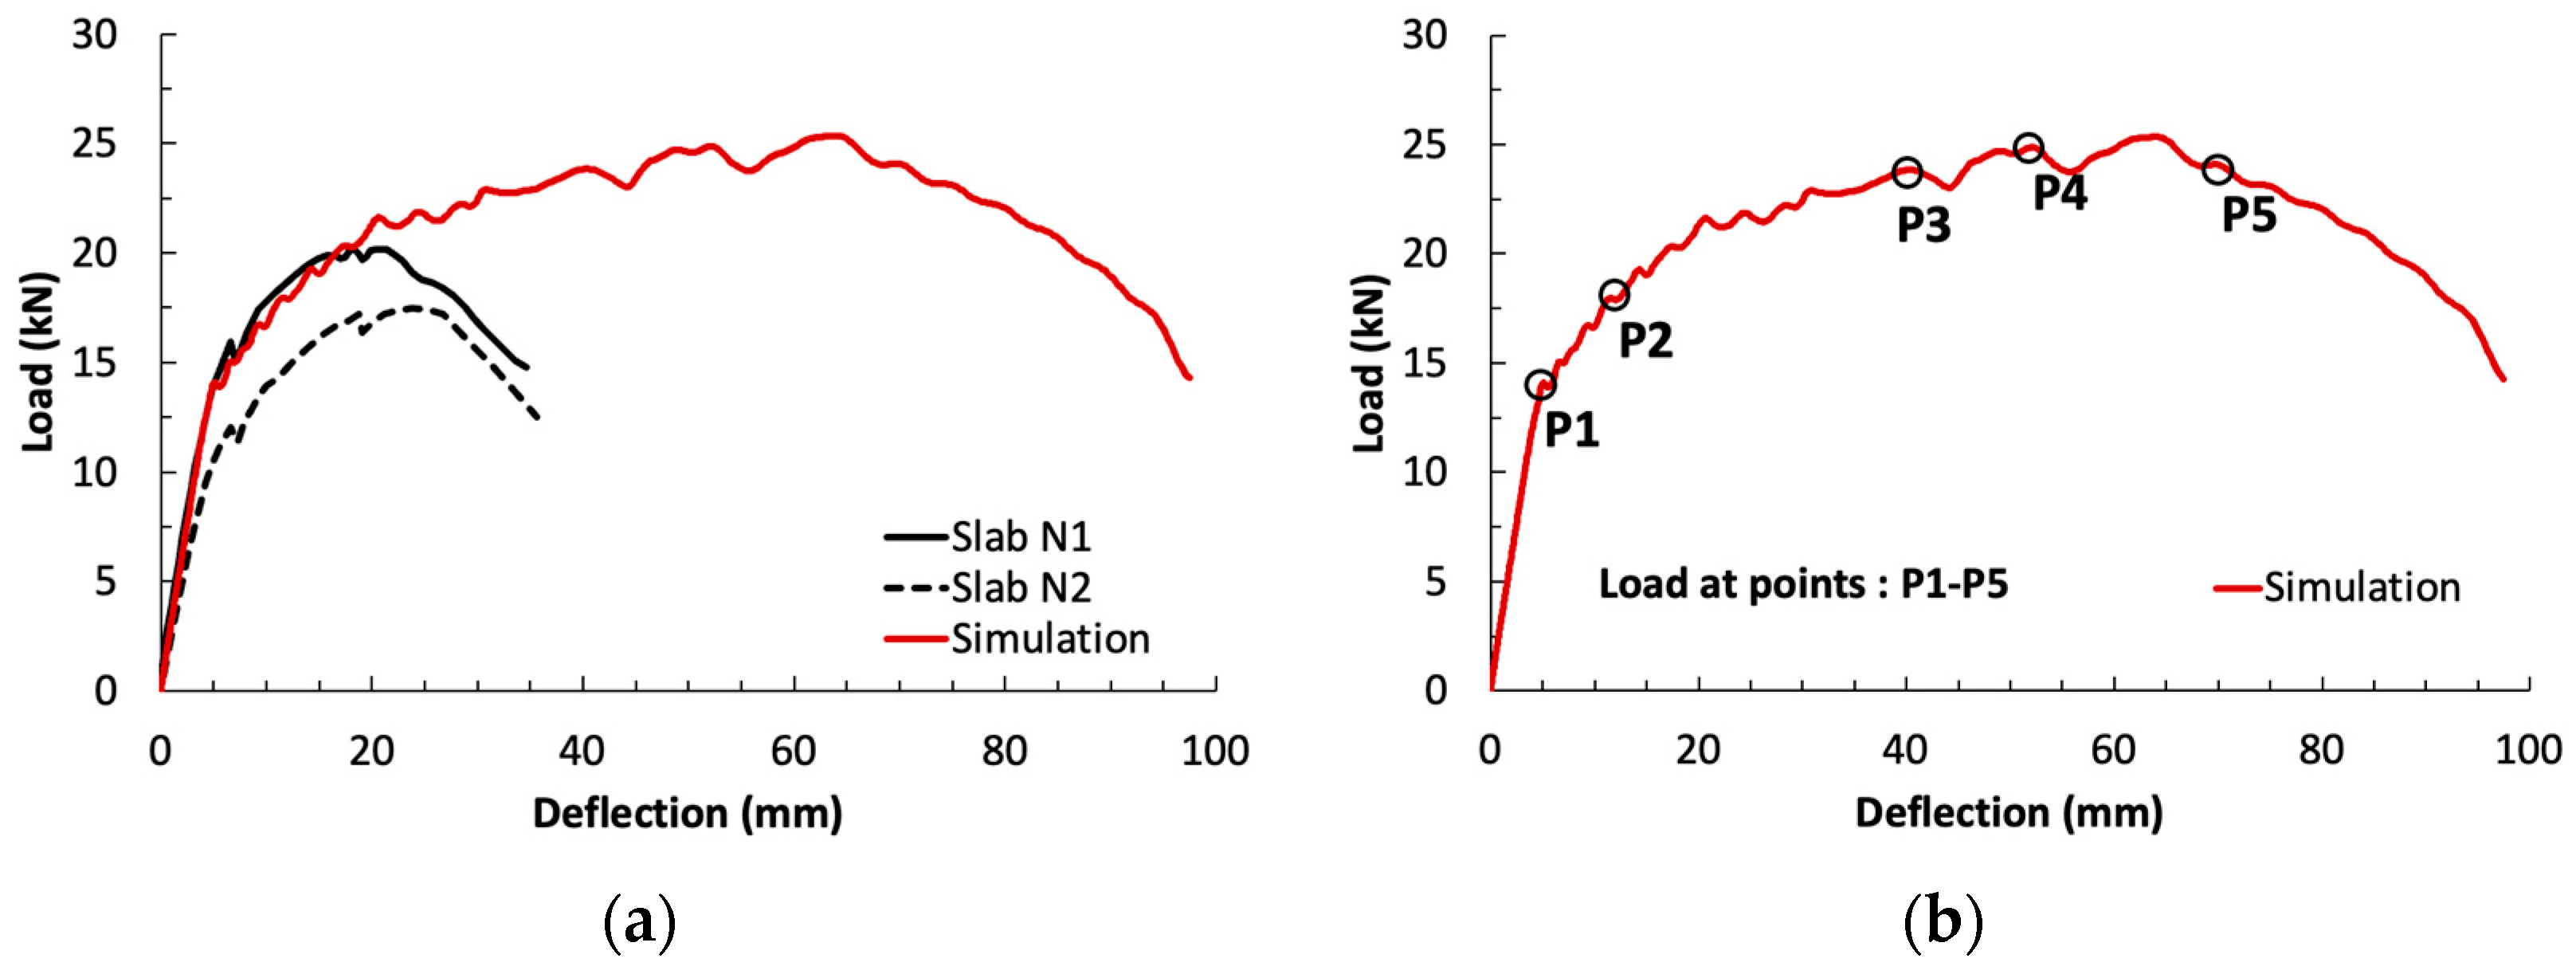
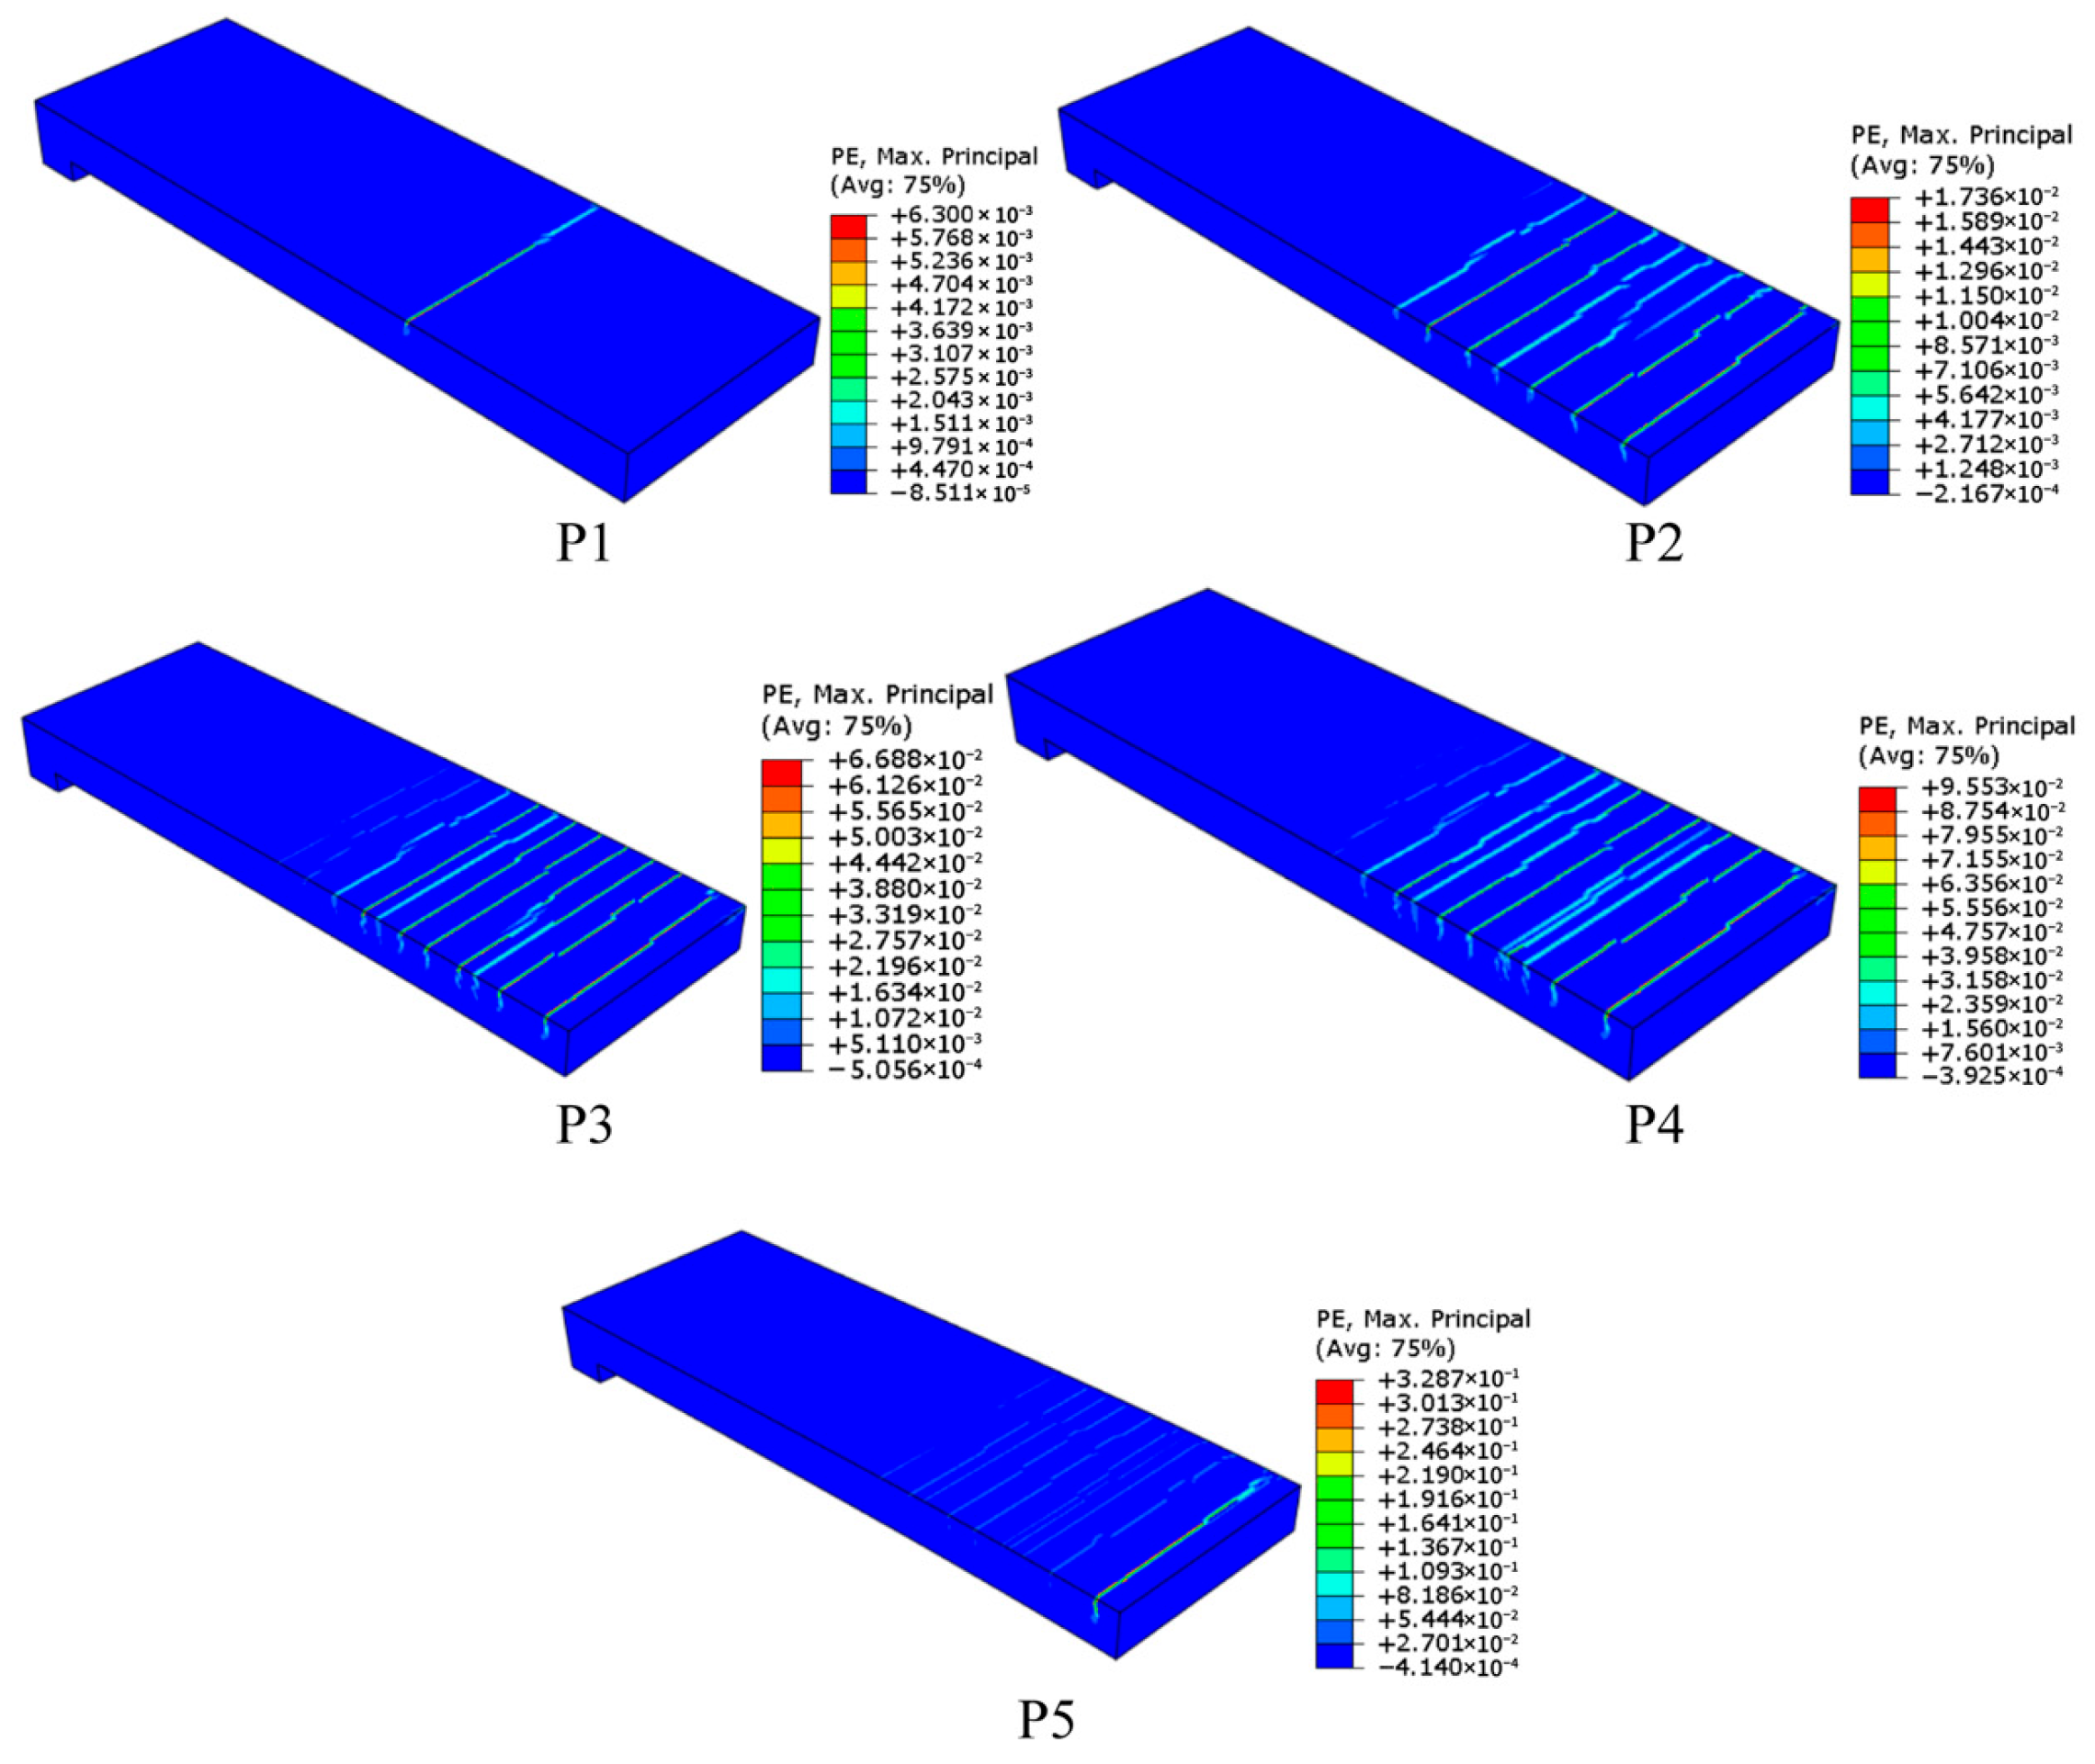
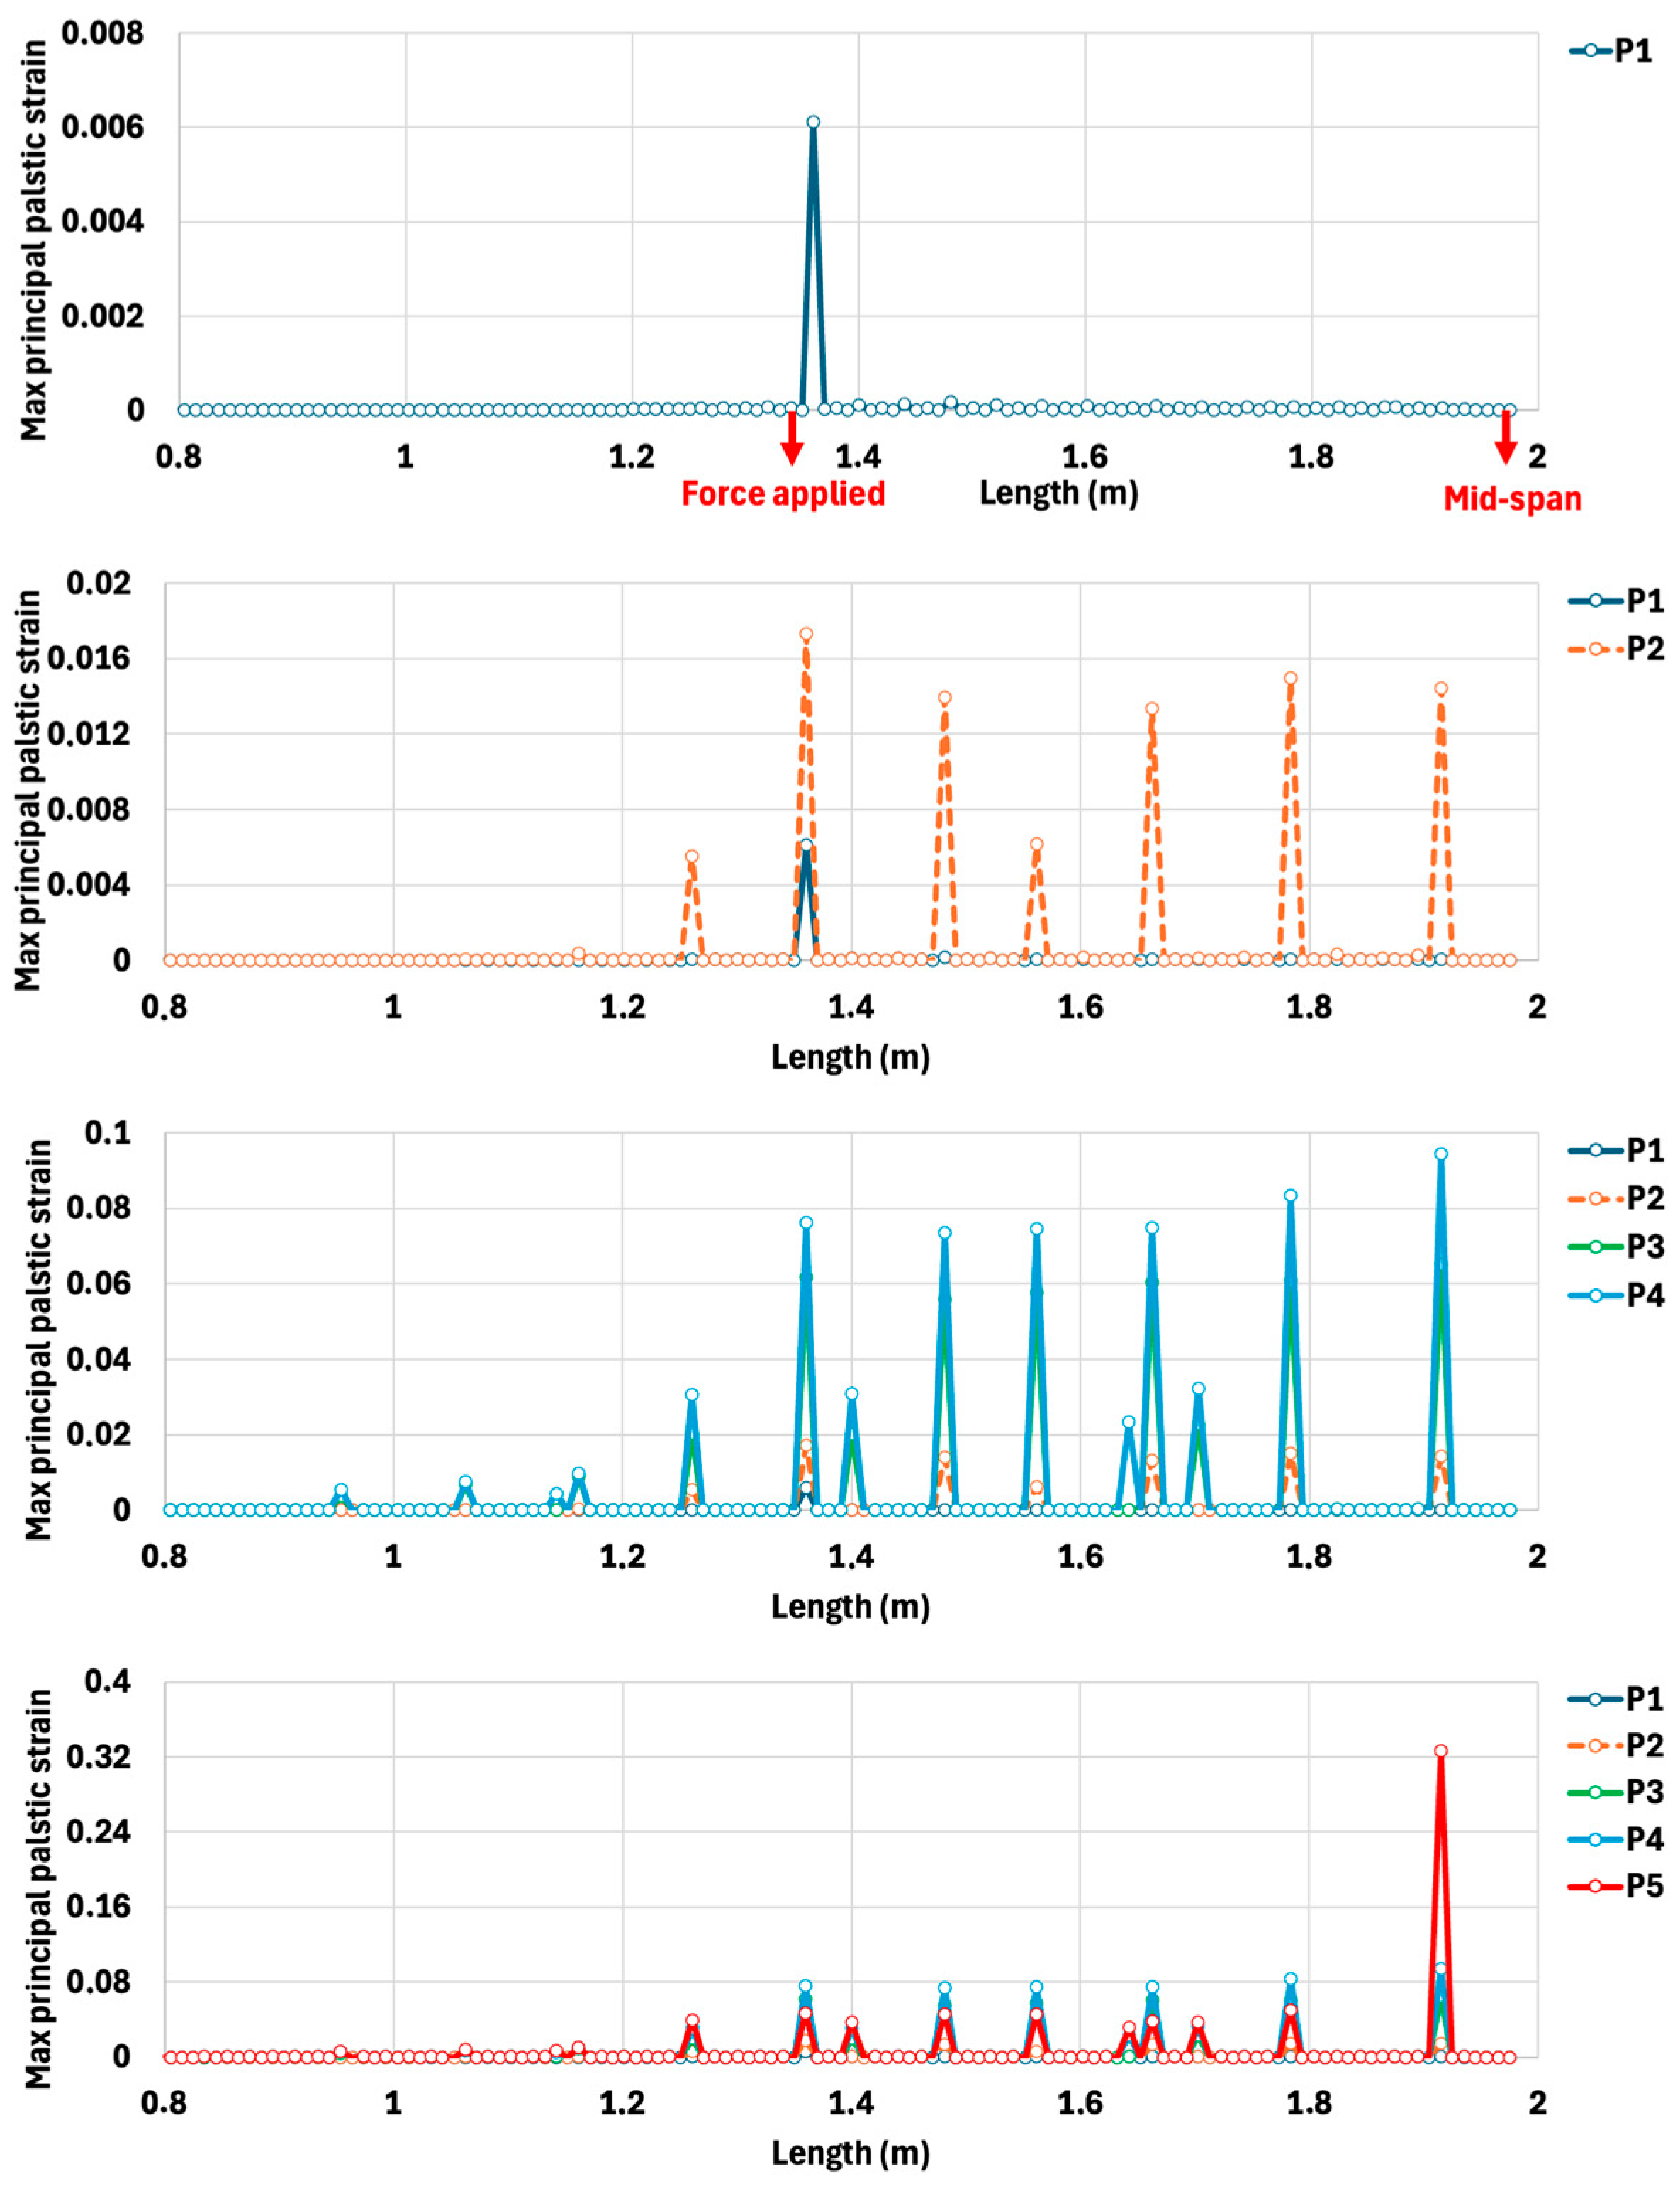
5.5. Four-Point Bending of a Representative Stiffened Slab
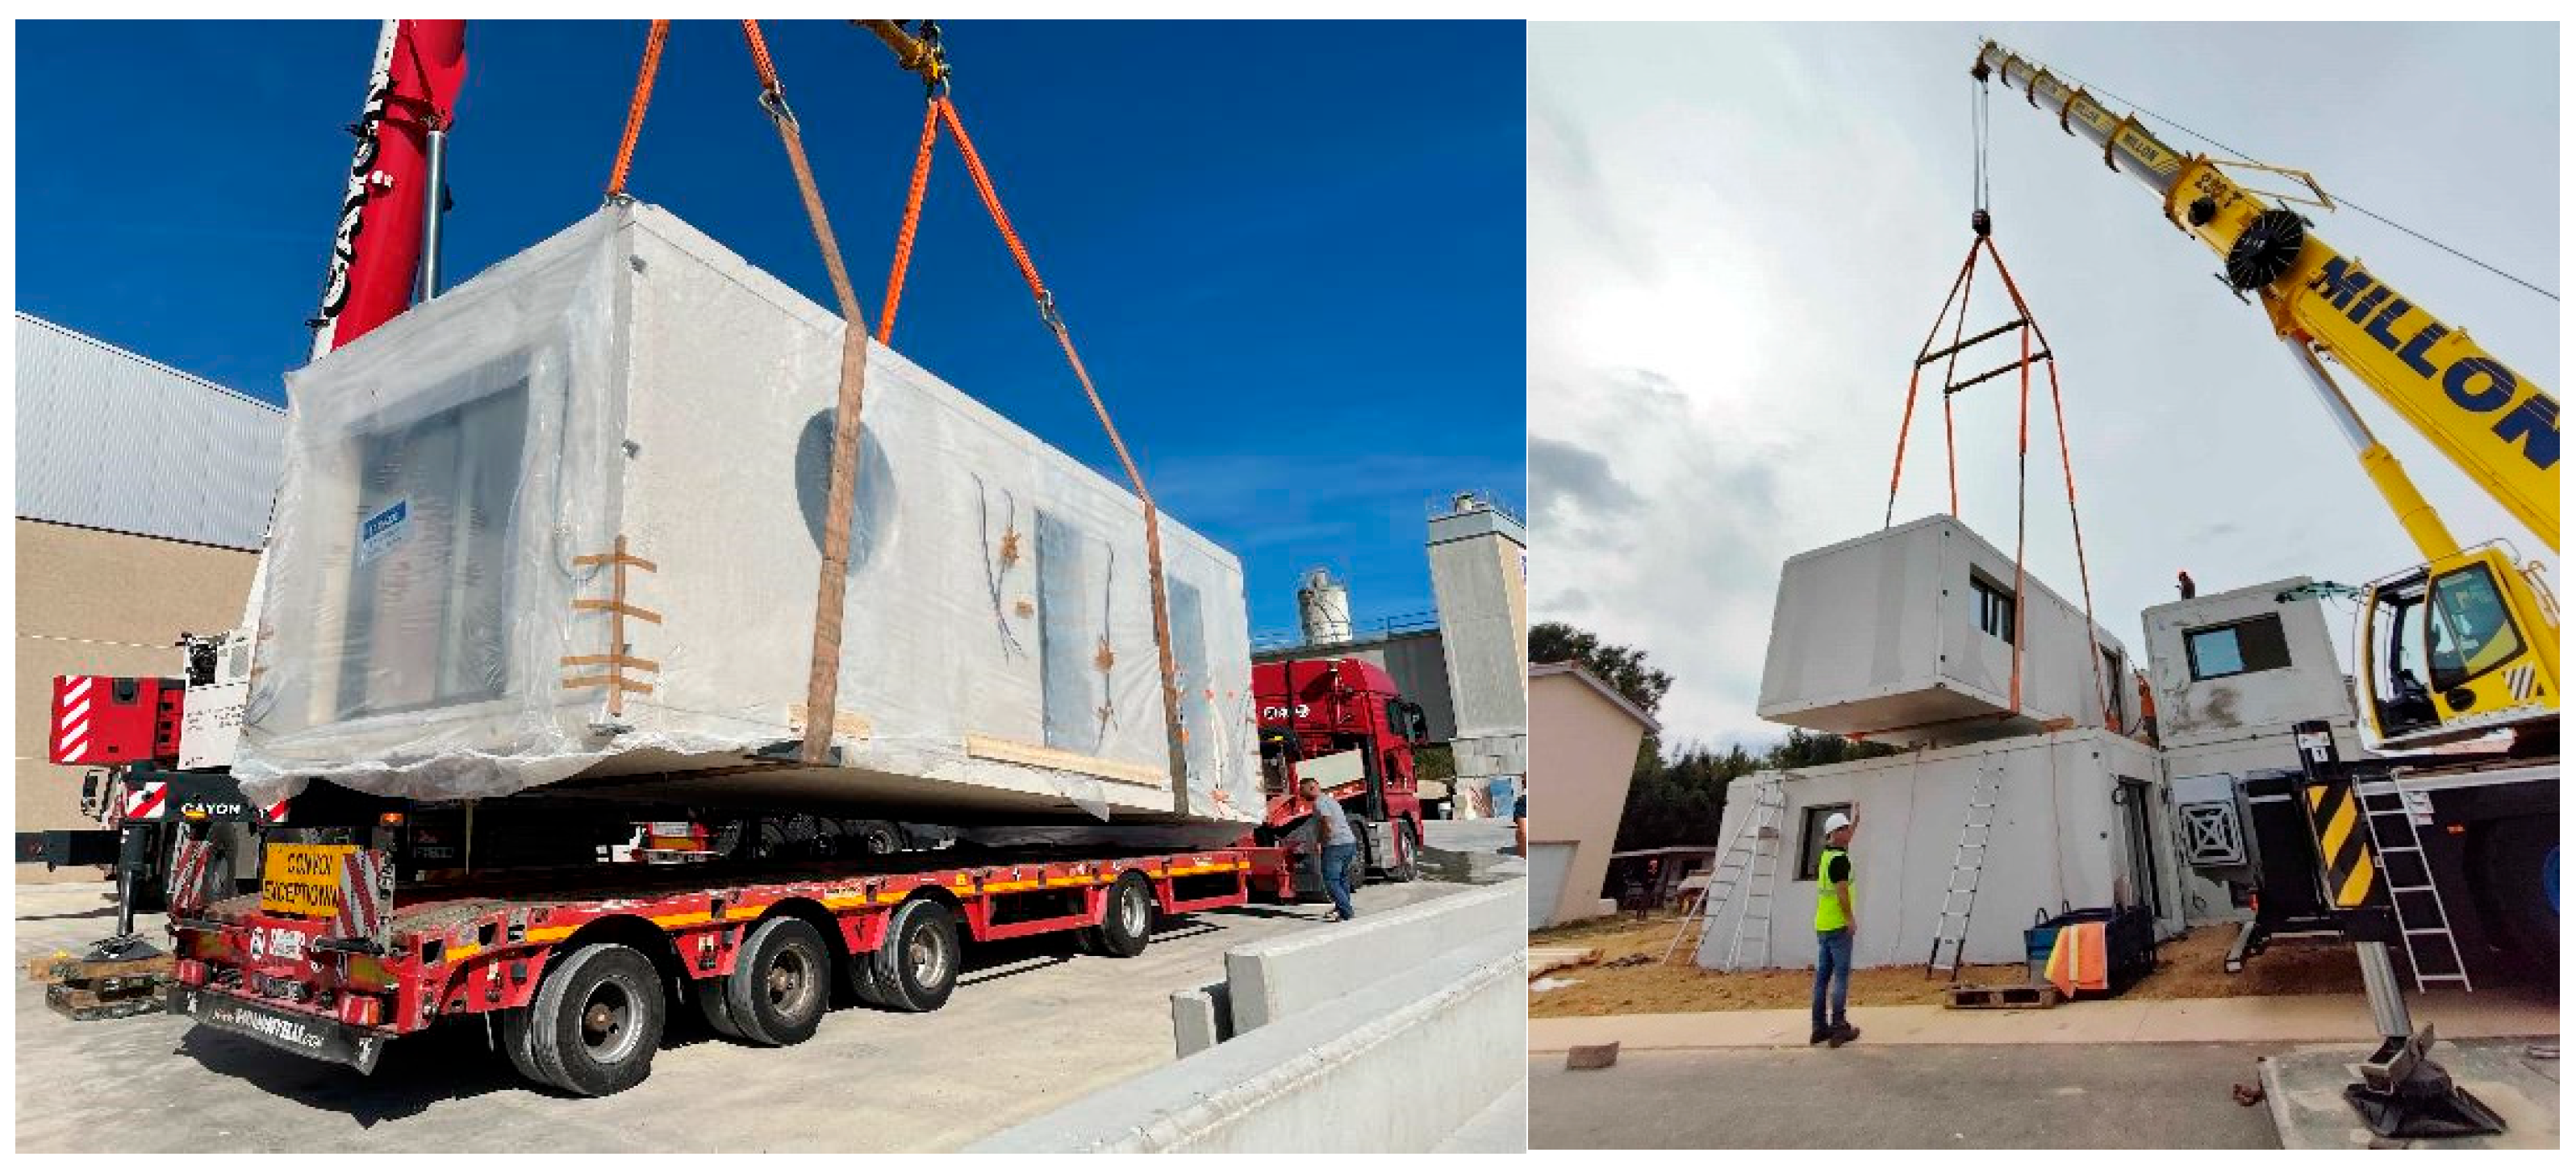
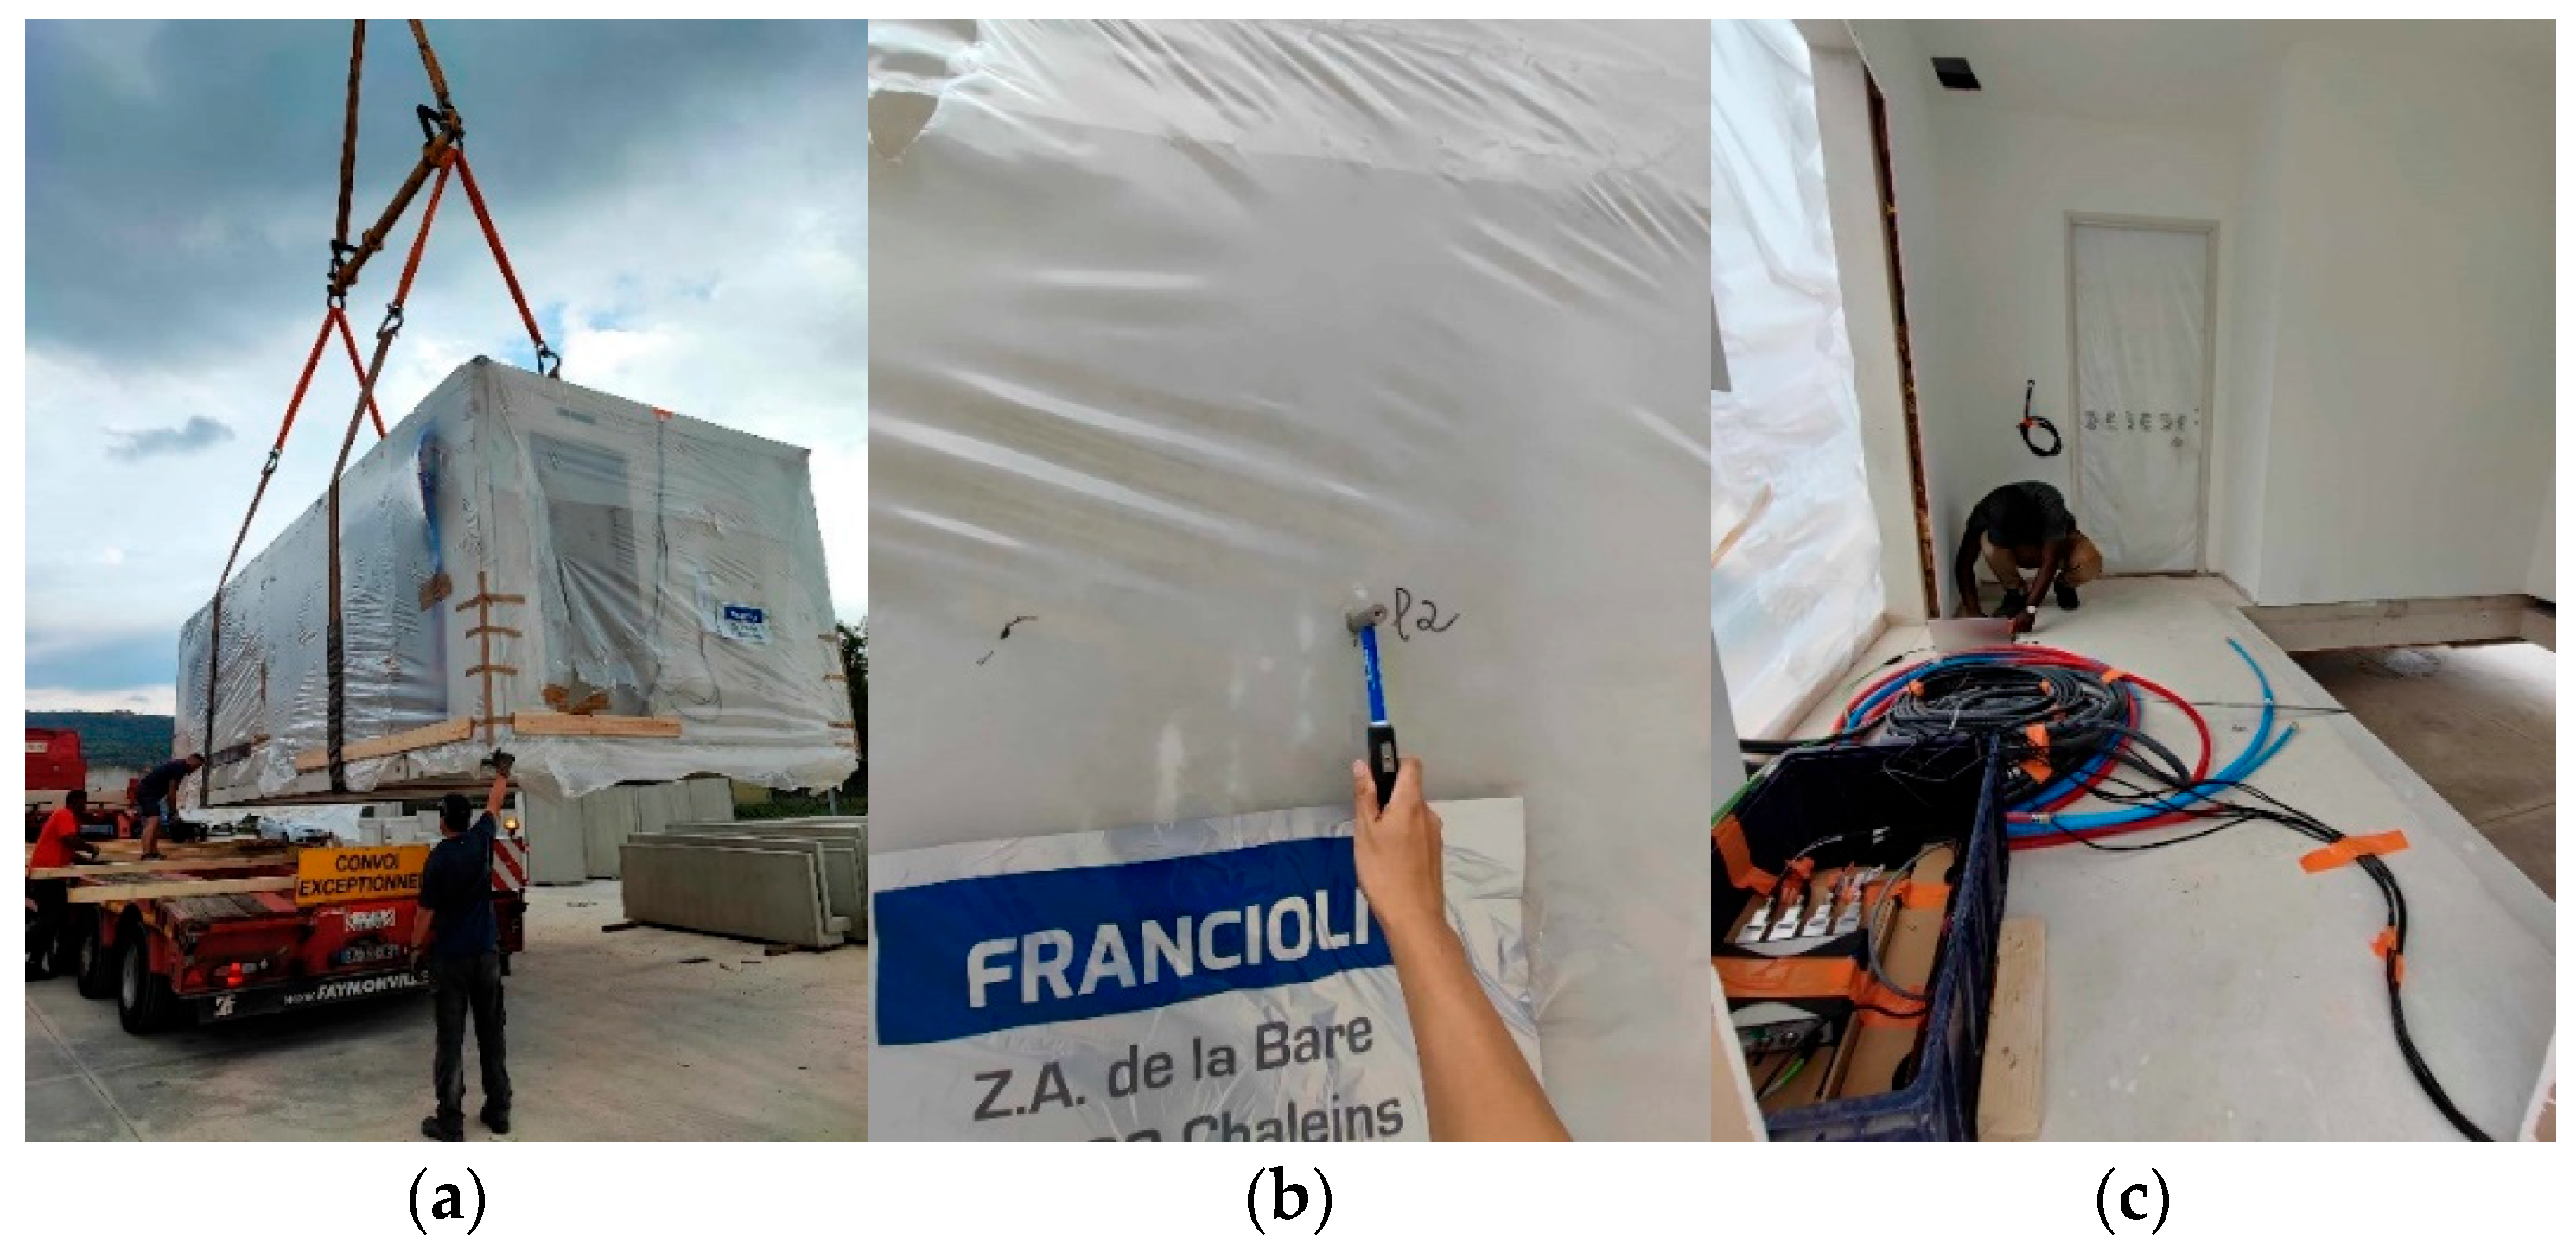
6. Transport of SFRC Module
6.1. Measurement During the Lifting Phase
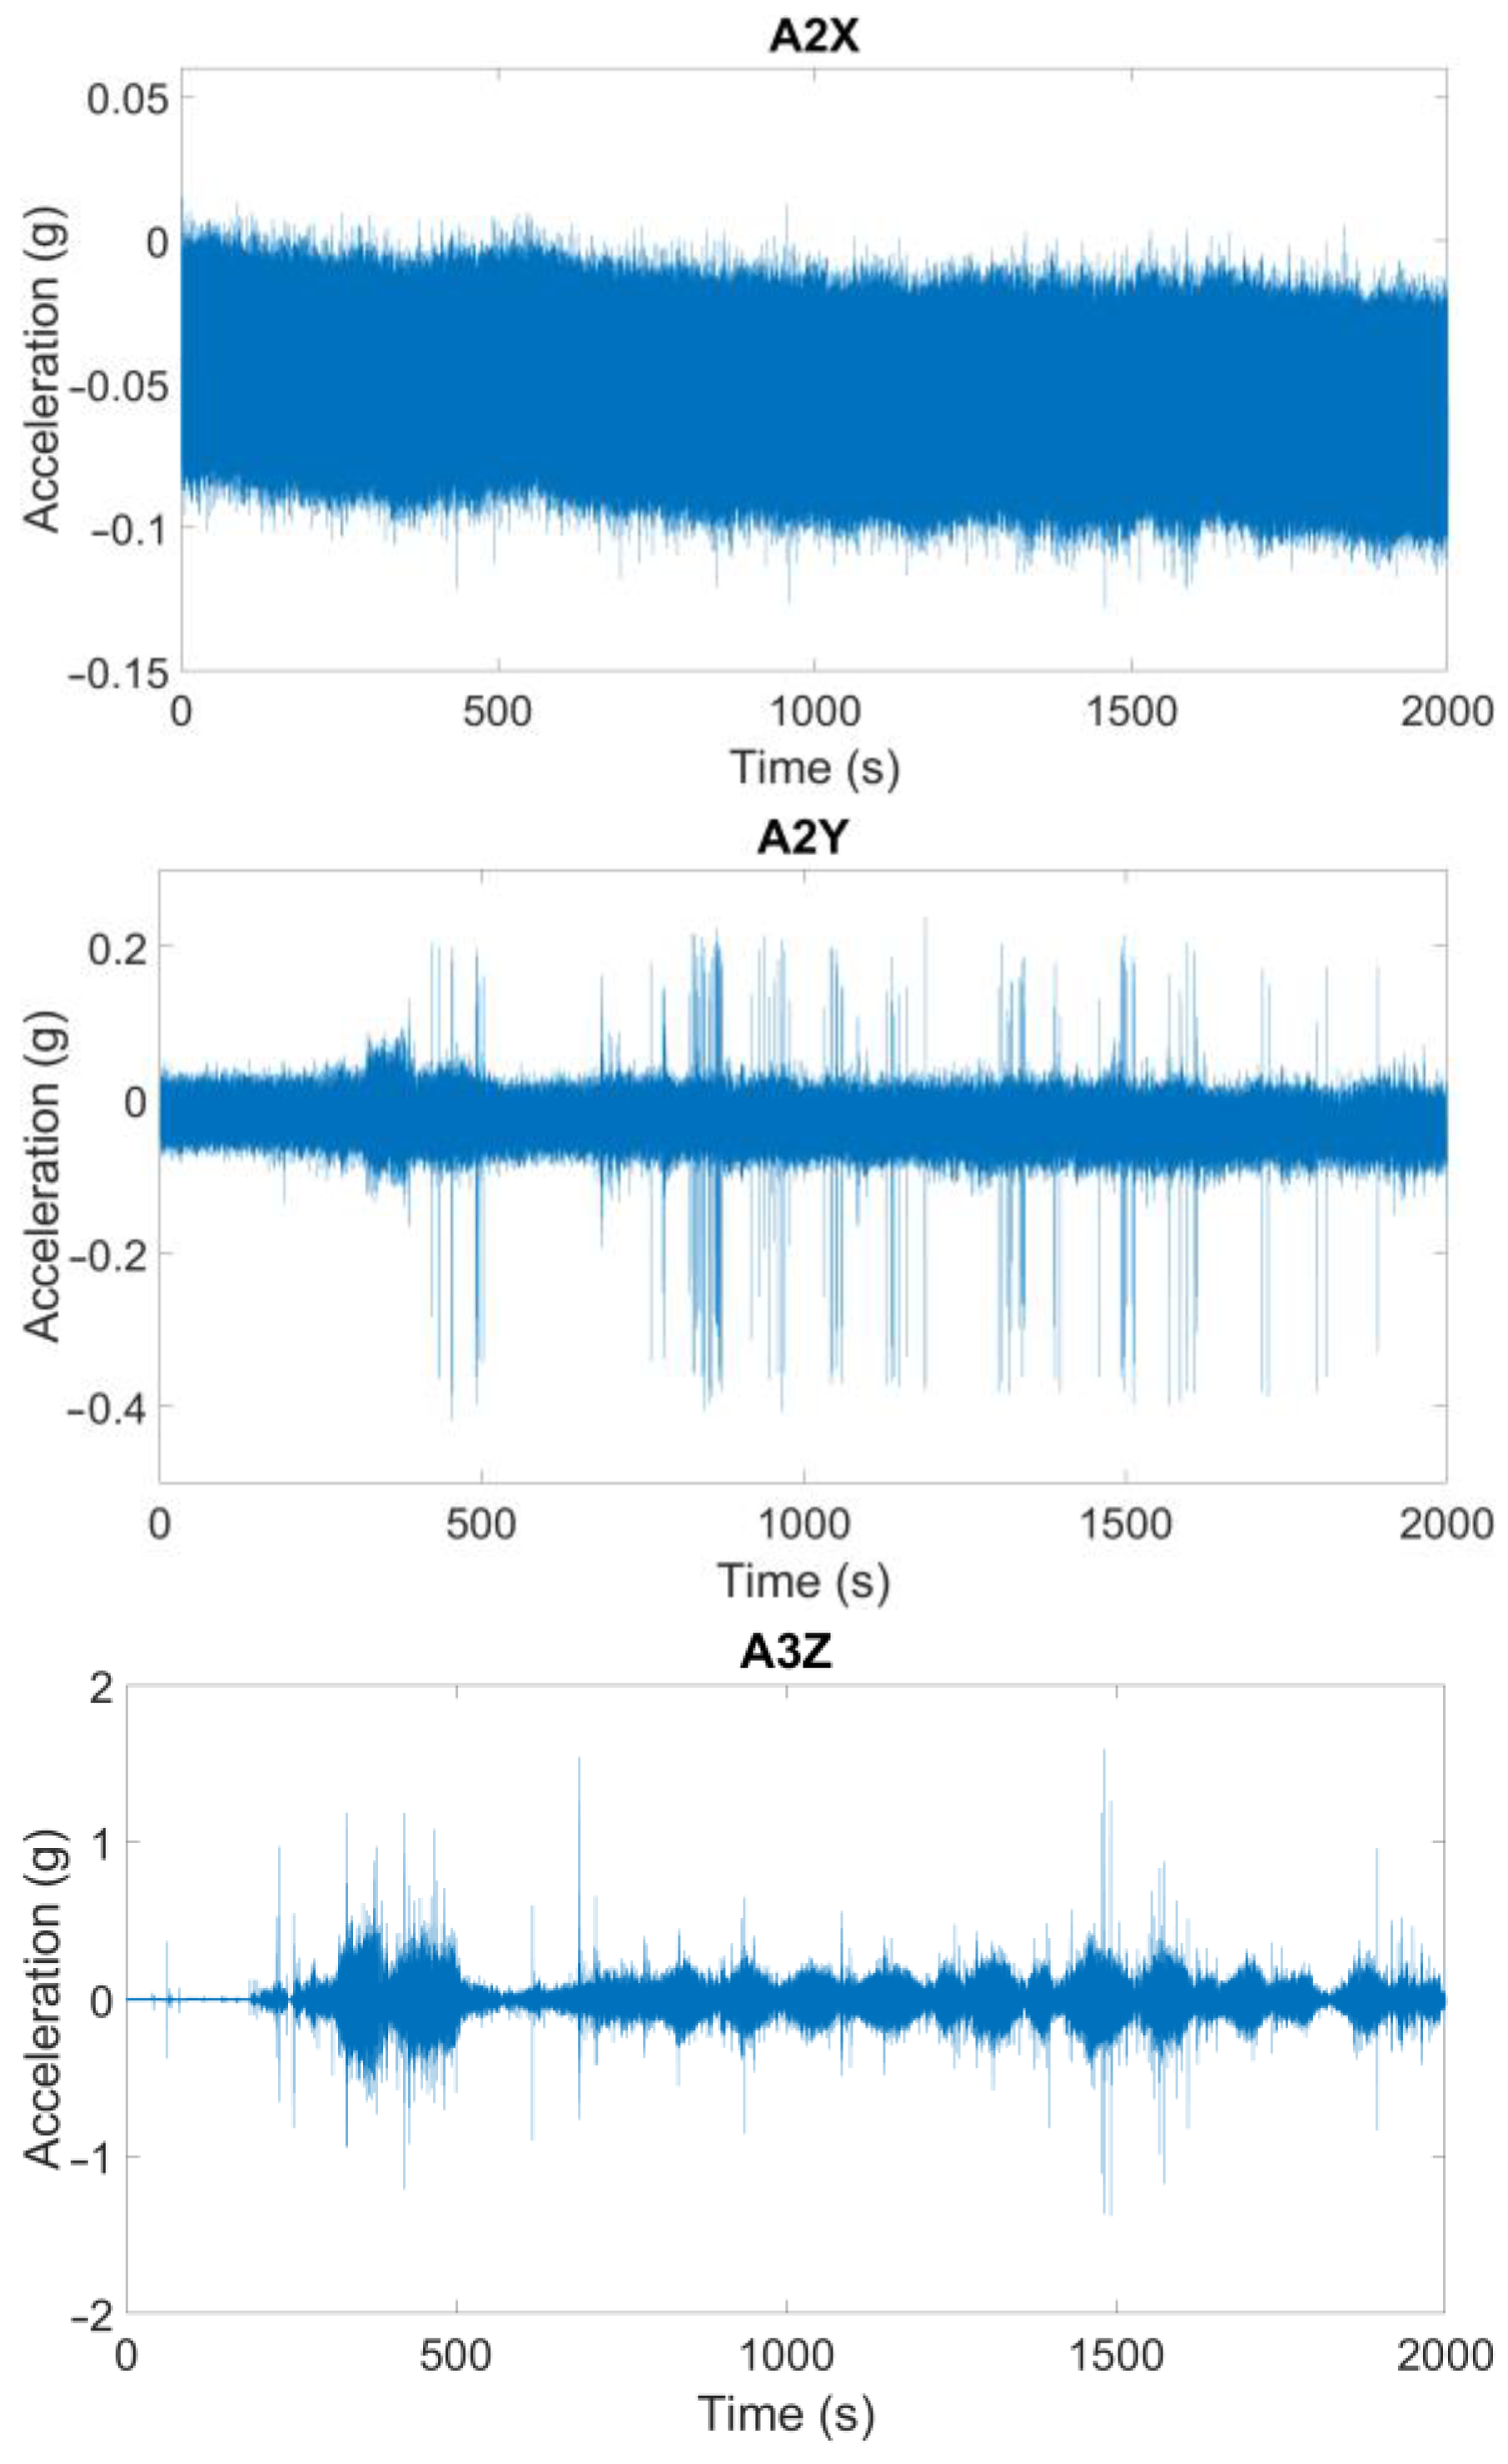
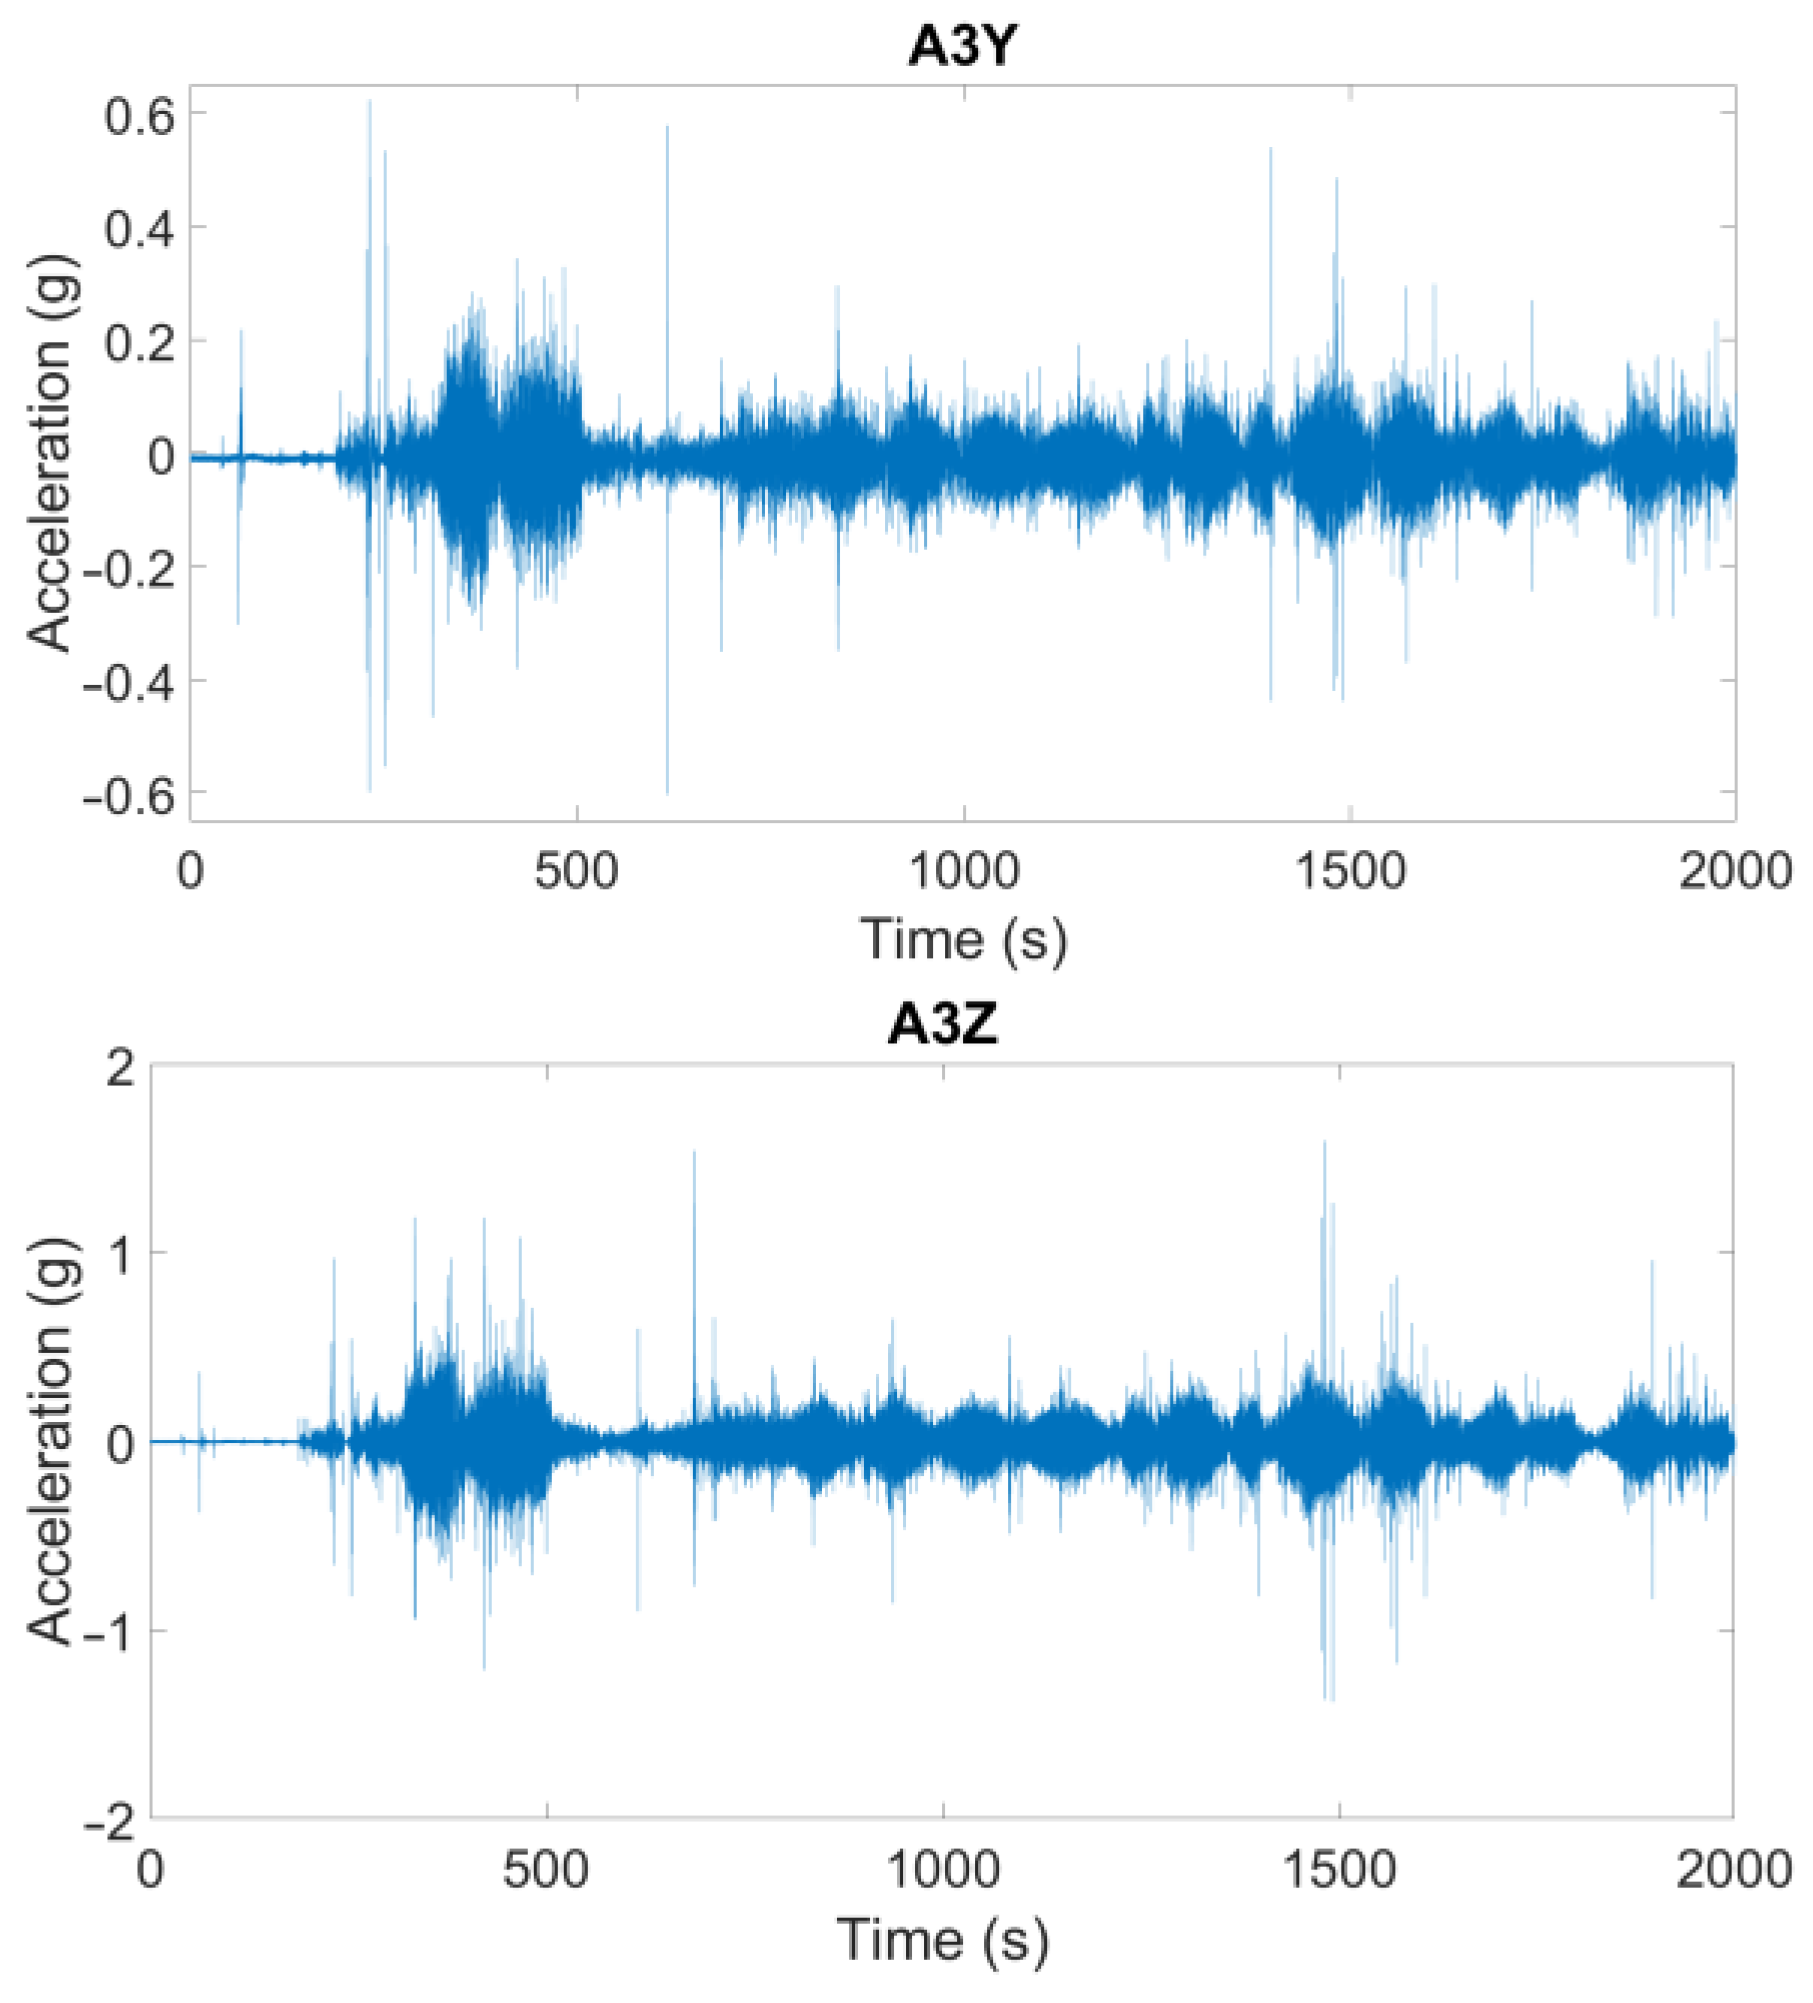
6.2. Measurement During Transport
7. Conclusions and Perspectives
- The tests conducted on SFRC with 80 kg/m3 of steel fibers demonstrated that 7 cm thick slabs were able to withstand transport stresses and flexural loads without conventional reinforcement. In practice, 1 m3 of SFRC with a fiber content of 80 kg/m3 costs approximately 1.5 times more than conventional RC with minimum reinforcement, typically between 20 and 40 kg/m3 (as in the case of slabs). However, the use of SFRC enables a significant reduction, about 65% in our case, of the total concrete volume required.
- Moreover, the considered stiffeners increase the flexural rigidity of these elements. These low thicknesses, as well as the use of a CEM III binder, reduce the carbon footprint. In long term, SFRC is known for its high durability, particularly in humid, aggressive, or crack-prone environments. The steel fibers used in this study are galvanized, making them less susceptible to corrosion issues. Flexural tests performed at 54 days indicated that the mechanical performance of the SFRC continues to improve significantly beyond the conventional 28 days used for ordinary concrete. Ongoing investigations are conducted to better assess long-term creep performance, and further insights will be reported in future work.
Author Contributions
Funding
Data Availability Statement
Acknowledgments
Conflicts of Interest
References
- Lawson, M.; Ogden, R.; Goodier, C. Design in Modular Construction; CRC Press: Boca Raton, FL, USA, 2014; p. 280. [Google Scholar]
- Thai, H.-T.; Ngo, T.; Uy, B. A review on modular construction for high-rise buildings. Structures 2020, 28, 1265–1290. [Google Scholar] [CrossRef]
- Chen, L.; Huang, Z.; Pan, W.; Su, R.K.; Zhong, Y.; Zhang, Y. Low carbon concrete for prefabricated modular construction in circular economy: An integrated approach towards sustainability, durability, cost, and mechanical performances. J. Build. Eng. 2024, 90, 109368. [Google Scholar] [CrossRef]
- Chen, H.; Yang, C.; Ou, J.; Zhao, B.; Li, C.; Li, C. Experimental study on seismic performance of modular cast-in-situ coupled shear wall with LRC infill wall. J. Build. Eng. 2023, 72, 106613. [Google Scholar] [CrossRef]
- Liew, J.; Chua, Y.; Dai, Z. Steel concrete composite systems for modular construction of high-rise buildings. Structures 2019, 21, 135–149. [Google Scholar] [CrossRef]
- Pang, S.D.; Liew, J.Y.R.; Dai, Z.; Wang, Y. Prefabricated Prefinished Volumetric Construction Joining Techniques Review. In Proceedings of the Modular and Offsite Construction (MOC), Edmonton, AB, Canada, 29 September–1 October 2016. [Google Scholar]
- Lacey, A.W.; Chen, W.; Hao, H.; Bi, K.; Tallowin, F.J. Shear behaviour of post-tensioned inter-module connection for modular steel buildings. J. Constr. Steel Res. 2019, 162, 105707. [Google Scholar] [CrossRef]
- Lacey, A.W.; Chen, W.; Hao, H.; Bi, K. Review of bolted inter-module connections in modular steel buildings. J. Build. Eng. 2019, 23, 207–219. [Google Scholar] [CrossRef]
- Building and Construction Authority (BCA). Code of Practice on Design/Buildability; Building and Construction Authority (BCA): Singapore, 2017. [Google Scholar]
- Chen, G.; Gao, D.; Zhu, H.; Yuan, J.S.; Xiao, X.; Wang, W. Effects of novel multiple hooked-end steel fibres on flexural tensile behaviour of notched concrete beams with various strength grades. Structures 2021, 33, 3644–3654. [Google Scholar] [CrossRef]
- Finazzi, S.; Paegle, I.; Fischer, G.; Minelli, F. Influence of bending test configuration on cracking behavior of FRC. In Proceedings of the 3rd All-Russia (International) Conference on Concrete and Reinforced Concrete, Moscow, Russia, 12–16 May 2014. [Google Scholar]
- Mahmod, M.; Hanoon, A.N.; Abed, H.J. Flexural behavior of self-compacting concrete beams strengthened with steel fiber reinforcement. J. Build. Eng. 2018, 16, 228–237. [Google Scholar] [CrossRef]
- Tavakoli, H.R.; Jalali, P.; Mahmoudi, S. Experimental evaluation of the effects of adding steel fiber on the post-cyclic behavior of reinforced self-compacting concrete beams. J. Build. Eng. 2019, 25, 100771. [Google Scholar] [CrossRef]
- Bui, T.-T.; Nana, W.S.A.; Doucet-Ferru, B.; Bennani, A.; Lequay, H.; Limam, A. Shear Performance of Steel Fiber Reinforced Concrete Beams Without Stirrups: Experimental Investigation. Int. J. Civ. Eng. 2020, 18, 865–881. [Google Scholar] [CrossRef]
- Shahrbijari, K.B.; Saha, S.; Barros, J.A.O.; Valente, I.B.; Dias, S.; Leite, J. Development and Mechanical Characterization of Dry Fiber-reinforced Concrete for Prefabricated Prestressed Beams. In Fibre Reinforced Concrete: Improvements and Innovations; Bookseries; Springer: Cham, Switzerland, 2020; pp. 49–63. [Google Scholar]
- Manso-Morato, J.; Hurtado-Alonso, N.; Revilla-Cuesta, V.C.; Skaf, M.; Ortega-López, V. Fiber-Reinforced concrete and its life cycle assessment: A systematic review. J. Build. Eng. 2024, 94, 110062. [Google Scholar] [CrossRef]
- Vivas, J.C.; Zerbino, R.L.; Torrijos, M.C.; Giaccio, G.M. Impact Response of Different Classes of Fibre Reinforced Concrete. In Fibre Reinforced Concrete: Improvements and Innovations; RILEM Bookseries; Springer: Cham, Switzerland, 2020; pp. 189–198. [Google Scholar]
- Zhang, S.; Zhang, C.; Liao, L. Investigation on the relationship between the steel fibre distribution and the post-cracking behaviour of SFRC. Constr. Build. Mater. 2019, 200, 539–550. [Google Scholar] [CrossRef]
- Boulekbache, B.; Hamrat, M.; Chemrouk, M.; Amziane, S. Flowability of fibre-reinforced concrete and its effect on the mechanical properties of the material. Constr. Build. Mater. 2010, 24, 1664–1671. [Google Scholar] [CrossRef]
- Zhao, Y.; Bia, J.; Wang, Z.; Huo, L.; Guan, J.; Zhao, Y.; Sun, Y. Numerical simulation of the casting process of steel fiber reinforced self-compacting concrete: Influence of material and casting parameters on fiber orientation and distribution. Constr. Build. Mater. 2021, 312, 125337. [Google Scholar] [CrossRef]
- Khan, M.S.; Ibrahim, S.M.; Shariq, M. Investigation on the influence of fiber fraction and orientation on the mechanical properties of fiber-reinforced concrete slabs. Struct. Concr. 2024, 25, 886–903. [Google Scholar] [CrossRef]
- Abedi, M.; Rojas, G.; Domingo, M.; Martius-Hammer, T.A.; Kanstad, T.; Ji, T. Steel fiber distribution and orientation in full-scale walls cast from FRC with various consistencies and casting procedures: Evaluation by the inductive method. Mater. Struct. 2025, 58, 81. [Google Scholar] [CrossRef]
- Bernard, E.S.; Pircher, M. The Influence of Thickness on Performance of Fiber-Reinforced Concrete in a Round Determinate Panel Test. Cem. Concr. Aggreg. 2001, 23, 27–33. [Google Scholar] [CrossRef]
- Zerbino, R.; Tobes, J.; Bossio, M.; Giaccio, G. On the orientation of fibres in structural members fabricated with self compacting fibre reinforced concrete. Cem. Concr. Compos. 2012, 34, 191–200. [Google Scholar] [CrossRef]
- Michels, J.; Waldmann, D.; Maas, S.; Zürbes, A. Steel fibers as only reinforcement for flat slab construction–Experimental investigation and design. Constr. Build. Mater. 2012, 26, 145–155. [Google Scholar] [CrossRef]
- Yao, X.; Han, Y.; Shen, L.; Zhu, D. Experimental study on the effect of polypropylene fiber on compressive strength and fracture properties of high-strength concrete after elevated temperatures. J. Build. Eng. 2024, 86, 108860. [Google Scholar] [CrossRef]
- EN 12390-3; Testing Hardened Concrete—Part 3: Compressive Strength of Test Specimens. CEN: Brussels, Belgium, 2019.
- EN 12390-6; Testing Hardened Concrete—Part 6: Tensile Splitting Strength of Test Specimens. CEN: Brussels, Belgium, 2023.
- Nguyen, D.L.; Kim, D.J.; Ryu, G.S.; Koh, K.T. Size effect on flexural behavior of ultra-high-performance hybrid fiber-reinforced concrete. Compos. Part B Eng. 2013, 45, 1104–1116. [Google Scholar] [CrossRef]
- EN 12390-5; Testing Hardened Concrete—Part 5: Flexural Strength of Test Specimens. CEN: Brussels, Belgium, 2019.
- EN 14651+A1; Test Method for Metallic Fibered Concrete—Measuring the Flexural Tensile Strength (Limit or Proportionality (LOP), Residual). CEN: Brussels, Belgium, 2007.
- Kwak, Y.-K.; Eberhard, M.O.; Kim, W.-S.; Kim, J. Shear Strength of Steel Fiber-Reinforced Concrete Beams without Stirrups. Struct. J. 2002, 99, 530–538. [Google Scholar]
- Cucchiara, C.; Mendola, L.L.; Papia, M. Effectiveness of stirrups and steel fibres as shear reinforcement. Cem. Concr. Compos. 2004, 26, 777–786. [Google Scholar] [CrossRef]
- Barragan, B.E. Failure and Toughness of Steel Fiber Reinforced Concrete under Tension and Shear. Ph.D. Thesis, Universitat Politècnica de Catalunya, Barcelona, Spain, 2002. [Google Scholar]
- Tahenni, T.; Chemrouk, M.; Lecompte, T. Effect of steel fibers on the shear behavior of high strength concrete beams. Constr. Build. Mater. 2016, 105, 14–28. [Google Scholar] [CrossRef]
- Khaloo, A.R.; Afshari, M. Flexural behaviour of small steel fibre reinforced concrete slabs. Cem. Concr. Compos. 2005, 27, 141–149. [Google Scholar] [CrossRef]
- Colombo, M.; Conforti, A.; Di Prisco, M.; Leporace-Guimil, B.; Plizzari, G.; Giulio, Z. The basis for ductility evaluation in SFRC structures in MC2020: An investigation on slabs and shallow beams. Struct. Concr. 2023, 24, 4406–4423. [Google Scholar] [CrossRef]
- CSTB, Centre Scientifique et Technique du Bâtiment. Available online: https://www.cstb.fr (accessed on 6 July 2024).
- Nana, W.; Bui, T.; Limam, A.; Abouri, S. Experimental and Numerical Modelling of Shear Behaviour of Full-scale RC Slabs Under Concentrated Loads. Structures 2017, 20, 96–116. [Google Scholar] [CrossRef]
- Rabi, M.; Cashell, K.A.; Shamass, R. Flexural analysis and design of stainless steel reinforced concrete beams. Eng. Struct. 2019, 198, 109432. [Google Scholar] [CrossRef]
- Nguyen, N.T.; Bui, T.-T.; Bui, Q.-B. Fiber reinforced concrete for slabs without steel rebar reinforcement: Assessing the feasibility for 3D-printed individual houses. Case Stud. Constr. Mater. 2022, 16, e00950. [Google Scholar] [CrossRef]
- Tian, Z.; Dai, Y.; Peng, T.; Zhang, Z.; Cai, Y.; Xu, B. Laminated Steel Fiber-Reinforced Concrete Hingeless Arch: Research on Damage Evolution Laws. Appl. Sci. 2024, 14, 5015. [Google Scholar] [CrossRef]
- International Federation for Structural Concrete (FIB). Fib Model Code for Concrete Structures 2010; FIB: Lausanne, Switzerland, 2013. [Google Scholar]
- Li, V.; Stang, H.; Krenchel, H. Michromechanics of crack briding in fibre-reinforced concrete. Mater. Struct. 1993, 26, 486–494. [Google Scholar] [CrossRef]
- Kooiman, A.G. Modelling Steel Fibre Reinforced Concrete for Structural Design. Ph.D. Thesis, Rotterdam: Delft University of Technology, Delft, The Netherlands, 2000. [Google Scholar]
- Di Prisco, M.; Colombo, M.; Dozio, D. Fibre-reinforced concrete in fib Model Code 2010: Principles, models and test validation. Struct. Concr. 2013, 14, 342–361. [Google Scholar] [CrossRef]
- CEB (Comité Euro-Interntionale du Beton) Bulletin. CEB-FIP Model Code 1990: Design Code; CEB: Lausanne, Switzerland, 1993. [Google Scholar]
- Irmawan, M.; Piscesa, B.; Alrasyid, H.; Suprobo, P. Numerical Modeling of Steel Fiber Reinforced Concrete Beam with Notched under Three-point Bending Test. Civ. Eng. Arch. 2022, 10, 3227–3242. [Google Scholar] [CrossRef]
- Innella, F.; Bai, Y.; Zhu, Z. Acceleration responses of building modules during road transportation. Eng. Struct. 2020, 210, 110398. [Google Scholar] [CrossRef]


| Test Specimens | Curing | Dynamic Modulus | Loading Speed | Cracking Resistance ft | Average Cracking Resistance Ftm | Standard Deviation | Maximum Strength | Ultimate Resistance |
| days | GPa | MPa | MPa | kN | MPa | |||
| P1 | 8 | 33.80 | 51.3 N/s | 7.18 | 7.21 | 0.08 | 12.08 | 11.41 |
| P2 | 32.85 | 3 mm/min | 7.31 | 14.06 | 12.65 | |||
| P3 | 32.51 | 51.3 N/s | 7.12 | 13.09 | 12.35 | |||
| P4 | 33.15 | 3 mm/min | 7.23 | 13.23 | 12.53 | |||
| P5 | 54 | 31.76 | 51.3 N/s | 6.88 | 7.79 | 0.86 | 11.08 | 10.00 |
| P6 | 32.92 | 3 mm/min | 8.47 | 13.49 | 12.07 | |||
| P7 | 32.09 | 3 mm/min | 8.90 | 10.97 | 9.79 | |||
| P8 | 32.98 | 51.3 N/s | 6.71 | 14.09 | 13.50 | |||
| P9 | 31.64 | 3 mm/min | 7.82 | 11.21 | 10.38 | |||
| P10 | 32.20 | 3 mm/min | 7.95 | 12.11 | 11.48 |
| Notch Position | Test Specimens | Cracking Resistance (MPa) | * FR.1 (MPa) | * FR.2 (MPa) | * FR.3 (MPa) | * FR.4 (MPa) | Maximum Strength (MPa) |
|---|---|---|---|---|---|---|---|
| Reference | LOP | CMOD1 | CMOD2 | CMOD3 | CMOD4 | Ftmax | |
| No. 1 (The notch is located on one of the lateral faces of the specimen, perpendicular to formwork bottom) | Gf1 | 6.47 | 11.81 | 10.23 | 8.65 | 7.33 | 11.82 |
| Gf2 | 5.79 | 8.61 | 7.46 | 6.23 | 4.80 | 8.78 | |
| Gf3 | 6.68 | 11.85 | 11.04 | 9.64 | 8.40 | 12.05 | |
| Gf4 | 6.85 | 11.70 | 11.58 | 10.27 | 9.50 | 12.32 | |
| No. 2 (notch is located at the base of the specimen) | Gf5 | 7.04 | 12.49 | 11.86 | 10.98 | 9.44 | 12.52 |
| Gf6 | 7.03 | 11.93 | 11.66 | 10.62 | 9.09 | 12.21 | |
| Average | 6.64 | 11.40 | 10.64 | 9.40 | 8.09 | 11.62 |
| References | Cracking | Failure | |||||||
|---|---|---|---|---|---|---|---|---|---|
| No. Slab | Dimensions (cm) | Load (kN) | Cracking Stress (MPa) | Average Stress (MPa) | Standard Deviation | Maximal Load (kN) | Maximum Stress (MPa) | Average Stress (MPa) | Standard Deviation |
| 1 | 128 × 68 × 7 | 14.20 | 7.90 | 8.07 | 0.15 | 17.10 | 9.53 | 10.65 | 1.23 |
| 2 | 14.70 | 8.20 | 21.45 | 11.97 | |||||
| 3 | 14.50 | 8.10 | 18.70 | 10.46 | |||||
| S1 | 68 × 30 × 7 | 12.23 | 7.99 | 8.23 | 0.16 | 15.08 | 9.85 | 11.68 | 1.22 |
| S2 | 12.95 | 8.46 | 18.41 | 12.02 | |||||
| S3 | 12.60 | 8.23 | 20.17 | 13.17 | |||||
| References | Cracking | Failure | |||||||
|---|---|---|---|---|---|---|---|---|---|
| No. Slab | Dimensions (cm) | Load (kN) | Cracking Stress (MPa) | Average Stress (MPa) | Standard Deviation | Maximal Load (kN) | Maximum Stress (MPa) | Average Stress (MPa) | Standard Deviation |
| 1 | 395 × 128 × 7 | 10.70 | 6.39 | 7.35 | 1.35 | 17.61 | 10.53 | 11.32 | 1.12 |
| 2 | 13.89 | 8.30 | 20.28 | 12.12 | |||||
| Axis and Direction | Time (Seconds) | On truck (A3) | On the Top Slab of the Module (A2) | [A3 − A2/A3] (%) |
|---|---|---|---|---|
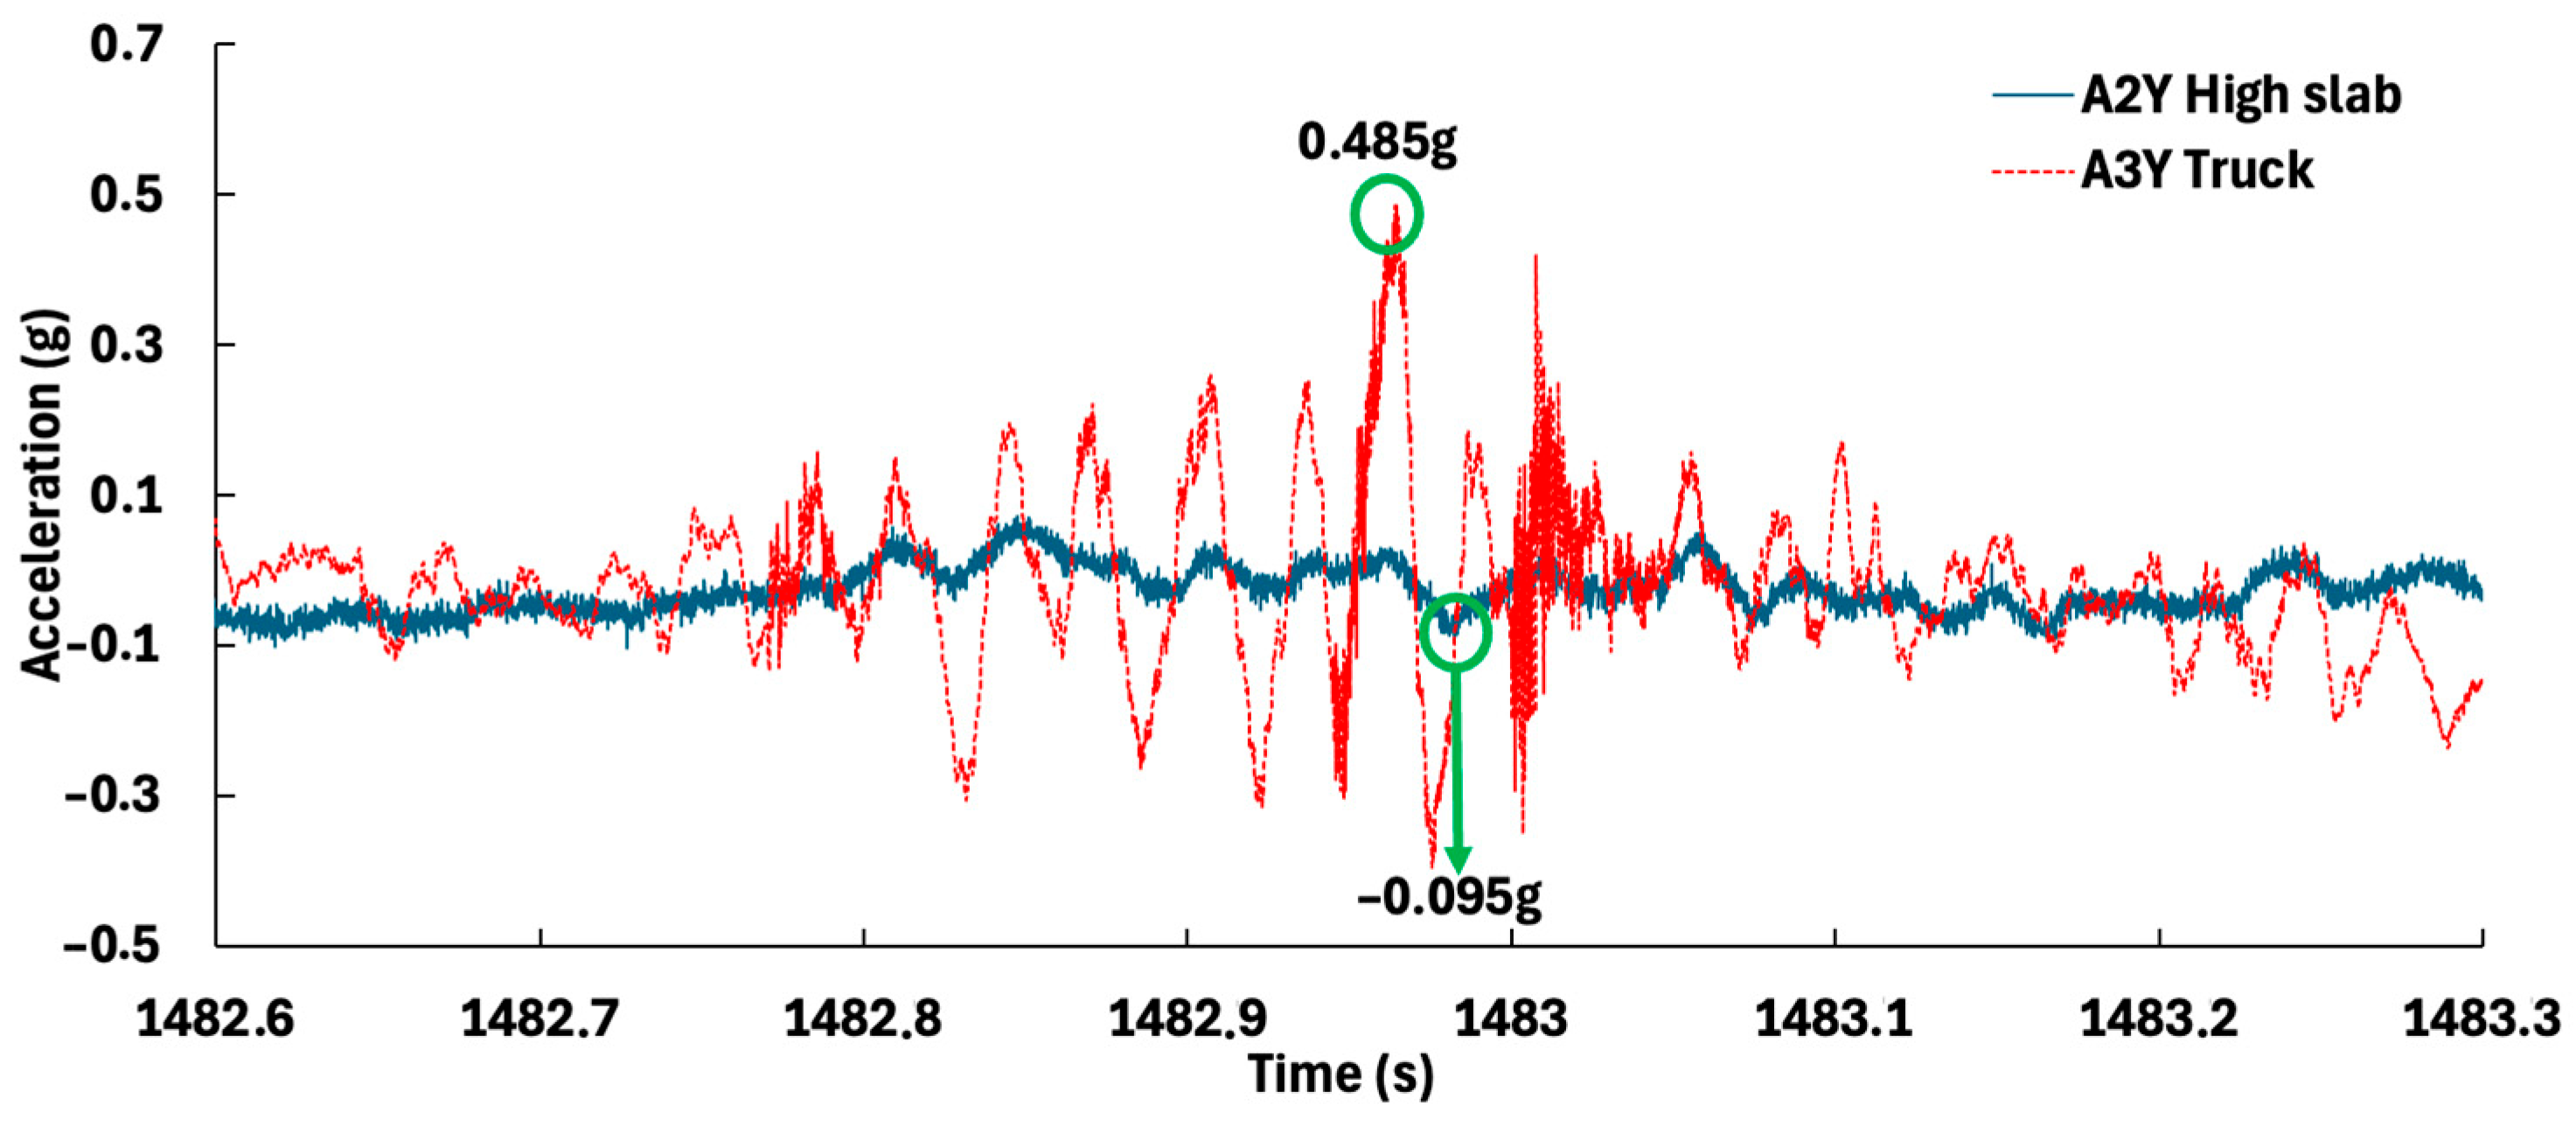
| Y, truck’s movement and | T = 1482.95 s | −0.3056 g | −0.0191 g | 93.7 |
| T = 1482.96 s | 0.4850 g | 0.0120 g | 97.5 | |
| T = 1482.97 s | −0.3776 g | −0.0950 g | 74.8 | |
| T = 1482.99 s | 0.1676 g | 0.0409 g | 75.6 | |
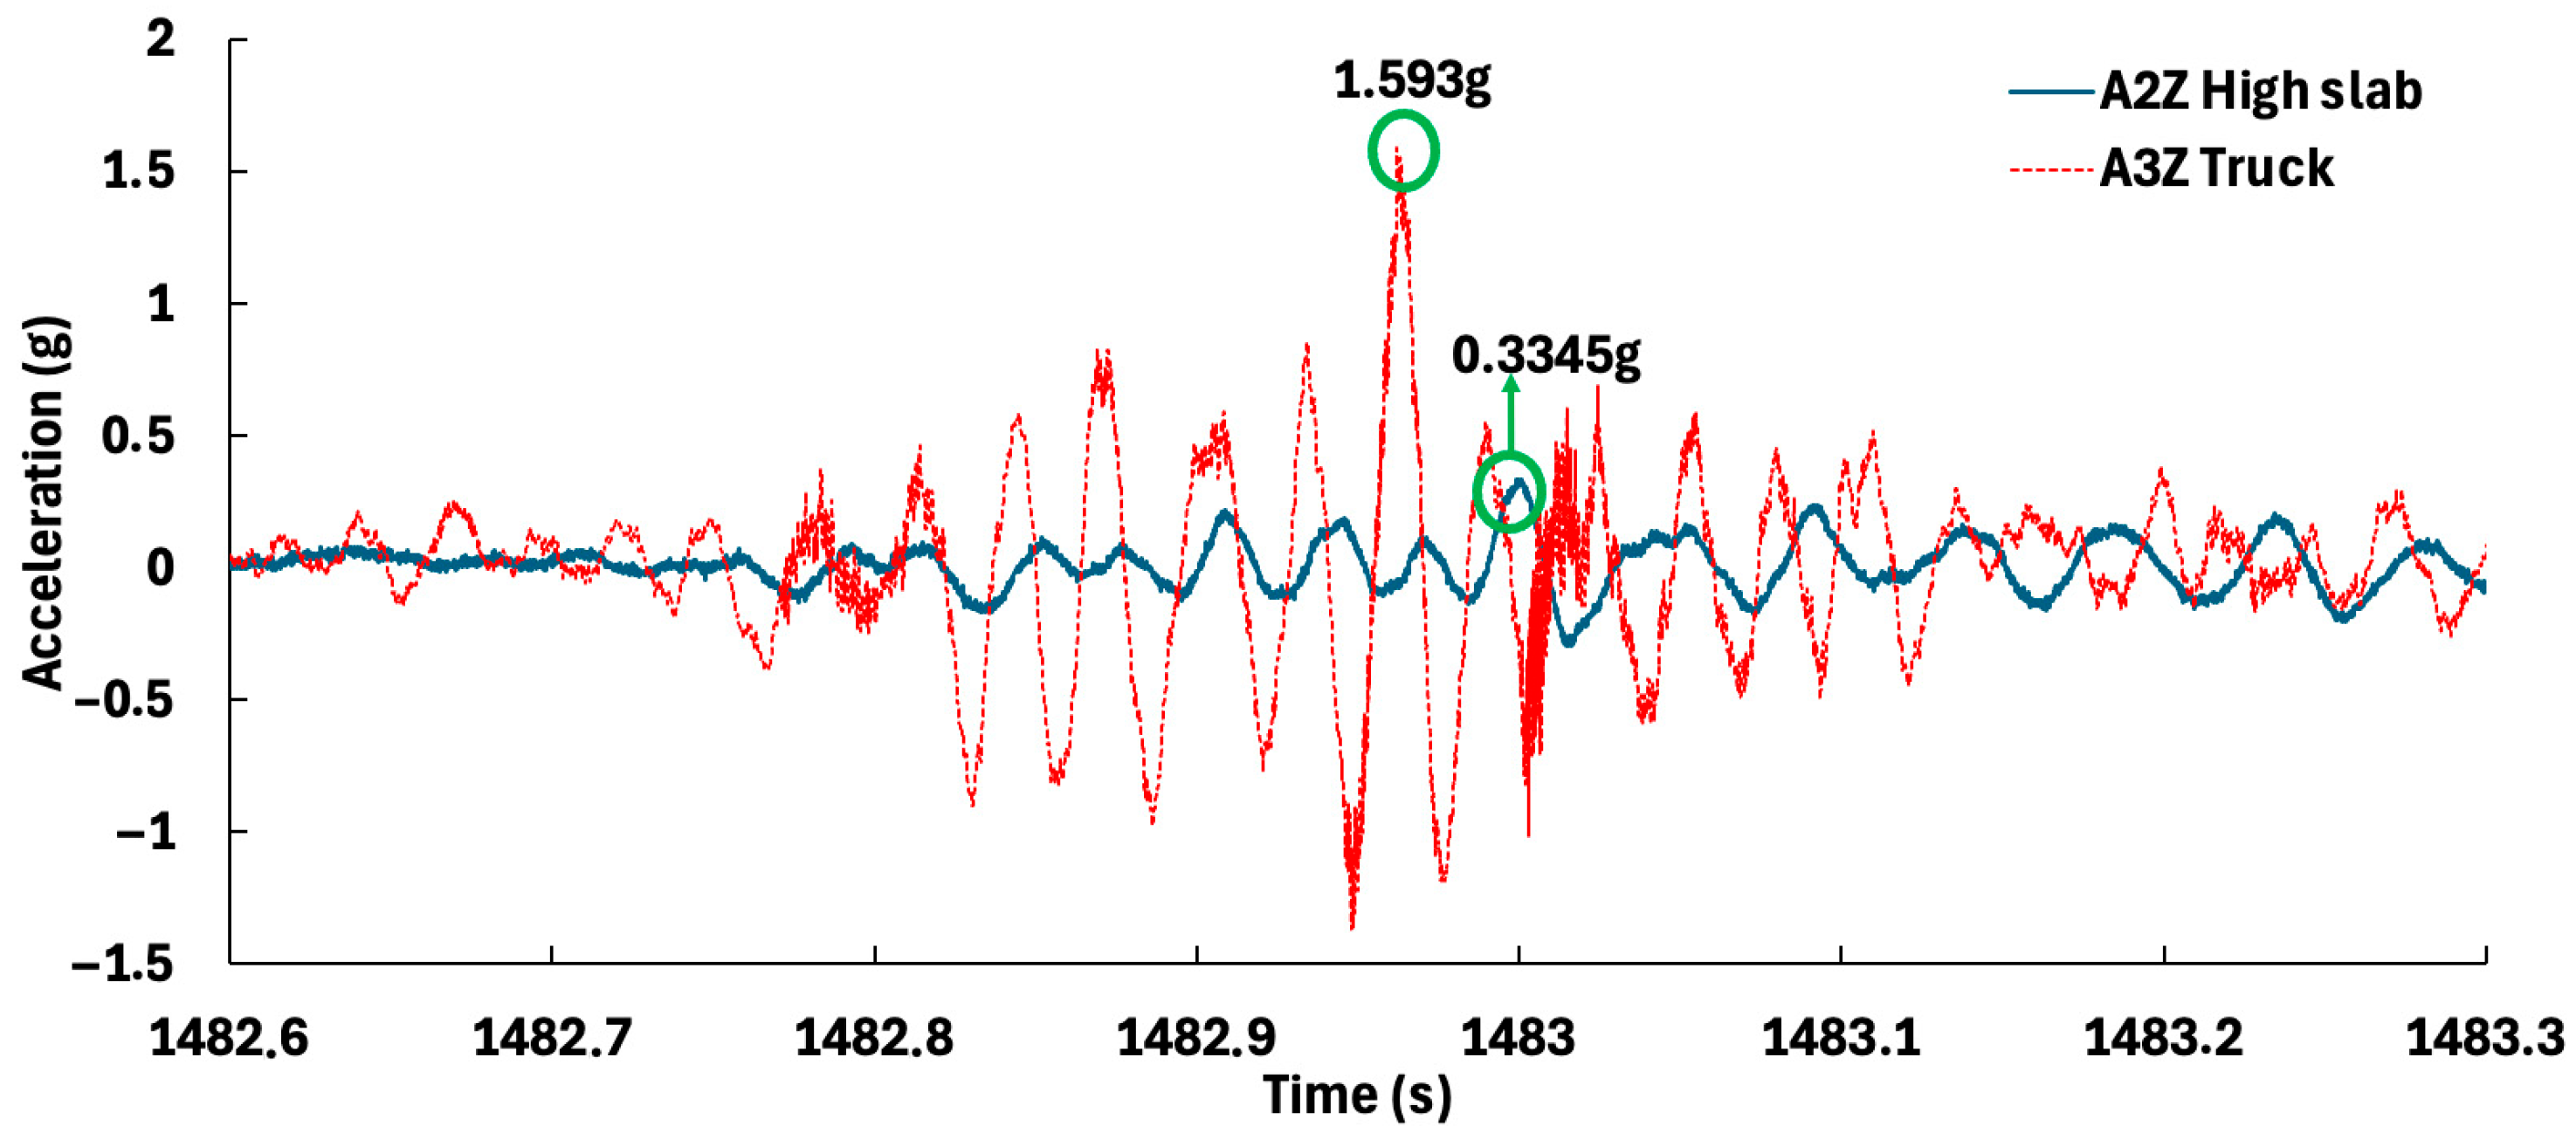
| Z, towards the ground | T = 1482.95 s | −1.3640 g | −0.1282 g | 90.6 |
| T = 1482.96 s | 1.5930 g | 0.0676 g | 95.7 | |
| T = 1482.97 s | −1.1820 g | −0.1360 g | 88.5 | |
| T = 1482.99 s | 0.5272 g | 0.3345 g | 36.5 |
Disclaimer/Publisher’s Note: The statements, opinions and data contained in all publications are solely those of the individual author(s) and contributor(s) and not of MDPI and/or the editor(s). MDPI and/or the editor(s) disclaim responsibility for any injury to people or property resulting from any ideas, methods, instructions or products referred to in the content. |
© 2025 by the authors. Licensee MDPI, Basel, Switzerland. This article is an open access article distributed under the terms and conditions of the Creative Commons Attribution (CC BY) license (https://creativecommons.org/licenses/by/4.0/).
Share and Cite
Sawadogo, S.A.S.L.; Bui, T.-T.; Bennani, A.; Al Galib, D.; Reynaud, P.; Limam, A. 3D Modular Construction Made of Precast SFRC-Stiffened Panels. Infrastructures 2025, 10, 176. https://doi.org/10.3390/infrastructures10070176
Sawadogo SASL, Bui T-T, Bennani A, Al Galib D, Reynaud P, Limam A. 3D Modular Construction Made of Precast SFRC-Stiffened Panels. Infrastructures. 2025; 10(7):176. https://doi.org/10.3390/infrastructures10070176
Chicago/Turabian StyleSawadogo, Sannem Ahmed Salim Landry, Tan-Trung Bui, Abdelkrim Bennani, Dhafar Al Galib, Pascal Reynaud, and Ali Limam. 2025. "3D Modular Construction Made of Precast SFRC-Stiffened Panels" Infrastructures 10, no. 7: 176. https://doi.org/10.3390/infrastructures10070176
APA StyleSawadogo, S. A. S. L., Bui, T.-T., Bennani, A., Al Galib, D., Reynaud, P., & Limam, A. (2025). 3D Modular Construction Made of Precast SFRC-Stiffened Panels. Infrastructures, 10(7), 176. https://doi.org/10.3390/infrastructures10070176