Abstract
The role of last-mile delivery professionals is becoming increasingly vital in modern urban logistics, driven by the rapid expansion of e-commerce and rising consumer expectations for fast and reliable services. This study aimed to analyse the decision-making patterns of last-mile delivery professionals through stated preference data. To achieve this, a stated-preference questionnaire was conducted with 333 riders aged 18–65 from Croatia, Cyprus, Greece, Italy and Slovenia. A random parameter logit (RPL) model was applied to evaluate the influence of factors such as driving behaviour, delivery time and salary type on decision-making in hypothetical scenarios. Results showed that driving behaviour, trip duration and salary type significantly affected respondents’ preferences. Participants displayed a strong preference for flat salaries, indicating the importance of income stability over performance-based pay. Driving behaviour was also crucial, as respondents favoured legal and safe practices. Interestingly, while shorter delivery times were generally preferred, several scenarios revealed a tolerance for longer durations, possibly reflecting perceived benefits such as safer routes or reduced stress. Comparative analyses also revealed regional differences in vehicle use, work patterns and safety perceptions. The study highlights the need for tailored training programs on safety compliance, route optimization and time management, alongside hybrid salary structures balancing stability and productivity.
1. Introduction
The rapid growth of e-commerce and the increasing demand for last-mile delivery services have transformed urban logistics, especially in Europe, where diverse regional dynamics shape the industry [1]. This evolution has introduced new challenges, including road safety risks, operational inefficiencies and the need for specialized training for delivery professionals [2,3]. These challenges are further compounded by differences in infrastructure, traffic conditions and regulatory environments across countries [4].
In Croatia, the delivery industry is characterized by a strong presence of food delivery platforms such as Glovo and Wolt, which primarily operate in urban centers, such as Zagreb, Split and Rijeka. While road safety initiatives have shown progress, motorcyclists and moped riders remain particularly vulnerable, making targeted training programs for these professionals essential. The emphasis on modernizing logistics services further highlights the need for safety and operational efficiency in this growing sector.
Cyprus presents a contrasting scenario with its unique challenges as an island nation. The delivery market is expanding, supported by platforms like Wolt and Foody, but motorcyclist safety remains a critical concern, with fatalities disproportionately high relative to other vehicle types. The Mediterranean climate encourages year-round two-wheeler use, exacerbating risks associated with high traffic density and limited urban road infrastructure. These challenges need to be addressed and tailored training and safety measures are required in order to align with the specific conditions in Cyprus.
In Greece, the delivery industry is deeply influenced by the widespread use of motorcycles and mopeds, supported by platforms like E-food and Wolt. Despite improvements in road safety over the years, the country continues to face elevated crash rates among powered two-wheeler users. Critical factors, such as low helmet use rates and high levels of mobile phone use while driving can directly affect safety risk. With a significant proportion of freelance delivery workers, particular attention should be given on training programs that address these operational challenges, which is crucial for improving safety outcomes.
In Italy, the delivery landscape is characterized by a mix of established postal services, global food delivery platforms and local businesses. The adoption of bicycles, e-bikes and scooters for urban deliveries is notable, driven by sustainability initiatives and dense cityscapes. However, road safety remains a persistent issue, with two-wheeler riders constituting a significant share of traffic fatalities. The regulatory framework in Italy, while progressive, demonstrates the need for a strong integration of training and safety practices tailored to diverse delivery modes.
Lastly, Slovenia stands out for its heavy focus on courier services, distinguishing it from the other countries studied. The delivery industry benefits from a growing reliance on eco-friendly transportation methods, such as e-bikes and light electric vehicles. Despite these advancements, safety concerns persist, particularly for motorcyclists and cyclists, who account for a significant proportion of road traffic incidents. Slovenia’s commitment to sustainable urban mobility underscores the importance of integrating safety training with operational best practices to enhance the delivery sector.
Within the above context, the SaferDeli (https://saferdeli.uniwa.gr, (accessed on 10 November 2025) project aims to address the critical need for enhancing road safety skills among last-mile delivery professionals, including motorcyclists, cyclists and e-scooter riders, by developing a comprehensive and customized vocational training approach. This initiative recognizes the unique risks associated with delivery work, particularly the high vulnerability of powered two-wheeler users and seeks to reduce crash involvement through a combination of physical and digital learning activities.
The objective of this work was to analyse the decision-making patterns of last-mile delivery professionals through stated preference data, providing behavioural insights that can inform the development of more targeted training and safety interventions. To achieve this goal, a stated choice survey was implemented with a sample of 333 participants aged 18–65+ years. This study focused on comparing stated preference data to identify the training needs of last-mile delivery professionals across five countries, namely Croatia, Cyprus, Greece, Italy and Slovenia. These countries were chosen for their unique socio-economic contexts, delivery service ecosystems and varying levels of road safety infrastructure and practices. This comprehensive analysis not only addressed regional disparities but also offered a foundation for harmonized training interventions across Europe.
The structure of this paper is organized as follows. At the beginning, in Section 1, the main objectives are outlined. This is followed by Section 2, which provides a thorough literature review for the contextual understanding of the research problem along with the motivation of the study. Then, Section 3 presents the details of the experimental design and stated preference survey is described. This is followed by Section 4, in which the design and application of the random parameter logit (RPL) model is presented. Moreover, a comparative analysis and the key findings derived from the RPL model are summarised in Section 5. Section 6 explores the implications of the results, addressing key limitations and proposing directions for future research. Finally, Section 7 concludes with the main contributions of this work and proposed some policy implications for training needs.
2. Background
Stated preference data plays a vital role in identifying the key attributes influencing delivery professionals’ decision-making [5] or individuals’ mode choice [6]. In particular, stated preference surveys present respondents with hypothetical scenarios that require trade-offs between factors such as safety practices, delivery efficiency and remuneration, allowing for a structured analysis of their preferences and priorities. This approach provides insights into the factors that significantly influence behavioural choices. For instance, understanding how delivery professionals balance safety compliance with time pressures can inform the design of training programs that address these critical trade-offs [7].
Discrete Choice Models (DCMs) are widely recognized as a powerful tool for analysing preferences through stated preference data [8,9]. These models quantify the probability of individuals selecting one option over another based on the attributes presented in choice scenarios. To date, many researchers have implemented binary logit [10], nested logit [11] or mixed logit [12] techniques in order to explore travellers’ choice behaviour and assess the relative importance of various factors, such as driving behaviour, delivery time and salary type [13].
To begin with, Shen et al. [14] examined the difference between the mixed logit model (MLM) and the latent class model (LCM) for transport mode choice, using preference stated data. These attributes included in-vehicle time, access time, frequency, travel cost and the environmental impact associated with different transport modes. Results indicated that the LCM performed better compared to the MLM applied. In addition, Guo et al. [15] conducted a multi-dimensional mixed logit model with panel effects, using data from a stated choice experiment. It was revealed that job type, salary, co-worker relationships and job environment were significant parameters in the job mobility choice process.
In another study implemented by Henning et al. [16], a binary logistic model was used to investigate the factors that influence the choice of active transport mode on a in Brazil. An online stated preference survey was conducted among students from two neighbouring universities using quota sampling. Participants provided information on their mode of transport to and from campus, place of residence, socioeconomic background as well as trip details. A total of 284 responses were collected, revealing that only 22.5% of trips utilized active transport modes. The key findings demonstrated that travel time, university affiliation, salary and marital status had a significant impact on modal choice. Similarly, Abdel-Aal [17] proposed a framework to determine the value of time through the calibration of disaggregated linear-in parameter utility-based binary logit mode choice model. Travel time and travel cost, along with traveller characteristics, such as car ownership and salary, were chosen as the utility attributes for the basic model formulation. Results demonstrated sensitivity to trip time and salary levels, highlighting their influence on the choice-making process.
An interesting work was conducted by Hardinghaus & Papantoniou [18], in which cyclists’ route preferences were investigated based on a stated preference survey in Greece and Germany. Multinomial mixed logit discrete choice models were developed as part of the statistical analysis to quantify the trade-offs involved while accounting for the preferences of different user groups. The analysis compared user requirements in Greece, a country with a low cycling share and limited bike infrastructure, to those in Germany, where cycling was widely embraced and infrastructure was well-developed. Results revealed that subgroups prioritized infrastructure differently based on their specific needs, with Greek users showing a significantly greater willingness to accept longer travel times in exchange for better-quality facilities. Similarly, Papantoniou et al. [19] investigated the key factors influencing crash severity of professional drivers in last-mile delivery services in Greece. Results demonstrated that delivery experience, driving habits and use of safety equipment significantly influenced crash severity.
Yang et al. [20] proposed two nested logit models and two multinomial logit models based on a stated preference survey. Regarding route choice behaviour when battery electric vehicle drivers require charging, attributes such as charging time and the location of charging stations significantly influenced their decision-making process. The findings indicated that battery electric vehicle drivers tended to prefer routes with charging stations that offered shorter charging times, were closer to their starting point and aligned with their travel direction. In the same context, a nested logit model was utilized to examine commuters’ joint choice behaviour of commuting time and mode by considering factors including trip characteristics, household and socioeconomic factors [21]. The findings indicated that commuters often chose their mode of transportation based on commuting time, with the commuting time-mode model proving more effective in predicting travel choices. Moreover, higher household income was associated with a greater likelihood of commuting by taxi or driving alone, while commuting distance strongly and negatively influenced mode choices such as walking, cycling, taking the bus or using a taxi.
Ding et al. [22] introduced a cross-nested logit model to analyse commuters’ combined decisions regarding travel mode and departure time (peak or off-peak). The analysis utilized revealed preference data from a regional household travel survey. It was found that a $5 increase in car travel costs had a comparable impact on reducing car volumes as a 30% decrease in transit travel time during peak hours, though the latter resulted in only half the increase in transit ridership.
Although Stated Preference (SP) methods are widely used to explore behavioural intentions and the relative importance of different factors in hypothetical decision-making, it is well acknowledged that SP responses may not always align perfectly with actual driving performance [23]. This divergence may arise due to social desirability bias, respondents’ limited ability to anticipate real-time pressure or the absence of contextual factors that typically influence last-mile delivery choices, such as traffic congestion, weather, workload intensity or employer monitoring applications. For this reason, SP findings are often strengthened when interpreted alongside evidence derived from observed data sources, such as Naturalistic Driving Data (NDD), telematics or official crash statistics [24].
In the context of last-mile delivery, existing NDD studies have shown that real-world behaviour is often strongly shaped by operational pressures, tight delivery deadlines and financial incentives, which can increase risky driving performance, such as speeding, harsh acceleration or unsafe manoeuvres [25]. Moreover, crash statistics from various European countries similarly indicate disproportionately high involvement of powered two-wheelers, especially those used for delivery work, in urban crashes, highlighting the need to better understand how safety-related decisions are made in practice [26]. Although such datasets were not available for the purpose of this study, the behavioural patterns identified in the SP experiment can provide a valuable framework for future validation using objective driving records, crash involvement data or company-level telematics. A combination of SP-derived behavioural parameters with observed data would further enhance the robustness and policy relevance of the findings and could support the development of evidence-based training programs tailored to the realities of last-mile delivery work.
The motivation for this study stems from the pressing need to address the safety and operational challenges faced by last-mile delivery professionals in the rapidly evolving urban logistics sector. Through the comparative analysis for the identification of last-mile drivers’ training needs, this research aims to enhance the safety and efficiency of delivery operations while bridging regional disparities in road safety practices and professional development.
3. Data Overview
3.1. Experimental Design
To achieve the objective of this work, which was to identify the key training needs of last-mile delivery professionals, a stated choice survey was carefully designed. The development of this questionnaire aimed to address various aspects of modern food delivery, with particular emphasis on delivery professionals’ riding behaviour and the risky situations they may encounter. In addition, the survey intended to assess the current status of safety equipment provided by companies as well as other factors influencing delivery professionals’ safety. Furthermore, the survey aimed to evaluate the acceptance of a road safety training program for this group of road users and understand their expectations regarding the content and structure of such training.
Data were collected from a sample of 333 participants aged 18–65+ years old from five countries (e.g., Croatia, Cyprus, Greece, Italy and Slovenia), targeting professional riders in last-mile delivery services. The survey was administered online between 5 January 2024 and 5 May 2024 while the completion time was designed to be between 5 and 10 min to ensure practicality. It should be clearly mentioned that the questionnaire was conducted anonymously and all data collected were used exclusively for research purposes, adhering to strict confidentiality, ethical standards and General Data Protection Regulation (GDPR) guidelines.
3.2. Stated Preference Survey
The stated preference survey consisted of six sections, each designed to capture distinct aspects of delivery professionals’ work environment, habits and safety aspects. These sections collectively provided a comprehensive understanding of the participants’ professional experiences, safety perceptions and preferences for training interventions.
Firstly, Section 1 referred to the delivery riding experience and participants’ habits. It collected data on their employment type (freelancer or employee), the transport mode used for deliveries (e.g., e-scooter, bicycle or motorcycle), vehicle ownership and maintenance responsibility as well as the availability of safety equipment. Additionally, it explored their career duration in the delivery field and possession of a valid license for their specific transport mode.
Secondly, Section 2 focused on the travel characteristics of delivery professionals, including their work environment (urban or rural), daily working hours, distances travelled and idle times. This section also examined the frequency and purpose of phone usage during deliveries, addressing aspects like navigation, delivery apps or personal calls.
Moreover, Section 3 explored road safety experiences and perceptions. It gathered information about road crashes experienced in the past two years, ranging from minor material damage to more severe injuries. The section also investigated participants’ feelings of danger during deliveries, their engagement in risky manoeuvres and their use of safety equipment. It further assessed perceived risks from various factors like fatigue, distraction and infrastructure quality.
Section 4 addressed road safety training, evaluating participants’ interest in online self-paced training programs and their preferences for content and format. It explored the perceived importance of both theoretical and practical training, with specific topics such as traffic rules, safe manoeuvres and first aid. Participants were also asked about their views on making such training mandatory.
In Section 5, a stated choice questionnaire was implemented in order to analyse decision-making in hypothetical delivery scenarios. Participants were asked to choose between two options in each of five hypothetical scenarios. Each option was defined by three key parameters: driving behaviour, trip time and salary type. Driving behaviour was categorized as either legal or illegal (coded as a binary variable where 1 represented legal and 0 represented illegal driving behaviour), with illegal behaviour involving actions such as making dangerous manoeuvres, increased speed, violating traffic signs or running red lights. Trip time varied between 5, 10, 15 and 20 min, indicating different levels of delivery efficiency. Salary type was presented as either a flat salary, offering income stability or a dynamic salary based on the number of deliveries completed (a categorical variable coded as 1 for a flat salary and 0 for a performance-based salary), reflecting performance-based remuneration. The choice variable was binary, indicating whether the respondent selected the given option (1 if chosen, 0 otherwise).
It is worth noting that although the full factorial combination of the three attributes (i.e., driver behaviour, trip time and salary type) would yield sixteen potential scenarios, administering all to respondents would create excessive cognitive load and risk survey fatigue. In order to balance behavioural realism with statistical efficiency, a reduced set of scenarios based on an efficient experimental design was adopted. Five scenarios were selected to ensure adequate variation across attributes while minimizing respondent burden, in line with established best practices in SP experimental design.
The parameters were systematically varied across the scenarios to explore their influence on the respondents’ preferences, as shown in Table 1.

Table 1.
Parameters defining options in different delivery scenarios.
Lastly, Section 6 collected demographic information, including participants’ age, gender, nationality and education level. It also captured job-related details, such as income range, work status (part-time or full-time) and perceived advantages of delivery jobs, including flexible hours and outdoor work opportunities.
4. Methodology
The use of Stated Preference (SP) data in this study is particularly appropriate because it allows controlled variation in key attributes that influence delivery professionals’ choices, such as driving behaviour, trip duration and salary type. Unlike revealed preference data, which reflect only existing conditions, SP techniques enable the systematic exploration of hypothetical scenarios that may not yet occur in real conditions but are highly relevant for understanding behavioural patterns [27]. This approach is especially valuable in last-mile delivery riders, where operational pressure, safety considerations and remuneration structures interact in complex ways [28]. Through the use of carefully designed choices and hypothetical scenarios, SP data make it possible to isolate the marginal effects of each attribute on decision-making.
A Discrete Choice Model (DCM) explains the selection process of a decision-maker among various available options, such as competitive products, behaviours or procedures. DCM is extensively used in transportation studies [29,30,31], consumer choice analysis [32] and marketing [33]. In transportation, these models are particularly valuable for mode choice modelling, where the alternatives (e.g., car, bike, public transport) are influenced by travel time, cost or other parameters [34,35].
DCMs are categorized into three main groups, with the first being the logit family of models [10]. The logit model is among the simplest and most commonly used approaches within discrete choice modelling. This group includes the simple binary logit model, the nested binary logit model and the Multinomial Logit Model (MNL). The simple binary logit model is applied when individuals are faced with exactly two discrete choices. In contrast, the multinomial logit model is used when there are more than two alternatives to choose from. The nested binary logit model, while primarily designed for two discrete choices, allows for one or both options to include subsets of additional choices.
To analyse the stated preference data and capture the behavioural complexity inherent in last-mile delivery riders’ decisions, the Random Parameter Logit (RPL), also known as the Mixed Logit model, was employed [36]. Mixed Logit models extend the standard binary logit formulation by allowing selected parameters to vary randomly across individuals. This provides a flexible econometric framework capable of representing unobserved heterogeneity in preferences, which constitutes an important consideration in this study, given that last-mile delivery riders may differ substantially in their attitudes toward driving behaviour, time pressure and salary type.
Depending on the chosen specification, RPL models can incorporate heterogeneity in the mean, variance or both, offering a flexible structure for modelling behavioural differences across respondents. These methodological extensions are well documented in the discrete-choice literature [37,38] and have been widely applied in transportation safety and crash-severity research. Several recent empirical studies in crash-severity and safety research have increasingly employed random-parameter (mixed) discrete choice models to properly capture unobserved heterogeneity across observations. For instance, Mannering et al. [39] applied an RPL model on expressway crash data and demonstrated that random-parameter estimation improves fit and uncovers variability in how crash-related factors affect severity across cases.
In a similar study, a random-parameter discrete choice modelling approach was also implemented to analyse crash-severity outcomes, allowing key factors to vary across crashes and thus capturing unobserved heterogeneity in driver and roadway characteristics [40]. Another work employed a mixed (random-parameter) logit framework to investigate injury-severity levels in traffic crashes, accounting for variability in the effects of contributing factors across individual crash events [41]. The model successfully identified significant heterogeneity in how roadway, vehicle and behavioural factors influence severity, confirming the value of random-parameter methods in safety analysis. The present study adopts a RPL model to appropriately account for unobserved heterogeneity and to obtain a more behaviourally realistic representation of last-mile delivery workers’ preferences.
Like all discrete choice models, the RPL model is grounded in the principle of utility maximisation, where each respondent is assumed to choose the alternative that provides the highest perceived utility [42,43]. For each individual and alternative , the utility is expressed as:
where is the utility function, is the observable portion of the utility and is the random portion of the utility.
In contrast to the standard logit model, the RPL specification allows the coefficients associated with one or more attributes to vary across individuals:
where β is the population mean of the coefficient and is an individual-specific deviation, typically assumed to follow a normal distribution. This structure allows the model to account for preference heterogeneity that cannot be explained by observed variables alone.
The probability that individual i chooses alternative j is then expressed as an integral of the standard logit probability over the distribution of random parameters:
where f(β∣θ) is the density function of the random parameters with parameters θ (e.g., mean and standard deviation).
The deterministic utility consists of one or more describing variables , with corresponding coefficients and an alternative specific constant that considers the average utility effect of non-included variables:
where is an alternative-specific constant and are the observed attributes describing each delivery option (e.g., driving behaviour, trip time, salary type). Allowing selected coefficients to be random enables the model to reflect individual-level differences in risk perception, time sensitivity and remuneration preferences, factors known to vary substantially in last-mile delivery riders.
The performance of the random parameter logit (RPL) model was evaluated using standard goodness-of-fit metrics, including log-likelihood values, McFadden’s pseudo R2 and the likelihood ratio test. The log-likelihood value reflects the ability of the model to explain the observed data, while McFadden’s pseudo R2 provides a measure of the explanatory power of the model relative to a null model. In particular, McFadden’s pseudo-R2 was computed to assess the explanatory power of the binary logit model. It is defined as:
where is the log-likelihood of the fitted model and l is the log-likelihood of a model containing only an intercept. Higher values indicate improved model fit, with values between 0.2 and 0.4 typically considered acceptable for discrete choice models.
The likelihood ratio test assesses the overall significance of the model by comparing it to a baseline model, determining whether the inclusion of the predictor variables significantly improves the model fit to the data. In addition to the likelihood ratio test, the Akaike Information Criterion (AIC) and Bayesian Information Criterion (BIC) were also examined to evaluate model performance. Lower values of AIC and BIC indicated that the Random Parameter Logit model achieved a superior balance between explanatory power and model complexity when compared to simpler specifications.
5. Results
In this section, a comparative analysis of stated preference data collected across five countries (i.e., Slovenia, Croatia, Cyprus, Greece and Italy) was presented. An attempt was made to highlight common trends and country-specific differences in the professional profiles and training needs of last-mile delivery workers. Then, the results of the binary logit discrete choice model were described.
5.1. Comparative Analysis
To begin with, data revealed notable differences in the type of delivery companies that employed respondents across countries. In four countries (i.e., Croatia, Cyprus, Greece and Italy), the majority of respondents worked for food delivery companies, accounting for 48% of the total responses. On the other hand, Slovenia showed an overwhelming 77% of respondents riding for courier services. With regard to employment contract, in Croatia, Cyprus and Slovenia, the majority of respondents were directly employed by delivery companies, while Greece and Italy demonstrated a higher prevalence of freelancers. When comparing the types of vehicles used across all countries, mopeds (50–150 cc) appeared to play the most significant role, followed by e-bikes and conventional bicycles.
As per riding experience, the data showed that most respondents had more than 5 years of experience (44% of total respondents), while a significant portion reported 1 to 3 years of experience (25%). Moreover, Slovenian riders accounted for a disproportionately large share of those with more than 5 years of experience, representing 72% of this group. Despite Slovenia’s outlier status, other countries also reported notable proportions of riders with great riding delivery experience. For instance, 40% of respondents in Greece also reported having more than 5 years of experience. Figure 1 provides an overview of the distribution of the riding delivery experience per country.
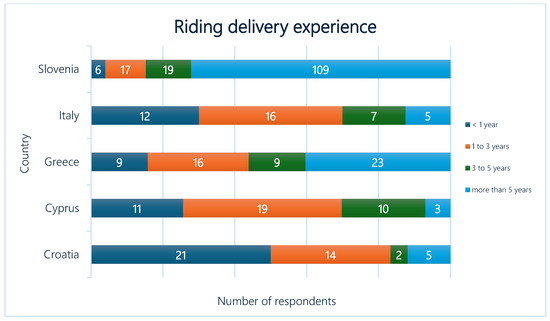
Figure 1.
Riding delivery experience per country.
Figure 2 highlights significant variations in the average hours spent riding deliveries across countries. In Slovenia, the majority of respondents (87%) reported working 4–8 h per day, far exceeding other countries in this category, indicating a highly consistent work pattern. Conversely, in other countries, such as Greece and Italy, the distribution was more evenly spread, with remarkable proportions working both 4–8 h and 8–12 h per day. Furthermore, only a small number of respondents (2%) in any country reported working more than 12 h per day.
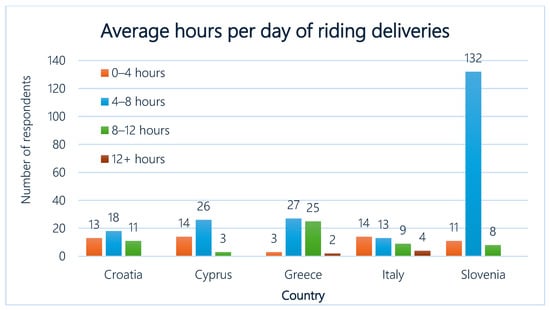
Figure 2.
Average hours per day of riding deliveries per country.
Figure 3 presents the differences in the average kilometres travelled per day to make deliveries per country. In particular, a majority of respondents (52%) reported travelling 20–50 km/day in Slovenia, with a notable 24% exceeding 50 km/day, indicating longer delivery routes. In contrast, in Greece, most respondents (77%) travelled more than 50 km/day, reflecting much longer daily delivery distances. Similarly, in Cyprus, a large portion (72%) reported travelling 20–50 km/day, suggesting medium-range delivery patterns, while in Italy, the distribution of distances was relatively balanced, with respondents travelling across all distance categories, indicating a mix of both short-range and long-range delivery routes.
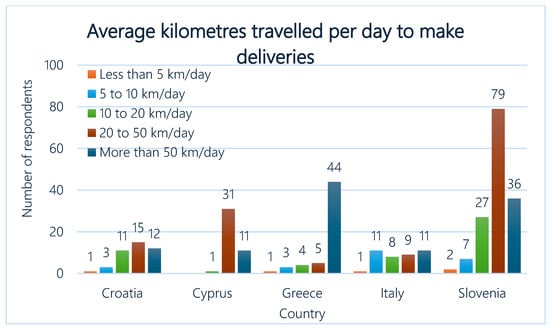
Figure 3.
Average kilometres travelled per day to make deliveries per country.
Regarding the use of mobile phones during delivery rides, many drivers claimed that they frequently used their mobile phone, primarily to check the company app or navigate to their destination. More specifically, in Slovenia, only 19% of respondents mentioned that they were not relying on their phone throughout the day, with 28% stating they used them almost constantly and 38% using them very regularly. Similarly, in Cyprus, 84% of respondents stated high dependency on their mobile phone, with a considerable portion checking them constantly or very frequently. In contrast, in Croatia and Italy, fewer drivers reported such high levels of mobile phone usage, with more respondents indicating moderate or occasional use. For instance, in Croatia, 21% of drivers used their phone occasionally and 29% stated they rarely checked them during deliveries. Figure 4 illustrates the frequency of mobile phone use during the delivery time per country.
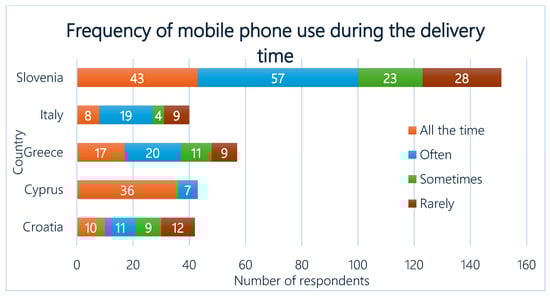
Figure 4.
Frequency of mobile phone use during the delivery time per country.
Some of the most noteworthy results are presented in Figure 5 and Figure 6 with regard to road safety. While most respondents reported no crashes over the past two years, remarkable trends emerged. In Slovenia, 74% reported no crashes, but 25% experienced 1–2 crashes, the highest proportion among all countries. Similarly, in Greece, 40% of respondents claimed that they had 1–2 crashes over the last 2 years. Interestingly, Italy showed moderate rates, with 63% reporting no crashes, but 25% involved in 1–2 crashes and 13% in 3–5 crashes. In contrast, Cyprus and Croatia reported the lowest crash rates, with over 79% in each country reporting no incidents. Figure 5 reveals key insights into road crashes (with material damage only) among delivery riders.
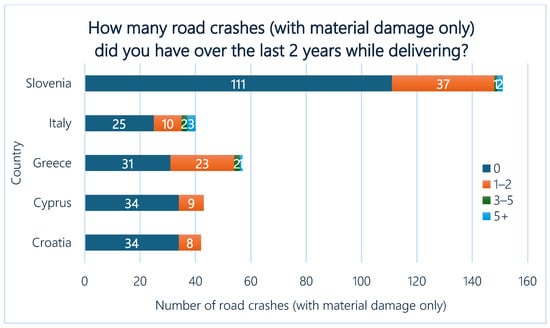
Figure 5.
Participation in road crashes (with material damage only) over the last 2 years.
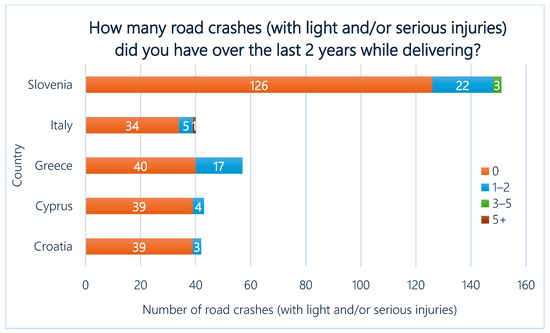
Figure 6.
Participation in road crashes (with slight and/or serious injuries) over the last 2 years.
Figure 6 provides key insights into road crashes involving slight and/or serious injuries among delivery riders. In Slovenia, 15% of respondents reported experiencing 1–2 crashes over the last two years, while 2% reported 3–5 crashes. Moreover, Greece followed with 30% of respondents indicating 1–2 crashes, while the majority (70%) claimed no incidents. At the same time, Italy showed lower rates of slight or serious injury-related crashes, with 85% stating no incidents and only 13% experiencing 1–2 crashes. Similarly, Cyprus and Croatia reported the lowest levels of involvement, with over 90% in both countries reporting no crashes and only small proportions experiencing 1–2 crashes.
Although respondents reported relatively low involvement in road crashes, many indicated feeling in danger during deliveries, with a significant number stating they feel this way sometimes or very often. For example, in Slovenia, 43% of respondents reported feeling in danger sometimes, while 13% felt this way very often. Similarly, in Greece, 33% of respondents stated they felt in danger every time they are riding while 28% felt this way. In Italy, 48% of respondents reported feeling in danger sometimes and in Croatia, 36% felt this way sometimes. Figure 7 presents key insights into delivery riders’ perceptions of danger during their work.
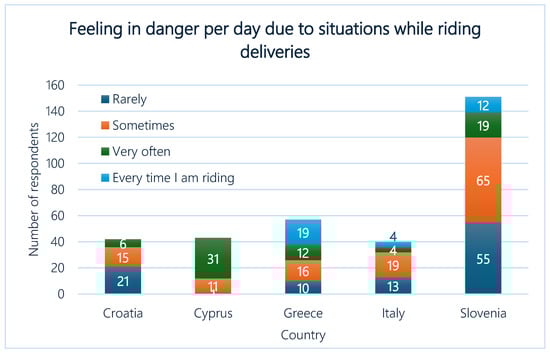
Figure 7.
Feeling in danger while riding per country.
Concerning performing illegal manoeuvres to save time, stated preference data shown that most respondents admitted to doing so rarely or sometimes, with Slovenia having the highest proportion (62% reported doing so rarely, while 25% admitted to doing so sometimes). In Greece and Croatia, 42% and 38% of respondents, respectively, reported performing such manoeuvres rarely. Figure 8 compares the frequency of performing illegal manoeuvres while riding per country, as reported by the respondents.
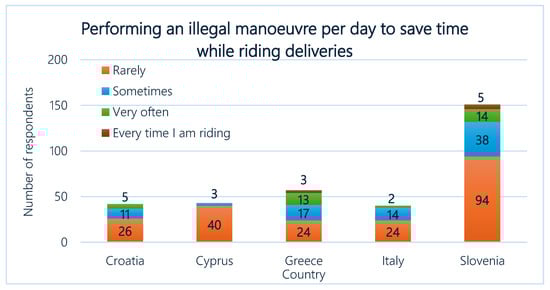
Figure 8.
Frequency of performing of an illegal manoeuvre while riding per country.
Figure 9 highlights the acceptance of online self-paced road safety training among delivery professionals along with their intention to participate voluntarily. Overall, the response was positive across all countries, with the majority of respondents indicating that such a course would be helpful. More specifically, in Greece, 77% of respondents found the training useful, followed by 67% in Croatia and 56% in Cyprus. Italy and Slovenia showed slightly lower acceptance, with 55% and 54% of respondents, respectively, agreeing on the usefulness of the training. When asked about their participation in such training if proposed by their company, the response was also generally positive. Greece reported the highest intention, with 72% of respondents willing to attend, followed by Slovenia (64%) and Croatia (60%). Italy showed moderate willingness at 55%, while Cyprus had the lowest rate, with only 21% of respondents expressing interest in voluntary participation.
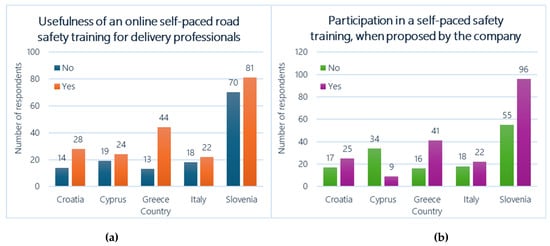
Figure 9.
(a) Utility of self-paced safety training and (b) voluntary participation per country.
In a similar question, responses indicated that a training program with a strong emphasis on practical elements would be widely accepted. A significant proportion of respondents preferred either a 30% theory and 70% practice split or a balanced 50% theory and 50% practice approach, as shown in Figure 10. Moreover, participants highlighted a particular interest in addressing key topics such as safe and unsafe manoeuvres and existing traffic rules. Additionally, in Greece and Slovenia, there was a notable demand for including first aid training as an integral part of the program.
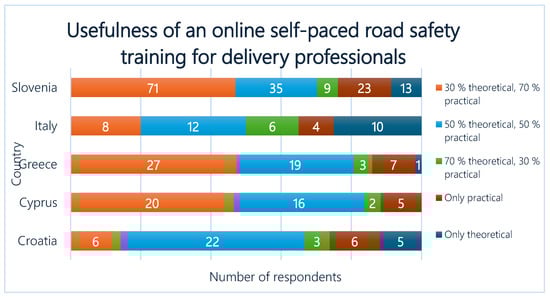
Figure 10.
Percentage of theory and practice needed in the training per country.
Table 2 presents the respondents’ socioeconomic characteristics and their crash experience.
Table 2.
Demographics characteristics of respondents.
Based on Table 2, it was revealed that the majority of respondents belonged to the 26–35 age group (26%), followed by the 36–45 (23%) and 46–55 (22%) age groups. Younger respondents (18–25) made up 20%, while those aged 56–65+ represented 9%. Regarding education level, the majority of respondents (63%) had completed secondary education. A smaller proportion held a bachelor’s degree or similar (15%) and only 4% possessed a master’s degree or higher. A small proportion (2%) reported having no education, while 16% had completed only primary education. In terms of employment status, most respondents (78%) worked full-time, while 22% were in part-time roles. Income distribution indicated that half of the respondents (50%) earned between EUR 1000–1500 per month, while 29% earned EUR 500–1000 and 12% received monthly less than EUR 500. A minority (9%) reported earning over EUR 1500 per month.
Table 3 provides the respondents’ choices across different scenarios and options. Overall, the frequencies of alternatives chosen across all scenarios were as follows: 73% for Option 1 and 27% for Option 2 which indicates a strong overall preference for the first option. Firstly, in the first scenario, 76% of respondents chose Option 1, which involved legal driving behaviour, a longer trip time (15 min) and a flat salary, while 24% selected Option 2, characterized by illegal driving behaviour, a shorter trip time (5 min) and a salary based on deliveries. Additionally, in the second scenario, 74% of respondents favoured Option 1, which involved legal driving behaviour, a moderate trip time (10 min) and a flat salary, while 26% chose Option 2, characterized by illegal driving behaviour, a shorter trip time (5 min) and a salary based on deliveries.
Table 3.
Respondents’ choices across different scenarios and options.
In the third scenario, 67% of respondents selected Option 1, which involved legal driving behaviour, a longer trip time (15 min) and a salary based on deliveries, while 33% chose Option 2, which also involved illegal driving behaviour, a shorter trip time (5 min) and the same salary based on deliveries. Moving on to the fourth scenario, 77% of respondents chose Option 1, which involved legal driving behaviour, a longer trip time (20 min) and a flat salary, while 23% selected Option 2, characterized by illegal driving behaviour, a shorter trip time (5 min) and a flat salary. Lastly, in the fifth scenario, 71% of respondents favoured Option 1, which involved illegal driving behaviour, a moderate trip time (10 min) and a flat salary, while 29% selected Option 2, which also involved illegal driving behaviour, a longer trip time (15 min) and a salary based on deliveries.
5.2. Random Parameter Logit (RPL) Model
In order to analyse the stated preference data, the random parameter logit (RPL) model was selected as the most appropriate method for examining the choices made by respondents. This modelling framework is well-suited for discrete choice data in which individuals evaluate multiple alternatives defined by varying attribute levels. In the present study, respondents were presented with five hypothetical delivery scenarios, each consisting of two alternatives characterised by distinct combinations of driving behaviour, trip time and salary type. Unlike a standard binary logit model, the RPL specification allows the coefficients of key attributes to vary across individuals rather than assuming homogeneous preferences. This flexibility enables the model to capture unobserved behavioural heterogeneity, an important consideration in last-mile delivery riders, where riders’ attitudes toward risk, time pressure and salary may differ substantially. The RPL model therefore provides a more behaviourally realistic representation of decision-making, improving the explanatory power and policy relevance of the analysis.
The results of the RPL model provided detailed insights into the behavioural factors influencing respondents’ choices across the stated preference scenarios. To begin with, the coefficient for driving behaviour (1.042, p = 0.014) was statistically significant and positive, suggesting that legal driving behaviour increases the likelihood of selecting an option compared to illegal driving behaviour (0 coded as illegal, while 1 coded as legal driving behaviour). This may be probably due to the fact that respondents prefer safer driving practices when making their choices.
The coefficient for trip time (0.130, p < 0.001) was positive and highly significant, showing that alternatives with longer trip times were more likely to be selected. This counterintuitive effect may reflect the structure of the scenarios, where longer times were often associated with safer driving or more favourable remuneration conditions, thereby making them more attractive overall. The salary type coefficient (1.569, p = 0.001) was also positive and statistically significant, indicating a strong preference for flat salary arrangements compared to performance-based remuneration (0 = performance-based; 1 = flat salary). This result highlights the importance of income stability and predictability for last-mile delivery riders, who often operate under uncertain and fluctuating compensation schemes.
The standard deviation (SD) estimates of the random parameters also revealed substantial heterogeneity in preferences. The SD for driving behaviour (SD = 2.457, p < 0.001) and salary type (SD = 1.707, p < 0.001) were both highly significant, indicating that respondents differ widely in how they value safe driving and remuneration schemes. It should be noted that the standard deviation for trip time (SD = 0.001) was not significant, suggesting more homogeneous sensitivity to time across individuals.
Table 4 reports the estimation results of the RPL model applied, including both the mean and the standard deviation (SD) of each random parameter. The mean coefficients reflect the average effect of each attribute across respondents, while the SD terms capture the extent of unobserved heterogeneity in individual preferences.
Table 4.
Estimation results of the RPL applied.
In order to compare the five European countries and examine whether preferences differ across national regions, interaction terms between the main attributes and the country dummy variables were included in the RPL model. These interaction effects revealed an additional layer of heterogeneity that would not be captured by the main effects alone. For driving behaviour, positive and statistically significant coefficients were observed for Slovenia (1.640, p = 0.004), indicating that Slovenian respondents assigned a higher utility to legal driving compared to the reference (baseline) category (i.e., Croatia). This suggests that safety-oriented or rule-compliant behaviour may be more strongly valued within the Slovenian delivery workforce. Similarly, salary preferences also varied by country. For example, the interaction term for salary type in Slovenia was positive and significant (1.019, p = 0.039), implying a stronger preference for flat salary arrangements among Slovenian riders. By contrast, the interaction effects for the remaining countries were smaller in magnitude and largely insignificant, indicating more modest deviations from the baseline (Croatia).
The performance of the model was evaluated using goodness-of-fit metrics. The model achieved a log-likelihood value of −790.75 and a McFadden R2 of 0.657, which represents an excellent level of explanatory power for a discrete choice model. Values of McFadden R2 above 0.4 are generally considered indicative of a well-fitting model and the substantially higher value obtained demonstrated the strong predictive capability of the RPL model [44]. This confirms that driving behaviour, delivery time and salary type strongly influence the decision-making process of last-mile delivery riders. In addition, model adequacy was assessed using the AIC = 1609.50 and BIC = 1685.34. Lower values of these criteria relative to simpler model specifications indicate that the RPL model achieved a superior balance between explanatory power and model complexity.
6. Discussion
The results highlighted notable regional differences in the delivery industry. To begin with, food delivery services dominated in Croatia, Cyprus, Greece and Italy, while Slovenia exhibited a strong focus on courier services. This high contrast suggested that the delivery industry in Slovenia was heavily focused on parcel and logistics deliveries, while food delivery dominated in the other countries. Employment contracts also varied, with direct employment more common in Croatia, Cyprus and Slovenia, while freelance work was prevalent in Greece and Italy. These results indicated differences in labour market dynamics and employment structure, which likely impacted the training needs and stability of delivery professionals in these regions.
With regard to work patterns, mopeds emerged as the primary mode of transport across countries, supplemented by e-bikes and bicycles. A significant portion of delivery riders had substantial riding experience, particularly in Slovenia and Greece. This highlighted the presence of a significant number of seasoned professionals in the industry across certain regions, whose needs may differ from less experienced riders. Interestingly, work hours showed regional consistency in Slovenia, where most respondents worked moderate shifts, compared to the varied patterns observed in other countries, indicating diverse operational demands.
It is worth noting that safety concerns surfaced prominently, with Slovenia and Greece reporting higher crash rates compared to other regions. Even among those not involved in crashes, many riders frequently perceived danger during their work. These findings highlighted a concerning level of road safety incidents among delivery riders in Slovenia and Greece compared to other countries. A persistent gap between the operational environment and the safety expectations of delivery professionals was also observed.
Behavioural trends also revealed occasional engagement in risky practices, such as illegal manoeuvres, driven by time pressures. These behaviours, while not widespread, reflected the operational challenges faced by delivery professionals. The findings further underscored widespread support for road safety training, with respondents favouring programs that balance theoretical and practical components. Topics, such as safe manoeuvring, adherence to traffic regulations and first aid training were highly valued, indicating a clear demand for comprehensive safety education. However, voluntary participation in such programs varied across regions, with some countries showing stronger engagement than others, pointing to cultural and systemic factors influencing willingness to adopt safety initiatives. More specifically, results indicated broad support for road safety training initiatives, with Greece and Croatia showing particularly strong engagement compared to other countries. These findings suggested that while there is broad support for road safety training, the level of voluntary engagement varies significantly across countries, with Greece, Slovenia and Croatia showing the highest levels of commitment.
Overall, the comparative analysis highlighted the complex interplay among operational demands, safety considerations and training needs of professional last-mile drivers. Thus, particular emphasis should be given to the importance of tailored interventions that address regional dynamics, prioritize safety and align with the preferences and expectations of delivery professionals.
With regard to the stated preference survey, interesting findings were revealed. In particular, in the first scenario, the strong preference for Option 1 suggested that respondents placed significant value on safety and compliance (legal driving behaviour) and the stability of a flat salary. Despite the longer trip time associated with this option, respondents appeared willing to trade off time efficiency for the perceived security and predictability of the payment structure. This finding highlighted the importance of safety and stable income over operational efficiency for most respondents. Similarly, in the second scenario, the results reflected a similar trend to Scenario 1, with a majority favouring legal driving and a flat salary. However, the slightly lower preference for Option 1 in this scenario suggested that as trip time decreased, some respondents were more inclined to prioritize efficiency and select Option 2. This shift indicated that shorter trip times might have begun to appeal to a minority of respondents, despite the risks associated with illegal driving behaviour.
In the third scenario, the preference for Option 1 decreased compared to previous scenarios, potentially due to the absence of a flat salary option. The reliance on a performance-based pay structure in both options likely shifted some respondents toward Option 2, where the shorter trip time provided a higher advantage. In the fourth scenario, the strong preference for Option 1 underscored the continued importance of legal driving behaviour and flat salary type. Despite the substantial increase in trip time (20 min), respondents overwhelmingly chose the safer and more compliant option, emphasizing that legal driving behaviour outweighed the potential time-saving benefits of illegal driving. Lastly, in the 5th scenario, the absence of legal driving as an option led to a split driven primarily by trip time and salary type. The preference for Option 1 suggested that respondents prioritized shorter trip times and flat salaries when forced to choose between two options with illegal driving behaviour.
The analysis employed a Random Parameter Logit (RPL) model to examine the factors shaping last-mile delivery professionals’ choices when evaluating hypothetical delivery scenarios. The model captured substantial unobserved heterogeneity in risk attitudes, time sensitivity and salary preferences. The findings highlighted the complex interplay between safety considerations, efficiency pressures and economic stability in driving respondents’ preferences.
Driving behaviour emerged as a significant determinant of choice, with the positive mean coefficient indicating that, on average, respondents preferred delivery options involving legal driving practices. This preference suggested an underlying recognition of the importance of safety and compliance. However, the large and statistically significant standard deviation associated with this parameter demonstrates marked heterogeneity across the sample. While many riders valued legal driving, others were more willing to accept riskier or marginally unsafe manoeuvres, potentially reflecting the influence of delivery pressure, tight deadlines or job insecurity. This heterogeneity underscored the need for targeted safety interventions that address the specific motivations and constraints of diverse rider groups.
Trip time also exhibited a positive and significant effect, implying that respondents sometimes favoured options associated with longer travel durations. Although counterintuitive, this finding may indicate that longer trips were perceived as safer, less stressful or associated with more favourable working conditions in the presented scenarios. It suggests that delivery professionals may not always prioritise speed over other job attributes, an insight that could inform the design of more balanced route-planning and scheduling policies.
Salary type played a particularly prominent role in shaping preferences. The strong positive coefficient for flat salary arrangements indicates that respondents favoured income stability over the variability inherent in performance-based pay. This pattern aligns with broader evidence of the financial precarity faced by gig-economy and platform workers. The significant random heterogeneity in this parameter further revealed that, while income stability is important for most riders, sensitivities to remuneration schemes vary considerably across individuals and countries.
Country-specific interaction effects provided additional insights into how national context shapes decision-making. For example, Slovenian respondents displayed a significantly stronger preference for legal driving and flat salary type compared to the reference country (i.e., Croatia), suggesting differences in safety norms, labour practices and regulatory environments. These findings highlighted the importance of incorporating regional labour conditions and cultural factors when designing safety programmes and employment policies for last-mile delivery professionals.
Overall model performance indicators, including a McFadden pseudo-R2 of 0.657 and improvements in AIC and BIC compared to simpler specifications, demonstrated that the RPL model offers a strong explanatory fit and effectively captures behavioural variability in the dataset.
These findings offer several practical implications for the design of training programmes and organisational policies within last-mile delivery operations. The strong average preference for legal driving, combined with the significant variability in attitudes toward safe behaviours, suggests that training initiatives should move beyond generic safety instructions and instead incorporate tailored modules that address the specific motivations and pressures experienced by different groups of riders. For instance, individuals who exhibit lower sensitivity to safety-related attributes may benefit from targeted interventions emphasising the long-term risks associated with unsafe practices and strategies for managing time pressure without compromising safety. Similarly, the prominent role of remuneration structures highlights the need for compensation schemes that reduce the incentive to undertake risky manoeuvres merely to meet performance-based targets. The implementation of more stable pay arrangements, coupled with educational components that reinforce the value of compliant driving and route optimisation techniques, could support safer and more sustainable operational practices.
6.1. Limitations
Despite the valuable insights provided by this study, certain limitations should be acknowledged. Firstly, the hypothetical nature of the stated preference scenarios may not entirely reflect real-world conditions, as respondents’ choices could differ in practice due to unobserved contextual factors, such as environmental conditions or operational pressure. Another important limitation concerns the exclusive reliance on stated preference data, which may not fully capture the complexity of driving behaviour in real-time. Since no NDD or objective telematics were incorporated, potential discrepancies between stated intention and actual performance could not be validated.
A notable limitation of this study concerns the uneven distribution of respondents across the five participating countries, with Slovenia representing a disproportionately large share of the sample. The relatively small sample size and geographic focus on five European countries may also limit the generalizability of the findings to other regions with differing socioeconomic and cultural contexts. This imbalance may introduce bias by allowing the preferences of the largest subgroup to exert greater influence on the estimated parameters, potentially limiting the external validity of the findings. Although the RPL model and the inclusion of country-attribute interaction terms helped mitigate these effects by allowing preferences to vary by country, the results should nonetheless be interpreted with caution.
It should be mentioned that the stated preference experiment focused on three key attributes (i.e., driving behaviour, trip time and salary type); however, other contextual factors known to influence delivery behaviour, such as workload, weather conditions, road infrastructure, traffic density or delivery demand, were not included in the survey design. Their omission may reduce the ability to fully capture the operational pressures experienced by last-mile delivery professionals. Lastly, self-reported data on perceptions of danger and risky behaviour may be subject to response bias, impacting the reliability of these findings.
6.2. Future Research Directions
The use of a Discrete Choice Model allowed for a detailed analysis of the effect of attributes (driving behaviour, trip time and salary type) on choice probabilities across all scenarios. Concerning the sample size of the analysis, a more diverse and balanced cross-country sample across different regions would probably enhance the generalizability of the findings. Future studies should also integrate SP data with observed driving records, crash statistics or telematics to enhance behavioural accuracy and strengthen external validity.
The random parameter logit model provided valuable insights into the preferences and decision-making processes of last-mile delivery professionals. These findings can guide the design of policies and training programs that balance efficiency, safety and employee satisfaction. Interestingly, the positive association between trip time and utility suggested unobserved factors influencing this preference. Future research should explore whether longer trips are perceived as less stressful, safer or better compensated. Additional factors such as route safety, workload vehicle condition and environmental conditions could be incorporated to enhance the predictive power and applicability of the model and provide a holistic representation of real-world delivery conditions and a more comprehensive understanding of delivery professionals’ decision-making.
Furthermore, longitudinal studies examining how preferences evolve over time in response to training or changes in work conditions could offer valuable insights. Moreover, integrating real-world behavioural data, such as Global Positioning System (GPS) tracking or on-road monitoring, would complement stated preferences and provide a more comprehensive picture of actual decision-making processes. Finally, future research could explore the effectiveness of tailored training programs and policy interventions, evaluating their impact on safety, efficiency and job satisfaction among last-mile delivery professionals.
7. Conclusions
This study aimed to identify the training needs of last-mile delivery professionals through a comparative analysis of stated preference data collected from 333 participants across five countries (i.e., Croatia, Cyprus, Greece, Italy and Slovenia). The selection of these five countries reflected a deliberate effort to capture diverse socio-economic conditions, road safety challenges as well as delivery industry structures. This work provided insights into the complex factors affecting delivery professionals’ decision-making and emphasized the importance of harmonized training interventions tailored to regional needs.
The stated preference questionnaire included approximately 38 items and focused on the six following sections: (i) delivery riding experience and habits, (ii) travel characteristics, (iii) road safety aspects, (iv) road safety training, (v) stated choice questionnaire and (vi) socio-demographic characteristics. These sections offered detailed insights into delivery professionals’ work patterns, travel behaviour, safety practices, training needs and socio-economic profiles, creating a robust foundation for conducting a comparative analysis of last-mile delivery professionals. An attempt was also made to identify unique contextual factors influencing delivery operations and highlight distinct differences and recurring patterns across regions.
For the purposes of this analysis, a random parameter logit (RPL) model was used to evaluate the probability of respondents selecting one option over the other in each stated preference scenario. This model estimated how specific attributes influenced the likelihood of choosing an option. The key predictors included a unique identifier for each respondent to account for repeated choices across the five scenarios and a variable specifying the scenario number (1 to 5) to capture differences in context. Each option in a scenario was evaluated using its characteristics, including driving behaviour, trip time and salary type, all of which significantly influenced respondents’ choices. The choice variable was binary, indicating whether the respondent selected the given option (1 if chosen, 0 otherwise).
The results demonstrated that driving behaviour, trip time and salary type significantly influence respondents’ choices. A clear preference for flat salary was demonstrated, highlighting the value of income stability over performance-based remuneration, as well as the trade-offs delivery professionals navigate between time efficiency and safety compliance. This finding aligns with the broader desire for predictability and reduced risk in compensation structures. It should be noted that the results were consistent with the descriptive findings, which showed alignment between statistical analysis and observed patterns in respondents’ preferences.
The analysis also revealed critical implications for training needs. For instance, the prevalence of illegal driving behaviour in some scenarios underscored the need for specific training programs focusing on road safety and compliance, particularly for professionals operating under the performance-based salary type. Additionally, the sensitivity to trip time highlighted the importance of training on route optimization and time management to balance safety with efficiency.
All in all, this study provided a foundation for developing targeted interventions to improve the safety and efficiency of last-mile delivery operations. The study highlighted the importance of achieving a balance between safety, efficiency and economic stability while addressing regional disparities in training needs, offering valuable insights into enhancing the working conditions and well-being of delivery professionals across diverse contexts. Organizations could benefit from adopting hybrid salary systems that combine the predictability of flat salaries with performance-based bonuses, aligning with delivery professionals’ preferences while incentivizing productivity.
Author Contributions
Conceptualization D.P., P.P., V.A., C.G. and A.I.K.; methodology, D.P., P.P., V.A. and E.M.; software, D.P., P.P., V.A., C.G., A.I.K. and K.M.; validation, D.P., P.P. and C.G.; formal analysis, D.P., P.P., V.A., C.G., A.I.K., E.M. and K.M.; investigation, P.P., C.G., A.I.K. and K.M.; resources, P.P., C.G. and A.I.K.; data curation, D.P., P.P., V.A. and E.M.; writing—original draft preparation, D.P., P.P., V.A., C.G., A.I.K. and E.M.; writing—review and editing, D.P., P.P., V.A., C.G., A.I.K. and D.N.; visualization, D.P., E.M. and K.M.; supervision, P.P.; project administration, P.P.; funding acquisition, P.P. All authors have read and agreed to the published version of the manuscript.
Funding
This research received no external funding.
Data Availability Statement
Data available upon request.
Acknowledgments
The research was funded by the European Union’s SaferDeli project, in the frame of Erasmus + Programme Action KA220-VET, managed by the Hellenic National Agency, IKY.
Conflicts of Interest
All authors declare that the research was conducted in the absence of any commercial or financial relationships that could be construed as a potential conflict of interest.
Abbreviations
The following abbreviations are used in this manuscript:
| DCM | Discrete Choice Model |
| GDPR | General Data Protection Regulation |
| LCM | Latent Class Model |
| MLM | Mixed Logit Model |
| MNL | Multinomial Logit Model |
| NDD | Naturalistic Driving Data |
| SD | Standard Deviation |
| SP | Stated Preference |
| VIF | Variance Inflation Factor |
References
- Gatta, V.; Marcucci, E.; Le Pira, M. E-commerce and urban logistics: Trends, challenges, and opportunities. In Handbook on City Logistics and Urban Freight; Edward Elgar Publishing: Cheltenham, UK, 2023; pp. 422–443. [Google Scholar]
- Bates, O.; Friday, A.; Allen, J.; Cherrett, T.; McLeod, F.; Bektas, T.; Nguyen, T.; Piecyk, M.; Piotrowska, M.; Davies, N.; et al. Transforming last-mile logistics: Opportunities for more sustainable deliveries. In Proceedings of the 2018 CHI Conference on Human Factors in Computing Systems, Montreal, QC, Canada, 21–26 April 2018; pp. 1–14. [Google Scholar]
- Mehmood, T. Does information technology competencies and fleet management practices lead to effective service delivery? Empirical evidence from e-commerce industry. Int. J. Technol. Innov. Manag. (IJTIM) 2021, 1, 14–41. [Google Scholar] [CrossRef]
- Viu-Roig, M.; Alvarez-Palau, E.J. The impact of E-Commerce-related last-mile logistics on cities: A systematic literature review. Sustainability 2020, 12, 6492. [Google Scholar] [CrossRef]
- Harz, J.; Sommer, C. Mode choice of city tourists: Discrete choice modeling based on survey data from a major German city. Transp. Res. Interdiscip. Perspect. 2022, 16, 100704. [Google Scholar] [CrossRef]
- Schwanen, T.; Mokhtarian, P.L. What affects commute mode choice: Neighborhood physical structure or preferences toward neighborhoods? J. Transp. Geogr. 2005, 13, 83–99. [Google Scholar] [CrossRef]
- Zheng, Q.; Zhan, J.; Feng, X. Working safety and workloads of Chinese delivery riders: The role of work pressure. Int. J. Occup. Saf. Ergon. 2023, 29, 869–882. [Google Scholar] [CrossRef] [PubMed]
- Palma, D.; Dios Ortuzar, J.D.; Casaubon, G.; Rizzi, L.I.; Agosin, E. Measuring consumer preferences using hybrid discrete choice models. In Working Papers 164855; American Association of Wine Economists: New York, NY, USA, 2013. [Google Scholar]
- Groeneveld, Y.; de Romph, E.; Nugteren, A.; Pel, A.; Daamen, W.; Pudane, B. Performance Analysis on Joint Mode and Destination Choice: A Tour-Based Model of Limburg. Master’s Thesis, Delft University of Technology, Delft, The Netherlands, 2023. [Google Scholar]
- Puan, O.C.; Hassan, Y.A.H.; Mashros, N.; Idham, M.K.; Hassan, N.A.; Warid, M.N.M.; Hainin, M.R. Transportation mode choice binary logit model: A case study for Johor Bahru city. In IOP Conference Series: Materials Science and Engineering; IOP Publishing: Bristol, UK, 2019; Volume 527, p. 012066. [Google Scholar]
- Ma, S.; Kockelman, K.M.; Fagnant, D.J. Welfare analysis using logsum differences versus rule of half: Series of case studies. Transp. Res. Rec. 2015, 2530, 73–83. [Google Scholar] [CrossRef]
- Lovreglio, R.; Fonzone, A.; Dell’Olio, L. A mixed logit model for predicting exit choice during building evacuations. Transp. Res. Part A Policy Pract. 2016, 92, 59–75. [Google Scholar] [CrossRef]
- Lai, X.; Bierlaire, M. Specification of the cross-nested logit model with sampling of alternatives for route choice models. Transp. Res. Part B Methodol. 2015, 80, 220–234. [Google Scholar] [CrossRef]
- Shen, J.; Sakata, Y.; Hashimoto, Y. A comparison between latent class model and mixed logit model for transport mode choice: Evidences from two datasets of Japan. In Discussion Papers in Economics and Business 06-05; National University in Suita: Toyonaka, Japan, 2006. [Google Scholar]
- Guo, J.; Feng, T.; Timmermans, H.J. Co-dependent workplace, residence and commuting mode choice: Results of a multi-dimensional mixed logit model with panel effects. Cities 2020, 96, 102448. [Google Scholar] [CrossRef]
- Henning, E.; Ferreira Schubert, T.; Ceccatto Maciel, A. Modelling of university student transport mode choice in Joinville: A binary logistic model for active modes. J. Sustain. Dev. Energy Water Environ. Syst. 2020, 8, 678–691. [Google Scholar] [CrossRef]
- Abdel-Aal, M.M.M. Value of time determination for the city of Alexandria based on a disaggregate binary mode choice model. Alex. Eng. J. 2017, 56, 567–578. [Google Scholar] [CrossRef]
- Hardinghaus, M.; Papantoniou, P. Evaluating cyclists’ route preferences with respect to infrastructure. Sustainability 2020, 12, 3375. [Google Scholar] [CrossRef]
- Papantoniou, P.; Pavlou, D.; Michelaraki, E.; Amprasi, V. Investigating the safe driving behaviour of professional drivers in last-mile delivery services in Greece. Transp. Res. Part F Traffic Psychol. Behav. 2025, 114, 246–269. [Google Scholar] [CrossRef]
- Yang, Y.; Yao, E.; Yang, Z.; Zhang, R. Modeling the charging and route choice behavior of BEV drivers. Transp. Res. Part C Emerg. Technol. 2016, 65, 190–204. [Google Scholar] [CrossRef]
- Ma, S.; Yu, Z.; Liu, C. Nested logit joint model of travel mode and travel time choice for urban commuting Trips in Xi’an, China. J. Urban Plan. Dev. 2020, 146, 04020020. [Google Scholar] [CrossRef]
- Ding, C.; Mishra, S.; Lin, Y.; Xie, B. Cross-nested joint model of travel mode and departure time choice for urban commuting trips: Case study in Maryland–Washington, DC Region. J. Urban Plan. Dev. 2015, 141, 04014036. [Google Scholar] [CrossRef]
- Sheather, S. A Modern Approach to Regression with R; Springer Science & Business Media: Berlin/Heidelberg, Germany, 2009. [Google Scholar]
- Hanley, N.; Czajkowski, M. The role of stated preference valuation methods in understanding choices and informing policy. Rev. Environ. Econ. Policy 2019, 13, 248–266. [Google Scholar] [CrossRef]
- Wang, X.; Xu, X. Assessing the relationship between self-reported driving behaviors and driver risk using a naturalistic driving study. Accid. Anal. Prev. 2019, 128, 8–16. [Google Scholar] [CrossRef]
- Yannis, G.; Antoniou, C.; Evgenikos, P.; Papantoniou, P.; Kirk, A. Characteristics and causes of power two wheeler accidents in Europe. Procedia-Soc. Behav. Sci. 2012, 48, 1535–1544. [Google Scholar] [CrossRef]
- Fessler, A.; Thorhauge, M.; Mabit, S.; Haustein, S. A public transport-based crowdshipping concept as a sustainable last-mile solution: Assessing user preferences with a stated choice experiment. Transp. Res. Part A Policy Pract. 2022, 158, 210–223. [Google Scholar] [CrossRef]
- Yan, X.; Levine, J.; Zhao, X. Integrating ridesourcing services with public transit: An evaluation of traveler responses combining revealed and stated preference data. Transp. Res. Part C Emerg. Technol. 2019, 105, 683–696. [Google Scholar] [CrossRef]
- Washbrook, K.; Haider, W.; Jaccard, M. Estimating commuter mode choice: A discrete choice analysis of the impact of road pricing and parking charges. Transportation 2006, 33, 621–639. [Google Scholar] [CrossRef]
- He, M.; Liu, Y.; Sun, Y. Study based on MNL model about choices of traffic modes—Experimental analysis on the survey data in Beijing area. In Proceedings of the 2008 IEEE International Conference on Service Operations and Logistics, and Informatics, Beijing, China, 12–15 October 2008; IEEE: New York, NY, USA, 2008; Volume 2, pp. 2882–2887. [Google Scholar]
- Dia, H.; Panwai, S. Evaluation of discrete choice and neural network approaches for modelling driver compliance with traffic information. Transp. Metr. 2010, 6, 249–270. [Google Scholar] [CrossRef]
- Hackbarth, A.; Madlener, R. Consumer preferences for alternative fuel vehicles: A discrete choice analysis. Transp. Res. Part D Transp. Environ. 2013, 25, 5–17. [Google Scholar] [CrossRef]
- Chintagunta, P.K.; Nair, H.S. Structural workshop paper—Discrete-choice models of consumer demand in marketing. Mark. Sci. 2011, 30, 977–996. [Google Scholar] [CrossRef]
- Blayac, T.; Causse, A. Value of travel time: A theoretical legitimization of some nonlinear representative utility in discrete choice models. Transp. Res. Part B Methodol. 2001, 35, 391–400. [Google Scholar] [CrossRef]
- González, R.M.; Marrero, Á.S.; Navarro-Ibáñez, M. Tourists’ travel time values using discrete choice models: The recreational value of the Teide National Park. J. Sustain. Tour. 2018, 26, 2021–2042. [Google Scholar] [CrossRef]
- Glasgow, G. Mixed logit models for multiparty elections. Political Anal. 2001, 9, 116–136. [Google Scholar] [CrossRef]
- Washington, S.; Karlaftis, M.G.; Mannering, F.; Anastasopoulos, P. Statistical and Econometric Methods for Transportation Data Analysis; Chapman and Hall: New York, NY, USA; CRC: Boca Raton, FL, USA, 2020. [Google Scholar]
- Hensher, D.A.; Rose, J.M.; Greene, W.H. Applied Choice Analysis; Cambridge University Press: Cambridge, UK, 2015. [Google Scholar]
- Mannering, F.L.; Shankar, V.; Bhat, C.R. Unobserved heterogeneity and the statistical analysis of highway accident data. Anal. Methods Accid. Res. 2016, 11, 1–16. [Google Scholar] [CrossRef]
- Ye, F.; Cheng, W.; Wang, C.; Liu, H.; Bai, J. Investigating the severity of expressway crash based on the random parameter logit model accounting for unobserved heterogeneity. Adv. Mech. Eng. 2021, 13, 16878140211067278. [Google Scholar] [CrossRef]
- Savolainen, P.T.; Mannering, F.L.; Lord, D.; Quddus, M.A. The statistical analysis of highway crash-injury severities: A review and assessment of methodological alternatives. Accid. Anal. Prev. 2011, 43, 1666–1676. [Google Scholar] [CrossRef]
- Kutner, M.H.; Nachtsheim, C.J.; Neter, J.; Wasserman, W. Applied Linear Regression Models; McGraw-Hill/Irwin: New York, NY, USA, 2004; Volume 4, pp. 563–568. [Google Scholar]
- Yin, H. Investigating Determinants in the Acceptance of Automated Taxis: Evidence from Online Screen-Based and Virtual Reality-Based Stated Choice Experiments. Ph.D. Thesis, Newcastle University, Newcastle upon Tyne, UK, 2023. [Google Scholar]
- Veall, M.R.; Zimmermann, K.F. Evaluating Pseudo-R 2’s for binary probit models. Qual. Quant. 1994, 28, 151–164. [Google Scholar] [CrossRef]


Disclaimer/Publisher’s Note: The statements, opinions and data contained in all publications are solely those of the individual author(s) and contributor(s) and not of MDPI and/or the editor(s). MDPI and/or the editor(s) disclaim responsibility for any injury to people or property resulting from any ideas, methods, instructions or products referred to in the content. |
© 2025 by the authors. Licensee MDPI, Basel, Switzerland. This article is an open access article distributed under the terms and conditions of the Creative Commons Attribution (CC BY) license (https://creativecommons.org/licenses/by/4.0/).