
Mechanisms Leading to Increased Insulin-Stimulated Cerebral Glucose Uptake in Obesity and Insulin Resistance: A High-Fat Diet and Exercise Training Intervention PET Study with Rats (CROSRAT)

 , , ,
, , ,
Abstract

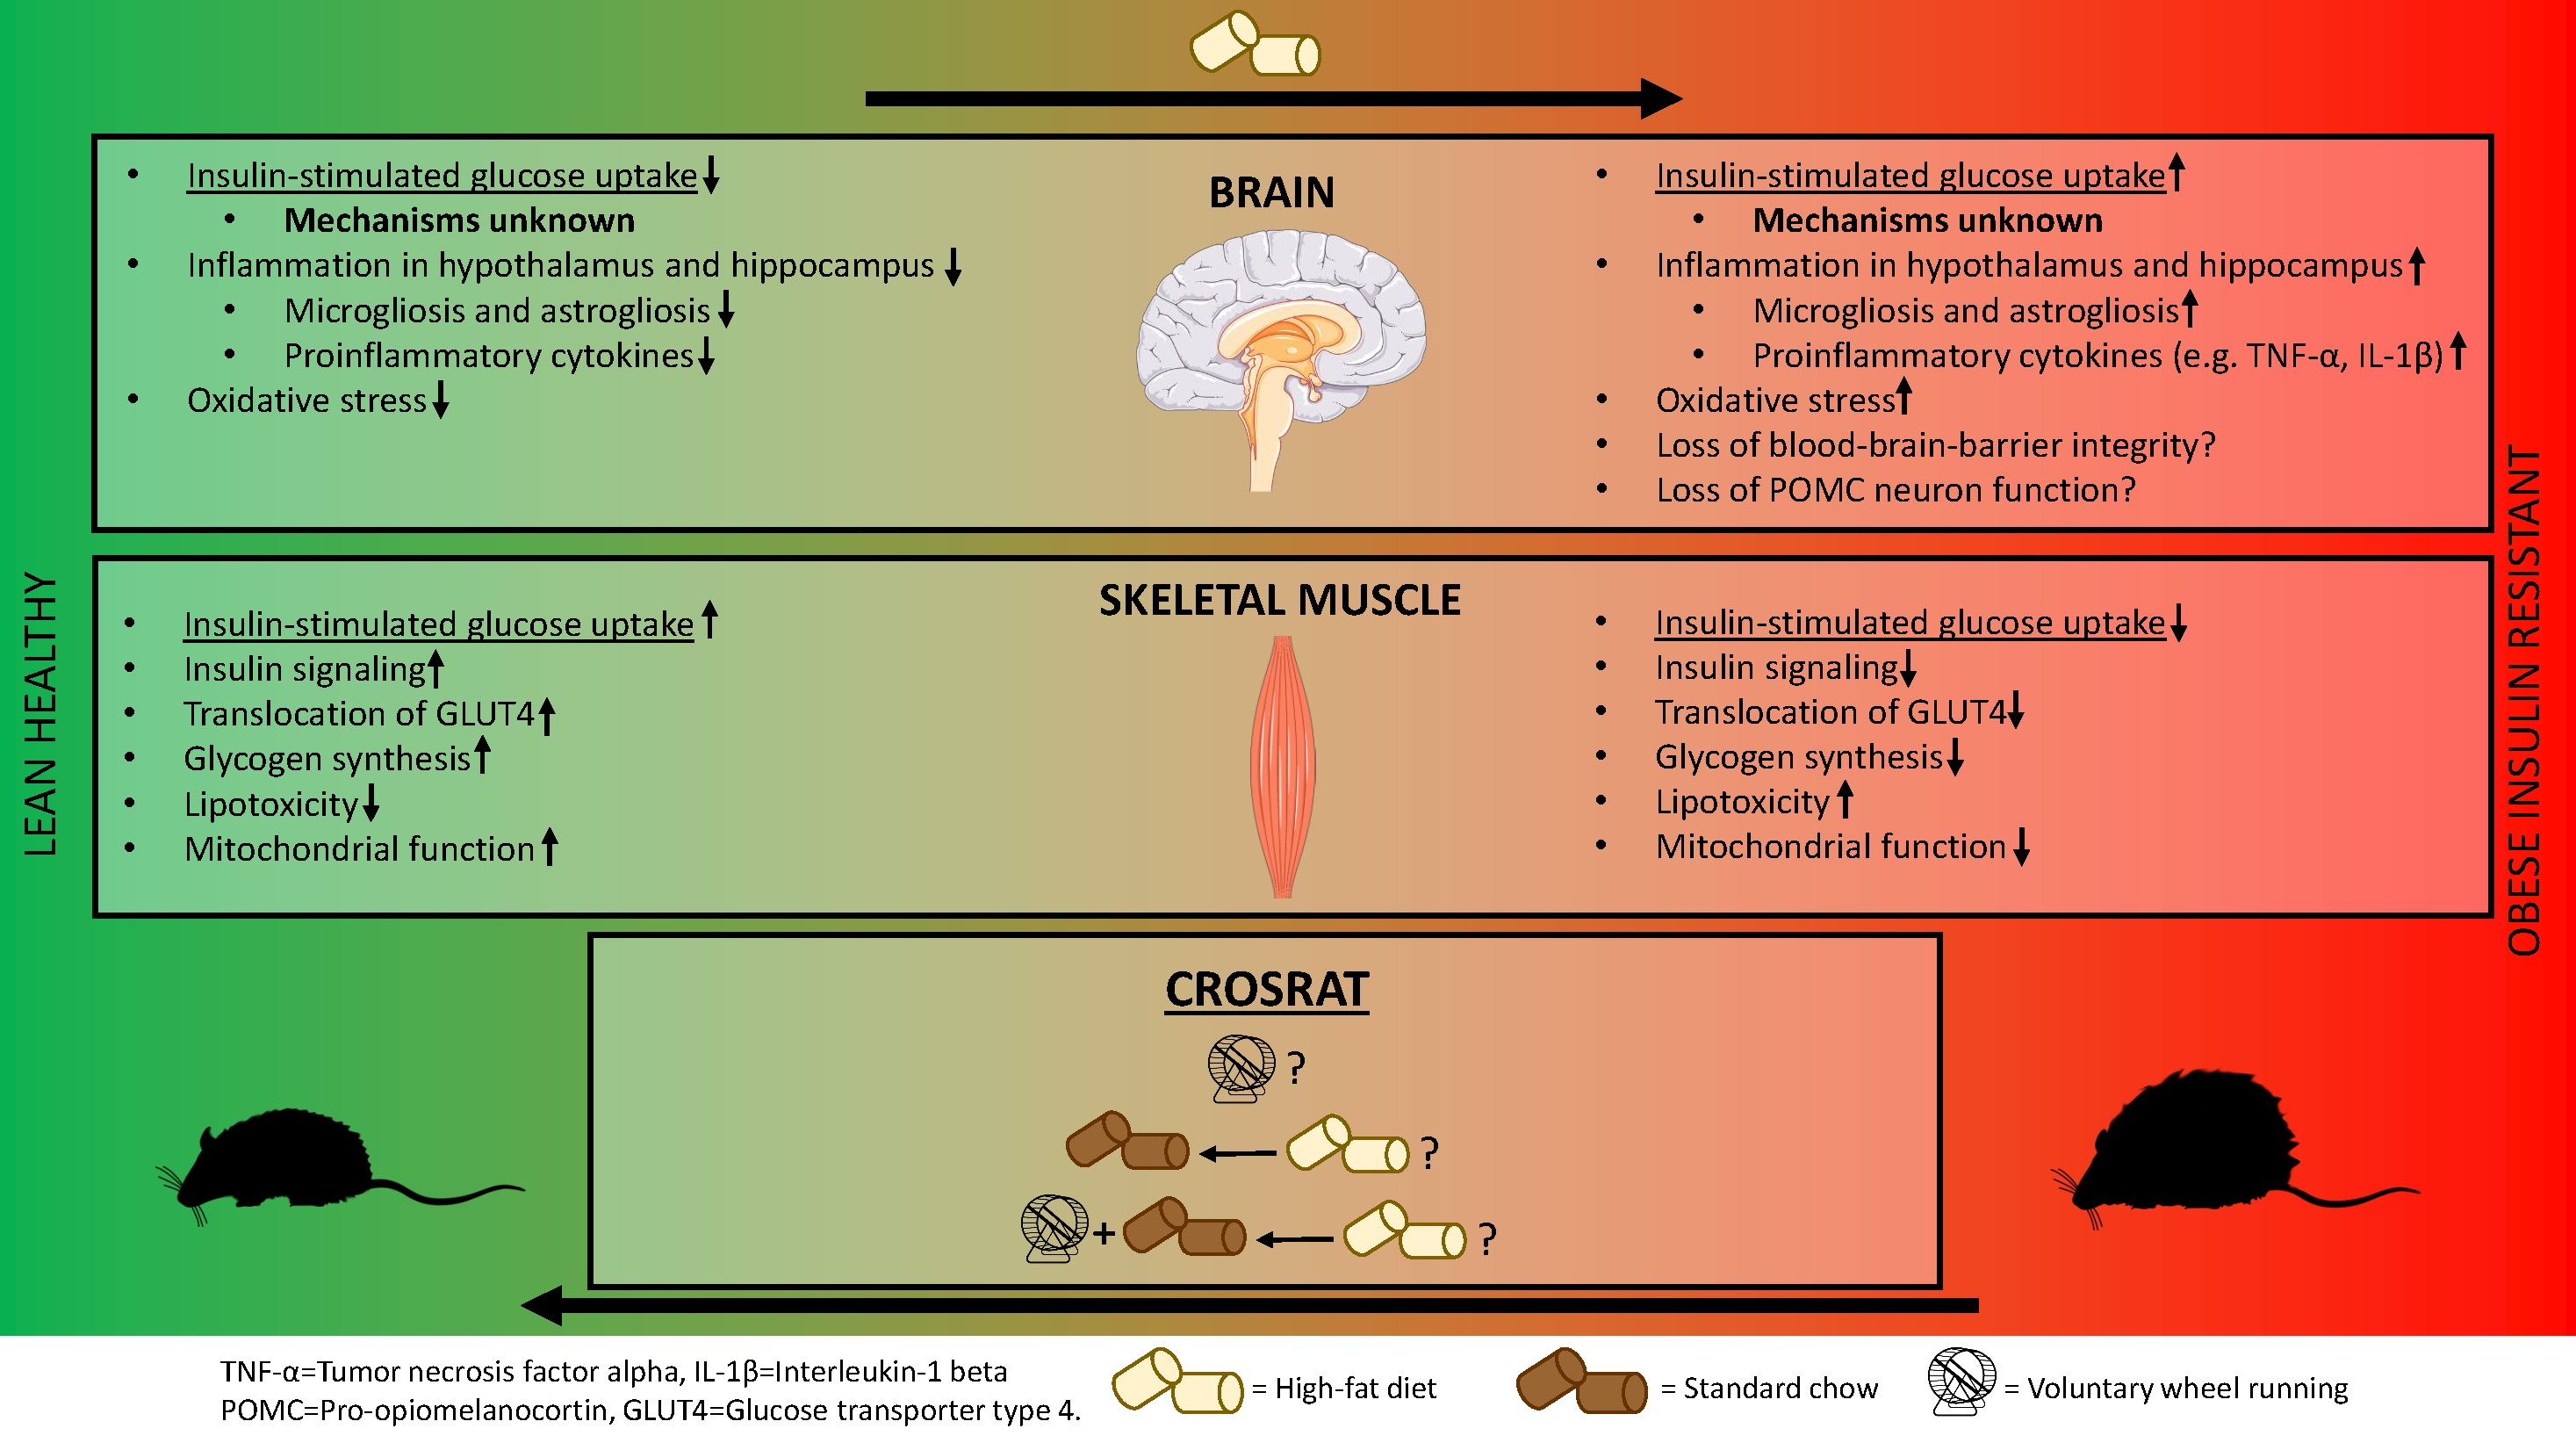
1. Introduction
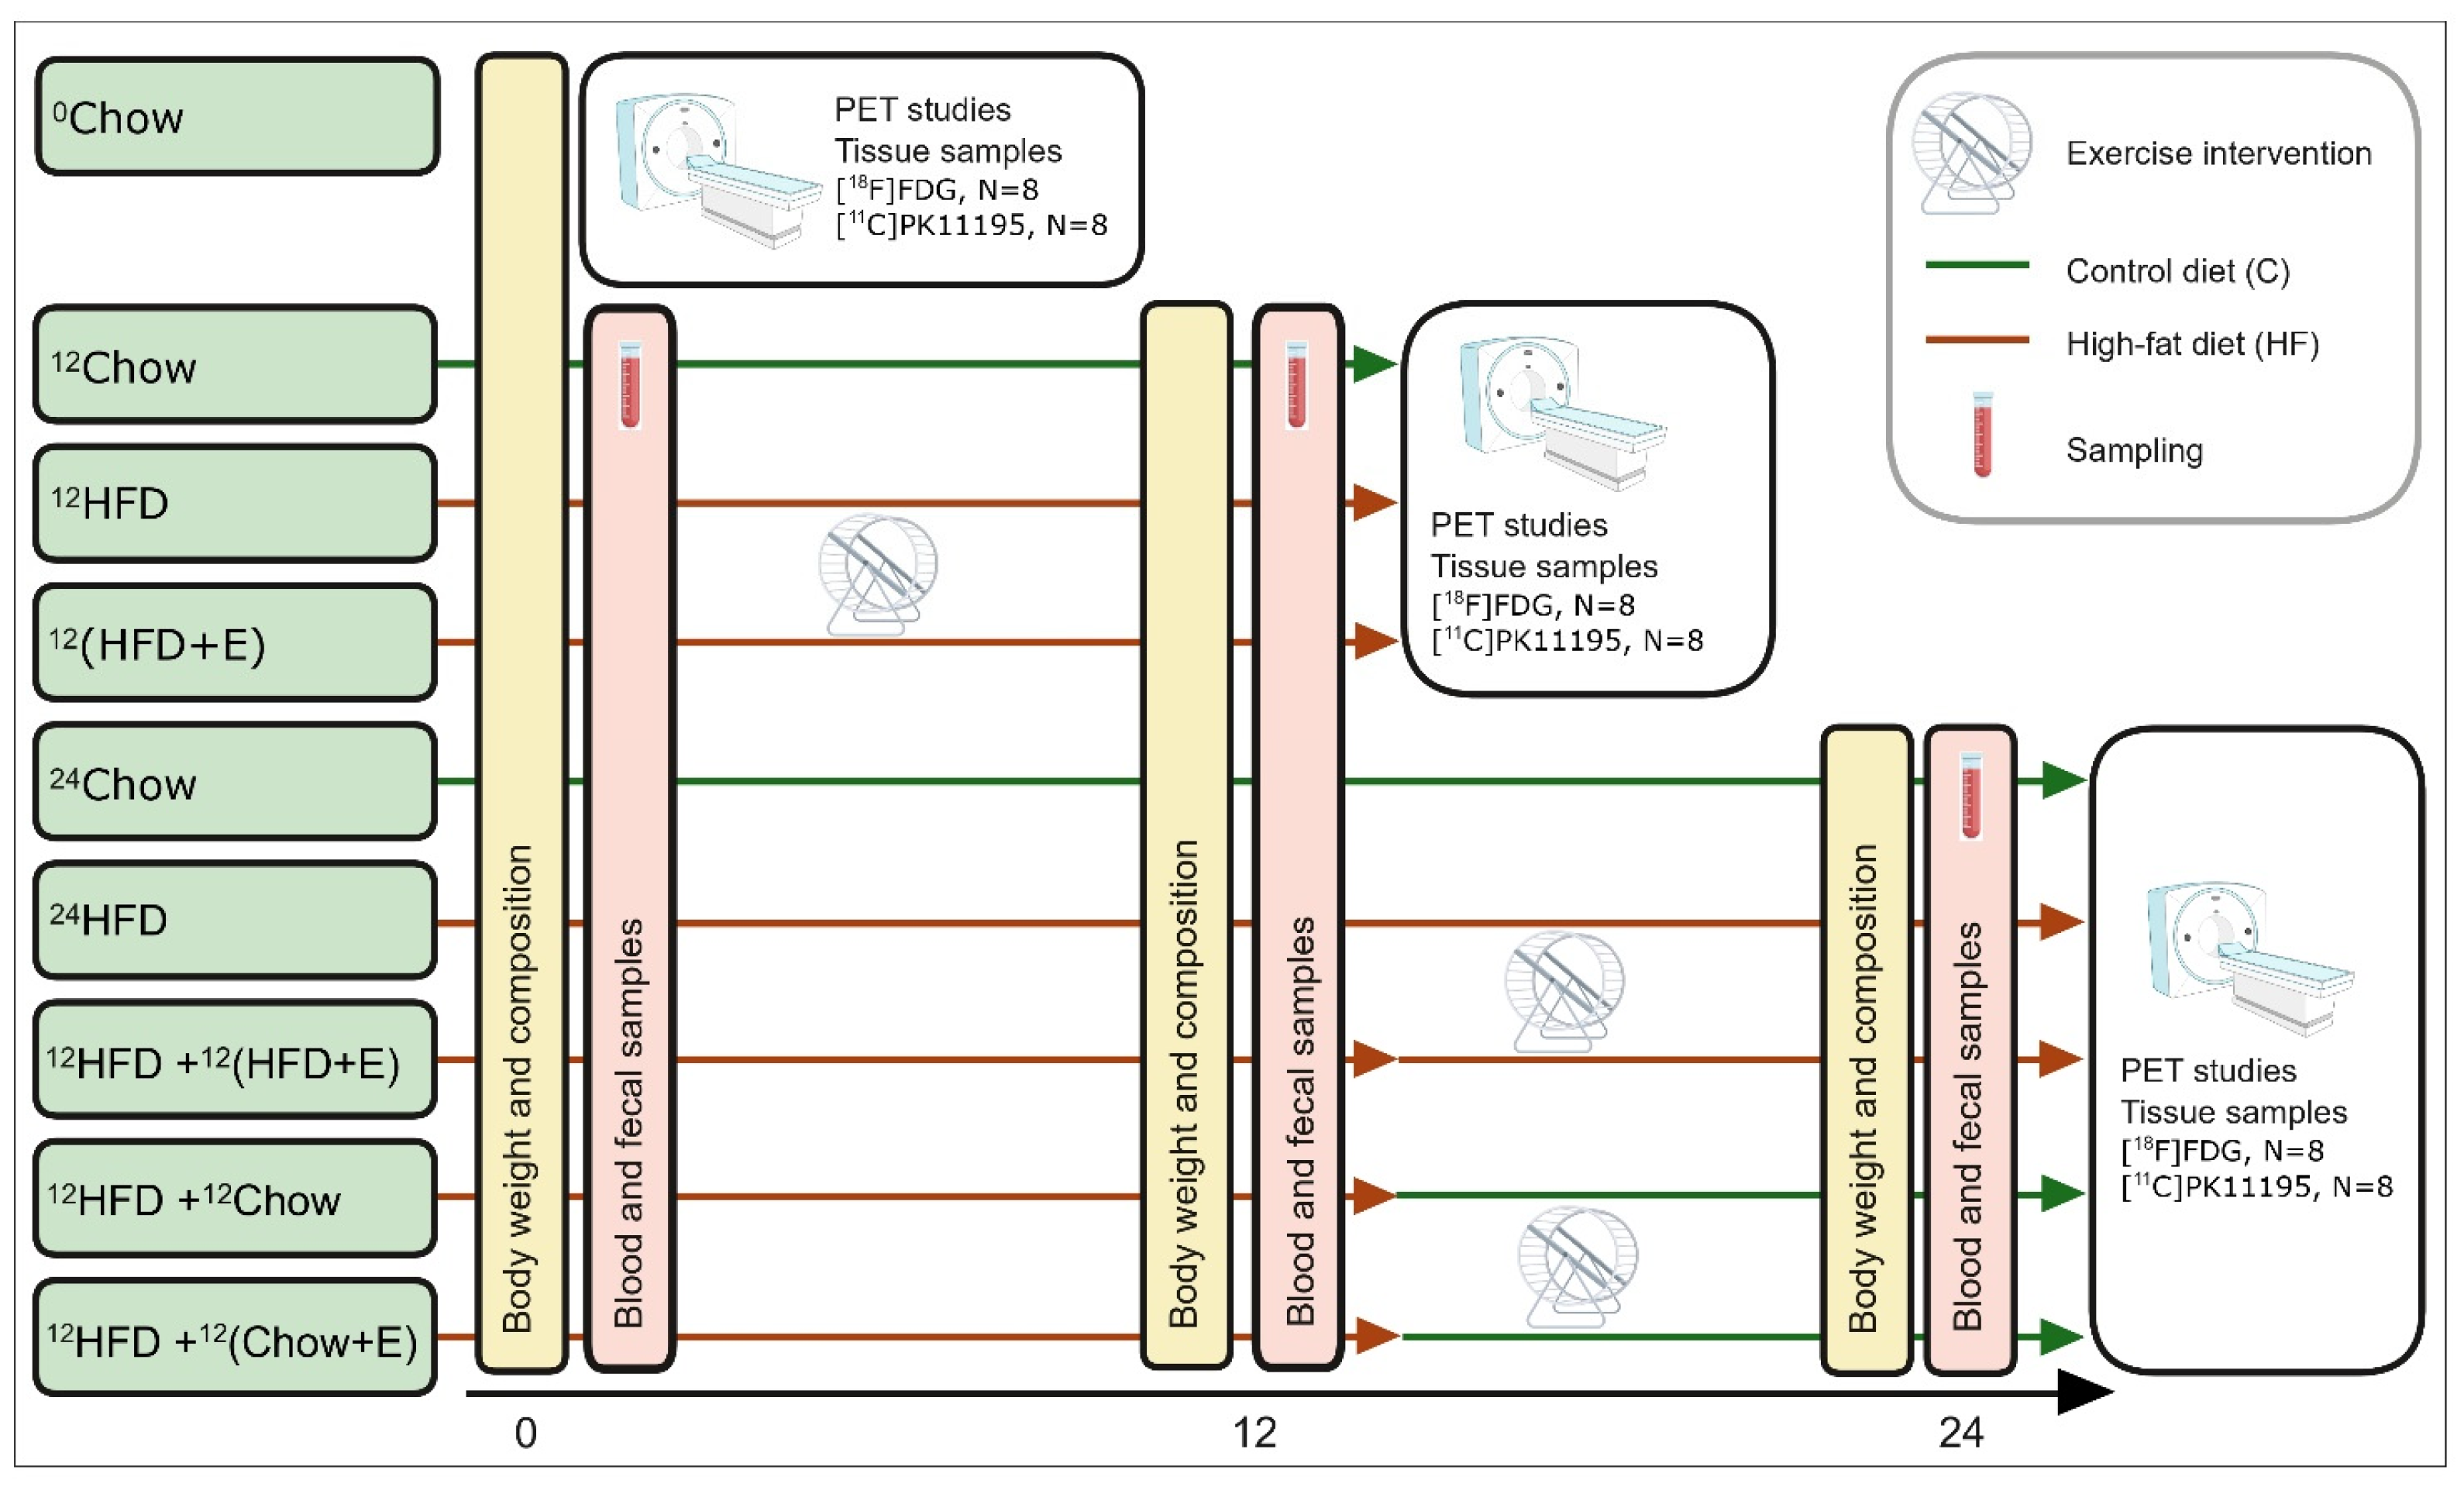
2. Experimental Design
3. Materials
4. Detailed Procedures and the Used Equipment
4.1. Diets and Voluntary Wheel Running
4.2. Body Weight and Body Composition Analysis
4.3. Fasting Blood Samples
4.4. Fecal Samples
4.5. Radiochemistry
4.6. PET Imaging
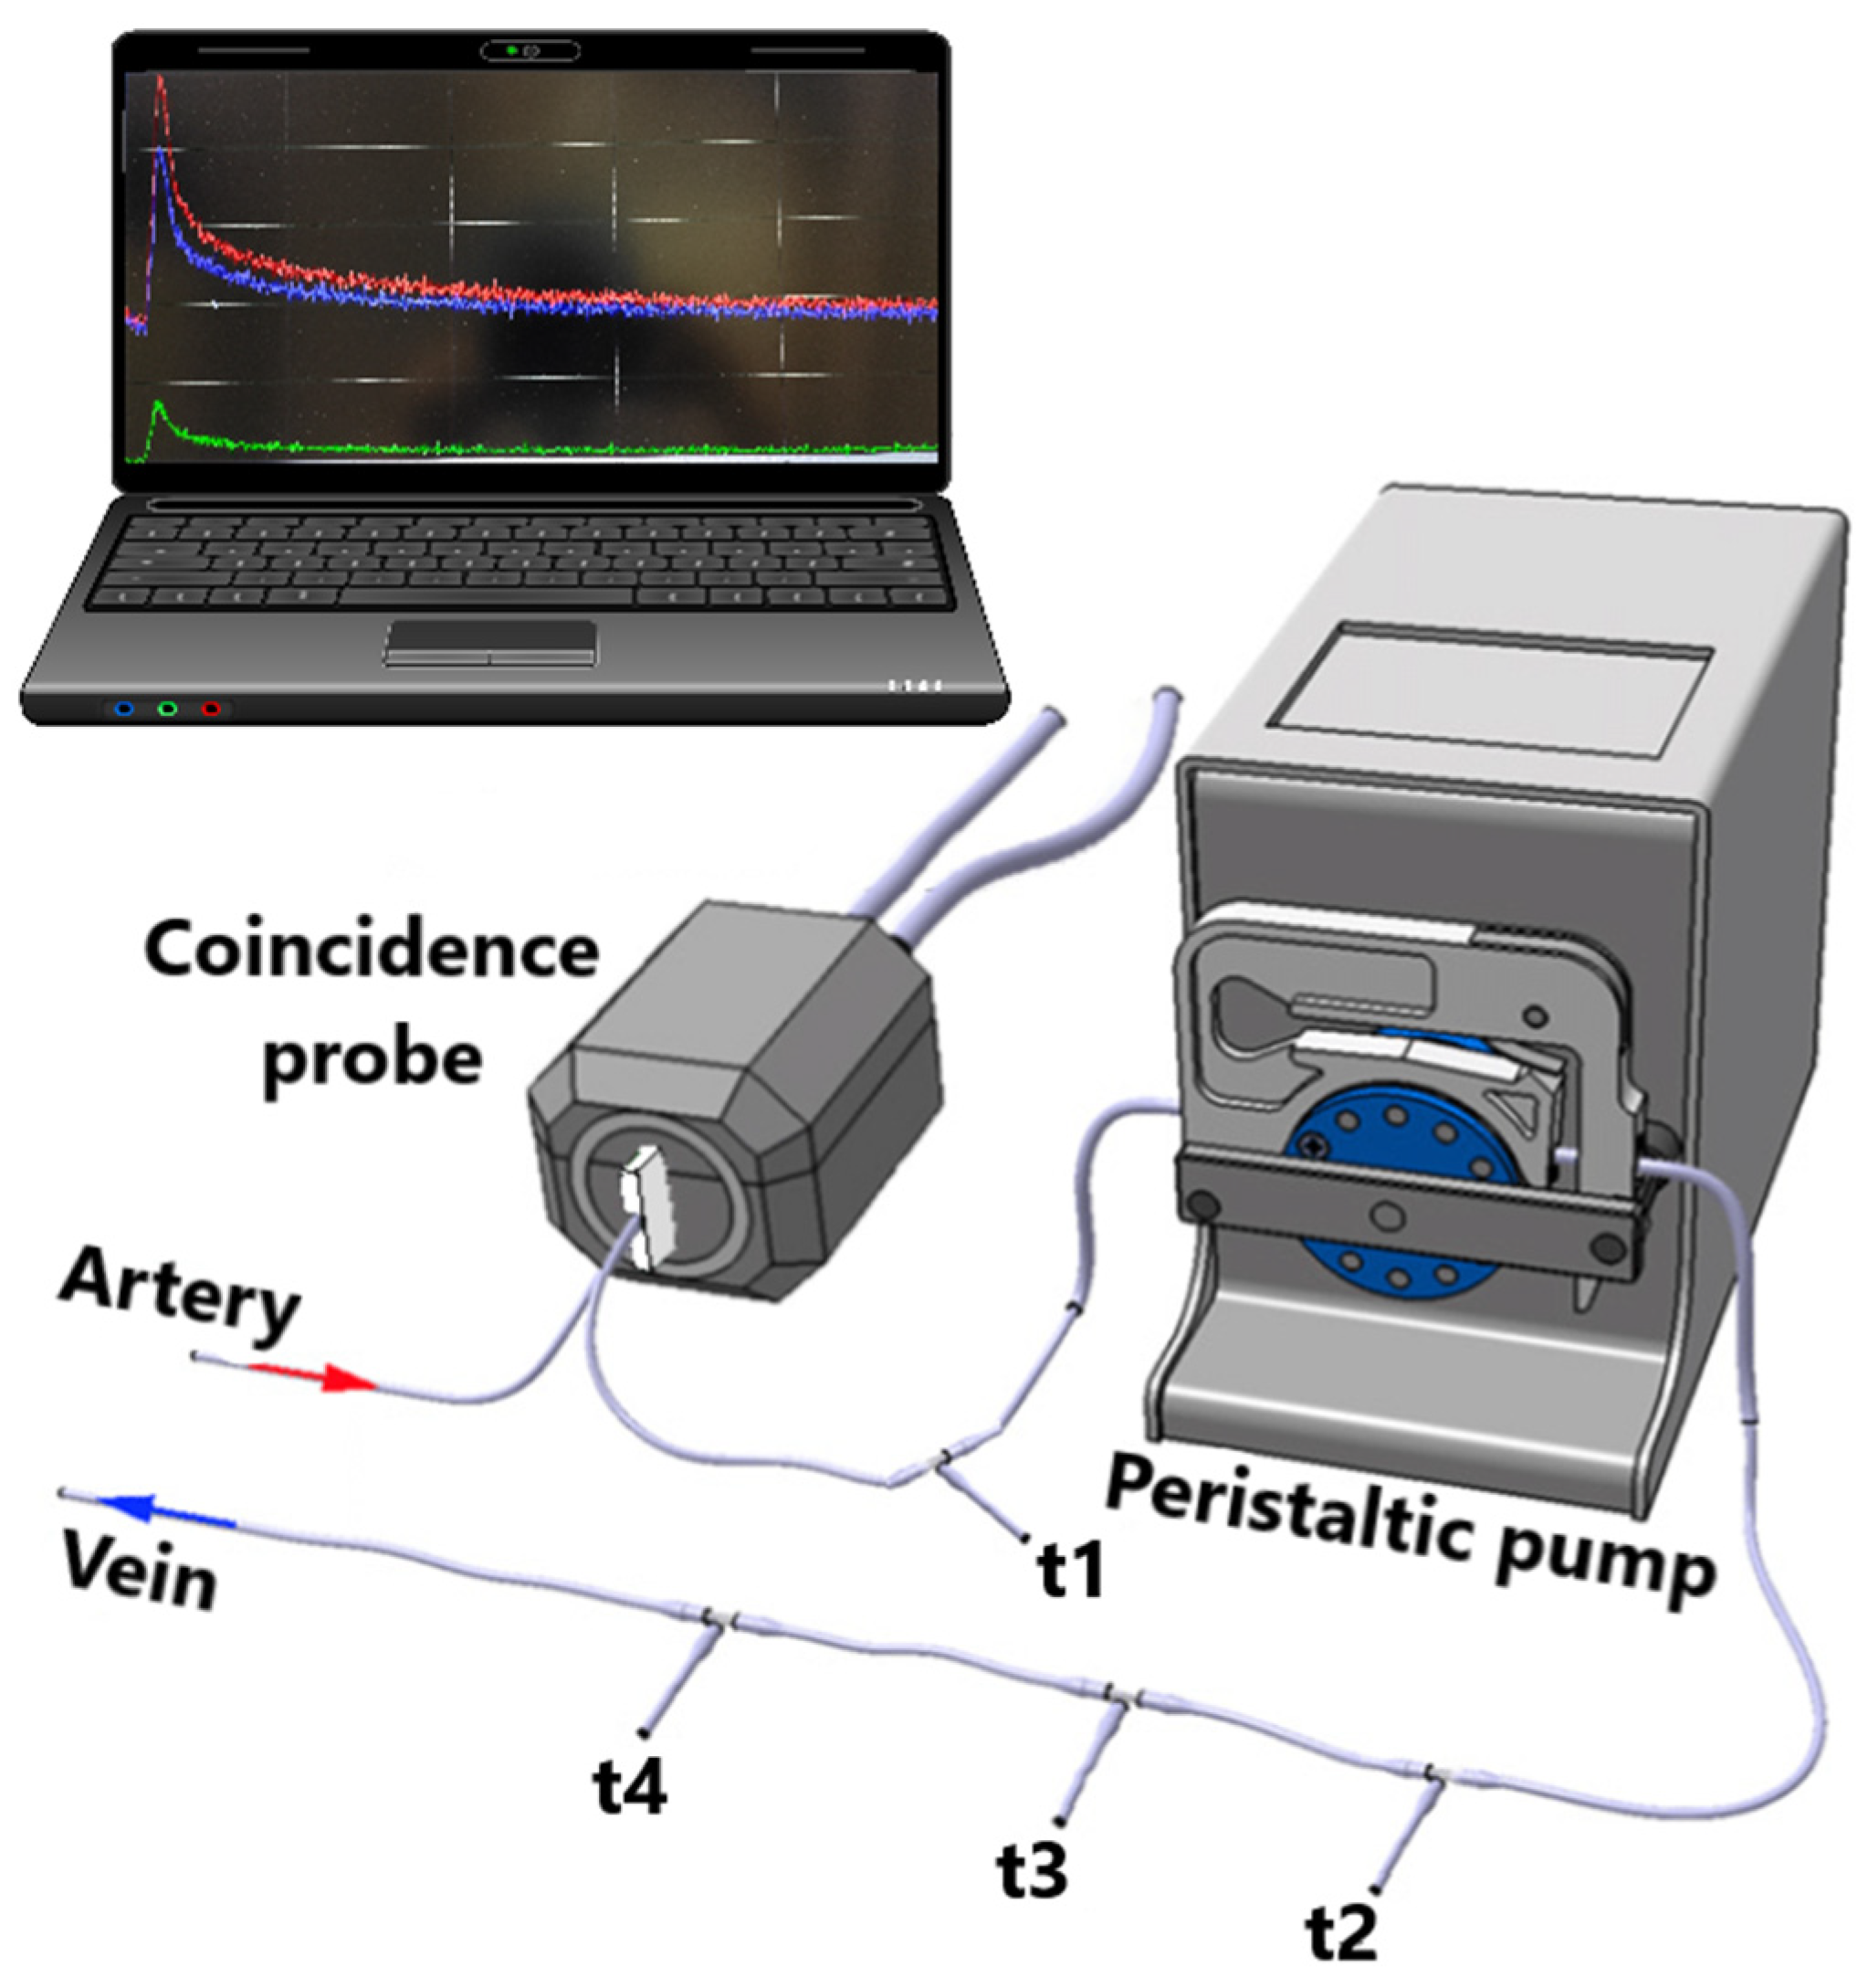
4.7. [18F]FDG-PET Study Combined with Hyperinsulinemic Euglycemic Clamp
4.8. [11C]PK11195-PET Study
4.9. Tracer Biodistribution Measurement and Ex Vivo Brain Autoradiography
4.10. Tissue/Organ Samples
4.11. PET Data Analysis
4.12. Brain Immunohistochemistry
4.13. Statistical Analyses
5. Expected Results
Author Contributions
Funding
Institutional Review Board Statement
Data Availability Statement
Conflicts of Interest
References
- Petersen, M.C.; Shulman, G.I. Mechanisms of Insulin Action and Insulin Resistance. Physiol. Rev. 2018, 98, 2133–2223. [Google Scholar] [CrossRef] [PubMed]
- Tuulari, J.J.; Karlsson, H.K.; Hirvonen, J.; Hannukainen, J.C.; Bucci, M.; Helmiö, M.; Ovaska, J.; Soinio, M.; Salminen, P.; Savisto, N.; et al. Weight Loss after Bariatric Surgery Reverses Insulin-Induced Increases in Brain Glucose Metabolism of the Morbidly Obese. Diabetes 2013, 62, 2747–2751. [Google Scholar] [CrossRef] [PubMed]
- Rebelos, E.; Bucci, M.; Karjalainen, T.; Oikonen, V.; Bertoldo, A.; Hannukainen, J.C.; Virtanen, K.A.; Latva-Rasku, A.; Hirvonen, J.; Heinonen, I.; et al. Insulin Resistance Is Associated with Enhanced Brain Glucose Uptake During Euglycemic Hyperinsulinemia: A Large-Scale PET Cohort. Diabetes Care 2021, 44, 788–794. [Google Scholar] [CrossRef] [PubMed]
- Honkala, S.M.; Johansson, J.; Motiani, K.K.; Eskelinen, J.J.; Virtanen, K.A.; Löyttyniemi, E.; Knuuti, J.; Nuutila, P.; Kalliokoski, K.K.; Hannukainen, J.C. Short-Term Interval Training Alters Brain Glucose Metabolism in Subjects with Insulin Resistance. J. Cereb. Blood Flow Metab. 2018, 38, 1828–1838. [Google Scholar] [CrossRef]
- Kullmann, S.; Heni, M.; Hallschmid, M.; Fritsche, A.; Preissl, H.; Häring, H.-U. Brain Insulin Resistance at the Crossroads of Metabolic and Cognitive Disorders in Humans. Physiol. Rev. 2016, 96, 1169–1209. [Google Scholar] [CrossRef]
- Jais, A.; Brüning, J.C. Hypothalamic Inflammation in Obesity and Metabolic Disease. J. Clin. Investig. 2017, 127, 24–32. [Google Scholar] [CrossRef]
- Ekblad, L.L.; Rinne, J.O.; Puukka, P.; Laine, H.; Ahtiluoto, S.; Sulkava, R.; Viitanen, M.; Jula, A. Insulin Resistance Predicts Cognitive Decline: An 11-Year Follow-up of a Nationally Representative Adult Population Sample. Diabetes Care 2017, 40, 751–758. [Google Scholar] [CrossRef]
- Bhat, N.R. Linking Cardiometabolic Disorders to Sporadic Alzheimer’s Disease: A Perspective on Potential Mechanisms and Mediators. J. Neurochem. 2010, 115, 551–562. [Google Scholar] [CrossRef]
- Takeda, S.; Sato, N.; Uchio-Yamada, K.; Sawada, K.; Kunieda, T.; Takeuchi, D.; Kurinami, H.; Shinohara, M.; Rakugi, H.; Morishita, R. Diabetes-Accelerated Memory Dysfunction via Cerebrovascular Inflammation and Abeta Deposition in an Alzheimer Mouse Model with Diabetes. Proc. Natl. Acad. Sci. USA 2010, 107, 7036–7041. [Google Scholar] [CrossRef]
- Clegg, D.J.; Gotoh, K.; Kemp, C.; Wortman, M.D.; Benoit, S.C.; Brown, L.M.; D’Alessio, D.; Tso, P.; Seeley, R.J.; Woods, S.C. Consumption of a High-Fat Diet Induces Central Insulin Resistance Independent of Adiposity. Physiol. Behav. 2011, 103, 10–16. [Google Scholar] [CrossRef]
- De Souza, C.T.; Araujo, E.P.; Bordin, S.; Ashimine, R.; Zollner, R.L.; Boschero, A.C.; Saad, M.J.A.; Velloso, L.A. Consumption of a Fat-Rich Diet Activates a Proinflammatory Response and Induces Insulin Resistance in the Hypothalamus. Endocrinology 2005, 146, 4192–4199. [Google Scholar] [CrossRef]
- Gao, Y.; Ottaway, N.; Schriever, S.C.; Legutko, B.; García-Cáceres, C.; de la Fuente, E.; Mergen, C.; Bour, S.; Thaler, J.P.; Seeley, R.J.; et al. Hormones and Diet, but Not Body Weight, Control Hypothalamic Microglial Activity. Glia 2014, 62, 17–25. [Google Scholar] [CrossRef]
- Prada, P.O.; Zecchin, H.G.; Gasparetti, A.L.; Torsoni, M.A.; Ueno, M.; Hirata, A.E.; Corezola do Amaral, M.E.; Höer, N.F.; Boschero, A.C.; Saad, M.J.A. Western Diet Modulates Insulin Signaling, c-Jun N-Terminal Kinase Activity, and Insulin Receptor Substrate-1ser307 Phosphorylation in a Tissue-Specific Fashion. Endocrinology 2005, 146, 1576–1587. [Google Scholar] [CrossRef]
- Cai, D.; Liu, T. Hypothalamic Inflammation: A Double-Edged Sword to Nutritional Diseases. Ann. N. Y. Acad. Sci. 2011, 1243, E1–E39. [Google Scholar] [CrossRef]
- Müller, L.; Power Guerra, N.; Schildt, A.; Lindner, T.; Stenzel, J.; Behrangi, N.; Bergner, C.; Alberts, T.; Bühler, D.; Kurth, J.; et al. [(18)F]GE-180-PET and Post Mortem Marker Characteristics of Long-Term High-Fat-Diet-Induced Chronic Neuroinflammation in Mice. Biomolecules 2023, 13, 769. [Google Scholar] [CrossRef]
- Geurts, L.; Neyrinck, A.M.; Delzenne, N.M.; Knauf, C.; Cani, P.D. Gut Microbiota Controls Adipose Tissue Expansion, Gut Barrier and Glucose Metabolism: Novel Insights into Molecular Targets and Interventions Using Prebiotics. Benef. Microbes 2014, 5, 3–17. [Google Scholar] [CrossRef] [PubMed]
- Bishop, N.C.; Wadley, A.J.; Hamrouni, M.; Roberts, M.J. Inactivity and Obesity: Consequences for Macrophage-Mediated Inflammation and the Development of Cardiometabolic Disease. Proc. Nutr. Soc. 2023, 82, 13–21. [Google Scholar] [CrossRef]
- Nelson, R.K.; Horowitz, J.F. Acute Exercise Ameliorates Differences in Insulin Resistance between Physically Active and Sedentary Overweight Adults. Appl. Physiol. Nutr. Metab. = Physiol. Appl. Nutr. Metab. 2014, 39, 811–818. [Google Scholar] [CrossRef] [PubMed][Green Version]
- Heiskanen, M.A.; Motiani, K.K.; Mari, A.; Saunavaara, V.; Eskelinen, J.J.; Virtanen, K.A.; Koivumäki, M.; Löyttyniemi, E.; Nuutila, P.; Kalliokoski, K.K.; et al. Exercise Training Decreases Pancreatic Fat Content and Improves Beta Cell Function Regardless of Baseline Glucose Tolerance: A Randomised Controlled Trial. Diabetologia 2018, 61, 1817–1828. [Google Scholar] [CrossRef] [PubMed]
- Motiani, K.K.; Collado, M.C.; Eskelinen, J.-J.; Virtanen, K.A.; Löyttyniemi, E.; Salminen, S.; Nuutila, P.; Kalliokoski, K.K.; Hannukainen, J.C. Exercise Training Modulates Gut Microbiota Profile and Improves Endotoxemia. Med. Sci. Sports Exerc. 2020, 52, 94–104. [Google Scholar] [CrossRef]
- Brouwers, B.; Schrauwen-Hinderling, V.B.; Jelenik, T.; Gemmink, A.; Sparks, L.M.; Havekes, B.; Bruls, Y.; Dahlmans, D.; Roden, M.; Hesselink, M.K.C.; et al. Exercise Training Reduces Intrahepatic Lipid Content in People with and People without Nonalcoholic Fatty Liver. Am. J. Physiol. Endocrinol. Metab. 2018, 314, E165–E173. [Google Scholar] [CrossRef] [PubMed]
- Slentz, C.A.; Tanner, C.J.; Bateman, L.A.; Durheim, M.T.; Huffman, K.M.; Houmard, J.A.; Kraus, W.E. Effects of Exercise Training Intensity on Pancreatic Beta-Cell Function. Diabetes Care 2009, 32, 1807–1811. [Google Scholar] [CrossRef] [PubMed]
- Kern, T.; Blond, M.B.; Hansen, T.H.; Rosenkilde, M.; Quist, J.S.; Gram, A.S.; Ekstrøm, C.T.; Hansen, T.; Stallknecht, B. Structured Exercise Alters the Gut Microbiota in Humans with Overweight and Obesity-A Randomized Controlled Trial. Int. J. Obes. 2020, 44, 125–135. [Google Scholar] [CrossRef] [PubMed]
- Bherer, L.; Erickson, K.I.; Liu-Ambrose, T. Physical Exercise and Brain Functions in Older Adults. J. Aging Res. 2013, 2013, 197326. [Google Scholar] [CrossRef] [PubMed]
- Heiskanen, M.A.; Honkala, S.M.; Hentilä, J.; Ojala, R.; Lautamäki, R.; Koskensalo, K.; Lietzén, M.S.; Saunavaara, V.; Saunavaara, J.; Helmiö, M.; et al. Systemic Cross-Talk between Brain, Gut, and Peripheral Tissues in Glucose Homeostasis: Effects of Exercise Training (CROSSYS). Exercise Training Intervention in Monozygotic Twins Discordant for Body Weight. BMC Sports Sci. Med. Rehabil. 2021, 13, 16. [Google Scholar] [CrossRef] [PubMed]
- Hamacher, K.; Coenen, H.H.; Stöcklin, G. Efficient Stereospecific Synthesis of No-Carrier-Added 2-[18F]-Fluoro-2-Deoxy-D-Glucose Using Aminopolyether Supported Nucleophilic Substitution. J. Nucl. Med. 1986, 27, 235–238. [Google Scholar] [PubMed]
- Camsonne, R.; Crouzel, C.; Comar, D.; Mazière, M.; Prenant, C.; Sastre, J.; Moulin, M.; Syrota, A. Synthesis of N-(11C) Methyl, N-(Methyl-1 Propyl), (Chloro-2 Phenyl)-1 Isoquinoleine Carboxamide-3 (PK 11195): A New Ligand for Peripheral Benzodiazepine Receptors. J. Label. Compd. Radiopharm. 1984, 21, 985–991. [Google Scholar] [CrossRef]
- Alf, M.F.; Wyss, M.T.; Buck, A.; Weber, B.; Schibli, R.; Krämer, S.D. Quantification of Brain Glucose Metabolism by 18F-FDG PET with Real-Time Arterial and Image-Derived Input Function in Mice. J. Nucl. Med. 2013, 54, 132–138. [Google Scholar] [CrossRef]
- DeFronzo, R.A.; Tobin, J.D.; Andres, R. Glucose Clamp Technique: A Method for Quantifying Insulin Secretion and Resistance. Am. J. Physiol. 1979, 237, E214–E223. [Google Scholar] [CrossRef]
- Schiffer, W.K.; Mirrione, M.M.; Biegon, A.; Alexoff, D.L.; Patel, V.; Dewey, S.L. Serial MicroPET Measures of the Metabolic Reaction to a Microdialysis Probe Implant. J. Neurosci. Methods 2006, 155, 272–284. [Google Scholar] [CrossRef]
- Thie, J.A. Clarification of a Fractional Uptake Concept. J. Nucl. Med. 1995, 36, 711–712. [Google Scholar]
- Xia, W.-J.; Xu, M.-L.; Yu, X.-J.; Du, M.-M.; Li, X.-H.; Yang, T.; Li, L.; Li, Y.; Kang, K.B.; Su, Q.; et al. Antihypertensive Effects of Exercise Involve Reshaping of Gut Microbiota and Improvement of Gut-Brain Axis in Spontaneously Hypertensive Rat. Gut Microbes 2021, 13, 1–24. [Google Scholar] [CrossRef]
- Hanna, C.; Hamilton, J.; Arnavut, E.; Blum, K.; Thanos, P.K. Brain Mapping the Effects of Chronic Aerobic Exercise in the Rat Brain Using FDG PET. J. Pers. Med. 2022, 12, 860. [Google Scholar] [CrossRef]
- Pick, A.; Clark, J.; Kubstrup, C.; Levisetti, M.; Pugh, W.; Bonner-Weir, S.; Polonsky, K.S. Role of Apoptosis in Failure of Beta-Cell Mass Compensation for Insulin Resistance and Beta-Cell Defects in the Male Zucker Diabetic Fatty Rat. Diabetes 1998, 47, 358–364. [Google Scholar] [CrossRef] [PubMed]
- Li, Q.; Tuo, X.; Li, B.; Deng, Z.; Qiu, Y.; Xie, H. Semaglutide Attenuates Excessive Exercise-Induced Myocardial Injury through Inhibiting Oxidative Stress and Inflammation in Rats. Life Sci. 2020, 250, 117531. [Google Scholar] [CrossRef]
- Manouze, H.; Ghestem, A.; Poillerat, V.; Bennis, M.; Ba-M’hamed, S.; Benoliel, J.J.; Becker, C.; Bernard, C. Effects of Single Cage Housing on Stress, Cognitive, and Seizure Parameters in the Rat and Mouse Pilocarpine Models of Epilepsy. eNeuro 2019, 6, ENEURO.0179-18. [Google Scholar] [CrossRef]
- Levin, B.E.; Dunn-Meynell, A.A.; Balkan, B.; Keesey, R.E. Selective Breeding for Diet-Induced Obesity and Resistance in Sprague-Dawley Rats. Am. J. Physiol. 1997, 273, R725–R730. [Google Scholar] [CrossRef] [PubMed]
- Samuel, V.T.; Liu, Z.-X.; Wang, A.; Beddow, S.A.; Geisler, J.G.; Kahn, M.; Zhang, X.; Monia, B.P.; Bhanot, S.; Shulman, G.I. Inhibition of Protein Kinase Cepsilon Prevents Hepatic Insulin Resistance in Nonalcoholic Fatty Liver Disease. J. Clin. Investig. 2007, 117, 739–745. [Google Scholar] [CrossRef]
- Turner, N.; Kowalski, G.M.; Leslie, S.J.; Risis, S.; Yang, C.; Lee-Young, R.S.; Babb, J.R.; Meikle, P.J.; Lancaster, G.I.; Henstridge, D.C.; et al. Distinct Patterns of Tissue-Specific Lipid Accumulation during the Induction of Insulin Resistance in Mice by High-Fat Feeding. Diabetologia 2013, 56, 1638–1648. [Google Scholar] [CrossRef]
- DeFronzo, R.A.; Tripathy, D. Skeletal Muscle Insulin Resistance Is the Primary Defect in Type 2 Diabetes. Diabetes Care 2009, 32 (Suppl. S2), S157–S163. [Google Scholar] [CrossRef]
- Samuel, V.T.; Shulman, G.I. The Pathogenesis of Insulin Resistance: Integrating Signaling Pathways and Substrate Flux. J. Clin. Investig. 2016, 126, 12–22. [Google Scholar] [CrossRef] [PubMed]


Disclaimer/Publisher’s Note: The statements, opinions and data contained in all publications are solely those of the individual author(s) and contributor(s) and not of MDPI and/or the editor(s). MDPI and/or the editor(s) disclaim responsibility for any injury to people or property resulting from any ideas, methods, instructions or products referred to in the content. |
© 2024 by the authors. Licensee MDPI, Basel, Switzerland. This article is an open access article distributed under the terms and conditions of the Creative Commons Attribution (CC BY) license (https://creativecommons.org/licenses/by/4.0/).
Share and Cite
Jalo, A.; Helin, J.S.; Hentilä, J.; Nissinen, T.A.; Honkala, S.M.; Heiskanen, M.A.; Löyttyniemi, E.; Malm, T.; Hannukainen, J.C. Mechanisms Leading to Increased Insulin-Stimulated Cerebral Glucose Uptake in Obesity and Insulin Resistance: A High-Fat Diet and Exercise Training Intervention PET Study with Rats (CROSRAT). J. Funct. Morphol. Kinesiol. 2024, 9, 58. https://doi.org/10.3390/jfmk9020058
Jalo A, Helin JS, Hentilä J, Nissinen TA, Honkala SM, Heiskanen MA, Löyttyniemi E, Malm T, Hannukainen JC. Mechanisms Leading to Increased Insulin-Stimulated Cerebral Glucose Uptake in Obesity and Insulin Resistance: A High-Fat Diet and Exercise Training Intervention PET Study with Rats (CROSRAT). Journal of Functional Morphology and Kinesiology. 2024; 9(2):58. https://doi.org/10.3390/jfmk9020058
Chicago/Turabian StyleJalo, Anna, Jatta S. Helin, Jaakko Hentilä, Tuuli A. Nissinen, Sanna M. Honkala, Marja A. Heiskanen, Eliisa Löyttyniemi, Tarja Malm, and Jarna C. Hannukainen. 2024. "Mechanisms Leading to Increased Insulin-Stimulated Cerebral Glucose Uptake in Obesity and Insulin Resistance: A High-Fat Diet and Exercise Training Intervention PET Study with Rats (CROSRAT)" Journal of Functional Morphology and Kinesiology 9, no. 2: 58. https://doi.org/10.3390/jfmk9020058
APA StyleJalo, A., Helin, J. S., Hentilä, J., Nissinen, T. A., Honkala, S. M., Heiskanen, M. A., Löyttyniemi, E., Malm, T., & Hannukainen, J. C. (2024). Mechanisms Leading to Increased Insulin-Stimulated Cerebral Glucose Uptake in Obesity and Insulin Resistance: A High-Fat Diet and Exercise Training Intervention PET Study with Rats (CROSRAT). Journal of Functional Morphology and Kinesiology, 9(2), 58. https://doi.org/10.3390/jfmk9020058