Abstract
Background: Accurately tracking body-composition changes in endurance field settings remains methodologically challenging. This study aimed to evaluate whether changes in subcutaneous adipose tissue (SAT) across a 7-day ultramarathon are better reflected by anthropometric indices than by body mass (BM) alone. Methods: Twenty ultrarunners were assessed using both anthropometric indices and ultrasound measurements of SAT thickness, applying a novel method that distinguishes layers including (DI) versus excluding (DE) embedded fibrous structures. Measurements were obtained before the race and after Stages 4 and 7. Indices included body mass index (BMI), mass index (MII), and waist-to-height ratio (WHtR). Results: Total SAT thickness decreased significantly for both DI (p = 0.001) and DE (p < 0.001). BM, BMI, MII, and WHtR also declined significantly post-race (p < 0.001). SAT reduction was most pronounced at the abdominal and thigh sites. Additionally, ultrarunners with lower DE values exhibited lower fat at the abdomen and distal triceps. BMI was significantly related to DE at the upper and lower abdomen and erector spinae; MII was significantly associated with DE at the upper and lower abdomen; and WHtR correlated with both DE and DI at abdominal and erector spinae sites. BM showed no significant association with any SAT parameter. Conclusions: Ultrasound-derived SAT thickness, in combination with BMI, MII, and WHtR, offers a field-feasible approach to evaluate body-composition change during multistage ultramarathons. In contrast, BM alone does not reliably reflect SAT distribution or loss.
1. Introduction
Accurately attributing changes in body composition, particularly during endurance performance and in relation to hydration status, remains a major methodological challenge, especially in field-based research. The more precisely body components are partitioned as body mass (BM) changes, the more reliable the inferences from real-world endurance events. Most studies on endurance performance still rely primarily on basic parameters such as BM, with some incorporating anthropometric indices. The most widely used, body mass index (BMI), estimates relative BM but does not account for body dimensions, tends to overestimate fat in muscular individuals, and fails to reflect fat distribution [1,2]. An improved mass index (MII) proposed by W. Müller [3,4] incorporates sitting height relative to leg length. Other commonly used anthropometric indicators include the waist-to-hip ratio (WHR), a marker of abdominal obesity [5], and the waist-to-height ratio (WHtR), which better reflects fat distribution [1,6]. Although several studies infer changes in body fat, muscle mass, or water content from BM variation, fluid and electrolyte shifts during competition can substantially confound such assessments [7].
Furthermore, standardizing measurement conditions (pre-, mid-, and post-race) is rarely feasible in field settings. For example, glycogen supercompensation can increase water retention and alter skinfold compressibility [7]. Even widely used techniques such as skinfold calipers are susceptible to compression artifacts and operator error [8]. Although dual-energy X-ray absorptiometry (DXA) is often treated as the gold standard for total body composition, fat estimates in athletic populations may be inaccurate [7,9]. Potential sources of error include the compartmental algorithms used to separate muscle, fat, and bone and the population-based reference standards embedded in the analysis software [10]. Bioelectrical impedance analysis (BIA), commonly used in field settings, is likewise affected by multiple environmental and physiological factors that can diminish accuracy [11].
Ultrasound has emerged as a noninvasive, reproducible alternative for site-specific SAT assessment under real-world race conditions. Recent advances permit differentiation of fat layers that include versus exclude embedded fibrous structures, offering insight into microstructural adipose adaptations during extreme exercise. Accordingly, this study examined whether ultrasound-derived SAT changes over a 7-day ultramarathon align more closely with anthropometric indices (BMI, MII, WHR, WHtR) than with body mass (BM). We hypothesized that anthropometric indices would better capture exercise-induced SAT variation than BM alone, supporting their practical use for field monitoring of endurance athletes.
2. Materials and Methods
2.1. Participants and Race
The study complied with the Declaration of Helsinki and was approved by the Ethics Committee of the Centre of Sports Activities, Brno University of Technology, Czech Republic (Approval No. 1/2016; 16 May 2016). All race entrants were invited to participate. All race participants were invited to join the study. Study information was distributed by the race organizers via email approximately two months and again one week before the event. Participation was voluntary, and no specific inclusion or exclusion criteria were applied. Twenty amateur ultrarunners (17 men, 3 women) were randomly selected from 21 volunteers who registered for the study; all 20 completed the entire race and were included in the analyses. Written informed consent for anonymous data use was obtained from all participants.
The study examined the Moravian Ultra Marathon 2016, an international multistage running race widely regarded as among the most demanding of its kind in the Czech Republic. The race was held in Lomnice, Czech Republic, from 3–9 July 2016 and comprised seven consecutive marathons (~42.2–43.0 km per stage) on seven successive days. Each stage followed a distinct point-to-point course over mixed terrain (asphalt with light traffic, forest paths, and field trails), with an average daily elevation gain of ~900 m, thereby imposing a substantially higher load than typical single-stage events. Six on-course aid stations per stage provided water, sports drinks, tea, soup, caffeinated beverages, mineral water, fruit, cheese, biscuits, crisps, peanuts, and chocolate (as conditions permitted). Athletes were allowed to use personal nutrition. Direct hydration markers were collected within the broader research program for this cohort but were not analyzed in the present study; accordingly, short-term BM changes attributable to fluid balance cannot be partitioned here by design.
2.2. Anthropometric Measurements
Anthropometric measurements included body mass (BM), standing height, sitting height, and waist and hip circumferences. Standing height was measured to the nearest 0.01 m with a portable anthropometer (A-226; Trystom, Olomouc, Czech Republic). Sitting height was recorded in a fully upright seated position; the height of the seat was subtracted to obtain true sitting height. BM was assessed to the nearest 0.1 kg using a calibrated digital scale (Beurer BF 15; Beurer GmbH, Ulm, Germany). Measurements were performed during race registration (1.5 h before Stage 1) and immediately after Stages 4 and 7. Participants wore standard running attire and were barefoot for all assessments. All measurements were obtained by a certified anthropometrist with extensive experience in ultrasound-based fat assessment. Body mass index (BMI) was calculated as BMI = BM/height2 (kg·m−2). The improved mass index (MII), which incorporates sitting height, was calculated as MII = 0.53 × BM/(h × s), where h = standing height (m) and s = sitting height (m), following Müller et al. [3,4,7,8]. Circumferences were measured according to International Society for the Advancement of Kinanthropometry (ISAK) standards [12]. Mid-upper arm, mid-thigh, mid-calf, gluteal (hip), and waist circumferences were assessed on the right side to the nearest 0.1 cm using a non-elastic tape (KaWe CE; Kirchner und Wilhelm, Asperg, Germany). The waist-to-height ratio (WHtR) was calculated as waist circumference/height, and the waist-to-hip ratio (WHR) as waist circumference/hip circumference. All anthropometric and ultrasound measurements were performed by an ISAK Level 2–certified anthropometrist with >5 years of field experience. Pre-study intra-observer reliability testing demonstrated excellent repeatability (intraclass correlation coefficient > 0.95 for repeated measures).
2.3. Ultrasound Measurement Protocol
Ultrasound and anthropometric measurements were obtained at three timepoints: pre-race, after Stage 4, and after Stage 7. All measurement sites were located on the right side of the body and marked pre-race using a water-soluble cosmetic pencil (Schwan Cosmetics, Heroldsberg, Germany); markings were renewed as needed before subsequent measurements due to perspiration. Eight anatomical sites were assessed to capture inter-individual variation in SAT distribution: (1) upper abdomen (UA), (2) lower abdomen (LA), (3) erector spinae (ES), (4) distal triceps (DT), (5) brachioradialis (BR), (6) lateral thigh (LT), (7) front thigh (FT), and (8) medial calf (MC). Marking and positioning followed standard postural orientations: UA, LA, and LT in standing; DT and BR with the arm supported; FT and MC with the leg supported [13]. Ultrasound scans were conducted with participants in supine, prone, or rotated positions as appropriate. The protocol aligned with the International Olympic Committee Working Group recommendations for body-composition assessment [13]. Measurements were performed using a GE Logiq-e ultrasound system (GE Healthcare Austria, Vienna, Austria) with a linear transducer. To minimize tissue compression, a thick layer of ultrasound gel was applied, and the probe was placed with only minimal pressure on the skin [13]. Images were analyzed using FAT software (FAT 3.2; Rotosport, Stattegg, Austria), designed for semi-automated SAT quantification, with a constant sound speed of 1450 m/s for calibration [14]. An automated distance algorithm was used, with manual correction when necessary [8,13,15]. The software quantified SAT thickness including (I) and excluding (E) embedded fibrous structures (F). For each site, the mean value within the region of interest was recorded as the measurement. The sum of the eight sites yielded DI (including fibrous structures) and DE (excluding fibrous structures). The fibrous component was calculated as DF = DI − DE, and expressed as a percentage: DF,% = 100 × DF/DI. All ultrasound assessments were performed by the same trained observer at each time point to minimize inter-observer variability.
2.4. Statistical Analysis
All analyses were conducted using MINITAB 17.2 (Minitab, Inc., State College, PA, USA). Descriptive data are reported as mean ± SD. Normality was assessed with the Kolmogorov–Smirnov test. As most variables met normality assumptions (p > 0.05), parametric tests were applied for consistency across outcomes. Paired Student’s t-tests were used to compare prerace vs. Stage 4 and prerace vs. Stage 7 values for BM, BMI, MII, WHR, WHtR; site-specific SAT thickness (UA, LA, ES, DT, BR, LT, FT, MC) including and excluding fibrous structures; total DI and DE; and DF components. Associations among variables were examined using Spearman’s correlation coefficient, chosen for its reduced sensitivity to outliers. Statistical significance was defined as p < 0.05.
3. Results
Environmental and elevation characteristics for each stage are presented in Table 1.

Table 1.
Stages of the Moravian Ultra Marathon: elevation profile and general weather conditions.
Baseline characteristics of the ultrarunners are summarized in Table 2.
Table 2.
Baseline characteristics and anthropometric data of ultrarunners.
3.1. Anthropometric and SAT Thickness Parameters and Their Changes During the Race
Baseline anthropometric variables (BM, BMI, MII, WHR, WHtR) and their values after Stage 4 (A4) and Stage 7 (A7) are shown in Table 3.
Table 3.
Anthropometric variables at prerace, after Stage 4 (A4), and after Stage 7 (A7).
The distribution of SAT excluding embedded fibrous structures at prerace, mid-race (after Stage 4), and post-race (after Stage 7) is shown in Figure 1. After Stage 4, significant absolute decreases were observed in the sum of DE (p = 0.001) and the sum of DI (p = 0.006), as well as at specific sites: UAE (p = 0.035), LAE (p = 0.001), LTE (p = 0.026), LTI (p = 0.028), and LAI (p = 0.002). Following Stage 7, further significant reductions were found in total DE (p < 0.001) and DI (p = 0.001), and at individual sites: LAE (p = 0.001), LTE (p = 0.014), FTE (p = 0.025), LAI (p = 0.004), LTI (p = 0.011), and FTI (p = 0.041).
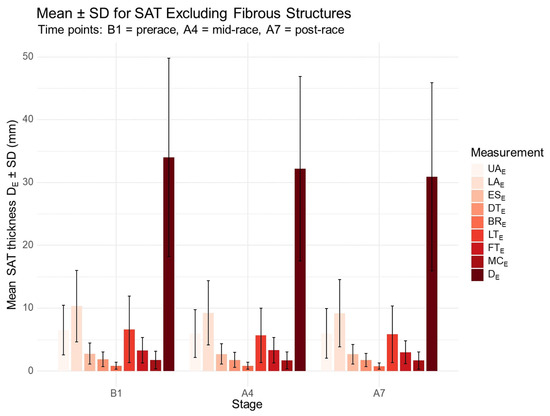
Figure 1.
Distribution of SAT thickness excluding fibrous structures at prerace and during the race. B1, prerace; A4, after Stage 4; A7, after Stage 7. UA, upper abdomen; LA, lower abdomen; ES, erector spinae; DT, distal triceps; BR, brachioradialis; LT, lateral thigh; FT, front thigh; MC, medial calf; E, excluding fibrous structures; DE, sum of SAT thicknesses at the eight sites excluding embedded fibrous structures.
Regarding associations between total SAT including and excluding fibrous structures, changes in DE from prerace to postrace (A7–B1) were significantly correlated with changes in LAE (r = 0.71, p < 0.001), UAE (r = 0.47, p = 0.037), and DTE (r = 0.52, p = 0.020). Similarly, changes in DI were significantly associated with changes in LAI (r = 0.79, p < 0.001) and LTI (r = 0.68, p = 0.001) over the same interval.
3.2. Individual Anthropometric Profiles and SAT Changes During the Race
At prerace, four male ultrarunners presented with BMI ≥ 25 kg·m−2; in one of these, WHR exceeded 0.90 and WHtR exceeded 0.50. After Stage 4, three athletes still exhibited BMI ≥ 25 kg·m−2, with one maintaining WHR > 0.90 and a DE of 56.9 mm. By post-race (after Stage 7), BMI ≥ 25 kg·m−2 persisted in two runners. Individual trajectories are illustrated in Figure 2.
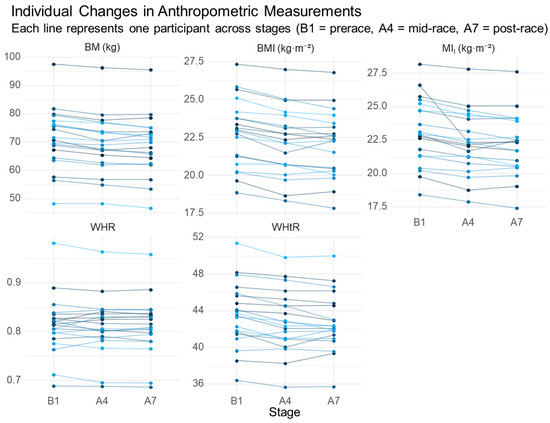
Figure 2.
Individual changes in anthropometric indices across the race. B1, prerace; A4, after Stage 4; A7, after Stage 7. BM, body mass; BMI, body mass index; MII, improved mass index; WHR, waist-to-hip ratio; WHtR, waist-to-height ratio. Each line represents one participant across stages (B1 = prerace, A4 = mid-race, A7 = post-race).
In these athletes, the corresponding sums of SAT excluding embedded fibrous structures (DE) ranged from 34.6 to 64.4 mm. After Stage 7, DE values ranged from 31.4 to 49.6 mm. A WHR > 0.90 was again observed in one runner, accompanied by a DE of 53.6 mm. Individual SAT trajectories are presented in Figure 3.
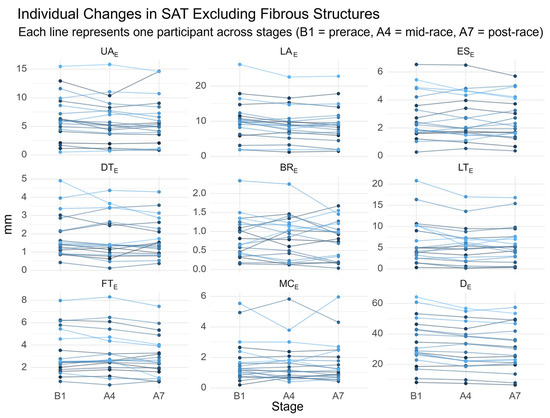
Figure 3.
Individual changes in SAT thickness excluding fibrous structures. UA, upper abdomen; LA, lower abdomen; ES, erector spinae; DT, distal triceps; BR, brachioradialis; LT, lateral thigh; FT, front thigh; MC, medial calf; e, excluding fibrous structures; De, sum of SAT thicknesses at the eight sites excluding embedded fibrous structures. Each line represents one participant across stages (B1 = prerace, A4 = mid-race, A7 = post-race).
Significant associations between prerace anthropometric indices and SAT distribution are summarized in Table 4. The strongest prerace associations were observed for BMI, followed by MII, WHtR, and BM, primarily with abdominal SAT measurements (UAE, UAI and LAE). WHR showed no significant relationships with any SAT parameter and is therefore not included in the table.
Table 4.
Significant prerace associations between anthropometric indices and SAT distribution.
Significant associations between anthropometric indices and SAT distribution at mid-race (A4) are summarized in Table 5. The strongest relationships were observed for BMI and MII, followed by WHtR. BM showed no significant association with any SAT site. As at prerace, WHR did not correlate significantly with SAT parameters and is therefore not included.
Table 5.
Significant mid-race (A4) associations between anthropometric indices and SAT distribution.
Significant post-race associations between anthropometric indices and SAT distribution are summarized in Table 6. As at earlier timepoints, WHR showed no significant relationships with SAT parameters and is therefore not included.
Table 6.
Significant post-race associations between anthropometric indices and SAT distribution.
The strongest associations were observed for BMI, followed by WHtR and MII. Body mass showed no significant correlation with any SAT site (Figure 4).
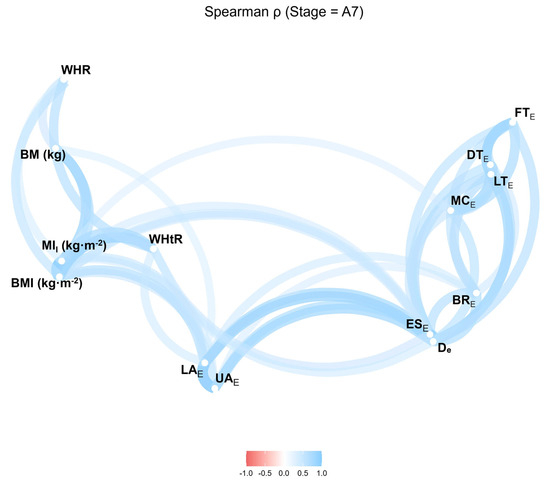
Figure 4.
Correlation network of anthropometric indices and SAT thicknesses excluding fibrous structures after Stage 7. BMI, body mass index; MII, improved mass index; WHR, waist-to-hip ratio; WHtR, waist-to-height ratio; UA, upper abdomen; LA, lower abdomen; ES, erector spinae; DT, distal triceps; BR, brachioradialis; LT, lateral thigh; FT, front thigh; MC, medial calf. Values range from −1.0 to 1.0 (Spearman’s r).
3.3. Embedded Fibrous Structures and Their Changes During the Race
The distribution of embedded fibrous structures at prerace and their changes during the race are summarized in Table 7.
Table 7.
Percentage distribution of embedded fibrous structures at prerace (B1), after Stage 4 (A4), and after Stage 7 (A7). Values are mean ± SD; * p < 0.05, ** p < 0.01 for comparisons between B1 vs. A4 and B1 vs. A7.
Prerace, the percentage of embedded fibrous structures (DF,%) was strongly and inversely associated with total SAT thickness, both excluding and including fibrous structures (r = −0.93, p < 0.001 for both). DF,% was also significantly negatively correlated with BMI, MII, and WHtR (r = −0.53, p = 0.015; r = −0.57, p = 0.009; r = −0.59, p = 0.006, respectively). Across the race, DF,% remained significantly inversely related to DE (r = −0.67, p = 0.002).
Post-race (after Stage 7), significant increases in fibrous content were observed at the upper abdomen (FUA,%, p = 0.022), lower abdomen (FLA,%, p = 0.014), erector spinae (FES,%, p = 0.038), and in overall DF,% (p = 0.001) (Table 7). At this timepoint, DF,% was significantly negatively associated with BMI (r = −0.50, p = 0.024), MII (r = −0.48, p = 0.034), WHtR (r = −0.48, p = 0.031), DE (r = −0.94, p < 0.001), and DI (r = −0.90, p < 0.001). Changes in FLA,% were inversely correlated with changes in LAE (∆FLA,% vs. ∆LAE: r = −0.64, p = 0.003).
4. Discussion
The principal finding of this study is that BMI, MII and WHtR were more strongly associated with ultrasound-derived SAT distribution than BM alone. These indices consistently correlated with total and regional SAT before, during, and after a 7-day ultramarathon, suggesting that they provide more informative indicators of adiposity and compositional change under real-world multistage race conditions.
4.1. Principal Findings in Context and Advancement of Knowledge
Across pre-, mid-, and post-race assessments, ultrasound-derived SAT decreased significantly, both when excluding and including embedded fibrous structures. The most pronounced site-specific reductions occurred at the abdomen and thighs–most consistently the lower and upper abdomen and the lateral thigh, and by race end also the front thigh–corresponding to regions with the highest prerace SAT thickness. This distribution aligns with previous ultrasound studies identifying the upper and lower abdomen and lateral thigh as key depots of subcutaneous fat [10,16,17]. Although BM declined over the race, it showed no significant association with site-specific SAT at any time point.
In contrast, BMI, MII, and WHtR closely tracked both total and regional SAT. At all timepoints, BMI and MII were associated with DE, DI, and abdominal and erector spinae SAT; WHtR showed similar relationships, whereas WHR demonstrated no significant association with SAT at any site and was elevated only in a single outlier. Taken together, these findings indicate that BMI, MII, and WHtR outperform BM as proxies for adiposity distribution in the context of a multistage ultramarathon.
These observations are consistent with broader evidence that WHtR can outperform BMI and waist circumference in capturing central fat distribution and cardiometabolic risk, while BMI alone has recognized limitations for body-composition assessment [1,5,18,19,20,21]. In this small, non-professional cohort, BMI did not clearly underperform MII, in contrast to previous reports [2]; differences in sample size, age range, and training status may contribute.
This study extends existing knowledge by implementing repeated, field-based, site-specific ultrasound assessments of SAT during a multistage ultramarathon and by incorporating microstructural characterization of embedded fibrous structures. The robust inverse relationships observed between the percentage of embedded fibrous structures and SAT thickness (particularly at the lower abdomen) across race stages are compatible with the hypothesis that sustained mechanical loading during multistage ultra-endurance exercise is accompanied by structural adaptations within SAT [2,11].
4.2. Practical Implications for Athletes, Coaches, and Support Teams
Monitoring: For routine field monitoring during multistage ultramarathons, BMI, MII, and WHtR provide more informative indicators of adiposity distribution than BM alone. WHR is not recommended as a primary index in this context.
Priority sites: When ultrasound is available, emphasis should be placed on the lower and upper abdomen and the thighs, which exhibit the earliest and most pronounced SAT changes and allow for efficient, site-sparse assessments.
Decision-making: Reductions in BM should not be interpreted as equivalent to fat loss. Combining simple anthropometric indices with site-specific ultrasound-derived SAT and basic hydration assessment offers a more appropriate basis for decisions on fueling and recovery between stages.
Risk management: Persistently elevated abdominal SAT in combination with higher BMI, MII, or WHtR may help identify athletes who could benefit from individualized body-composition management during preparation for multistage events.
4.3. Strengths and Limitations
Key strengths of this study include repeated, ecologically valid assessments at pre-, mid-, and post-race; site-specific ultrasound measurements of SAT with differentiation of embedded fibrous structures; and the combined evaluation of BMI, MII, and WHtR against BM to identify simple, field-feasible proxies. Intra-observer reliability was high (ICC > 0.95).
A primary limitation is that direct hydration markers (e.g., urine specific gravity/osmolality, bioimpedance-derived total body water, plasma osmolality) were not included in the present analyses. Consequently, short-term changes in BM cannot be clearly separated from fluid shifts. These hydration data were collected within the broader research program on this cohort and are reported elsewhere [22]; integrating them here would extend beyond the scope of this article, which specifically focuses on ultrasound-derived SAT and anthropometric indices.
Generalizability is further constrained by the small, predominantly male sample, the limited age range, and the focus on a single multistage event in non-professional runners. For embedded fibrous structures, normative data and construct validation are still emerging; related interpretations should therefore be regarded as preliminary and hypothesis-generating [2,11]. Finally, anthropometric indices–although useful–remain proxy measures and do not replace criterion body-composition methods.
4.4. Directions for Future Research
Future research should, firstly, integrate hydration endpoints collected in this cohort (e.g., urine specific gravity/osmolality, bioimpedance-derived total body water, plasma osmolality) with ultrasound-derived SAT measures (DE, DI, DF, DF,%) and anthropometric indices (BMI, MII, WHtR) across pre-, mid-, and post-race time points to distinguish fluid-related from tissue-related changes, and, where appropriate, link these analyses with the companion paper on hydration outcomes [22]. Secondly, ultrasound-derived measures (DE, DI, DF, DF,%) should be benchmarked against criterion methods such as DXA and MRI to quantify site-specific absolute and relative error, derive calibration equations, and establish minimal detectable changes. Thirdly, larger, sex-balanced cohorts from multiple multistage events should be enrolled, with analyses stratified by sex, training status, and age to enhance generalizability and explore potential sex × site interactions. Fourthly, predictive models ought to be developed and preregistered that combine prerace morphology, simple in-race indices (BMI, MII, WHtR), and site-specific SAT measures to forecast within-event adipose changes and recovery demands. Fifthly, direct comparisons of BMI and MII, and evaluation of whether WHtR consistently outperforms both for tracking regional SAT in multistage ultramarathons, should include discrimination, calibration, and reclassification metrics [7,10,16,17,23,24]. Finally, normative datasets for embedded fibrous structures (DF, DF,% by site) should be expanded across sports, sexes, and age groups, with assessment of temporal dynamics, relationships to performance and recovery, and formal evaluation of construct validity and inter- and intra-rater reliability to support standardized reporting.
5. Conclusions
In this 7-day multistage ultramarathon, BMI, MII, and WHtR–but not BM–closely reflected ultrasound-derived SAT distribution across pre-, mid-, and post-race assessments. The largest SAT reductions occurred at the abdomen and thighs, while WHR showed no meaningful associations apart from a single outlier.
Given the small, predominantly male sample and the absence of integrated hydration analysis, these findings should be regarded as preliminary. The combined use of site-specific ultrasound and simple anthropometric indices appears promising for field monitoring of body composition in multistage ultrarunners, but confirmation in larger, sex-balanced cohorts with standardized hydration assessment is needed before definitive recommendations can be made.
Author Contributions
Conceptualization, D.C., T.R. and B.K.; methodology, D.C. and I.K.; software, I.K.; data collection and field organization, D.C.; data analysis, D.C. and I.K.; writing—original draft preparation, D.C.; writing—review and editing, D.C., B.K., K.W. and I.K.; supervision, D.C. and B.K. All authors have read and agreed to the published version of the manuscript.
Funding
This research received no external funding.
Institutional Review Board Statement
The study was conducted in accordance with the Declaration of Helsinki and approved by the Ethics Committee of the Centre of Sports Activities at Brno University of Technology, Czech Republic (Approval No. 1/2016; 16 May 2016).
Informed Consent Statement
Informed consent was obtained from all subjects involved in the study.
Data Availability Statement
The raw data supporting the conclusions of this article will be made available by the authors on request.
Acknowledgments
The authors thank Marietta Sengeis (Leitung Fachbereich Anthropometrie) for conducting the anthropometric and ultrasound assessments. We also thank the organizers and staff of the Moravian Ultra Marathon for their valuable support, and we are especially grateful to the participating athletes for their commitment and cooperation.
Conflicts of Interest
Authors Beat Knechtle, Katja Weiss and Thomas Rosemann were employed by Gesundheitszentrum St. Gallen. The authors declare no conflicts of interest.
Abbreviations
The following abbreviations are used in this manuscript:
| BM | body mass |
| BMI | body mass index |
| MII | improved mass index |
| WHR | waist-to-hip ratio |
| WHtR | waist-to-height ratio |
| SAT | subcutaneous adipose tissue |
| UA | upper abdomen |
| LA | lower abdomen |
| ES | erector spinae |
| DT | distal triceps |
| BR | brachioradialis |
| LT | lateral thigh |
| FT | front thigh |
| MC | medial calf |
| D | sum of SAT thicknesses at eight sites |
| F | embedded fibrous structures |
| I | including (fibrous structures) |
| E | excluding (fibrous structures) |
| DI | sum of SAT thicknesses at eight sites including fibrous structures |
| DE | sum of SAT thicknesses at eight sites excluding fibrous structures |
| DF | absolute amount of embedded fibrous structures |
| DF,% | percentage of embedded fibrous structures |
| B1 | prerace |
| A4 | after Stage 4 |
| A7 | after Stage 7 |
| ∆ | change |
| DXA | dual-energy X-ray absorptiometry |
| BIA | bioelectrical impedance analysis |
References
- Ashwell, M.; Gunn, P.; Gibson, S. Waist-to-height ratio is a better screening tool than waist circumference and BMI for adult cardiometabolic risk factors: Systematic review and meta-analysis. Obes. Rev. 2012, 13, 275–286. [Google Scholar] [CrossRef] [PubMed]
- Müller, W.; Fürhapter-Rieger, A.; Ahammer, H.; Lohman, T.G.; Meyer, N.L.; Sardinha, L.B.; Stewart, A.D.; Maughan, R.J.; Sundgot-Borgen, J.; Müller, T.; et al. Relative Body Weight and Standardised Brightness-Mode Ultrasound Measurement of Subcutaneous Fat in Athletes: An International Multicentre Reliability Study, Under the Auspices of the IOC Medical Commission. Sports Med. 2020, 50, 597–614. [Google Scholar] [CrossRef] [PubMed]
- Müller, W. Determinants of ski jump performance and implications for health, safety and fairness. Sports Med. 2009, 39, 85–106. [Google Scholar] [CrossRef] [PubMed]
- Müller, W. Towards research-based approaches for solving body composition problems in sports: Ski jumping as a heuristic example. Br. J. Sports Med. 2009, 43, 1013–1019. [Google Scholar] [CrossRef] [PubMed]
- Czernichow, S.; Kengne, A.P.; Stamatakis, E.; Hamer, M.; Batty, G.D. Body mass index, waist circumference and waist-hip ratio: Which is the better discriminator of cardiovascular disease mortality risk evidence from an individual-participant meta-analysis of 82 864 participants from nine cohort studies. Obes. Rev. 2011, 12, 680–687. [Google Scholar] [CrossRef] [PubMed]
- Ashwell, M.; Mayhew, L.; Richardson, J.; Riskayzen, B. Waist-to-height ratio is more predictive of years of life lost than body mass index. PLoS ONE 2014, 9, e103483. [Google Scholar] [CrossRef] [PubMed]
- Ackland, T.R.; Lohman, T.G.; Sundgot-Borgen, J.; Maughan, R.J.; Meyer, N.L.; Stewart, A.D.; Müller, W. Current status of body composition assessment in sport: Review and position statement on behalf of the Ad Hoc Research Working Group on Body Composition Health and Performance, under the auspices of the I.O.C. Medical Commission. Sports Med. 2012, 42, 227–249. [Google Scholar] [CrossRef] [PubMed]
- Müller, W.; Horn, M.; Fürhapter-Rieger, A.; Kainz, P.; Kröpfl, J.M.; Maughan, R.J.; Ahammer, H. Body composition in sport: A comparison of a novel ultrasound imaging technique to measure subcutaneous fat tissue compared with skinfold measurement. Br. J. Sports Med. 2013, 47, 1028–1035. [Google Scholar] [CrossRef] [PubMed]
- Stewart, A.D.; Hannan, W.J. Prediction of fat and fat-free mass in male athletes using dual X-ray absorptiometry as the reference method. J. Sports Sci. 2000, 18, 263–274. [Google Scholar] [CrossRef] [PubMed]
- Sengeis, M.; Müller, W.; Störchle, P.; Führhapter-Rieger, A. Body weight and subcutaneous fat patterning in elite judokas. Scand. J. Med. Sci. Sports. 2019, 29, 1774–1788. [Google Scholar] [CrossRef] [PubMed]
- Ackland, T.R.; Müller, W. Imaging Method: Ultrasound. In Best Practice Protocols for Physique Assessment in Sport; Hume, P., Kerr, D., Ackland, T., Eds.; Springer: Singapore, 2018; pp. 131–141. [Google Scholar]
- Stewart, A.; Marfell-Jonesm, M.; Olds, T.; de Ridder, J.H. International Standards for Anthropometric Assessment; International Society for the Advancement of Kinanthropometry: Lower Hutt, New Zealand, 2011. [Google Scholar]
- Müller, W.; Lohman, T.G.; Stewart, A.D.; Maughan, R.J.; Meyer, N.L.; Sardinha, L.B.; Ackland, T.R. Subcutaneous fat patterning in athletes: Selection of appropriate sites and standardization of a novel ultrasound measurement technique: Ad hoc working group on body composition, health and performance, under the auspices of the IOC Medical Commission. Bri. J. Sports Med. 2016, 50, 45–54. [Google Scholar] [CrossRef] [PubMed]
- Herman, I.P. Physics of the Human Body; Springer: Berlin/Heidelberg, Germany; New York, NY, USA, 2007; p. 559. [Google Scholar]
- Müller, W.; Maughan, R.J. The need for a novel approach to measure body composition: Is ultrasound an answer? Br. J. Sports Med. 2013, 47, 1001–1002. [Google Scholar] [CrossRef] [PubMed]
- Störchle, P.; Müller, W.; Sengeis, M.; Ahammer, H.; Fürhapter-Rieger, A.; Bachl, N.; Lackner, S.; Mörkl, S.; Holasek, S. Standardized Ultrasound Measurement of Subcutaneous Fat Patterning: High Reliability and Accuracy in Groups Ranging from Lean to Obese. Ultrasound Med. Biol. 2017, 43, 427–438. [Google Scholar] [CrossRef] [PubMed]
- Kelso, A.; Trájer, E.; Machus, K.; Treff, G.; Müller, W.; Steinacker, J.M. Assessment of subcutaneous adipose tissue using ultrasound in highly trained junior rowers. Eur. J. Sport Sci. 2017, 17, 576–585. [Google Scholar] [CrossRef] [PubMed]
- World Health Organization; International Association for the Study of Obesity; International Obesity Task Force. The Asia-Pacific Perspective: Redefining Obesity and Its Treatment; Health Communications Australia: Sydney, Australia, 2000. [Google Scholar]
- Mohammadian Khonsari, N.; Khashayar, P.; Shahrestanaki, E.; Kelishadi, R.; Mohammadpoor Nami, S.; Heidari-Beni, M.; Esmaeili Abdar, Z.; Tabatabaei-Malazy, O.; Qorbani, M. Normal Weight Obesity and Cardiometabolic Risk Factors: A Systematic Review and Meta-Analysis. Front. Endocrinol. 2022, 13, 857930. [Google Scholar] [CrossRef] [PubMed]
- Garvey, W.T.; Mechanick, J.I.; Brett, E.M.; Garber, A.J.; Hurley, D.L.; Jastreboff, A.M.; Nadolsky, K.; Pessah-Pollack, R.; Plodkowski, R.; Reviewers of the AACE/ACE Obesity Clinical Practice Guidelines. American association of clinical endocrinologists and American college of endocrinology comprehensive clinical practice guidelines for medical care of patients with obesity. Endocr. Pract. 2016, 3, 1–203. [Google Scholar] [CrossRef] [PubMed]
- Schneider, H.J.; Friedrich, N.; Klotsche, J.; Pieper, L.; Nauck, M.; John, U.; Dörr, M.; Felix, S.; Lehnert, H.; Pittrow, D.; et al. The predictive value of different measures of obesity for incident cardiovascular events and mortality. J. Clin. Endocrinol. Metab. 2010, 95, 1777–1785. [Google Scholar] [CrossRef] [PubMed]
- Chlíbková, D.; Nikolaidis, P.; Rosemann, T.; Knechtle, B.; Bednář, J. Fluid metabolism in athletes running seven marathons in seven consecutive days. Front. Physiol. 2018, 9, 91. [Google Scholar] [CrossRef] [PubMed]
- Oppert, J.M.; Charles, M.A.; Thibult, N.; Guy-Grand, B.; Eschwege, E.; Ducimetiére, P. Anthropometric estimates of muscle and fat mass in relation to cardiac and cancer mortality in men: The Paris Prospective Study. Am. J. Clin. Nutr. 2002, 75, 1107–1113. [Google Scholar] [CrossRef] [PubMed]
- Hoffman, M.D.; Lebus, D.K.; Ganong, A.C.; Casazza, G.A.; Van Loan, M. Body composition of 161-km ultramarathoners. Int. J. Sports Med. 2010, 31, 106–109. [Google Scholar] [CrossRef] [PubMed]
Disclaimer/Publisher’s Note: The statements, opinions and data contained in all publications are solely those of the individual author(s) and contributor(s) and not of MDPI and/or the editor(s). MDPI and/or the editor(s) disclaim responsibility for any injury to people or property resulting from any ideas, methods, instructions or products referred to in the content. |
© 2025 by the authors. Licensee MDPI, Basel, Switzerland. This article is an open access article distributed under the terms and conditions of the Creative Commons Attribution (CC BY) license (https://creativecommons.org/licenses/by/4.0/).