Abstract
Increasing CO2 gas emissions results in climate change by increasing air temperature and worsening environmental problems. It is necessary to control CO2 gas in the air to overcome this. This research aims to optimize the absorption of CO2 gas in the air with 0.1 M NaOH absorbent in the column of the Raschig ring stuffing material using the response surface methodology (RSM). This research was conducted using a continuous system of three independent variables by varying the contact time (10–80 min), the flow rate of NaOH absorbent (2–5 L/min), and the flow rate of CO2 gas (1–5 L/min). The response variables in this study were the absorption rate (L/min) and mass transfer coefficient, while the air flow rate was constant at 20 L/min. Air and CO2 gas mix before absorption occurs and flow into the Raschig ring packing column so that contact occurs with the NaOH absorbent. Mass transfer of CO2 gas occurs into the NaOH absorbent, resulting in absorption. The results showed that the effect of contact time (min), the flow rate of NaOH absorbent (L/min), and CO2 gas flow rate individually and the interaction on CO2 absorption rate and mass transfer coefficient were very significant at a p-value of 0.05. Chemical absorption of CO2 also occurred due to the reaction between CO2 and OH- to form CO32− and HCO3−, so the pH decreased, and the reaction was a function of pH. Optimization using Design Expert 13 RSM Box–Behnken Design (BBD) yielded optimal conditions at an absorption time of 80 min, NaOH absorbent flow rate of 5 L/min, CO2 gas flow rate of 5 L/min, absorption rate of CO2 gas of 3.97 L/min, and CO2 gas mass transfer coefficient of 1.443 mol/min m2 atm, with the desirability of 0.999 (≈100%).
1. Introduction
Air pollution and climate change have become major challenges for sustainable development related to CO2 emissions [1]. Environmental degradation caused by various human activities, especially CO2 emissions, is responsible for many disasters around the world, such as prolonged droughts, fires, tsunamis, and floods [2]. Increased CO2 emissions cause severe environmental problems, such as climate change and melting glaciers [3,4], and are predicted to continue to increase, reaching a peak in 2030 [5]. Various alternative ways of CO2 control proposed for the development include converting CO2 into chemicals [6,7]. They comprehensively explored the factors that contribute to CO2 uptake by nanofluids, mainly addressing the role of base fluids and the reasons for their choice was reported by (Aghel et al., 2022) [8]. Utilization of CO2 is for catalytic conversion [9], electrocatalytic reduction [10], photocatalytic reduction [11], thermocatalysis, green hydrogen from renewable energy sources, and transformation of CO2 into materials [12,13,14]. However, managing air pollution and greenhouse emissions has not achieved the expected synergistic results.
Researchers call for coordinated efforts to improve air quality and combat climate change [15]. The adverse effects of CO2 emissions are felt by developed countries (G7) [16]. Indicators of climate change include heat waves, floods, droughts, and heavy rainfalls. To prevent such a calamity, the United Nations Framework Convention on Climate Change established an international environmental agreement to restrict the average global temperature increase to <2 °C. Lowering CO2 emissions is a response to climate change because greenhouse gas buildup alters the atmosphere and captures solar energy at the earth’s surface. CO2 is released in various circumstances, including the combustion of oil, coal, gas, petroleum, petrochemicals, and deforestation [17].
(Tollefson, 2017) [18], asserts that if greenhouse gases remain elevated, global temperatures will rise by 5–6 °C by the end of the century. This warning was reiterated in the results of the Glasgow Climate Pact (COP26), which stated that climate regulators will need to achieve net-zero emissions by 2050 through significant decreases in emissions of greenhouse gases. The gradual rise in climate-related dangers has spurred nations to shift the modes of development of existing economies in a low-carbon direction [16,19] and build tactics to lower carbon emissions and advance the Paris Agreement’s objectives [20]. As a result, 190 parties have ratified the Paris Agreement as of January 2021, pledging to develop a low-carbon economy. However, in their pursuit of low-carbon development, nations confront a paradox: energy is a crucial driver of economic development, but fossil energy has a negative impact on the environment and contributes to greenhouse gas emissions [21,22].
The environmental challenges faced are how to produce safer and less expensive energy while reducing greenhouse gas emissions [23]. Solving this challenge requires finding alternative energy sources and capturing CO2 gas [24,25]. The primary sources of global warming are greenhouse gases, with carbon dioxide having the most significant impact [26,27]. The problems caused by global warming include an increase in natural disasters, a rise in sea level, desertification, and biodiversity loss, all of which pose a grave threat to human life and development [26,27]. A study by Sharma et al., 2023 reported on the enhanced electron transfer and ion diffusion from the unique MgV and graphene oxide. The MgV/reduced graphene oxide composite delivers excellent capability in the detection of sulfadiazine in real samples of human blood serum [28]. More than one hundred countries have signed the Kyoto Protocol, whose primary objective is to reduce carbon emissions in order to safeguard humanity from the peril of global warming. The long-term objective of the Paris Agreement of 2016 is to keep global average temperature increases to less than 2 °C above pre-industrial levels and to work toward limiting temperature increases to 1.5 °C above pre-industrial levels. To support the reduction of greenhouse gas emissions as the primary cause and have the most significant impact, specifically regarding CO2 gas [26,27], this research concentrates on reducing CO2 through the absorption process in the packing column and optimization via RSM BBD.
The difference in the research that has been carried out lies in the materials, chemical composition, operating conditions, desired target, capacity, tools used for the application, and optimization. Several studies are listed in Table 1 and Table 2.

Table 1.
Flue gas composition typical of a real coal-fired power plant and the intended industrial incinerator unit.
Table 2.
Pilot for CO2 capture from flue gas and using MEA-based technology.
Multi-purpose optimization methods are widely used to support decision-makers in overcoming problems with different objectives, from one side wanting to obtain the maximum benefit and the other side preserving the environment and promoting sustainable development. However, with increasingly stringent global CO2 emission laws, we face the challenge of balancing conflicting commercial and environmental objectives simultaneously [17,26,27]. This research optimizes CO2 gas column filling materials using Raschig ring and absorbent NaOH 0.1 M. The studied attributes are flooding, absorption rate, CO2 gas mass contraction coefficient, and optimal conditions.
2. Materials and Methods
2.1. Materials
NaOH (Merck), HCl (Merck), phenolphthalein indicator, methyl orange, distilled water, and CO2 gas in cylinders purchased by order from PT Aneka Gas in Medan City, North Sumatra Province, Indonesia.
2.2. Experimental
The equipment used included a filling absorption column consisting of a glass column, packing material (packing) Raschig ring type glass, absorbent pump, air compressor, regulator, and flow meter for absorption. CO2 gas cylinders were used, complete with pressure regulators and supporting equipment, namely pH meters, Dosimat 632, beakers, measuring cups, and pipettes. The working method was changing the pressure drop (P) in dry and wet conditions; filling in flooded conditions; filling absorbed and non-absorbed gas in glass; and using chemical means by varying the flow rate of CO2 gas and air, then mixing them. Two gas variations in the flow rate of 0.1 M NaOH absorbent, height, and diameter of the packing ring on a fixed column were used. The response variables were the absorption rate and mass contraction coefficient. The experimental design tested the effect of each variable, the effect of interaction, and optimization using Design Expert 13, Response Surface Methodology, Box–Behnken Design (RSM-BBD), and subtype random. A series of equipment using an absorption column was located in the Chemical Engineering Laboratory, Faculty of Engineering, Syiah Kuala University. The schematic procedure of the CO2 gas absorption process using 0.1 M NaOH absorbent in the packing Raschig ring column is shown in Figure 1.
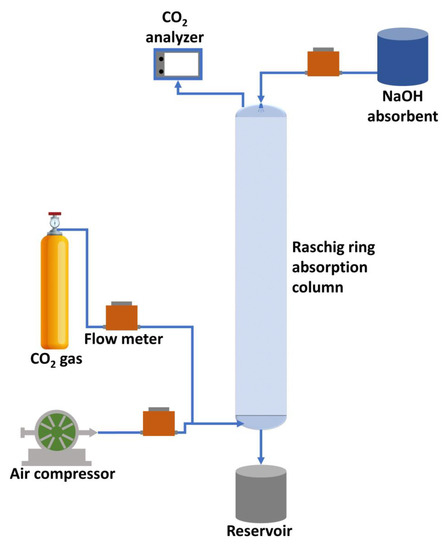
Figure 1.
Schematic procedure of the CO2 absorption process using 0.1 M NaOH absorbent in the Raschig ring packing column.
2.2.1. Calculation Principles Used
Yo is the mole fraction of CO2 gas that is not absorbed; for the ideal gas fraction volume, it is the same as the mole fraction. From the incoming gas, the gas (air) flow rate enters (F2), and the CO2 flow rate enters (F3) so that the mole fraction of gas entering [42]:
If the Fa of CO2 gas is absorbed (L/s), then
From Equations (2) and (3), we obtain:
To convert the absorbed CO2 flow rate, Fa(L/s) to Ga(gmol/s) [43,44,45,46]:
2.2.2. Determination of the Overall Mass Transfer Coefficient (kog) [42,43]
The overall mass transfer coefficient, which controls the rate at which reactants and products are moved between the gas and liquid phases, is a crucial metric to compute in the conversion of CO2. This parameter impacts the mass transit rate of CO2 from the gas phase to the liquid phase and the rate of CO2 absorption into a liquid solvent in the context of CO2 conversion.
The general equation used for absorption is presented in Equation (6):
where:
- Y* = the mole fraction of the gas in equilibrium with the liquid at some point in the column
- Y = bulk mole fraction
- A = column cross-sectional area
- H = height of the infill material in the column
- a = specific area of the stuffing material/unit volume of the stuffing material
The right-hand side is difficult to determine, so it can be determined more thoroughly as follows:
N = kog (a.A.H) log average driving force pressure drop [46,47,48,49,50].
- where:
- N = absorption rate (gmol/s)
- A = column cross-sectional area
- H = column height
- AH = column volume
- a.A.H = mass transfer area
So that:
where:
- pi = partial pressure of incoming CO2 gas
- po = partial pressure of outgoing CO2 gas
2.2.3. Determination of Absorption of CO2 Based on Chemical Reactions
The CO2 is absorbed by the standard NaOH solution, and the normality of the solution will be affected. A mixture of carbonates and bicarbonates can be determined by titration with standard acid solutions using phenolphthalein and methyl orange indicators. The carbonate ion is usually titrated as a base with a strong acid, resulting in a reaction as shown in Equations (8) and (9). In Table 3, ions formed at various temperatures are enumerated.
Table 3.
Ions formed at different temperatures.
Phenolphthalein has a pH range of 8.0 to 9.6, which is a suitable indicator for the first endpoint, while methyl orange has a pH range of 3.1 to 4.4, which is suitable for the second endpoint. Therefore, mixtures of carbonate and bicarbonate or carbonate and hydroxide can be titrated with standard HCl to both endpoints. Table 4 depicts the correlation between titration volume and carbonate titrations.
Table 4.
Relationship of titration volume in carbonate titrations.
2.2.4. Experimental Design
Statistical design of experiments (DOE) is an effective method for devising experiments that, after data analysis, yield valid and objective conclusions. Two main applications of experimental setup were evaluated to identify the variables that affect the experiment and its optimum conditions [51]. The regression and graphical analysis of the data were performed using Design Expert 13.0.11.0 (Stat-Ease Inc., Minneapolis, MN, USA). The Box–Behnken design (BBD) is the most common RSM design. To obtain optimal levels of CO2 gas absorption and mass transfer coefficient, RSM was used to analyze the response patterns and determine the optimal combination of variables expected to produce optimal conditions. This study involved three variables labeled X1 (absorption time), X2 (absorption flow rate of 0.1 M NaOH), and X3 (absorption concentration) (CO2 gas flow rate). This experiment’s experimental design is outlined in Table 1. CO2 is the absorption flow rate, and CO2 is the gas mass transfer coefficient, denoted by Y1 and Y2, respectively. The relationship between classified and actual variables is expressed as Equation (10) for statistical analysis.
where, xi represents the independent variable or its dimensionless value, X1 is the independent real value, X2 is the independent real value at the center point, and ΔX is the step change value. The elimination of lead is the dependent variable or the response. In addition, the behavior of the system is described by the following second-order polynomial model, Equation (11).
where, Y is the predicted response; xi, xj, …, xk are the input variables affecting the Response Y; xi2, xj2, …, xk2 are the square effects; xixj, xixk, and xjxk are the interaction effects; βo is the intercept term; βi (i = 1, 2, …, k) is the linear effect; βii (i = 1, 2, …, k) is the square effect; βij (i = 1, 2, …, k; j = 1, 2, …, k) is the interaction effect; and ε is random error. For this research, Equation (11) is written as Equation (12).
Yi = β0 + β1 x1 + β2 x2 + β3 x3 + β11 x21 + β22 x22 + β33 x23 + β12 x1 x 2 + β13 x1 x3 + β23 x2 x3
The data from Table 5 were used for the ANOVA and multiple regression analyses in the Box–Behnken design with polynomial model Equation (12).
Table 5.
Design and analysis of experiments for absorption.
From the data in Table 5, it can be seen that there is an increase in CO2 absorption rate and CO2 gas mass transfer coefficient with absorption time and CO2 gas flow rate. Table 6 displays BBD and the response of various parameters to distinct absorption conditions.
Table 6.
BBD and the response of different parameters at various absorption conditions.
3. Results and Discussion
3.1. ANOVA in the Regression Model
The data in Table 5 was taken into account for ANOVA and multiple regression analyses in the Box–Behnken design using polynomial model Equation (12). The results are shown in Table 7 and Table 8.
Table 7.
Analysis of variance of CO2 gas absorption flow rate (Y1, Fa).
Table 8.
Analysis of variance of CO2 gas mass transfer coefficient.
Table 7 shows the report contains a summary of the criteria and constraints used to generate the optimal solution for the process; all the criteria were applied to find the optimal setting. A solution is a search of all the solutions given to see which one best meets the specified criteria. The CO2 absorption design and optimization model in this study is suitable for use as an alternative in the chemical industry or industries that emit a lot of CO2 gas into the air, such as the cement industry, exhaust gas sources, natural gas burners, natural gas turbines, fuel-fired power plants, and coal, to absorb CO2 gas before it is discharged into the air by adjusting the amount as needed. For example, the CO2 gas produced is adjusted to the CO2 absorption capacity and the scale ratio according to the needs of the desired CO2 absorption capacity. The research model can be used as a pilot plant for CO2 absorption before being discharged into the air as an alternative in the future to reduce CO2 emissions into the air, which can cause global warming [28,29,30,31,32,33,34,35,36,37,38,39,40].
3.2. Fitting the Model
Analysis of variance (ANOVA) and multiple regression analysis were employed to evaluate the effects of individual and interaction factors using Design Expert 13. Box–Behnken design is the most frequently used RSM design, and the model equation is applied to predict the optimum CO2 gas absorption flow rate (Y1) and CO2 gas mass transfer coefficient (Y2).
The final equation in terms of coded factors is presented in Equation (13):
Y1 = 2.96 + 0.37 X1 + 0.14 X2 + 1.35 X3 + 0.0012 X1 X 2 + 0.213 X1 X 3 − 0.1 X2 X 3 − 0.47 X12 − 0.23 X22 − 0.28 X32
The final equation in terms of actual factors is presented in Equation (14):
Y1 = −2.44 + 0.036 X1 + 0.897 X2 + 1.07 X3 + 0.000023 X1 X 2 + 0.00304 X1 X3 − 0.033 X2 X 3 − 0.00039 X12 − 0.1007 X22 − 0.07 X32
The model equation was applied to predict the optimum CO2 gas mass transfer coefficient (Y2, kog).
The final equation in terms of coded factors is shown in Equation (15):
Y2 = 1.39 + 0.034 X1 + 0.012 X2 + 0.119 X3 + 0.0083 X1 X 2 + 0.038 X1 X 3 − 0.0063 X2 X 3 − 0.033 X12 − 0.026 X22 − 0.092 X32
The final equation in terms of actual factors is shown in Equation (16):
where Y1 is the predicted CO2 gas absorption flow rate response, and Y2 is the CO2 gas mass transfer coefficient. Meanwhile, X1, X2, and X3 are independent variables for absorption time, absorption flow rate, and CO2 gas flow rate, respectively.
Y2 = 0.82 + 0.00122 X1 + 0.0863 X2 + 0.18 X3 + 0.00016 X1 X 2 + 0.00543 X1 X3 − 0.0021 X2 X 3 − 0.00003 X12 − 0.01132 X22 − 0.023 X32
Based on the equation, it was shown that the influence of absorption times (X1), absorption flow rate (X2), and CO2 gas flow rate affected the CO2 absorption rate and CO2 gas mass transfer coefficient. These effects can be observed from the intercept and coefficients of the three optimization equations.
Figure 2 illustrates the influence of interactive variables. Figure 2a displays the experimental and predicted data plot. The value predicted by the design response surface equation has a high degree of accuracy (R2 = 0.97) and has an intercept of 1.00663. The distribution point spread above the prediction line demonstrates this. To obtain a respectable model, we must examine the normal probability value (%). As shown in Figure 2b, the proposed equation model is appropriate for predicting the CO2 gas absorption flow rate (Y1) and CO2 gas mass transfer coefficient (Y2) when using absorbent NaOH 0.1 M. The value predicted by the design response surface equation is precise (R2 = 0.94) and has an intercept of 1.25048. The correlation of the variable effects on variable responses can be seen in Figure 2, Figure 3, Figure 4, Figure 5 and Figure 6.
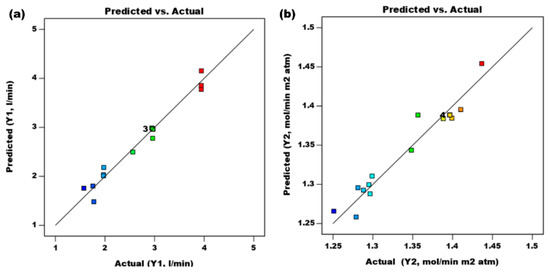
Figure 2.
Correlation between actual and predicted results for CO2 gas mass flow rate and CO2 gas mass damping coefficient: (a) R2 = 0.97 and (b) R2 = 0.94.
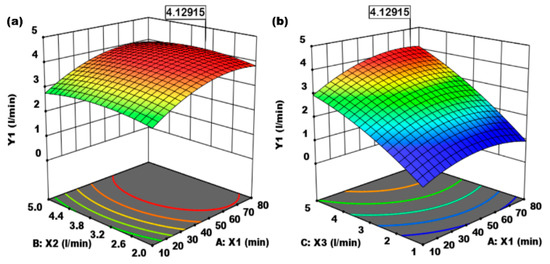
Figure 3.
(a) Effect of absorption time (X1, min) and absorbent flow rate (X2, L/min) on CO2 gas absorption flow rate (Y1, L/min). (b) Effect of absorption time (X1, min) and CO2 gas flow rate (X3, L/min) on CO2 gas absorption flow rate (Y1, L/min).
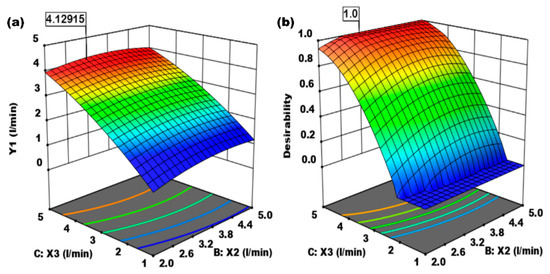
Figure 4.
(a) Effect of absorbent flow rate (X2, L/min) and CO2 gas flow rate (X3, L/min) on CO2 absorption flow rate. (b) Effect of absorbent flow rate (X2, L/min) and CO2 gas flow rate (X3, L/min) on the desirability.

Figure 5.
(a) Effect of absorption time (X1, min) and absorbent flow rate (X2, L/min) on mass transfer coefficient of CO2 gas (mol/min m2 atm). (b) Effect of absorption time (X1, min) and CO2 gas flow rate (X3, L/min) on mass transfer coefficient of CO2 gas (mol/min m2 atm).
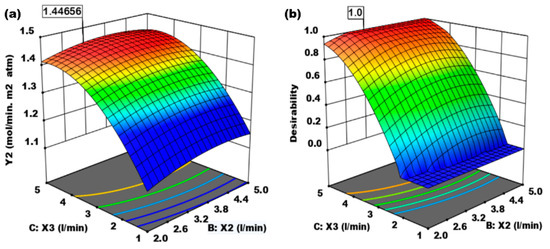
Figure 6.
(a) Effect of the absorbent flow rate of 0.1 M NaOH (X2, L/min) and CO2 gas flow rate (X3, L/min) on mass transfer coefficient of CO2 gas. (b) Effect of the absorbent flow rate (X2, L/min) and CO2 flow rate (X2, L/min) on the desirability.
In Figure 2, NaOH is wholly neutralized at the phenolphthalein endpoint, Na2CO3 is half neutralized, and HCO3− has not responded. From the phenolphthalein endpoint to the methyl symbol endpoint, the bicarbonate is neutralized. Therefore, only a few drops of titrant will be required for the NaOH to change from pH 8 to 4, which will be corrected with a blank indicator. As shown in Table 4, v1 is the volume of acid in millimeters used from the start of the titration to the phenolphthalein endpoint, and v2 is the volume from the phenolphthalein endpoint to methyl orange.
During the absorption of CO2 gas, a reaction occurs between CO2 and OH− because the pH value decreases, and the reaction proceeds according to the following criteria. If pH = 11.5, the reaction is:
2 OH− + CO2 → CO32− + H2O
If pH = 10, the reaction is:
CO32− + CO2 + H2O → 2 HCO3−
If pH = 11, the reaction is:
OH− + CO2 → HCO3−
After absorption of CO2 gas, a mixture of OH−, CO3−, and HCO3− ions occurs in the solution [25,34]. Sample titration using HCl whose molarity is known (HCl standard) will obtain two equivalence points. In the first step, OH− reacts as a whole, whereas HCO3− reacts only in the second step, and CO32− splits in both. Therefore, direct calculation of the concentration is not possible but can be calculated if the p-value and m-value have been determined. The p-value (phenolphthalein price) is the volume of titration used to titrate 1 mol/L HCl for 1000 mL so that the color of the phenolphthalein indicator changes (or to a pH of 8.2 using a glass electrode). The M-value (methyl orange value) is the volume used to titrate 1000 mL of HCl mol/L (1 M) sample until the color of the methyl orange indicator changes (or at pH 4.3 by using a glass electrode). The formulas used in this regard are as follows: p-value = V × M × 1000/aliquot, where V = volume of titration (mL), M = molarity of HCl used, aliquots = volume of sample titrated, , , and
CO2 absorption is a function of pH; the reaction that occurs is a function of pH; the increasing absorption of CO2, which continues to increase, is a function of pH, solubility, thermal, and longitudinal diffusion; the mechanism of mass contraction is the driving force in the form of differences in CO2 concentrations and the partial pressure of each component and total pressure; the formula used is pH dependent, as it is determined by pH [51,52], and the reaction is according to the following criteria. If the pH value < 4.5, then . If the pH value is between 4.5–8.3, then . If the pH value is between 8.3–9.5, then . Suppose the pH value is >9.5. Then calculated from Equation (2).
Figure 3a,b shows the 3-D optimization of the effect of absorption time (minutes), the flow rate of 0.1 M NaOH absorbent (L/min), and the flow rate of CO2 gas mixed with air (L/min) on the absorption rate of CO2 gas in the Raschig packing column ring.
Figure 3a shows the effect of absorption time (X1, min) and absorbent flow rate (X2, L/min) on CO2 gas absorption flow rate (Y1, L/min). The effect of the two independent variables on the response variable (CO2 gas absorption) increased, and optimal conditions were reached at 4.13 L/min. Figure 3b shows the desired optimization of the effect of absorption time (minutes), the flow rate of 0.1 M NaOH absorbent (L/min), and air-mixed CO2 flow rate (L/min) on the absorption rate of CO2 gas in the Raschig ring packing column. The effects of absorption time (X1, min) and CO2 gas flow rate (X2, L/min) on CO2 gas absorption rate (Y1, L/min) increased until it reached the optimum condition of 4.13 (L/min).
Figure 4a,b show the 3-D optimization of the effect of absorption time (minutes), the flow rate of 0.1 M NaOH absorbent (L/min), and CO2 gas flow rate (L/min) on the mass transfer coefficient of CO2 gas in the Raschig ring packing column. Figure 4a shows the effect of absorbent flow rate (X2, L/min) and CO2 gas flow rate (X3, L/min) on the CO2 absorption flow rate. The absorption rate of CO2 gas increases until it reaches optimum conditions, which are reached at a value of 4.1292. Figure 4b shows the effect of absorbent flow rate (X2, L/min) and CO2 gas flow rate (X3, L/min) on desirability. Desirability can be increased by choosing the proper criteria in planning the constraints to achieve the best optimal conditions. The best condition is achieved at the desired value of 0.99999.
Figure 5a shows the effect of absorbent flow rate (X2, L/min) and CO2 gas flow rate (X3, L/min) on the CO2 absorption flow rate. The CO2 absorption flow rate continues to increase so that optimum conditions are reached at 4.13 L/min. Figure 5b shows the desired optimization of the effects of absorption time (minutes), the flow rate of 0.1 M NaOH absorbent (L/min), and the CO2 gas flow rate (L/min) on the mass transfer coefficient of CO2 gas in the column packing Raschig ring. Based on the analysis and optimization of 3-D plots, the optimum conditions for the CO2 uptake rate are 1.44656 L/min, and the mass transfer coefficient for CO2 gas is 1.44656 mol/min m2 atm.
Figure 6a shows the effect of the absorbent flow rate of 0.1 M NaOH (X2, L/min) and CO2 gas flow rate (X3, L/min) on the mass transfer coefficient of CO2 gas. The greater the flow rate of the absorbent and the flow rate of CO2 gas, the higher the mass damping value, and the faster the mass locking occurs due to the driving force difference in CO2 gas concentration in the absorbent and air. Optimal mass absorption conditions are achieved at 1.44656 mol/min m2 or mol/min m2 atm. Figure 6b is the effect of 0.1 M NaOH absorbent flow rate (X2, L/min) and CO2 flow rate (X2, L/min) on optimal desirability based on a design to determine constraints that produce the best-desired desire. The optimum desirability value is 0.9999 (≈1). Numerical optimization and desirability ramps are shown in Figure 7 and Figure 8, respectively.
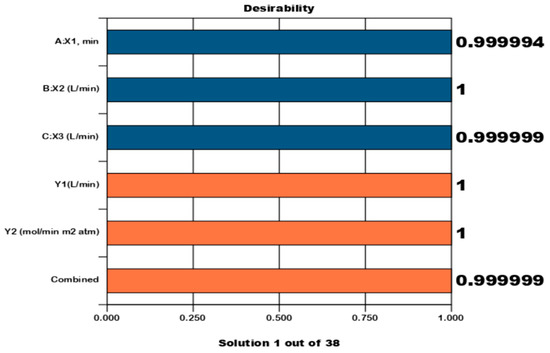
Figure 7.
Numerical optimization bar graph (Pareto graph), The bar graph is a graphical view of each optimal solution. The optimal factor settings are shown: absorption time (X1), absobent flow rate (X2), CO2 flow rate (X3), CO2 absorption rate (Y1), and CO2 gas mass coefficient (Y2).
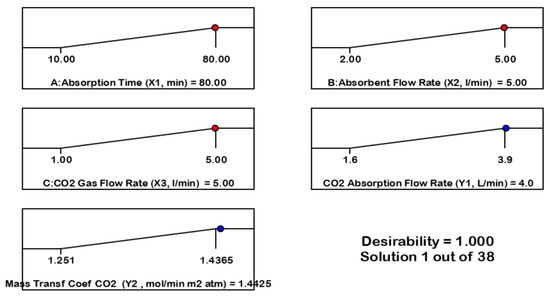
Figure 8.
Desirability ramp for numerical optimization of three goals, i.e., the absorption time (X1, min), absorbent flow rate (X2, L/min), CO2 gas flow rate (X3, L/min), on CO2 absorption flow rate (Y1, L/min), and mass transfer coefficient (Y2, mol/min m2 atm) as the response variable.
Figure 9 shows the 3-D optimization of the effect of absorption time (min) and pH on the formation of HCO3− and CO32− as a result of the reactions between 2OH− + CO2 and CO32− + CO2 + H2O2 + HCO3−, conditions under which the optimum was achieved at 154.994 mol/L HCO3− and 105.664 mol/L CO32−. This shows that absorption also occurs chemically, according to pH. This reaction occurs at a pH of 9.5–11, forming CO32− and HCO32− due to the reaction of OH− and CO2, whose products can be used to meet the needs of cosmetics and food ingredients.
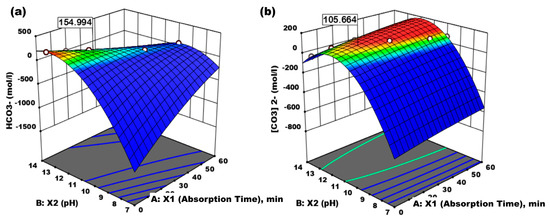
Figure 9.
(a) Effect of absorption time (X1, min) and absorbent pH (X2) on HCO3− formed. (b) Effect of absorption time (X1, min) and absorbent pH (X2) on CO32− formed.
Figure 10 shows the numerical optimization bar graph (Pareto graph) for desirability. The bar graph is a graphic display for each optimal solution. Optimal factor settings are shown with red bars, and optimal response predicted values are shown in blue. Optimum conditions for the desirability of each factor are, respectively, absorption time (X1, min), absorbent flow rate (X2, L/min), and CO2 gas flow rate mixed with air = 0.99, CO2 absorption desire rate (Y1, L/min), and mass transfer coefficient CO2 gas (Y2, mol/min m2 atm) = 0.999 each; and combined desire = 0.99.
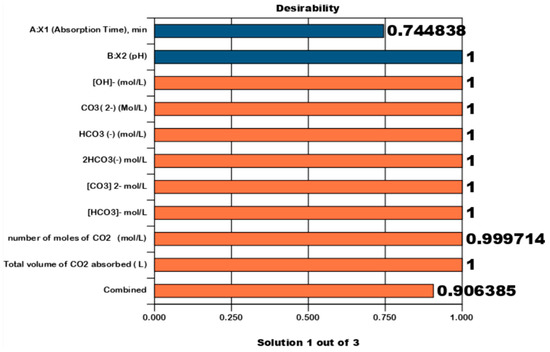
Figure 10.
Numerical optimization bar graph (Pareto graph). The bar graph is a graphical view of each optimal solution. Optimal factors settings are shown: absorption time (X1), pH (X2), OH− (mol/L), CO32− (mol/L), HCO32− (mol/L), 2HCO32− (mol/L), CO32− (mo/L), HCO32− (mol/L), number of moles of CO2 (mol/L), and total volume of CO2 absorbed (L).
Figure 11 is the desirability ramp for numerical optimization of the 3-D optimization of the effect of absorption time (minutes) and pH on the formation of HCO3− and CO32− as a result of the reaction between 2OH− + CO2 → CO32− + H2O and CO32− + CO2 + H2O → 2 HCO3−, optimal conditions achieved, i.e., absorption time = 15.3097 (X1, min), pH = 11.52 (X2), CO32− = 105.664 mol/L, HCO32− = 154.994 mol/L, a total of CO2 = 76.9359 L, and desirability = 0.91.
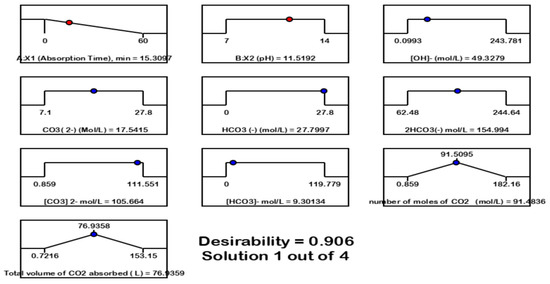
Figure 11.
Desirability ramp for numerical optimization of the 3-D optimization of the effect of absorption time (minutes) and pH on the formation of HCO3− and CO32− as a result of the reaction between 2OH− + CO2, desirability = 0.906.
Table 9 illustrates the numerical optimization. Constraints are designed according to appropriate criteria to produce reliable validity and high accuracy by looking at the influence and correlation between each independent variable and the response variable to produce the correct constraints and high desirability.
where, n is the number of responses in the measure; if all the important values are the same, the simultaneous objective function reduces to the normal form for desirability.
Table 9.
Numerical optimization constraints.
For the goal of maximum, the desirability will be defined by the following formulas:
For absorption time criteria, X1 (10–80 min) maximum goals: optimum X1 = 80 min absorption flow rate; X2 (2–5 L/min) maximum goals: optimum X2 = 5 L/min, CO2 gas flow rate, X3 (2–5 L/min): optimum X3 = 5 L/min on absorption flow rate Y1 = 3.967 L/min and desirability = 0.999999 ≈ 1. Desirability ramp for numerical optimization of three goals, i.e., the absorption time, X1 (10–80 min), absorbent flow rate, X2 (2–5 L/min) CO2 gas flow rate, X3 (2–5 L/min), on mass transfer coefficient (Y2, mol/min m2 atm) as the response variable. Optimum condition: X1 = 5 L/min, X2 = 5 L/min, X3 = 5 L/min, Y2 = 1.442 mol/min m2 atm and desirability = 0.999999 ≈ 1
Table 10 presents desirability function optimization. Analysis of variance (ANOVA) for responses to CO2 gas absorption flow rate (Y1) indicates that effects of individual factors (absorption time, absorption flow rate, and CO2 gas flow rate) are significant for degree of confidence ≥ 95% (p-value ≤ 0.05). The RSM model selected is a quadratic model, R2 = 0.97, CV = 7.4, and the model is very significant.
Table 10.
Optimization using the desirability function.
Analysis of variance (ANOVA) for the response variable CO2 gas mass transfer coefficient (Y2) showed the influence of individual factors and significant interaction for the degree of confidence ≥ 95% (p-value ≤ 0.05), except for the interaction effect of X1 X 2 and X2 X 3, which was not significant. Therefore, the RSM model was chosen as a quadratic model with R2 = 0.94 and CV = 4, and the model is significant.
4. Conclusions
This study investigated CO2 gas absorption with NaOH absorbent continuous system in Raschig ring packing column using Box–Behnken design. Based on the results and discussion, the optimization conditions assumed a maximum point for desirability. Experiments were performed based on absorption time, the absorption flow rate of 0.1 M NaOH, and the CO2 gas flow rate. The results showed that the absorption of CO2 gas in the air was optimized by using 0.1 M NaOH absorbent in the column of the Raschig ring stuffing material using the response surface methodology (RSM), with an absorption rate of 4 L/min, a mass transfer coefficient of 1.4425 mol/min m2 atm, and desirability 0.999 ≈1.
Author Contributions
Conceptualization, methodology, investigation, writing—original draft, J.; conceptualization, writing—review and editing, and validation, H.H.; writing—review and editing, M.Z. (Muhammad Zaki), L.M. and M.Z. (Mirna Zulrika); formal analysis and writing—review and editing, F.N. and A. All authors have read and agreed to the published version of the manuscript.
Funding
This research received no external funding.
Institutional Review Board Statement
Not applicable.
Informed Consent Statement
Not applicable.
Data Availability Statement
Not applicable.
Acknowledgments
The authors are grateful to the Chemical Engineering Department, Faculty of Engineering at Universitas Syiah Kuala, for technical support.
Conflicts of Interest
The authors declare that there are no conflict of financial or non-financial interest.
References
- Hu, Y.; Li, R.; Du, L.; Ren, S.; Chevallier, J. Could SO2 and CO2 Emissions Trading Schemes Achieve Co-Benefits of Emissions Reduction? Energy Policy 2022, 170, 113252. [Google Scholar] [CrossRef]
- De Troeyer, K.; De Man, J.; Vandebroek, E.; Vanoirbeek, J.A.; Hoet, P.H.; Nemery, B.; Vanroelen, C.; Casas, L.; Ronsmans, S. Identifying Cleaning Products Associated with Short-Term Work-Related Respiratory Symptoms: A Workforce-Based Study in Domestic Cleaners. Environ. Int. 2022, 162, 107170. [Google Scholar] [CrossRef] [PubMed]
- Wang, C.; Zhang, J.L.; Gao, X.H.; Zhao, T.S. Research Progress on Iron-Based Catalysts for CO2 Hydrogenation to Long-Chain Linear α-Olefins. J. Fuel Chem. Technol. 2023, 51, 67–85. [Google Scholar] [CrossRef]
- Zou, C.; Xiong, B.; Xue, H.; Zheng, D.; Ge, Z.; Wang, Y.; Jiang, L.; Pan, S.; Wu, S. The Role of New Energy in Carbon Neutral. Pet. Explor. Dev. 2021, 48, 480–491. [Google Scholar] [CrossRef]
- Fang, K.; Li, C.; Tang, Y.; He, J.; Song, J. China’s Pathways to Peak Carbon Emissions: New Insights from Various Industrial Sectors. Appl. Energy 2022, 306, 118039. [Google Scholar] [CrossRef]
- Madejski, P.; Chmiel, K.; Subramanian, N.; Kuś, T. Methods and Techniques for CO2 Capture: Review of Potential Solutions and Applications in Modern Energy Technologies. Energies 2022, 15, 887. [Google Scholar] [CrossRef]
- Lang, X.D.; He, X.; Li, Z.M.; He, L.N. New Routes for CO2 Activation and Subsequent Conversion. Curr. Opin. Green Sustain. Chem. 2017, 7, 31–38. [Google Scholar] [CrossRef]
- Aghel, B.; Janati, S.; Alobaid, F.; Almoslh, A.; Epple, B. Application of Nanofluids in CO2 Absorption: A Review. Appl. Sci. 2022, 12, 3200. [Google Scholar] [CrossRef]
- Satthawong, R.; Koizumi, N.; Song, C.; Prasassarakich, P. Bimetallic Fe-Co Catalysts for CO2 Hydrogenation to Higher Hydrocarbons. J. CO2 Util. 2013, 3–4, 102–106. [Google Scholar] [CrossRef]
- Xue, L.; Zhang, C.; Wu, J.; Fan, Q.Y.; Liu, Y.; Wu, Y.; Li, J.; Zhang, H.; Liu, F.; Zeng, S. Unveiling the Reaction Pathway on Cu/CeO2 Catalyst for Electrocatalytic CO2 Reduction to CH4. Appl. Catal. B 2022, 304, 120951. [Google Scholar] [CrossRef]
- Miao, Z.; Wang, Q.; Zhang, Y.; Meng, L.; Wang, X. In Situ Construction of S-Scheme AgBr/BiOBr Heterojunction with Surface Oxygen Vacancy for Boosting Photocatalytic CO2 Reduction with H2O. Appl. Catal. B 2022, 301, 120802. [Google Scholar] [CrossRef]
- Guo, L.; Cui, Y.; Li, H.; Fang, Y.; Prasert, R.; Wu, J.; Yang, G.; Yoneyama, Y.; Tsubaki, N. Selective Formation of Linear-Alpha Olefins (LAOs) by CO2 Hydrogenation over Bimetallic Fe/Co-Y Catalyst. Catal. Commun. 2019, 130, 105759. [Google Scholar] [CrossRef]
- Ra, E.C.; Kim, K.Y.; Kim, E.H.; Lee, H.; An, K.; Lee, J.S. Recycling Carbon Dioxide through Catalytic Hydrogenation: Recent Key Developments and Perspectives. ACS Catal. 2020, 10, 11318–11345. [Google Scholar] [CrossRef]
- Roy, S.; Cherevotan, A.; Peter, S.C. Thermochemical CO2 Hydrogenation to Single Carbon Products: Scientific and Technological Challenges. ACS Energy Lett. 2018, 3, 1938–1966. [Google Scholar] [CrossRef]
- Ren, S.; Hu, Y.; Zheng, J.; Wang, Y. Emissions Trading and Firm Innovation: Evidence from a Natural Experiment in China. Technol. Forecast. Soc. Chang. 2020, 155, 119989. [Google Scholar] [CrossRef]
- Jebabli, I.; Lahiani, A.; Mefteh-Wali, S. Quantile Connectedness between CO2 Emissions and Economic Growth in G7 Countries. Resour. Policy 2023, 81, 103348. [Google Scholar] [CrossRef]
- Xia, C.; Li, Y.; Xu, T.; Chen, Q.; Ye, Y.; Shi, Z.; Liu, J.; Ding, Q.; Li, X. Analyzing Spatial Patterns of Urban Carbon Metabolism and Its Response to Change of Urban Size: A Case of the Yangtze River Delta, China. Ecol. Indic. 2019, 104, 615–625. [Google Scholar] [CrossRef]
- Tollefson, J. Trump Pulls United States out of Paris Climate Agreement. Nature 2017, 546, 22096. [Google Scholar] [CrossRef]
- Huang, Z.; He, W.; Zhao, L.; Liu, H.; Zhou, X. Processing Technology Optimization for Tofu Curded by Fermented Yellow Whey Using Response Surface Methodology. Food Sci. Nutr. 2021, 9, 3701–3711. [Google Scholar] [CrossRef]
- Delanoë, P.; Tchuente, D.; Colin, G. Method and Evaluations of the Effective Gain of Artificial Intelligence Models for Reducing CO2 Emissions. J. Environ. Manag. 2023, 331, 117261. [Google Scholar] [CrossRef]
- Ye, H.; He, X.Y.; Song, Y.; Li, X.; Zhang, G.; Lin, T.; Xiao, L. A Sustainable Urban Form: The Challenges of Compactness from the Viewpoint of Energy Consumption and Carbon Emission. Energy Build. 2015, 93, 90–98. [Google Scholar] [CrossRef]
- Malekli, M.; Aslani, A. A Novel Post-Combustion CO2 Capture Design Integrated with an Organic Rankine Cycle (ORC). Process Saf. Environ. Prot. 2022, 168, 942–952. [Google Scholar] [CrossRef]
- Kim, S.; Ko, Y.; Lee, G.J.; Lee, J.W.; Xu, R.; Ahn, H.; Kang, Y.T. Sustainable Energy Harvesting from Post-Combustion CO2 Capture Using Amine-Functionalized Solvents. Energy 2023, 267, 126532. [Google Scholar] [CrossRef]
- Miao, L.; Tang, S.; Li, X.; Yu, D.; Deng, Y.; Hang, T.; Yang, H.; Liang, Y.; Kwan, M.P.; Huang, L. Estimating the CO2 Emissions of Chinese Cities from 2011 to 2020 Based on SPNN-GNNWR. Environ. Res. 2023, 218, 115060. [Google Scholar] [CrossRef]
- Galán, G.; Martín, M.; Grossmann, I.E. Systematic Comparison of Natural and Engineering Methods of Capturing CO2 from the Air and Its Utilization. Sustain. Prod. Consum. 2023, 37, 78–95. [Google Scholar] [CrossRef]
- Ibrahim, N.; Cox, S.; Mills, R.; Aftelak, A.; Shah, H. Multi-Objective Decision-Making Methods for Optimising CO2 Decisions in the Automotive Industry. J. Clean Prod. 2021, 314, 128037. [Google Scholar] [CrossRef]
- Chen, P.; Lu, Y.; Wan, Y.; Zhang, A. Assessing Carbon Dioxide Emissions of High-Speed Rail: The Case of Beijing-Shanghai Corridor. Transp. Res. D Transp. Environ. 2021, 97, 102949. [Google Scholar] [CrossRef]
- Sanjay Kanna Sharma, T.; Jana, J.; Bhamu, K.C.; Song, J.; Sivaselvam, S.; Van Tam, T.; Kang, S.G.; Chung, J.S.; Hur, S.H.; Choi, W.M. Rational Synthesis of Alkaline Earth Metal Vanadates: Structural Origin of MgVO3 Honeycomb Lattice System and Its Electrochemical Analysis for the Detection of Sulfadiazine. Chem. Eng. J. 2023, 464, 142673. [Google Scholar] [CrossRef]
- Notz, R.; Mangalapally, H.P.; Hasse, H. Post Combustion CO2 Capture by Reactive Absorption: Pilot Plant Description and Results of Systematic Studies with MEA. Int. J. Greenh. Gas Control. 2012, 6, 84–112. [Google Scholar] [CrossRef]
- Mangalapally, H.P.; Hasse, H. Pilot Plant Study of Post-Combustion Carbon Dioxide Capture by Reactive Absorption: Methodology, Comparison of Different Structured Packings, and Comprehensive Results for Monoethanolamine. Chem. Eng. Res. Des. 2011, 89, 1216–1228. [Google Scholar] [CrossRef]
- Tobiesen, F.A.; Svendsen, H.F.; Juliussen, O. Experimental Validation of a Rigorous Absorber Model for CO2 Postcombustion Capture. AIChE J. 2007, 53, 846–864. [Google Scholar] [CrossRef]
- Gabrielsen, J. CO2 Capture from Coal Fired Power Plants. Bull. Can. Pet. Geol. 2007, 55. [Google Scholar]
- Idem, R.; Wilson, M.; Tontiwachwuthikul, P.; Chakma, A.; Veawab, A.; Aroonwilas, A.; Gelowitz, D. Pilot Plant Studies of the CO2 Capture Performance of Aqueous MEA and Mixed MEA/MDEA Solvents at the University of Regina CO2 Capture Technology Development Plant and the Boundary Dam CO2 Capture Demonstration Plant. Ind. Eng. Chem. Res. 2006, 45, 2414–2420. [Google Scholar] [CrossRef]
- Kittel, J.; Idem, R.; Gelowitz, D.; Tontiwachwuthikul, P.; Parrain, G.; Bonneau, A. Corrosion in MEA Units for CO2 Capture: Pilot Plant Studies. Energy Procedia 2009, 1, 791–797. [Google Scholar] [CrossRef]
- Mejdell, T.; Vassbotn, T.; Juliussen, O.; Tobiesen, A.; Einbu, A.; Knuutila, H.; Hoff, K.A.; Andersson, V.; Svendsen, H.F. Novel Full Height Pilot Plant for Solvent Development and Model Validation. Energy Procedia 2011, 4, 1753–1760. [Google Scholar] [CrossRef]
- Dugas, R.E. Pilot Plant Study of Carbon Dioxide Capture by Aqueous Mono Ethanol Amin; University of Texas at Austin: Austin, TX, USA, 2006. [Google Scholar]
- Wang, Y.; Chen, H.; Chen, C.; Zhang, Z.; Xu, Y.; Chen, G.; Zhang, Y. Byproducts of the Anammox-Hydroxyapatite Coupling Process—Characterization and Its Adsorption Capacity for Cd(II). SSRN Electron. J. 2022, 49. [Google Scholar] [CrossRef]
- Mimura, T.; Shimojo, S.; Suda, T.; Iijima, M.; Mitsuoka, S. Research and Development on Energy Saving Technology for Flue Gas Carbon Dioxide Recovery and Steam Dioxide Recovery in Power Plant. Energy Convers. Manag. 1995, 36, 6–9. [Google Scholar] [CrossRef]
- Tatsumi, M.; Yagi, Y.; Kadono, K.; Kaibara, K.; Iijima, M.; Ohishi, T.; Tanaka, H.; Hirata, T.; Mitchell, R. New Energy Efficient Processes and Improvements for Flue Gas CO2 Capture. Energy Procedia 2011, 4, 1347–1352. [Google Scholar] [CrossRef]
- Knudsen, J.N.; Jensen, J.N.; Vilhelmsen, P.J.; Biede, O. Experience with CO2 Capture from Coal Flue Gas in Pilot-Scale: Testing of Different Amine Solvents. Energy Procedia 2009, 1, 783–790. [Google Scholar] [CrossRef]
- Lemaire, E.; Bouillion, P.A.; Gomez, A.; Kittel, J.; Gonzalez, S.; Carrette, P.L.; Delfort, B.; Mongin, P.; Alix, P.; Normand, L. New IFP Optimized First Generation Process for Postcombustion Carbon Capture. Energy Procedia 2011, 4, 1361–1368. [Google Scholar] [CrossRef]
- Gayheart, J.W.; Moorman, S.A.; Parsons, T.R.; Poling, C.W. Babcock & Wilcox Power Generation Group, Inc. RSATTM Process and Field Demonstration of the OptiCapTM Advanced Solvent at the US-DOE’S National Carbon Capture Center. Energy Procedia 2013, 37, 1951–1967. [Google Scholar] [CrossRef]
- Monteiro, J.G.M.S.; Pinto, D.D.D.; Luo, X.; Knuutila, H.; Hussain, S.; Mba, E.; Hartono, A.; Svendsen, H.F. Activity-Based Kinetics of the Reaction of Carbon Dioxide with Aqueous Amine Systems. Case Studies: MAPA and MEA. Energy Procedia 2013, 37, 1888–1896. [Google Scholar] [CrossRef]
- Pavlish, B.M.; Stanislowski, J.J.; Fiala, N.J.; Kay, J.P. Novel Solvent-Gas Contactor for CO2 Capture Cost Reductions. Energy Procedia 2013, 37, 1941–1950. [Google Scholar] [CrossRef]
- Olutoye, M.A.; Eterigho, E.J. Modelling of a Gas Absorption Column for CO2-NaOH System under Unsteady-State Regime. Leonardo Electron. J. Pract. Technol. 2008, 7, 105–114. [Google Scholar]
- Aouini, I.; Ledoux, A.; Estel, L.; Mary, S.; Grimaud, J.; Valognes, B. Study of Carbon Dioxide Capture from Industrial Incinerator Flue Gas on a Laboratory Scale Pilot. Energy Procedia 2011, 4, 1729–1736. [Google Scholar] [CrossRef]
- Nielsen, P.T.; Li, L.; Rochelle, G.T. Piperazine Degradation in Pilot Plants. Energy Procedia 2013, 37, 1912–1923. [Google Scholar] [CrossRef]
- Ohashi, Y.; Ogawa, T.; Suzuki, K. An Update of the Development of Carbon Dioxide Removal System from the Flue Gas of Coal Fired Power Plant in Toshiba. Energy Procedia 2013, 37, 1924–1932. [Google Scholar] [CrossRef]
- Øi, L.E.; Lundberg, J.; Pedersen, M.; Hansen, P.M.; Melaaen, M.C. Laboratory Rig for Atmospheric CO2 Absorption and Desorption under Pressure. Energy Procedia 2013, 37, 1933–1940. [Google Scholar] [CrossRef]
- Razi, N.; Svendsen, H.F.; Bolland, O. The Impact of Design Correlations on Rate-Based Modeling of a Large Scale CO2 Capture with MEA. Energy Procedia 2013, 37, 1977–1986. [Google Scholar] [CrossRef]
- Mathias, P.M.; Reddy, S.; Smith, A.; Afshar, K. A Guide to Evaluate Solvents and Processes for Post-Combustion CO2 Capture. Energy Procedia 2013, 37, 1863–1870. [Google Scholar] [CrossRef]
- Lim, Y.; Kim, J.; Jung, J.; Lee, C.S.; Han, C. Modeling and Simulation of CO2 Capture Process for Coalbased Power Plant Using Amine Solvent in South Korea. Energy Procedia 2013, 37, 1855–1862. [Google Scholar] [CrossRef]


Disclaimer/Publisher’s Note: The statements, opinions and data contained in all publications are solely those of the individual author(s) and contributor(s) and not of MDPI and/or the editor(s). MDPI and/or the editor(s) disclaim responsibility for any injury to people or property resulting from any ideas, methods, instructions or products referred to in the content. |
© 2023 by the authors. Licensee MDPI, Basel, Switzerland. This article is an open access article distributed under the terms and conditions of the Creative Commons Attribution (CC BY) license (https://creativecommons.org/licenses/by/4.0/).