Article

Experimental Study Results Processing Method for the Marine Diesel Engines Vibration Activity Caused by the Cylinder-Piston Group Operations

1
Department of System Analysis and Control, Saint Petersburg Mining University, 199106 Saint Petersburg, Russia
2
Department of Theory and Design of Marine Combustion Engines, Admiral Makarov State University of Maritime and Inland, 198035 Saint-Petersburg, Russia
*
Author to whom correspondence should be addressed.
Inventions 2023, 8(3), 71; https://doi.org/10.3390/inventions8030071
Submission received: 7 March 2023 / Revised: 2 May 2023 / Accepted: 9 May 2023 / Published: 12 May 2023
(This article belongs to the Topic Ship Dynamics, Stability and Safety)

Abstract

:
The article discusses the method and results of processing statistical data from an experimental study of vibrations in marine diesel engines caused by the operation of cylinder-piston groups. The results of the application of a ranking method for identifying factors that influence vibration in marine diesel engines are presented to determine the most significant ones. A series of experiments were conducted according to special plans to actively implement the random balance method. This helped to establish the correctness of selecting the most significant factors from a variety of factors that influence the process under study. The article presents a mathematical model that enables the calculation of current values and prediction of changes in the most significant indicators, with the clearance between the piston and the cylinder liner being the most important.

1. Introduction

The efficiency of marine fleet utilization is closely linked to reducing transportation costs, which are steadily increasing. A significant portion of total transportation costs is attributed to fleet operation, making cost reduction in this area a key strategy for reducing transportation expenses. Therefore, the problem of increasing ship operation efficiency is closely tied to reducing maintenance and repair time, and is currently considered an urgent task.
The existing system of scheduled preventive maintenance and repair involves preserving and restoring the normal technical condition of ship components at pre-planned intervals. However, transitioning ships to extended overhaul periods requires a comprehensive approach that includes engineering and technical measures, as well as scientific research aimed at improving repair quality, technical operation levels, logistics, and other related factors. Modern methods and tools for determining the technical condition of ship devices and mechanisms, particularly marine diesel engines, without dismantling them, play a significant role in achieving this goal.
High vibration loads on parts can lead to fatigue stress, accelerated wear of contacting surfaces, and reduced reliability and service life of marine diesel engines. Therefore, monitoring their vibration activity during operation is crucial. Currently, experimental research and modeling of complex technical systems and processes are widely used in various fields of human activity [1,2]. The scientific, methodological, and mathematical apparatus for research is constantly evolving based on the level of development of information [3,4] and digital technologies, leading to the introduction of new methods and information processing tools into the practice of planning and conducting research on complex technical systems and processes [5,6].
The construction of a model is preceded by the identification of factors that influence the studied process, and therefore the problem of assessing, selecting, and substantiating the most significant and suitable parameters for building models is relevant [6,7]. Various approaches exist for identifying the most significant factors, such as empirical methods based on expert opinions [8], and experimental methods that utilize the theory of experiment planning [9,10].
The aim of this study is to develop a methodology for substantiating the choice of the most significant factors that affect the vibration of a marine diesel engine caused by the operation of the cylinder-piston group. The goal is to establish the relationship and mathematical model between the vibration level and its causes, particularly the dependence of vibration velocity on the size of the diametrical gap between the cylinder liner and piston bore. This methodology will enable the assessment of the technical condition of marine diesel engine cylinder-piston groups, prediction of residual life, and prompt the specification of scheduled preventive maintenance and repair based on the technical condition.

2. Materials and Methods

One of the indicators that helps to assess the technical condition of a marine diesel engine is the level and nature of changes in its vibration [11,12]. Any deviations from normal operating conditions in marine diesel units are reflected in their vibration characteristics [13,14], which can be used to diagnose the condition of parts of a cylinder-piston group using on-site methods based on vibration indicators [15,16]. Previous studies on engine vibration have estimated the relative significance of different sources of sound vibration, indicating that piston impacts during shifting are among the most significant sources [13].
Vibration is a significant issue in the operation of diesel engines, as it can affect their performance and reliability. Researchers have studied the sources of vibration in diesel engines and developed methods for using vibration indicators to diagnose the technical condition of ship mechanisms [17,18]. Vibrodiagnostics has been recognized as one of the most promising methods for assessing the technical condition of marine diesel engines and mechanisms [19,20]. However, vibration processes are complex and require adequate mathematical models for successful analysis of the results obtained using vibration diagnostics [12,13].
Most studies related to the construction of mathematical models for studying vibration are based on differential equation theory, statistical information processing methods, and experimental planning [21,22]. This approach yields specific numerical data obtained from experiments or numerical solutions. However, in order to obtain the results of problem-solving, the initial parameter values must be known, which cannot always be determined by theoretical methods.
In some cases, methods of similarity theory and dimensional analysis can be effectively applied when modeling the operation of complex objects or processes [23,24]. Furthermore, to obtain an adequate and informative model, it is necessary to determine the required number of factors (quantities) that affect the process under study. Therefore, future research should focus on developing more complex models for analyzing vibration diagnostics, which will improve the accuracy and reliability of this method.

2.1. Methodology for Evaluating Factors Influencing Vibration of Marine Diesel Engines due to Operation of Cylinder-Piston Group

It is well-known that evaluating and ranking factors involves ordering them according to their expected degree of influence on the process being studied [25]. During the preliminary analysis of the primary data, a literature review was conducted to compile a list of factors, including technological, structural, and dynamic factors, etc. The degree of importance of factors can be assessed through a survey of a group of specialists or experts [26,27]. Figure 1 illustrates a structural–logical scheme for evaluating the factors that affect the vibration of a marine diesel engine caused by the operation of the cylinder-piston group.
Step I. The assessment is based on the results of a study presented in [26], which assessed the impact of various factors on the vibroacoustic signal to identify which ones that influence the parameter under study can be neglected. To build a model that enables the calculation, analysis, and prediction of the technical condition of parts and assemblies of a marine diesel engine, including a cylinder-piston group, it is necessary to determine the most significant factors. To identify the degree of influence of factors on the vibroacoustic signal and select the most significant of them, it is necessary to rank the factors.
The primary factors that affect the magnitude of the shock impulse when the piston shifts on a running engine are as follows [28]:
f 1 —the clearance between the bushing and the piston;
f 2 —the amount of air leakage in the valves, piston rings, gasket under the cylinder head;
f 3 —the piston material;
f 4 —the fixed angle of rotation of the crankshaft;
f 5 —the value of the compressed air pressure supplied to the cylinder;
f 6 —the degree of rarefaction in the cylinder;
f 7 —the mobility of the piston rings;
f 8 —the elasticity of the piston rings;
f 9 —the diametrical clearance between the piston bosses and the piston pin;
f 10 —the diametrical clearance between the bushing of the upper head of the connecting rod and the pin;
f 11 —the diametrical clearance between the neck of the crankshaft and the lower head of the connecting rod;
f 12 —the lubricant properties;
f 13 —the ambient temperature;
f 14 —the sensor installation location.
Step II. The results of the study presented in [28] are based on a survey of various specialists, each of whom assigned a rank to a factor depending on the contribution it makes to the optimized parameter. Based on the survey data, a summary matrix of ranks [26] was compiled and is presented in Table 1.
Table 1 was constructed by compiling a questionnaire in which each expert filled out three columns: the upper value that the estimated factor can take, its lower value, and the ranking of the factor according to its importance. The results of 10 questionnaires were analyzed to construct Table 1. Additionally, each interviewed specialist had the option to add any additional factors that were not listed. If the expert believed that some factors had the same effect on the output value (diesel vibration caused by the operation of the cylinder-piston group), these factors were assigned the same rank. In case the expert assigned the same rank to multiple factors, the “related” ranks were calculated as the arithmetic mean of the numbers indicating the ranks of the factors in the series.
To evaluate the level of agreement among the specialists involved, the following characteristics were calculated for each parameter: the sum of ranks ( R ), the squared deviation ( d 2 ), and the concordance coefficient W.
The value of the concordance coefficient, which takes into account the “connected” ranks, is 0.641. This indicates that there is a correlation between the opinions of experts [28,29]. The agreement among the interviewed experts was established based on the χ 2 criterion (Pearson).

2.2. The Results of the Analysis of the Most Significant Parameters Affecting the Vibration of a Marine Diesel Engine

According to the data presented in Table 1, the weight of each parameter was calculated based on the sum of the ranks of all experts using the following formula:
K w g h t i = 1 R i / i = 1 i = 14 1 R i a = 1
As a result:
K w g h t 1 = 18.21 % ; K w g h t 2 = 8.89 % ; K w g h t 3 = 8.80 % ; K w g h t 4 = 7.44 % ;
K w g h t 5 = 10.94 % ; K w g h t 6 = 5.98 % ; K w g h t 7 = 9.70 % ; K w g h t 8 = 5.26 % ;
K w g h t 9 = 4.83 % ; K w g h t 10 = 4.96 % ; K w g h t 11 = 4.23 % ; K w g h t 12 = 4.15 % ;
K w g h t 13 = 3.29 % ; K w g h t 14 = 3.33 % .
It is worth noting that a model for comparative assessment of indicators for 14 factors can be constructed based on the study.
This allows for the evaluation of the level of vibration of a marine diesel engine:
y = 0.1821 f 1 + 0.0889 f 2 + 0.088 f 3 + 0.0744 f 4 + 0.1094 f 5 + 0.0598 f 6 + + 0.097 f 7 + 0.0526 f 8 + 0.0483 f 9 + 0.0496 f 10 + 0.0423 f 11 + 0.0415 f 12 + + 0.0329 f 13 + 0.0333 f 14
The constructed predictive model can be used for theoretical analysis of the relationship between vibration and the reviewed earlier factors were studied.
By utilizing the methodology for assessing factors, the parameters that have the most significant impact on the vibration of a marine diesel engine were identified (refer to Table 2).
Based on the obtained results, it can be concluded that the size of the gap between the piston and cylinder liner mirror has the greatest influence on the studied process, followed by the pressure of the compressed air supplied to the cylinder, and the mobility of the piston rings in third place.
Step III. To validate the empirically obtained results, an evaluation of the vibrational activity of a marine diesel engine was conducted using the theory of experimental design. To simplify the analysis, non-essential factors were excluded, leading to a more concise and accurate description of the factor space and response surface.
When conducting a full factorial experiment (FFE) of type 2k, an increase in the number of factors by just one unit entails a doubling of the number of experiments. In our case, with 8 factors, it would be necessary to carry out 28 = 256 experiments. This is time-consuming and costly. The random balance method allows for a reduction in the number of experiments compared to the fractional factorial experiment. Therefore, to conduct screening experiments, the random balance method was used since it is the most effective method for identifying and independently evaluating dominant variables with high reliability.
The random balance method involves taking random samples instead of systematic orthogonal samples from fractional replicas (PFE), resulting in uncorrelated or weakly correlated columns of the planning matrix. The joint estimates obtained using this method are randomly shuffled, which makes it possible to isolate and independently estimate all dominant variables with high reliability [30,31].

2.3. Numerical Example

The initial data for this study include results from a physical experiment measuring the vibration level of a diesel engine, as reported in [28].
The study was conducted on a ‘cold’ (non-operating) engine 1Ch 410.5/13. To obtain a vibration signal on an idle engine, a tip was installed instead of a nozzle, which created alternating vacuum and air compression in the over-piston space. The crankshaft of the engine was fixed in a specific position, and as a result, the piston struck the cylinder liner due to a change in the sign of the normal component of the force. The resulting vibrations were transmitted through the block to the sensor installed on it, and then to the electronic equipment for recording and analyzing vibrations.
The parameters of the air transferred to the cylinder (vacuum and pressure) were determined experimentally and chosen to be minimal but sufficient to create a shock pulse from the recorded piston shift. The fixed angle of rotation of the crankshaft was chosen to ensure stable relocation of the piston and that the piston was at the top dead center.
Sensors were installed on the piston to measure its movement, and sets of bushings and pistons with different levels of wear, representing different working lives, were used. Additionally, plugs of various sizes were installed instead of valves to assess the degree of influence of leaks.
The experimental part of the study was conducted using the method of experimental design, as per the theory of experiment planning.
Before constructing a matrix of screening experiments, it is necessary to establish the levels of variation for each factor and encode them as either a positive (+) or negative (−) sign. A value of (+1) is assigned if the current value is greater than the average, while a value of (−1) is assigned if the current value is less than the average. Table 2 presents the levels of variation for each factor.
To construct the matrix of screening experiments (Table 3), we randomly mixed two half-replicas, dividing the factors into two groups. We then created one half-replica from each group. In this work, two half-replicas of the type were mixed to conduct a screening experiment 2 4 1 . One half-replica was assigned to factors x 1 x 4 , the other—to factors x 5 x 8 . For three factors x 1 : x 2 and x 3 , a PFE plan was drawn up from 8 experiments; the fourth column was obtained using the generating ratio x 4 = x 1 x 2 x 3 . For factors x 5 , x 6 , and x 7 , similarly, a plan for a full factorial experiment of 8 experiments was drawn up; the eighth column was obtained using the generating ratio x 8 = x 5 x 6 x 7 .

2.3.1. Experiment 1

The screening experiment’s planning matrix, which shows the experiment plan and the coded value of the optimization criterion, is presented in Table 3. Rows 9 and 10 were selected randomly from both half-replicas to reduce the number of experiments required for the screening experiment.
After the experiments, the results were recorded in the y = 1 k y i k matrix column, where y is the average value of the vibration amplitude, and k is the number of experiments. The optimization criterion was used to evaluate the results and select the most significant factors for further research.
The screening experiment design matrix, which includes the experiment plan and the value of the optimization criterion in coded form, is an effective tool for evaluating the most significant factors. Randomly selected rows from both half-replicas help to reduce the number of experiments required. The y column of the matrix is used to record the results of the experiments, allowing for a quick evaluation of the effectiveness of the selected factors.
The influence of each factor is estimated by calculating the difference between the average values of their levels. This method is used to determine the most significant factors that have a significant impact on the experiment’s outcome. The greater the difference between the means, the more significant the factor is considered to be.
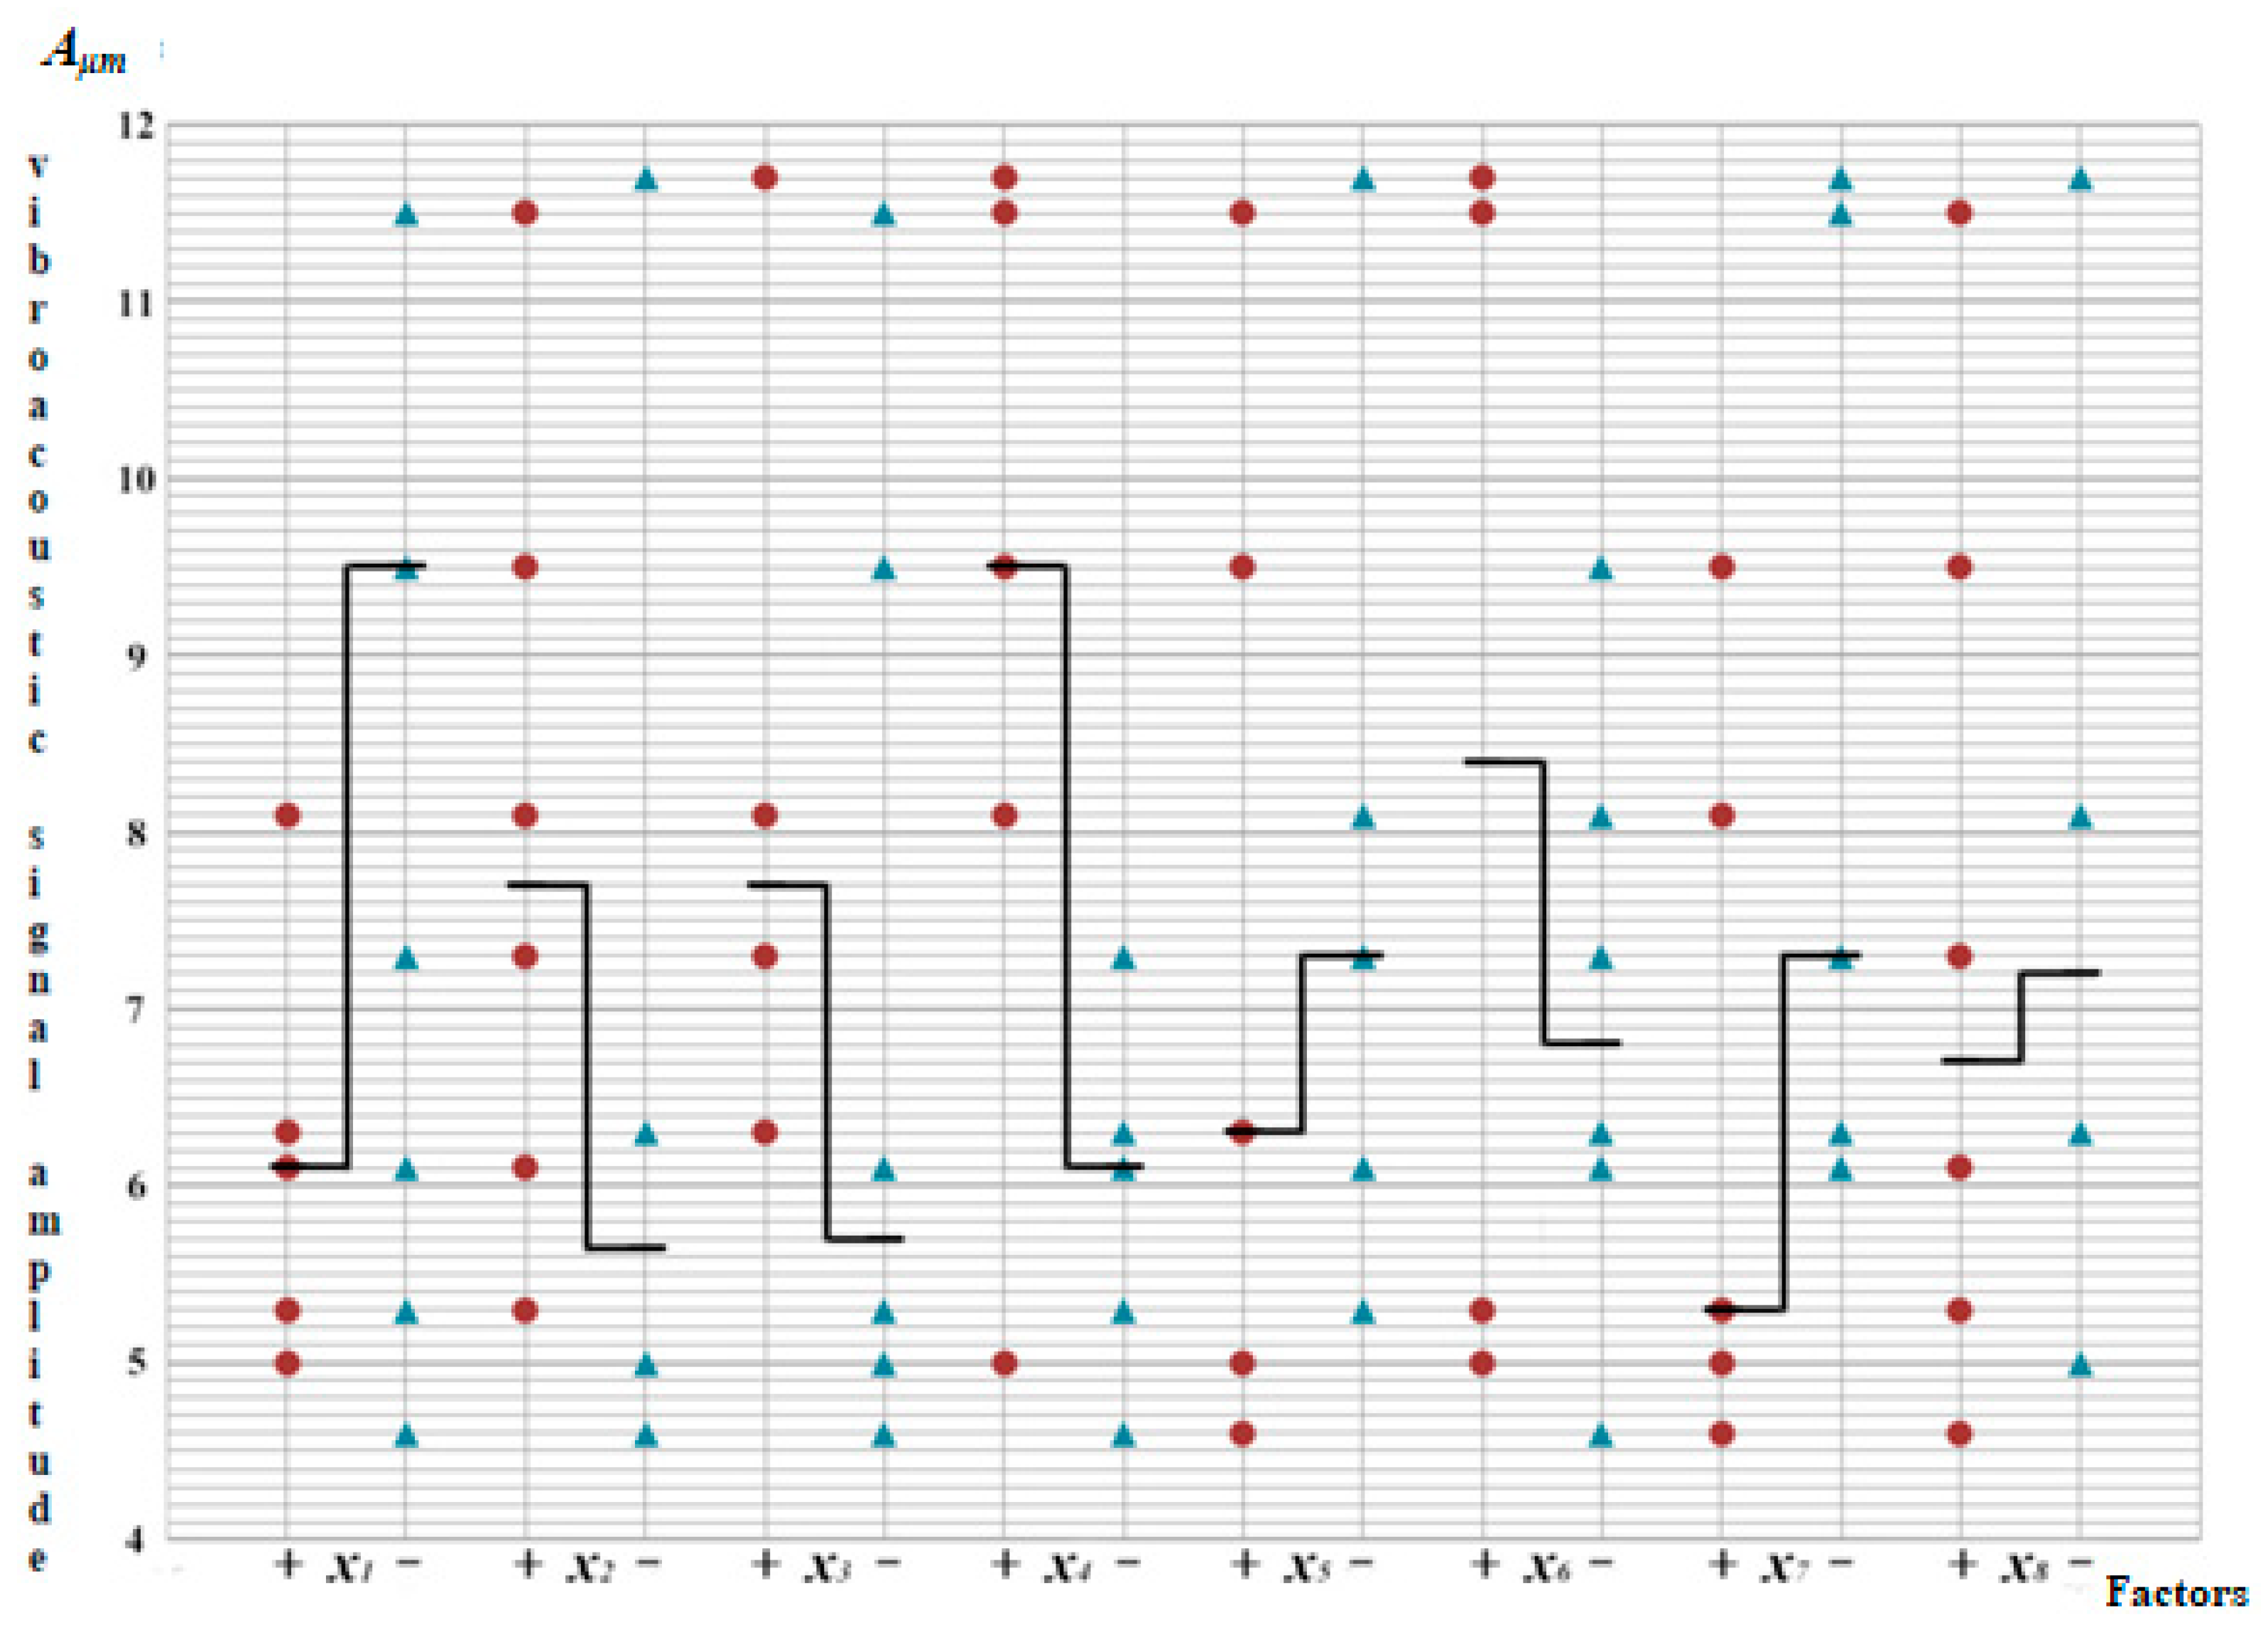
The median value is used as the central tendency measure, which is the value of the variable attribute that falls in the middle of the ordered variation series. This method is useful in cases where the data are not normally distributed or contains outliers. The median is a reliable measure of central tendency that is not affected by extreme values.
If there is an even number of occurrences in a series, the median is the arithmetic mean of the two middle values. The factors and x 4 are distinguished primarily by the difference in medians x 1 . The scatterplot constructed from the initial experimental data (Figure 2) visually shows that the effects of the first and fourth factors should be evaluated first, as they have the largest differences in medians.
The effects of the factors x i are calculated by the following:
x i = k i y k i + k i k i y k i k i
where y k i + – are the average values of the optimization criterion in each cell of the table for the factor level (+); y k i – are the average values of the optimization criterion in the corresponding cell of the table for the factor level (−); k i is the number of average values of the optimization criteria y k i [26].
To quantify the effects of the factors x 1 and x 4 , let us construct Table 4 (table with two inputs). In Table 4, the estimated factors with levels of variation and the calculated average values of the optimization criterion (vibration amplitude) are recorded in each cell of the table.
Thus, at the intersection of row + x 1 and column + x 4 , the average value of the optimization criterion y 1 is written, obtained by summing the results taken from Table 3, where factors x 1 and x 4 were at the upper levels (+), and dividing this sum by the number of such experiments. In Table 3, where the factors x 1 and x 4 were at the upper levels (+), the experiments numbered 4 and 8 corresponds to this. Thus, for the case when the factors x 1 and x 4 were at the upper levels (+), the average values of the optimization criterion are
y 1 = 5.0 + 8.1 2 = 6.55
At the intersection of row + x 1 and column x 4 the average value of the optimization criterion y 2 . is written. For this, we took the results of experiments 2, 3, and 10, and as a result we obtained
y 2 = 5.3 + 6.3 + 6.1 3 = 5.9
At the intersection of row x 1 and column + x 4 , the average value of the optimization criterion y 3 is written. For this, we took the results of experiments 6, 7, and 9 (the value of the vibration amplitude y ), and we obtained
y 3 = 11.5 + 11.7 + 9.5 3 = 10.9
At the intersection of row x 1 and column x 4 , the average value of the optimization criterion y 4 is written. For this, we took the results of experiments 1 and 5, and received the follows:
y 4 = 4.6 + 7.3 2 = 5.95
Using Formula (3), the effects of the factors were calculated. Note that for x 1 for the factor level (+), the average values of the optimization criterion will be y 1 and y 2 , and for the factor level (−) they will be y 3 and y 4 .
For x 4 the average values of the optimization criterion for the factor level (+) will be y 1 and y 3 , and for the factor level (−) they will be y 2 and y 4 .
Thus, the effects of factors x 1 = 2.2 and x 4 = 2.8 .
The significance of the identified effects was checked according to the t-criterion (Student), the numerical values of the t-criterion were
t x 1 = ( y 1 + y 2 ) ( y 3 + y 4 ) S R 2 n i = 6.55 + 5.9 10.9 + 5.95 4.812 = 2.006 , t x 4 = 6.55 + 10.9 5.9 + 5.95 4.812 = 2.553 .
Tabular value of t-criterion with the number of degrees of freedom f = n i k = 6 for a significance level of 0.05, it is 2.447, and for a significance level of 0.1 it is 1.943. Factor Effect x 4 significant with 95% confidence probability, and x 1 —with 90% confidence probability.
To remove the selected effects, the experimental results were corrected. The correction consists in adding the effects of the selected factors with the opposite sign to the results of screening experiments [29,30]. For this, we add 2.2 to all results at the level + x 1 and subtract 2.8 from all results at the level + x 4 . The data after adjustment y e x p 1 were entered in Table 5.

2.3.2. Experiment 2

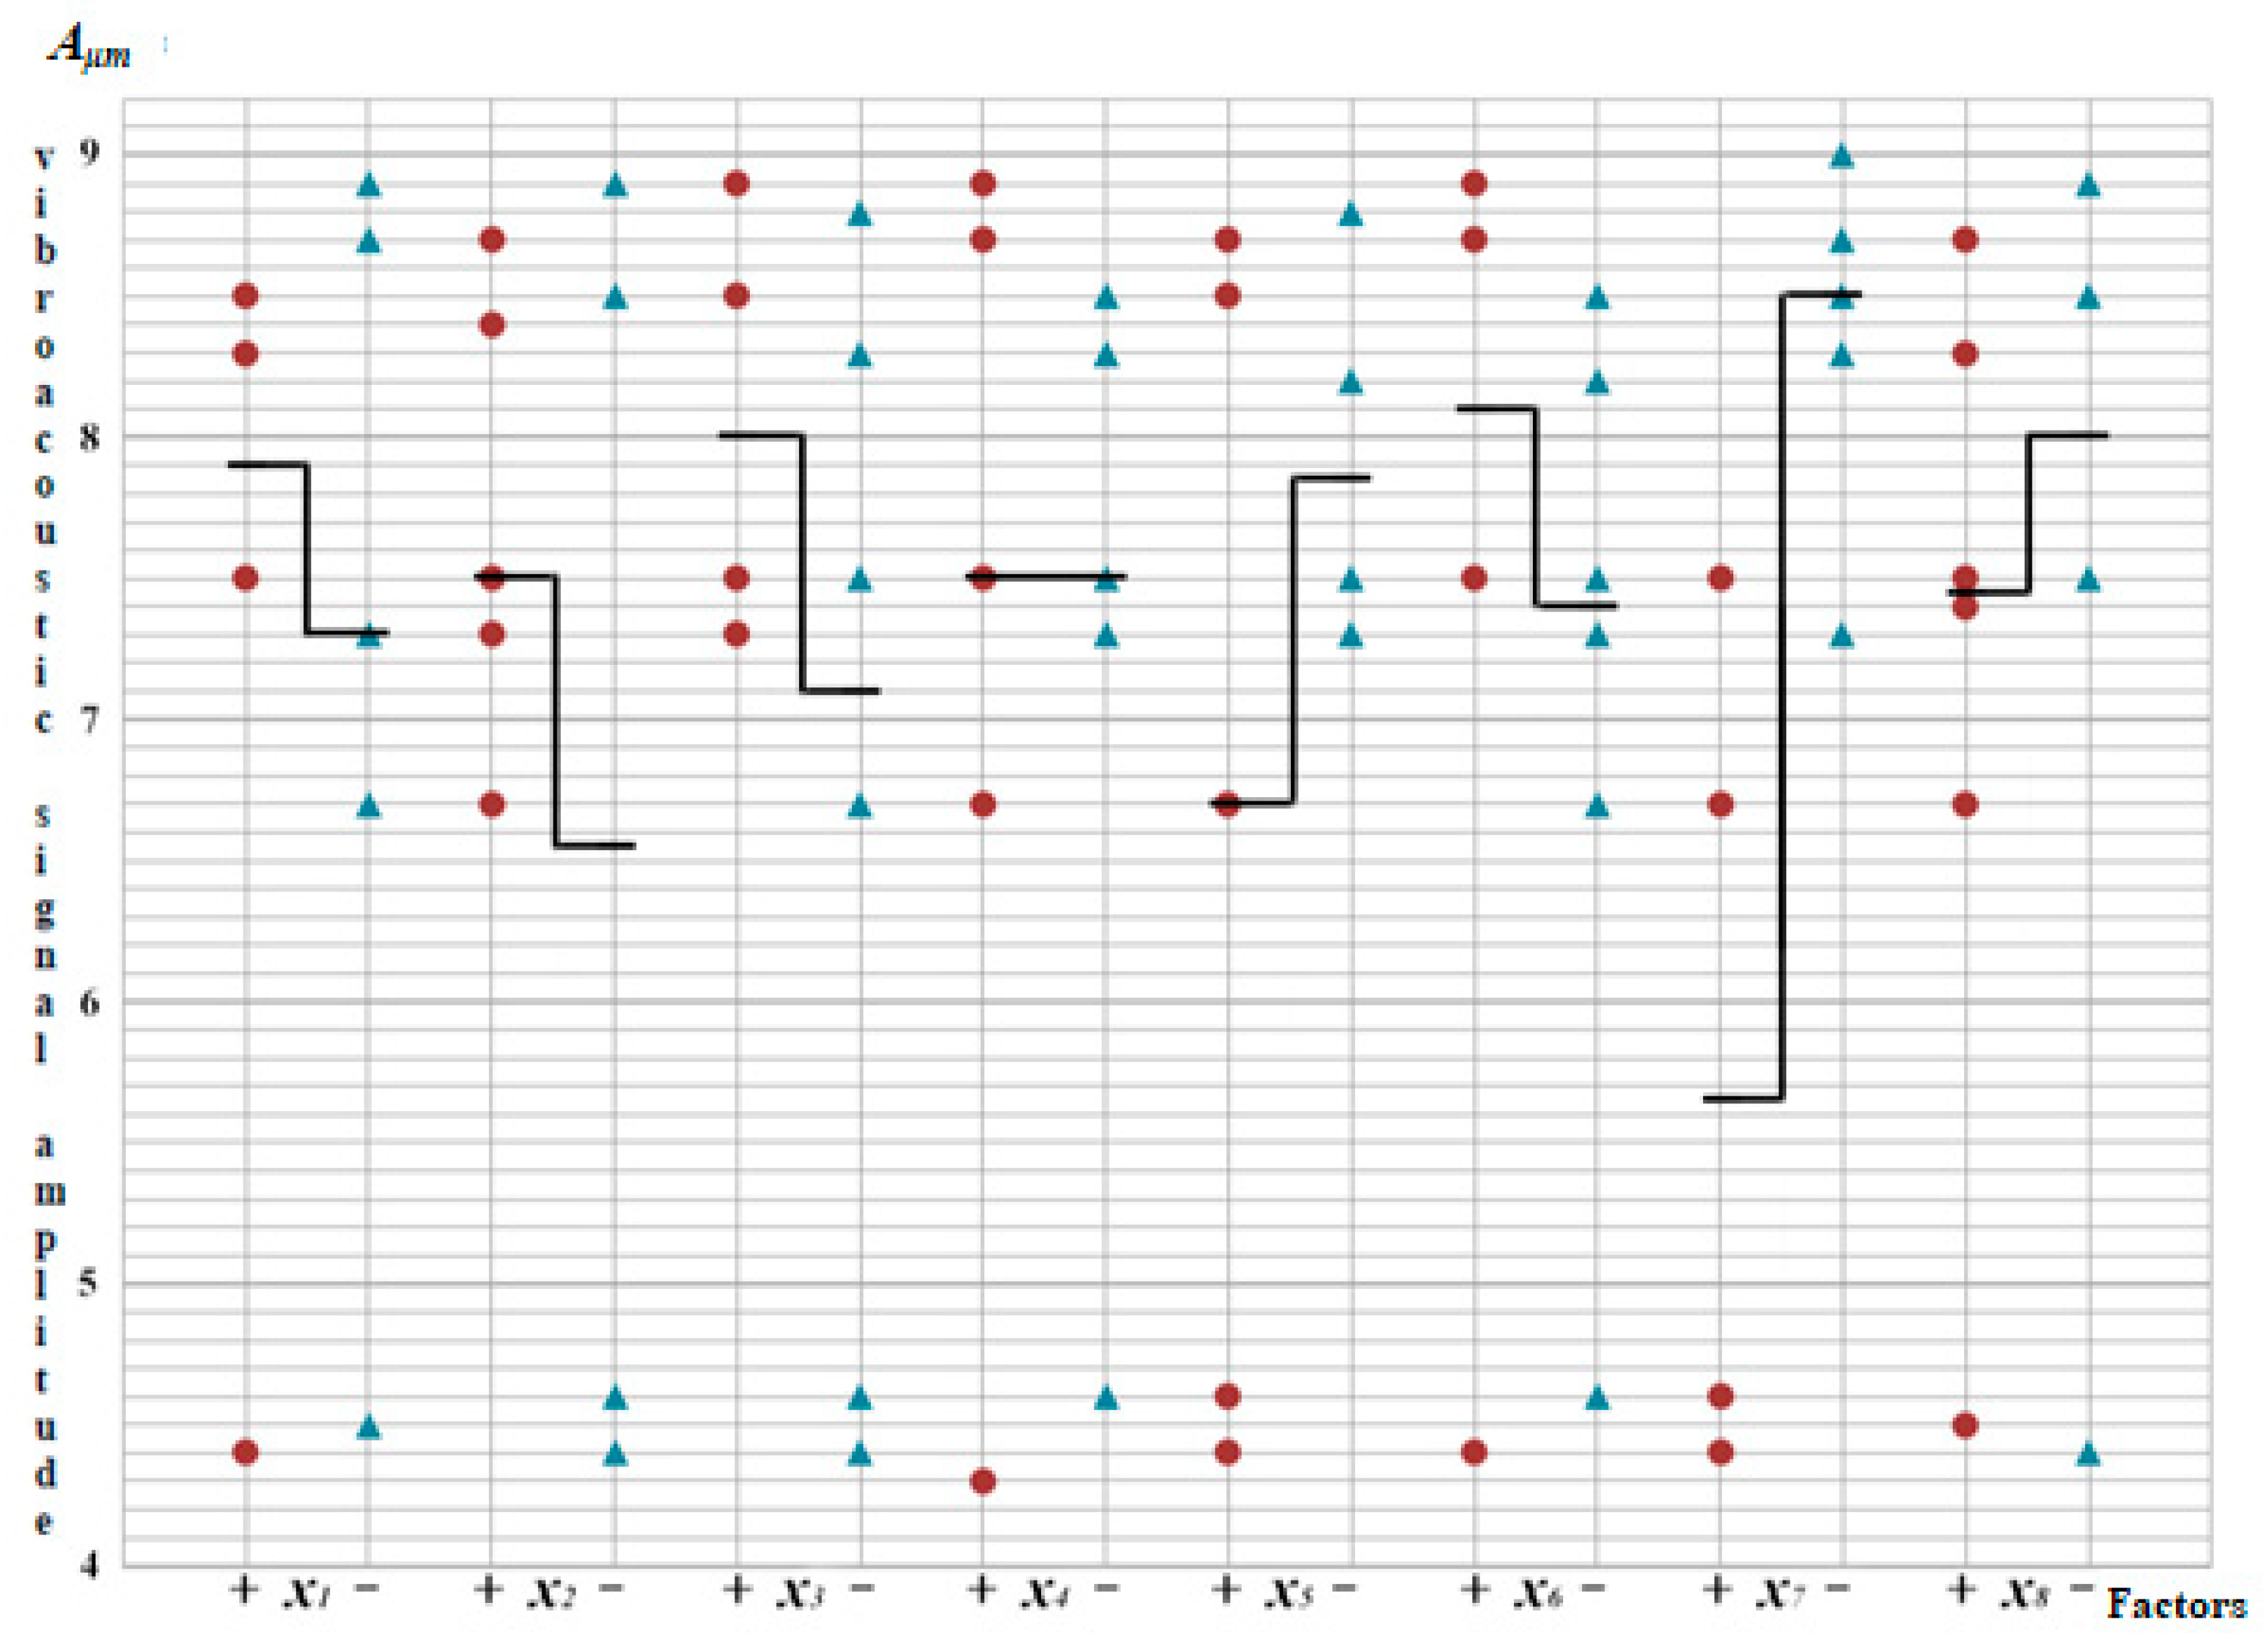
After adjusting the first and fourth factors, a second experiment was set up, consisting of 10 experiments. The results obtained after adjusting the influence of the first and fourth factors are shown in Figure 3.
From the scatterplot of the results obtained after the first adjustment (Figure 2), factors are visually distinguished as x 2 (the difference between the medians is 1.1) and x 7 (the difference between the medians is 2.9). An auxiliary table with two inputs was similarly constructed (Table 6).
To fill in the cell in Table 6 at the intersection of row + x 2 and column + x 7 , it is necessary to take the results of experiments ( y e x p 1 ) numbered 2, 8, and 9 from Table 5. As a result, the average values of the optimization criterion will be equal to
y 1 = 7.5 + 7.5 + 6.7 3 = 7.2
To fill in the cell in Table 6 at the intersection of row + x 2 and column x 7 , it is necessary to take the results of experiments ( y e x p 1 ) numbered 5, 6, and 10 from Table 5, then
y 2 = 7.3 + 8.7 + 8.3 3 = 8.1
To fill in the cell in Table 6 at the intersection of row x 2 and column + x 7 it is necessary to take the results of experiments ( y e x p 1 ) under numbers 1 and 4 from Table 5, and for the cells at the intersection of row x 2 and column x 7 , it is necessary to take the results of experiments ( y e x p 1 ) under numbers 3 and 7 from Table 5. As a result, we obtain
y 3 = 4.6 + 4.4 2 = 4.5 ,   y 4 = 8.5 + 8.9 2 = 8.7
The magnitudes of the effects of the corresponding factors were calculated:
x 2 = y 1 + y 2 2 y 3 + y 4 2 = 1.065 1.1 ;   x 7 = y 1 + y 3 2 y 2 + y 4 2 = 2.535 2.5 .
Calculated values of t-criteria: t x 2 = 2.893 ; t x 7 = 6.887 .
Factor Effects x 2 and x 7 are significant with a 95% confidence level.
To remove the selected effects, the second correction of the experimental results was made. For this, all level results + x 7 were increased by 2.5, and all level results + x 2 were reduced by 1.1. The data after adjustment y e x p 2 were entered in Table 7.

2.3.3. Experiment 3

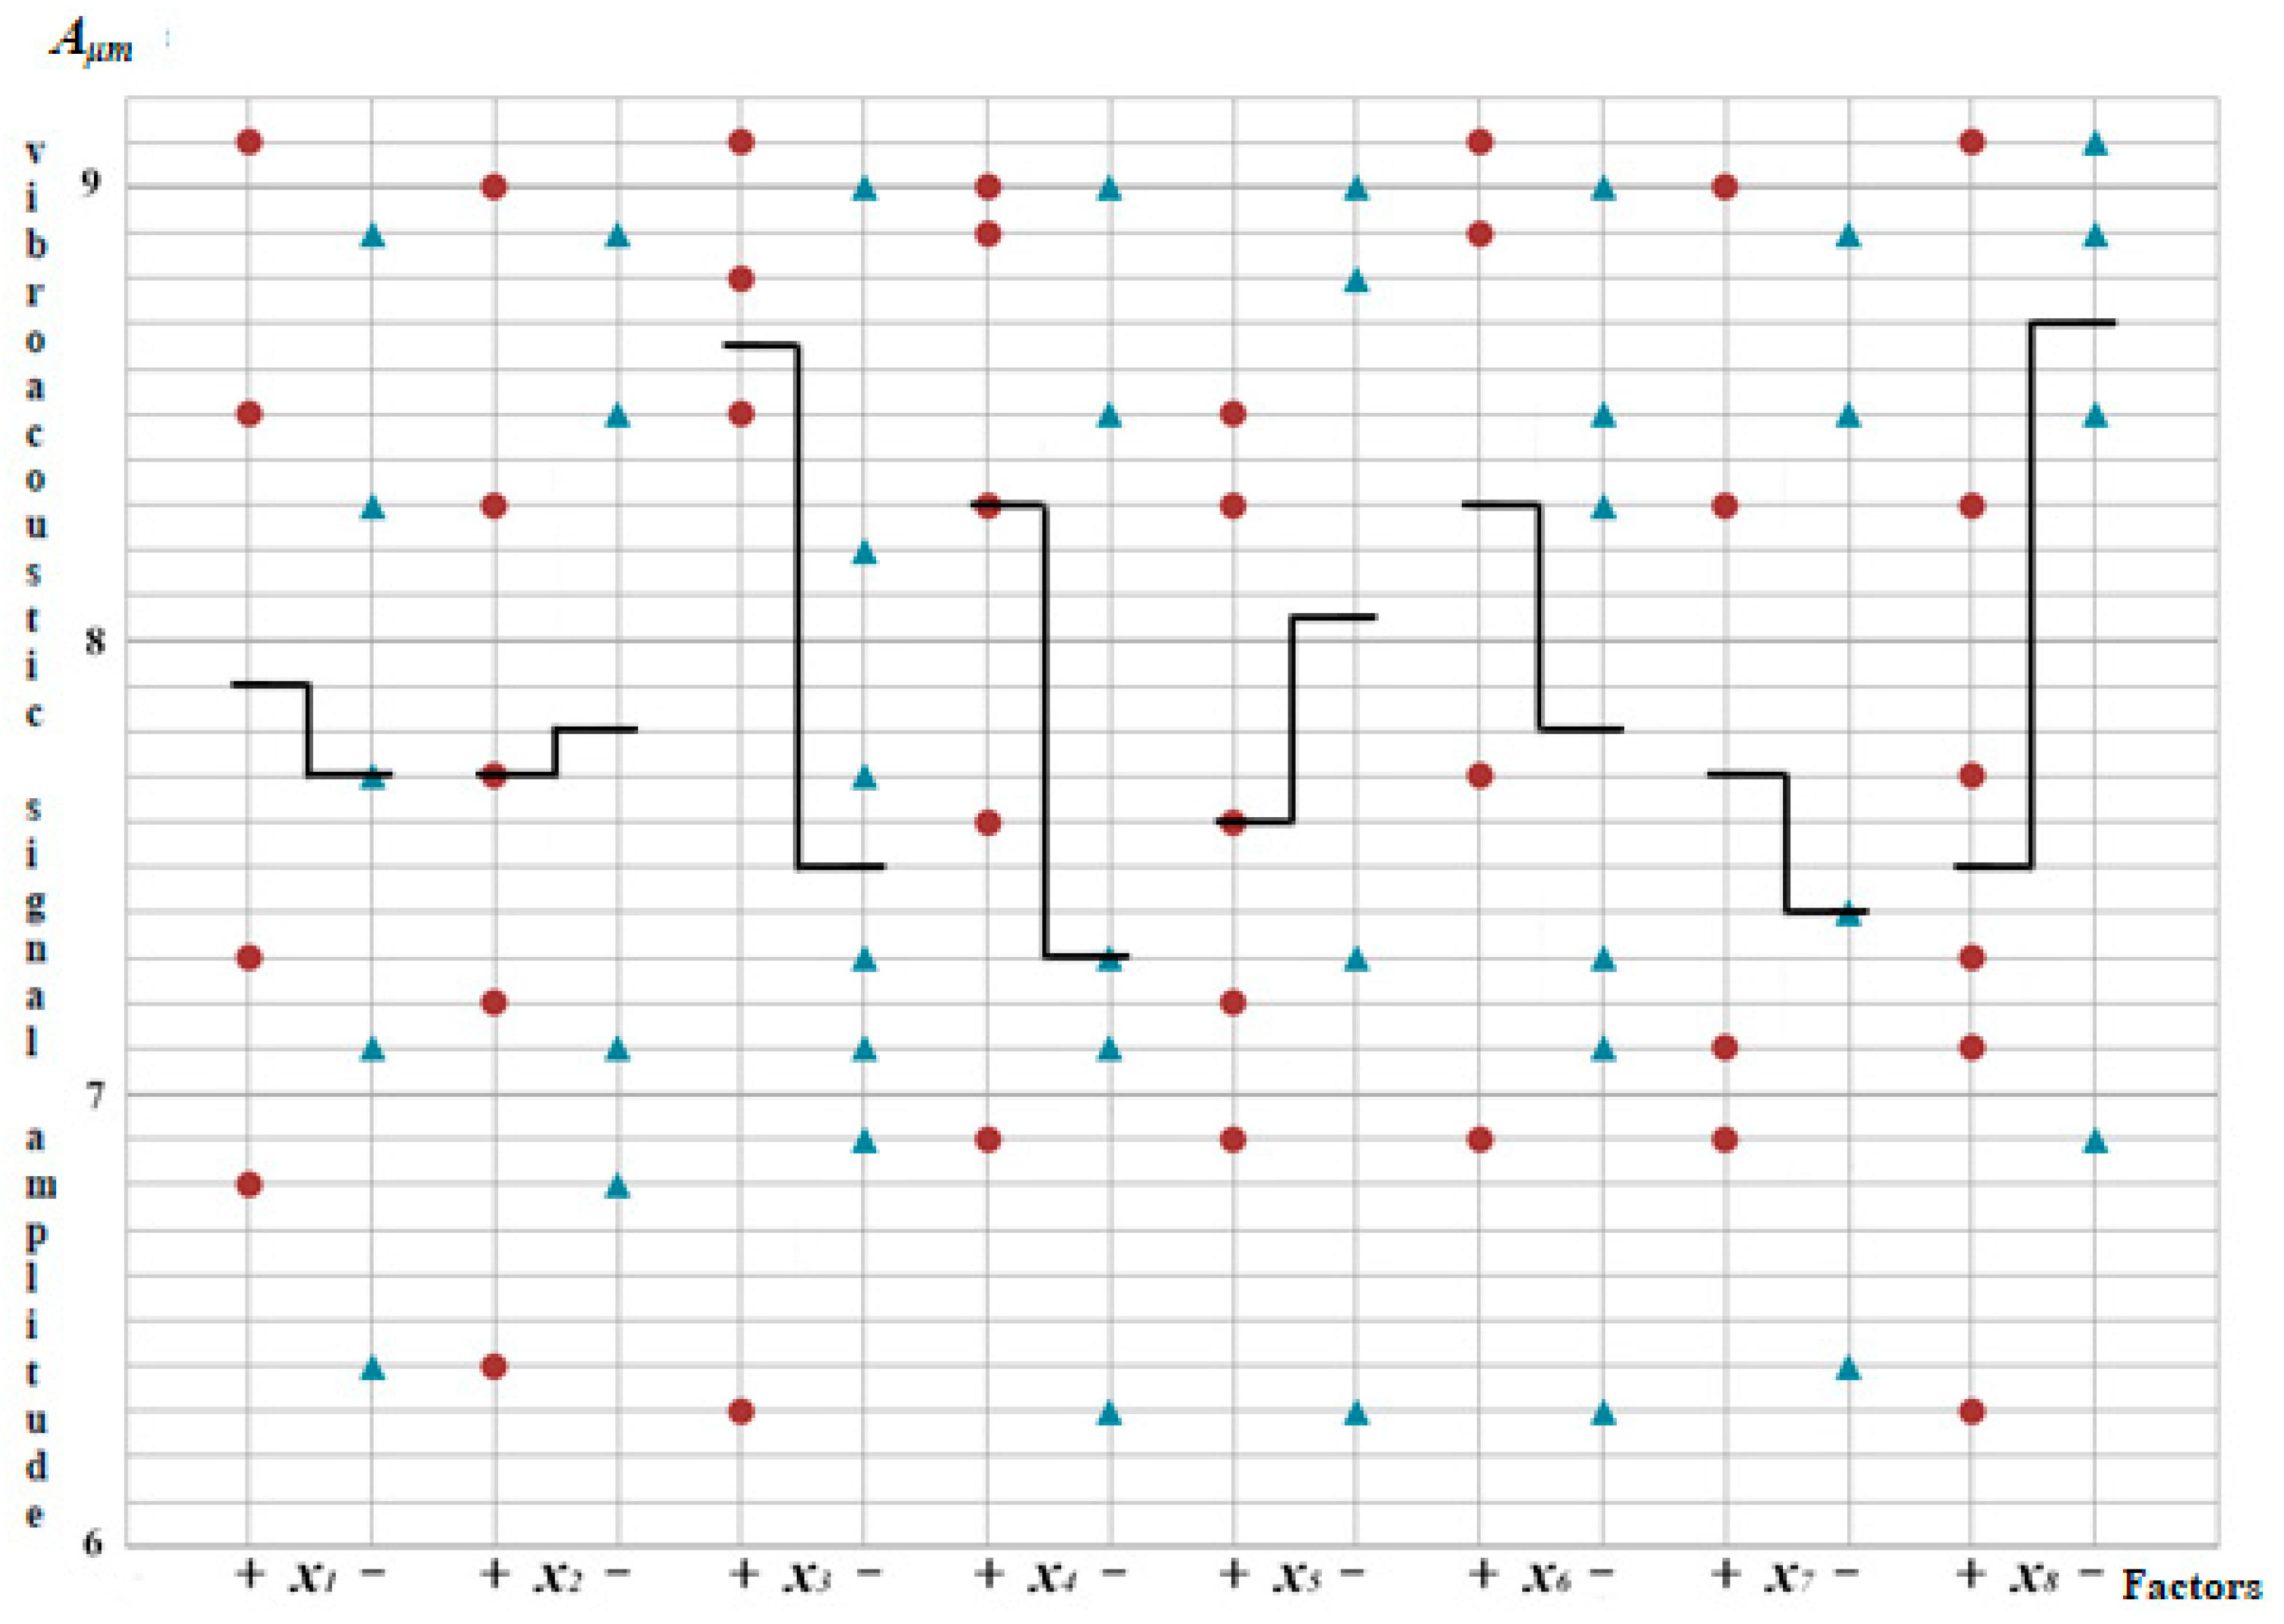
After adjusting the second and seventh factors, a third experiment consisting of 10 trials was conducted. The results obtained after adjusting the influence of the second and seventh factors are shown in Figure 4. From the scatterplot of the results obtained after the second adjustment (Figure 4), factors are visually distinguished as x 3 (the difference between the medians is 1.2), x 4 (the difference between medians is 1.0), x 5 (the difference between the medians is 0.5), and x 8 (the difference between the medians is 1.2). However, in the case of x 4 there has already been an attempt to take into account the influence of the factor, so an auxiliary table with three inputs was built.
A supersaturated plan allows a more accurate assessment of the effects, but often does not make it possible to fill in all the cells of the table [25,30]. This situation arose when constructing a table with three inputs for factors x 3 , x 5 , and x 8 (Table 8). Therefore, we had to limit ourselves to building a table with two inputs (Table 9).
The experiment, at + x 3 and + x 8 for the case when x 5 was at the upper level (+), was not planned; therefore, in Table 8, a dash is put in the first cell.
To fill in the cell in Table 8 at the intersection of row + x 3 and column + x 8 , for the case when x 5 was at the lower level ( ), we take the result ( y e x p 2 ) of experiment 5 from Table 7.
In the cell (Table 8) at the intersection of row + x 3 and column x 8 , for the case when x 5 was at the upper level (+), it is necessary to take the result ( y e x p 2 ) of experiment 3 from Table 7.
To fill in the cell at the intersection of row + x 3 and column x 8 , for the case when x 5 was at the lower level ( ), it is necessary to take the results of experiments ( y e x p 2 ) numbered 7 and 8 from Table 7. We obtain that
y 4 = 8.9 + 8.9 2 = 8.9
To calculate the average value of the optimization criterion y 5 (the intersection at row x 3 and a column + x 8 , for the case when x 5 was at the top level ( + ), from Table 7 we take the results of experiments ( y e x p 2 ), numbered 1, 6, and 9. We obtain that
y 5 = 7.1 + 7.6 + 8.1 3 = 7.6
To fill in the cell at the intersection of row x 3 and column + x 8 , for the case when x 5 was at the lower level ( ), it is necessary to take the results of experiments ( y e x p 2 ) with numbers 2 and 10 from Table 7. We obtain that
y 6 = 8.9 + 7.2 2 = 8.05
To fill in the cell at the intersection of row x 3 and column x 8 , for the case when x 5 was at the top level ( + ), it is necessary to take the result of the experiment ( y e x p 2 ) number 4 from Table 7.
The experiment when x 3 and x 8 for the case when x 5 was at the low level ( ), was not planned, therefore, in Table 8, a dash is put in the last cell.
To further study the effects of factors, we built a table with two inputs (Table 9).
In accordance with Formula (3), the magnitudes of the effects of the corresponding factors were calculated: x 3 = 0.5125 0.5 and x 5 = 0.0625 0.1 .
Calculated values of t-criteria: t x 3 = 0.81 ; t x 5 = 0.10 .
Factor Effects x 3 and x 5 are not significant either for the 5% or for the 10% significance level.
During the third adjustment of the results of the experiment, all results at the level + x 3 were reduced by 0.5, and all results at the level + x 5 were increased by 0.1. The data after adjustment ( y e x p 3 ) were entered in Table 10.

2.3.4. Experiment 4

After adjusting the third and fifth factors, the fourth experiment was set up, consisting of 10 experiments. The results obtained after adjusting the influence of the second and seventh factors are shown in Figure 5.
To calculate the magnitude of the effects of the factors x 6 and x 8 , an auxiliary table with two inputs (Table 11) was built based on the data in Table 10.
For example, to calculate y ¯ 3 (the cell located at the intersection of row x 6 and column + x 8 ), it is necessary to take the results of experiments ( y ¯ exp 3 ) from Table 10 with numbers 1, 5, 9, and 10. We obtain that
y ¯ 3 = 7.2 + 5.7 + 8.2 + 7.2 4 = 7.075
The magnitudes of the effects of the corresponding factors were calculated: x 6 = 0.3375 0.34 ; x 8 = 0.2875 0.29 .
Calculated values of t-criteria: t x 6 = 0.632 ; t x 8 = 0.539 .
Factor Effects x 6 and x 8 are not significant for either the 5% or 10% significance level.

3. Results

Step IV. Based on the results of the calculations, an effect diagram was constructed, which gives a visual representation of the degree of influence of each factor and allows us to note the three most significant of them: x 4 , x 7 , and x 1 (Figure 6).
The following factors were chosen as those most strongly affecting the vibration of a marine diesel engine: a fixed angle of rotation of the crankshaft (with an increase in the angle, the normal force changes due to the action with which the piston is shifted), the mobility of the piston rings, and the gap between the bushing and the piston.

Recommendations for the Practical Use of Research Results

As the crankshaft rotates, the normal force changes, causing the piston to move, but this factor is not related to the wear of the cylinder-piston group. The mobility of the piston rings depends on various properties, with coking being the most significant as it affects the collision process between the piston and the cylinder liner. Currently, there are methods for calculating and developing technical solutions for ring materials and shapes. Among all the considered parameters, determining and diagnosing the factor f 3 (the gap between the cylinder liner and the piston) on a running engine is the most challenging and requires additional research.
For instance, the application of similarity theory and dimensional analysis resulted in an equation that establishes the analytical relationship between the gap size and the intensity of both mechanical and gas-dynamic effects on the engine components [13]:
δ = F C V ¯ ω S p n ,   K 1 m ,   K 2 r ,   K 3 l ,
where K 1 = D czvt + kD czb S p · D c 2 · P z , K 2 = D czvt + cD czb N max , K 3 = P z ρ · h · n 2 .
The designations adopted in Equation (6) are given in Table 12.
To determine seven unknown coefficients of Equation (1), it is recommended to use the least squares method [13].
Figure 7 presents the results of calculating the gap between the bushing and the piston of twelve studied diesel engines, main characteristics of which are given in Table 13. The calculation was performed using the data provided in the technical guidance material (RTM 212.0060-76) in [13].
From the results presented in Figure 7, it can be seen that the spread of the gap relative to the average value does not exceed 7%.

4. Discussion

Modeling methods are effectively used for the correct solution of problems related to the assessment, diagnostics, and control of complex processes [32,33]. Their application allows for the construction of adequate, correct, and informative models [34,35], and they are used to analyze processes in all areas of human activity [35,36].
The safe operation of transport fleet ships largely depends on the reliability of their main engines [37,38]. However, the technical means of monitoring the performance of marine diesel engines during their operation are currently not effective enough and need to be improved.
The vibroacoustic index and the concentration of wear products in lubricating oil are among the most informative diagnostic parameters of a marine diesel engine [37,38]. However, there are known difficulties in using the vibroacoustic indicator [39]. Therefore, the development of new, more advanced and mobile hardware and software, as well as the search for the new scientific and methodological approaches to the use of information contained in the spectrum of vibration parameters, is relevant [40,41].
The study of internal combustion engines requires the application of methods from the theory of experimental design, with the help of which it is possible to systematically study the influence of various factors on the operation of the engine. Random experimental designs are widely used for this purpose as they provide systematic control over variables and maximize the accuracy of estimates.
One such randomized experimental tool is the random balance method, which has been successfully applied in various fields of research, including agriculture, medicine, and mechanical engineering [42,43]. The random balance method assumes a random distribution of procedures between experimental units while ensuring the balance of the scheme in relation to various factors that can affect the result [23,42]. Such balance helps minimize the influence of variables that can lead to biased estimates of influence effects [29,30].
The random balance method can be used to study the influence of various factors on internal combustion engines, such as fuel type, compression ratio, ignition timing, air–fuel ratio, etc. Using the random balance method, researchers can verify that the influence of these factors is properly controlled. Additionally, the random balance method can be extended to more complex experimental approaches, such as factorial designs, which allow several factors to be examined simultaneously. Such approach could help researchers identify the interactions between various factors and their influence on engine performance, providing valuable insights into the underlying mechanisms of engine operation.
In summary, the random balance method is a powerful tool for studying complex processes in internal combustion engines. Its use can help minimize the impact of variables and maximize the accuracy of estimates, leading to more accurate and informative inferences. The presented analysis of the factors influencing the diagnostic signal, as well as the approach to establishing the degree of their influence based on the use of the considered experiment planning method, made it possible to reduce the volume of experimental studies and contributed to the adoption of the most reasonable decisions.

5. Conclusions

An analysis of the factors affecting the vibration of a marine diesel engine caused by the operation of the cylinder-piston group has allowed for the determination of the most significant parameters of its vibration activity. Based on the application of expert methods, a priori ranking of the factors influencing the vibration level of a marine diesel engine was carried out, identifying the 8 most significant factors out of the 14 studied. The results of a full-scale experiment using the methods of experimental design theory, particularly the random balance method, confirmed the ranking of the three most significant factors. The proposed approach enables a significant reduction in the volume of experimental studies and the establishment of the nature and parameters of the relationship between the vibration activity of a marine diesel engine and the processes occurring in its cylinder-piston group.
Based on the use of two different approaches, expert and mathematical, it has been determined that the gap between the cylinder liner mirror and the piston bore is one of the most significant factors determining the vibration level of a marine diesel engine. The mathematical dependence (6) proposed in this study allows for the determination of the value of the diametrical gap between the cylinder liner and the piston trunk based on the measured level of vibration velocity, calculation of the current wear rate of the parts of the cylinder-piston group, and more informed decision-making regarding the frequency of maintenance and repairs of marine diesel engines.
The developed mathematical and methodological apparatus allows for the following:
  • Evaluation of the current technical condition of the cylinder-piston group of a marine diesel engine based on its vibration parameters.
  • Forecasting of its residual resource.
  • Timely specification of the time for scheduled preventive maintenance and repair of marine diesel engines in operation.
Based on the results of the study, the following conclusions can be drawn:
  • The use of methods of experimental design theory, similarity theory, and dimension analysis using full-scale experimental data enables the determination and refinement of the relationship between the vibration parameters and the technical condition of the marine diesel cylinder-piston group through calculation.
  • The size of the gap between the cylinder liner mirror and the piston trunk is one of the most significant factors affecting the level of vibration of a marine diesel engine caused by the operation of the cylinder-piston group.
  • Measurement of the vibration level on the legs of a marine diesel engine and the use of Equation (6) to calculate the gap between the cylinder liner and the piston trunk enables the determination of its current values and prediction of the change in the gap in such a complex tribocouple as a cylinder-piston group.
  • The practical implementation of the results of the conducted research requires more detailed initial data on the parameters of the interaction between the piston and the cylinder liner of a specific marine diesel engine.
The offered nondestructive control method is a powerful monitoring tool of a ship’s power installation’s state during operation. It allows a considerable increase in the accuracy and efficiency of the estimation of the most significant indicators of a ship’s diesel engine’s vibration activity, caused, first of all, by the operation of a cylinder-piston group, and also to reduce the number of expensive, difficult-to-reproduce full-scale tests.
The method’s effectiveness in application is illustrated in the example of vibration level dependence research on a ship diesel engine’s design and technological characteristics. Implementation of the proposed method in operation will increase the reliability of ship diesel engine diagnostics, increase the speed of defect detection and, consequently, reduce expenses for their operation and decrease the negative influence on the environment.

Author Contributions

Conceptualization, O.A. and O.B.; methodology, O.A. and D.P.; software, D.T. and O.A.; validation, D.P. and D.T.; formal analysis, O.A.; investigation, O.A.; resources, O.A.; data curation, O.A.; writing—original draft preparation, O.A. and D.P.; writing—review and editing, O.A. and D.T.; visualization, O.A.; supervision, D.P.; project administration, O.A.; funding acquisition, O.A. All authors have read and agreed to the published version of the manuscript.

Funding

This research received no external funding.

Data Availability Statement

Not applicable.

Conflicts of Interest

The authors declare no conflict of interest.

References

  1. Martirosyan, A.V.; Martirosyan, K.V.; Mir-Amal, A.M.; Chernyshev, A.B. Assessment of a Hydrogeological Object’s Distributed Control System Stability. In Proceedings of the 2022 Conference of Russian Young Researchers in Electrical and Electronic Engineering (ElConRus), Saint Petersburg, Russia, 25–28 January 2022; pp. 768–771. [Google Scholar] [CrossRef]
  2. Kukharova, T.V.; Utkin, V.A.; Pershin, I.M. Modeling of a Decision Support System for a Psychiatrist Based on the Dynamics of Electrical Conductivity Parameters. In Proceedings of the 2021 IEEE Conference of Russian Young Researchers in Electrical and Electronic Engineering (ElConRus), Saint Petersburg, Moscow, Russia, 26–28 January 2021; pp. 975–978. [Google Scholar] [CrossRef]
  3. Ilyushin, Y.V. Development of a Process Control System for the Production of High-Paraffin Oil. Energies 2022, 15, 6462. [Google Scholar] [CrossRef]
  4. Martirosyan, A.V.; Ilyushin, Y.V. Modeling of the Natural Objects’ Temperature Field Distribution Using a Supercomputer. Informatics 2022, 9, 62. [Google Scholar] [CrossRef]
  5. Pershin, I.M.; Kukharova, T.V.; Tsapleva, V.V. Designing of distributed systems of hydrolithosphere processes parameters control for the efficient extraction of hydromineral raw materials. J. Phys. Conf. Ser. 2021, 1728, 012017. [Google Scholar] [CrossRef]
  6. Asadulagi, M.M.; Ioskov, G.V. Simulation of the control system for hydrodynamic process with random disturbances. In Proceedings of the International Forum-Contest of Young Researchers, Topical Issues of Rational Use of Natural Resources, Saint Petersburg, Russia, 18–20 April 2018; pp. 399–405. [Google Scholar]
  7. Cherepovitsyn, A.; Evseeva, O. Parameters of Sustainable Development: Case of Arctic Liquefied Natural Gas Projects. Resources 2020, 10, 1. [Google Scholar] [CrossRef]
  8. Gusev, V.; Blishchenko, A.; Sannikova, A. Study of a set of factors influencing the error of surveying mine facilities using a geodesic quadcopter. J. Min. Inst. 2022, 254, 173–179. [Google Scholar] [CrossRef]
  9. Karimshoushtari, M.; Novara, C. Design of experiments for nonlinear system identification: A set membership approach. Automatica 2020, 119, 109036. [Google Scholar] [CrossRef]
  10. Alcan, G.; Unel, M.; Aran, V.; Yilmaz, M.; Gurel, C.; Koprubasi, K. Predicting NOx emissions in diesel engines via sigmoid NARX models using a new experiment design for combustion identification. Measurement 2019, 137, 71–81. [Google Scholar] [CrossRef]
  11. Zhukov, V.; Butsanets, A.; Sherban, S.; Igonin, V. Monitoring Systems of Ship Power Plants During Operation. In Energy Management of Municipal Transportation Facilities and Transport, Proceedings of the International Scientific Conference Energy Management of Municipal Facilities and Sustainable Energy Technologies EMMFT 2018, Voronezh, Samara, Russia, 10–13 December 2018; Advances in Intelligent Systems and Computing; Springer International Publishing: Cham, Switzerland, 2020; Volume 982, pp. 419–428. [Google Scholar] [CrossRef]
  12. Randall, R.B. Vibration-Based Condition Monitoring: Industrial, Aerospace and Automotive Applications, 2nd ed.; John Wiley & Sons: Chichester, UK, 2011; pp. 112–289. [Google Scholar]
  13. Tusov, L.V.; Bezyukov, O.K.; Afanaseva, O.V. Advances in Intelligent Systems and Computing. In Monograph; Polytechnic University: Saint Petersburg, Russia, 2012; 348p. (In Russian) [Google Scholar]
  14. Hruntovich, M.; Moroz, D.; Panfilov, A.; Zhuk, Y.; Mikhailova, E. Vibration Diagnostics of Power Equipment Before Commissioning. E3S Web Conf. 2020, 178, 01031. [Google Scholar] [CrossRef]
  15. Chi, X.; Di Maio, D.; Lieven, N.A.J. Health monitoring of bolted joints using modal-based vibrothermography. SN Appl. Sci. 2020, 2, 1446. [Google Scholar] [CrossRef]
  16. Goyal, D.; Pabla, B.S. The Vibration Monitoring Methods and Signal Processing Techniques for Structural Health Monitoring. Arch. Comput. Methods Eng. 2016, 23, 585–594. [Google Scholar] [CrossRef]
  17. Gavrilov, V.; Zhukov, V. Selection of the Ship’s Propulsion Complex Taking into Account the Criteria of Energy Efficiency of the Ship Power Plant. In Proceedings of the International Scientific Siberian Transport Forum TransSiberia-2021, Novosibirsk, Russia, 8–10 December 2021; Lecture Notes in Networks and Systems. Springer International Publishing: Cham, Switzerland, 2022; Volume 402, pp. 1290–1298. [Google Scholar] [CrossRef]
  18. Saucedo-Dorantes, J.J.; Delgado-Prieto, M.; Ortega-Redondo, J.A.; Osornio-Rios, R.A.; de Jesus Romero-Troncoso, R. Multiple-Fault Detection Methodology Based on Vibration and Current Analysis Applied to Bearings in Induction Motors and Gearboxes on the Kinematic Chain. Shock. Vib. 2016, 13, 5467643. [Google Scholar] [CrossRef]
  19. Khadersab, A.; Shivakumar, S. Vibration Analysis Techniques for Rotating Machinery and its effect on Bearing Faults. Procedia Manuf. 2018, 20, 247–252. [Google Scholar] [CrossRef]
  20. Boudiaf, A.; Djebala, A.; Bendjma, H.; Balaska, A.; Dahane, A. A summary of vibration analysis techniques for fault detection and diagnosis in bearing. In Proceedings of the 8th International Conference on Modelling, Identification and Control (ICMIC), Algiers, Algeria, 15–17 November 2016; pp. 37–42. [Google Scholar] [CrossRef]
  21. Liu, M.-K.; Tran, M.-Q.; Weng, P.-Y. Fusion of Vibration and Current Signatures for the Fault Diagnosis of Induction Machines. Shock. Vib. 2019, 2019, 7176482. [Google Scholar] [CrossRef]
  22. Zhukov, V.; Melnik, O. Influence of operational factors on the properties of working fluids of piston engines. E3S Web Conf. 2021, 244, 04005. [Google Scholar] [CrossRef]
  23. Sedov, L.I. Similarity and Dimensional Methods in Mechanics, 10th ed.; CRC Press: Boca Raton, FL, USA, 2018; pp. 50–123. [Google Scholar] [CrossRef]
  24. Zohuri, B. Dimensional Analysis and Self-Similarity Methods for Engineers and Scientists; Springer International Publishing: Cham, Switzerland, 2015; pp. 253–294. [Google Scholar] [CrossRef]
  25. Cicală, E.; Soveja, A.; Sallamand, P.; Grevey, D.; Jouvard, J.M. The application of the random balance method in laser machining of metals. J. Mater. Process. Technol. 2008, 196, 393–401. [Google Scholar] [CrossRef]
  26. Sidorenko, A.A.; Dmitriev, P.N.; Sirenko, Y.G. Predicting Methane Emissions from Multiple Gas-Bearing Coal Seams to Longwall Goafs at Russian Mines. ARPN J. Eng. Appl. Sci. 2021, 16, 851–857. [Google Scholar]
  27. Waite, T.W.; Woods, D.C. Minimax Efficient Random Experimental Design Strategies with Application to Model-Robust Design for Prediction. J. Am. Stat. Assoc. 2022, 117, 1452–1465. [Google Scholar] [CrossRef]
  28. Shalimov, A.V. Investigation of the Pre-Repair Condition of the Main Interfaces of Marine Diesel Engines by a Non-Disassembly Method. Ph.D. Thesis, Leningrad Water Transport Institute, Leningrad, USSR, 1979. (In Russian). [Google Scholar]
  29. Satterthwaite, F.E. Random Balance Experimentation. Technometrics 1959, 1, 111–137. [Google Scholar] [CrossRef]
  30. Barshchevsky, G.E. Using the method of random balance in the problems of a screening experiment for ship automated systems. Vestn. Gos. Univ. Morskogo Rechn. Flot. Im. Admirala S.O. Makarova 2012, 3, 118–123. Available online: https://cyberleninka.ru/article/n/ispolzovanie-metoda-sluchaynogo-balansa-v-zadachah-otseivayuschego-eksperimenta-dlya-sudovyh-avtomatizirovannyh-sistem (accessed on 14 February 2023).
  31. Milanovic, D.L.; Milanovic, D.D.; Misita, M. Application of ranking method in evaluation of engineering investment projects. Int. J. Ind. Eng. Theory Appl. Pract 2010, 17, 310–318. [Google Scholar]
  32. Yurak, V.; Dushin, A.; Mochalova, L. Vs sustainable development: Scenarios for the future. J. Min. Inst. 2020, 242, 242–247. [Google Scholar] [CrossRef]
  33. Razmanova, S.; Andrukhova, O. Oilfield service companies as part of economy digitalization: Assessment of the prospects for innovative development. J. Min. Inst. 2020, 244, 482–492. [Google Scholar] [CrossRef]
  34. Beloglazov, I.; Krylov, K. An Interval-Simplex Approach to Determine Technological Parameters from Experimental Data. Mathematics. 2022, 10, 2959. [Google Scholar] [CrossRef]
  35. Tsvetkov, P.; Fedoseev, S. Analysis of project organization specifics in small-scale LNG production. J. Min. Inst. 2021, 246, 678–686. [Google Scholar] [CrossRef]
  36. Afanasyev, A.; Safiullin, R.; Kuznetsova, E.; Podoprigora, N.; Vaga, V. Conceptual Approaches to Traffic Monitoring Design Under Varying Conditions of Vehicle Traffic. In Proceedings of the 2022 International Conference on Engineering Management of Communication and Technology (EMCTECH 2022), Vienna, Austria, 20–22 October 2022; pp. 1–5. [Google Scholar] [CrossRef]
  37. Yemelyanov, V.A.; Zhilenkov, A.A.; Chernyi, S.G.; Zinchenko, A.; Zinchenko, E. The Mathematical Models of the Operation Process for Critical Production Facilities Using Advanced Technologies. Inventions 2022, 7, 8. [Google Scholar] [CrossRef]
  38. Gavrilov, V.; Medvedev, V.; Bogachev, D. Spontaneous Combustion of Pilot Fuel in Dual-Fuel Engine. In Energy Management of Municipal Transportation Facilities and Transport, Proceedings of the International Scientific Conference Energy Management of Municipal Facilities and Sustainable Energy Technologies EMMFT 2019, Voronezh, Russia, 10–13 December 2019; Advances in Intelligent Systems and Computing; Springer International Publishing: Cham, Switzerland, 2021; Volume 1258, pp. 361–374. [Google Scholar] [CrossRef]
  39. Sadeghi, I.; Ehya, H.; Faiz, J.; Ostovar, H. Online fault diagnosis of large electrical machines using vibration signal-a review. In Proceedings of the 2017 International Conference on Optimization of Electrical and Electronic Equipment (OPTIM) & 2017 Intl Aegean Conference on Electrical Machines and Power Electronics (ACEMP), Brasov, Romania, 25–27 May 2017; pp. 470–475. [Google Scholar] [CrossRef]
  40. Mohd Ghazali, M.H.; Rahiman, W. Vibration Analysis for Machine Monitoring and Diagnosis: A Systematic Review. Shock. Vib. 2021, 2021, 9469318. [Google Scholar] [CrossRef]
  41. Chernetska, S.; Beley, N.; Demchuk, M. The method of random balance for studying the influence of excipients quantities on technological parameters of tablets based on Origanum vulgare L. dry extract. EUREKA Health Sci. 2021, 2, 73–81. [Google Scholar] [CrossRef]
  42. Chernyi, S.; Emelianov, V.; Zinchenko, E.; Zinchenko, A.; Tsvetkova, O.; Mishin, A. Application of Artificial Intelligence Technologies for Diagnostics of Production Structures. J. Mar. Sci. Eng. 2022, 10, 259. [Google Scholar] [CrossRef]
  43. Ponomarenko, T.; Nevskaya, M.; Jonek-Kowalska, I. Mineral Resource Depletion Assessment: Alternatives, Problems, Results. Sustainability 2021, 13, 862. [Google Scholar] [CrossRef]
Figure 1. Structural and logical diagram for evaluating the factors that influence the vibration of a marine diesel engine caused by the operation of the cylinder-piston assembly.
Inventions 08 00071 g001
Figure 2. Scatterplot of observational results by factor levels (compiled by the authors according to [28]).
Inventions 08 00071 g002
Figure 3. Scatterplot of the results obtained after the first adjustment of the experimental results.
Inventions 08 00071 g003
Figure 4. Scatterplot of results obtained after the second adjustment.
Inventions 08 00071 g004
Figure 5. Scatterplot of results obtained after the third adjustment.
Inventions 08 00071 g005
Figure 6. Diagram of effects identified by the random balance method when studying the influence of various factors on the magnitude of the vibroacoustic signal.
Inventions 08 00071 g006
Figure 7. Calculated and experimental values of the gap between the mirror of the cylinder liner and the piston of diesel engines, in meters: row 1 shows the calculated gap values (average frequency of octave bands 500 Hz), while row 2 shows the average values of the actual gap.
Inventions 08 00071 g007
Table 1. Summary table of expert ranks.
f Experts R d 2
12345678910
f 1 1111148.531223.52652.25
f 2 459.52.5263.51.55948729
f 3 7327346410.5248.5702.25
f 4 269.54443.57134.557.5306.25
f 5 3335.5611.511.52.52391296
f 6 8311.55.5711.53.582.51171.512.25
f 7 57.542.551.53.55.554.544961
f 8 67.558811.511.55.5513.581.542.25
f 9 9107.512.5107.58.5986.588.5182.25
f 10 10107.5997.58.51086.586121
f 11 11106101211.58.51110.511101.5702.25
f 12 131211.512.5131.511.51288103784
f 13 141313141411.514131211129.52970.25
f 14 121414111111.513141413.51282809
Table 2. The most significant parameters affecting the vibration of the marine diesel engine.
Factor NotationParameter
Name
Parameter WeightLevels of Factor Variation
Bottom (−1)Top (+1)
x 1 Gap between sleeve and piston ( f 1 )0.1821ultimatemounting
x 2 The amount of air leakage: in valves, piston rings, gasket under the cylinder head ( f 2 )0.0889maximum leaks (limit wear)leakage is minimal (corresponds to a new engine)
x 3 Piston material ( f 3 )0.0880aluminumcast iron
x 4 Fixed crank angle ( f 4 )0.0744 11 0 9 0
x 5 The amount of pressure of compressed air supplied to the cylinder ( f 5 )0.109475
x 6 Vacuum degree in the cylinder ( f 6 )0.05981.00.5
x 7 Piston ring mobility ( f 7 )0.0970cokedmobile
x 8 Elasticity of piston rings ( f 8 )0.0526more than the allowable valueless than the allowable value
Table 3. Matrix for designing screening experiments.
Experience NumberFactors y
x 1 x 2 x 3 x 4 x 5 x 6 x 7 x 8
1+++4.6
2+++++5.3
3+++6.3
4+++++5.0
5+++7.3
6+++++11.5
7+++11.7
8+++++8.1
9+++++9.5
10+++6.1
Table 4. Table with two inputs for calculating the effects of factors x 1 , x 4 .
Factors Assessed + x 4 x 4
+ x 1 y 1 = 6.55 y 2 = 5.9
x 1 y 3 = 10.9 y 4 = 5.95
Table 5. Matrix for designing screening experiments developed on the experiment 1 results.
Experiment NumberFactors y y e x p 1
x 1 x 2 x 3 x 4 x 5 x 6 x 7 x 8
1+++4.64.6
2+++++5.35.3 + 2.2 = 7.5
3+++6.36.3 + 2.2 = 8.5
4+++++5.05.0 + 2.2 − 2.8 = 4.4
5+++7.37.3
6+++++11.511.5 − 2.8 = 8.7
7+++11.711.7 − 2.8 = 8.9
8+++++8.18.1 + 2.2 − 2.8 = 7.5
9+++++9.59.5 − 2.8 = 6.7
10+++6.16.1 + 2.2 = 8.3
Table 6. Table with two inputs for calculating the effects of x 2 , x 7 .
Factors Assessed + x 7 x 7
+ x 2 y 1 = 7.2 y 2 = 8.1
x 2 y 3 = 4.5 y 4 = 8.7
Table 7. Matrix for designing screening experiments developed on the experiment 2 results.
Experiment NumberFactors y e x p 1 y e x p 2
x 1 x 2 x 3 x 4 x 5 x 6 x 7 x 8
1+++4.64.6 + 2.5 = 7.1
2+++++7.57.5 + 2.5 − 1.1 = 8.9
3+++8.58.5
4+++++4.44.4 + 2.5 = 6.9
5+++7.37.3 − 1.1 = 6.2
6+++++8.78.7 − 1.1 = 7.6
7+++8.98.9
8+++++7.57.5 + 2.5 − 1.1 = 8.9
9+++++6.76.7 + 2.5 − 1.1 = 8.1
10+++8.38.3 − 1.1 = 7.2
Table 8. Table with three inputs for calculating the effects x 3 , x 5 , and x 8 .
Factors Assessed + x 8 x 8
+ x 5 x 5 + x 5 x 5
+ x 3 - y 2 = 6.2 y 3 = 8.5 y 4 = 8.9
x 3 y 5 = 7.6 y 6 = 8.05 y 7 = 6.9 -
Table 9. Table with two inputs for calculating the effects of x 3 , x 5 .
Factors Assessed + x 5 x 5
+ x 3 y 1 = 8.5 y 2 = 8
x 3 y 3 = 7.425 y 4 = 8.05
Table 10. Matrix for designing screening experiments developed on the experiment 3 results.
Experiment NumberFactors y e x p 3
x 1 x 2 x 3 x 4 x 5 x 6 x 7 x 8
1+++7.2
2+++++8.9
3+++8.1
4+++++7.0
5+++5.7
6+++++7.7
7+++8.4
8+++++8.4
9+++++8.2
10+++7.2
Table 11. Table with two inputs for calculating the effects of x 6 , x 8 .
Factors Assessed + x 8 x 8
+ x 6 y ¯ 1 = 8.3 y ¯ 2 = 7.7
x 6 y ¯ 3 = 7.075 y ¯ 4 = 8.25
Table 12. Explanation of the symbols used in the Equation (6).
DesignationName
δ clearance between the piston bore and cylinder liner mirror
D czb rigidity of the cylinder block
D czvt bushing stiffness
N max the maximum value of the lateral force
P z maximum cycle pressure
S p piston stroke
D c cylinder diameter
ω angular frequency
V ¯ vibration velocity measured on the motor feet
h bushing thickness
pmaterial density
n crankshaft speed
C ,   n , m , r , l , k , c unknown coefficients depending on the design features of the marine diesel engine and the damping properties of its materials
Table 13. Main characteristics of the studied diesel engines.
No. p/pBrandNe, kWn, min –1
18NVD 36/45662375
28NVD36220360
38NVD 36A309375
48NVD 48A736375
58NVD48493350
66NVD 48AI486330
76NVD48368350
86L275Rr276500
96ChSPH15/18(3D6H)110.41000
106H HSP18/22165.6750
116ChSPN18/22110750
126NVD26132.4750
Note. Ne—effective power, kW; n—nominal speed of the crankshaft, min−1.
Disclaimer/Publisher’s Note: The statements, opinions and data contained in all publications are solely those of the individual author(s) and contributor(s) and not of MDPI and/or the editor(s). MDPI and/or the editor(s) disclaim responsibility for any injury to people or property resulting from any ideas, methods, instructions or products referred to in the content.

