1. Introduction
The introduction of new services such as device-to-device (D2D) communication, machine-to-machine (M2M) communication and the internet of things (IoT), as well as the increased demand for mobile data, have necessitated the implementation of fifth-generation (5G) technology [
1]. This is due to the dense coverage, high capacity, low latency and high quality of service that can be achieved with 5G technology. The 5G will require gNodeB (macrocell) with other technology such as microcell, radio remote head (RRH), distributed antenna system (DAS), relay-based systems, picocell and femtocell to form a heterogeneous network. Cognitive radio, network function virtualization, software-defined networking (SDN), ultra-density and multiple input multiple output (MIMO) are other key 5G technologies. MIMO and massive MIMO technology will be integrated with 5G to improve network coverage, capacity and data rate at the macrocell level further. The 5G will further enhance the coverage, capacity, energy efficiency and spectral efficiency in a dead signal location.
Ultra-broadband backhaul links can be achieve using millimetre wave (mmWave) technology, this is to carry traffic to or from either small base stations (BSs) or relay stations in 5G. The 5G technology can be either centralized or distributed architecture, depending on how the baseband units and switch are deigned. The current 2G, 3G and 4G networks are all distributed, with each cell having it baseband unit interconnected from the end site to the backbone. The major backbone to the base station controller (BSC), universal mobile telecommunications system radio access network (URAN) and the evolved packet core (EPC). These networks are complex, high-latency, high intercell interference and required serval hand-off during movement. The technology is not capable of handling the current data requirement and modern applications such as D2D, IoT and M2M. Although a lot of study on 5G shows that there will be a complete change in the radio access network and the core network, this study shows otherwise. This study is necessary to reduce the capital expenditure (Capex) and operational expenditure (Opex), but at the same time meet all the requirements of 5G technology to reduce low latency. The study proposed a distributed wireless network architecture (DWNA) to complement the drawbacks of the centralized wireless network architecture (CWNA) for 5G deployment. Unlike the CWNA, the DWNA will reduce Capex and Opex, improve network security, reduce traffic bottlenecks and reduce the cost of transmission backhaul and fronthaul, since the architecture will have a cluster of baseband units (BBU) and small centralized radio access network (C-RAN), which will again reduce latency because the subscribers are closed the C-RAN and the switching is better than that of the CWNA. DWNA is used in bridging a number of access point, for examples buildings or offices, through a wireless local area network [
2].
3. Review of Related Works
The level of spatial densification in a 5G wireless network necessitates the use of small cells to form a distributed wireless network where mmWave technology is used for communication or data transfer [
3,
4] between cells and a multiprotocol label switching (MPLS) network or a fiber network is used for data transfer to the core network.
Many scholars have recommended the use of mmWave for small cell 5G heterogamous networks. mmWave technology is more dependable when it comes to attenuation due to rain, provided the required spectrum is used with small cell technology, especially for indoor use. mmWave is more efficient when used with directional antennas.
The proposed architecture will run on internet protocol (IP) backhauling and fronthauling using fiber-optic technology. mmWave will also be used as fronthauling from the RRH to the BBU for traffic offloading. The mmWave technology will change backhauling techniques in the mobile industry owing to the available spectrum at this band. The mmWave will help to reduce antenna sizes, enabling the fabrication of hundreds or thousands of antenna elements, even at the user equipment (UE). The start of 5G happens together with a global economic crisis. Mobile network operators (MNO) can never terminate investment in innovative technologies to obtain profits without any economic analysis.
According to reference [
5], MNO will require augmentation of a 5G new ratio (NR) or gNodeB to be able to render modern services such as IoT, D2D and M2M communication. This will require better and cost-effective planning. Reference [
6] presented an analysis comparing Capex, Opex, total cost of ownership (TCO), and network capacity based on antenna expansion, intercell interference and energy efficiency for a distributed antenna system (DAS) and femtocell. Reference [
2] examined the techno-economic analysis of various small cell and DAS financial models, Capex and Opex.
Reference [
1] defined TCO for DAS as the sum of Capex and Opex and a sensitivity analysis was done on the bandwidth, running cost and interest rate. Reference [
7] presented a techno-economic analysis for 5G architecture for DAS and MIMO. Reference [
8] used an ordinary annuity model to predict the future annual repeating payment of the principal amount invested in Capex, Opex and TCO. Reference [
9] stated that the principal cost for operations includes the running cost and backhaul cost, whereas the principal invested capital amount is made up of the eNodeB and the EPC, as well as the transmit and receive antenna.
Reference stated that [
10] infrastructure sharing will enhance the deployment of 5G technologies and will help MNOs meet the dense coverage, high capacity and reduced latency requirements. Passive infrastructure sharing will spread the infrastructure expenditure of 5G implementation among multiple players, which will reduce cost and increase profitability.
Reference [
11] argued that telecommunication infrastructure sharing will allow independent tower companies to manage the infrastructure, while the MNO focus on providing the best telecom service with no Capex and very limited Opex. A study by [
12], shows that 5G infrastructure cost in Britain is very high and the economical way to reduce the cost of infrastructure is by infrastructure sharing and network virtualization [
13]. This paper will develop a mathematical model that will be used to demonstrate how infrastructure sharing can be used to reduce the total cost of ownership of 5G network implementation.
In reference [
14] illustrate that the reconstruction of a new architecture will improve level of performance, enhance energy efficiency, and decreases Capex, Opex and TC. The author of the paper [
15] stated that the key enabling technologies of 5G technology are multi-edge computer (MEC), SDN, massive MIMO, ultra-dense network (UDN), NFV and D2D communication. In reference [
14], reviewed several network architectures this includes partial C-RAN which has L1 functions in the RRH and both L2 and L3 are in BBU and full C-RAN is when we have LI, L2, L3 functionally are placed in the BBU. A study by [
14] revealed that in a full C-RAN, resources are in a pool and are dynamically shared to reduce transmission congestion, reduced latency, improve performance, improve throughput, then reduce power consumption and increase network flexibility [
16]. Another author also proposed a new RAN architecture named the heterogamous CRAN or H-CRAN, which has both the user plan and control plan in decoupled.
Although much has been written on the techno-economic model and sensitivity analysis of some essential variables in literature, researchers have not considered the assessment of 5G DWNA and the techno-economic model for distributed network architecture in 5G. References [
2,
6,
8,
10,
17] present technoeconomic models and sensitivity analysis for DAS, MIMO, macrocells and small cells, but the models presented do not take into account the effects of inflation, the interest rate, and some key variables on investments in 5G, coupled with DWNA. From the aforementioned literature, no study has concurrently assessed the effect of interest rate and inflation on the proposed economic model for 5G DWNA. The key contributions of this study are highlighted below:
Proposed 5G long-term evolution (LTE) DWNAs designed with modified picocell (MPICOC), modified DAS (MDAS; small cell) and femtocell.
A mathematical model for Capex, Opex and TCO will be presented for 5G distributed MPICOC, MDAS (small cell) and femtocell and the model for DWNAs.
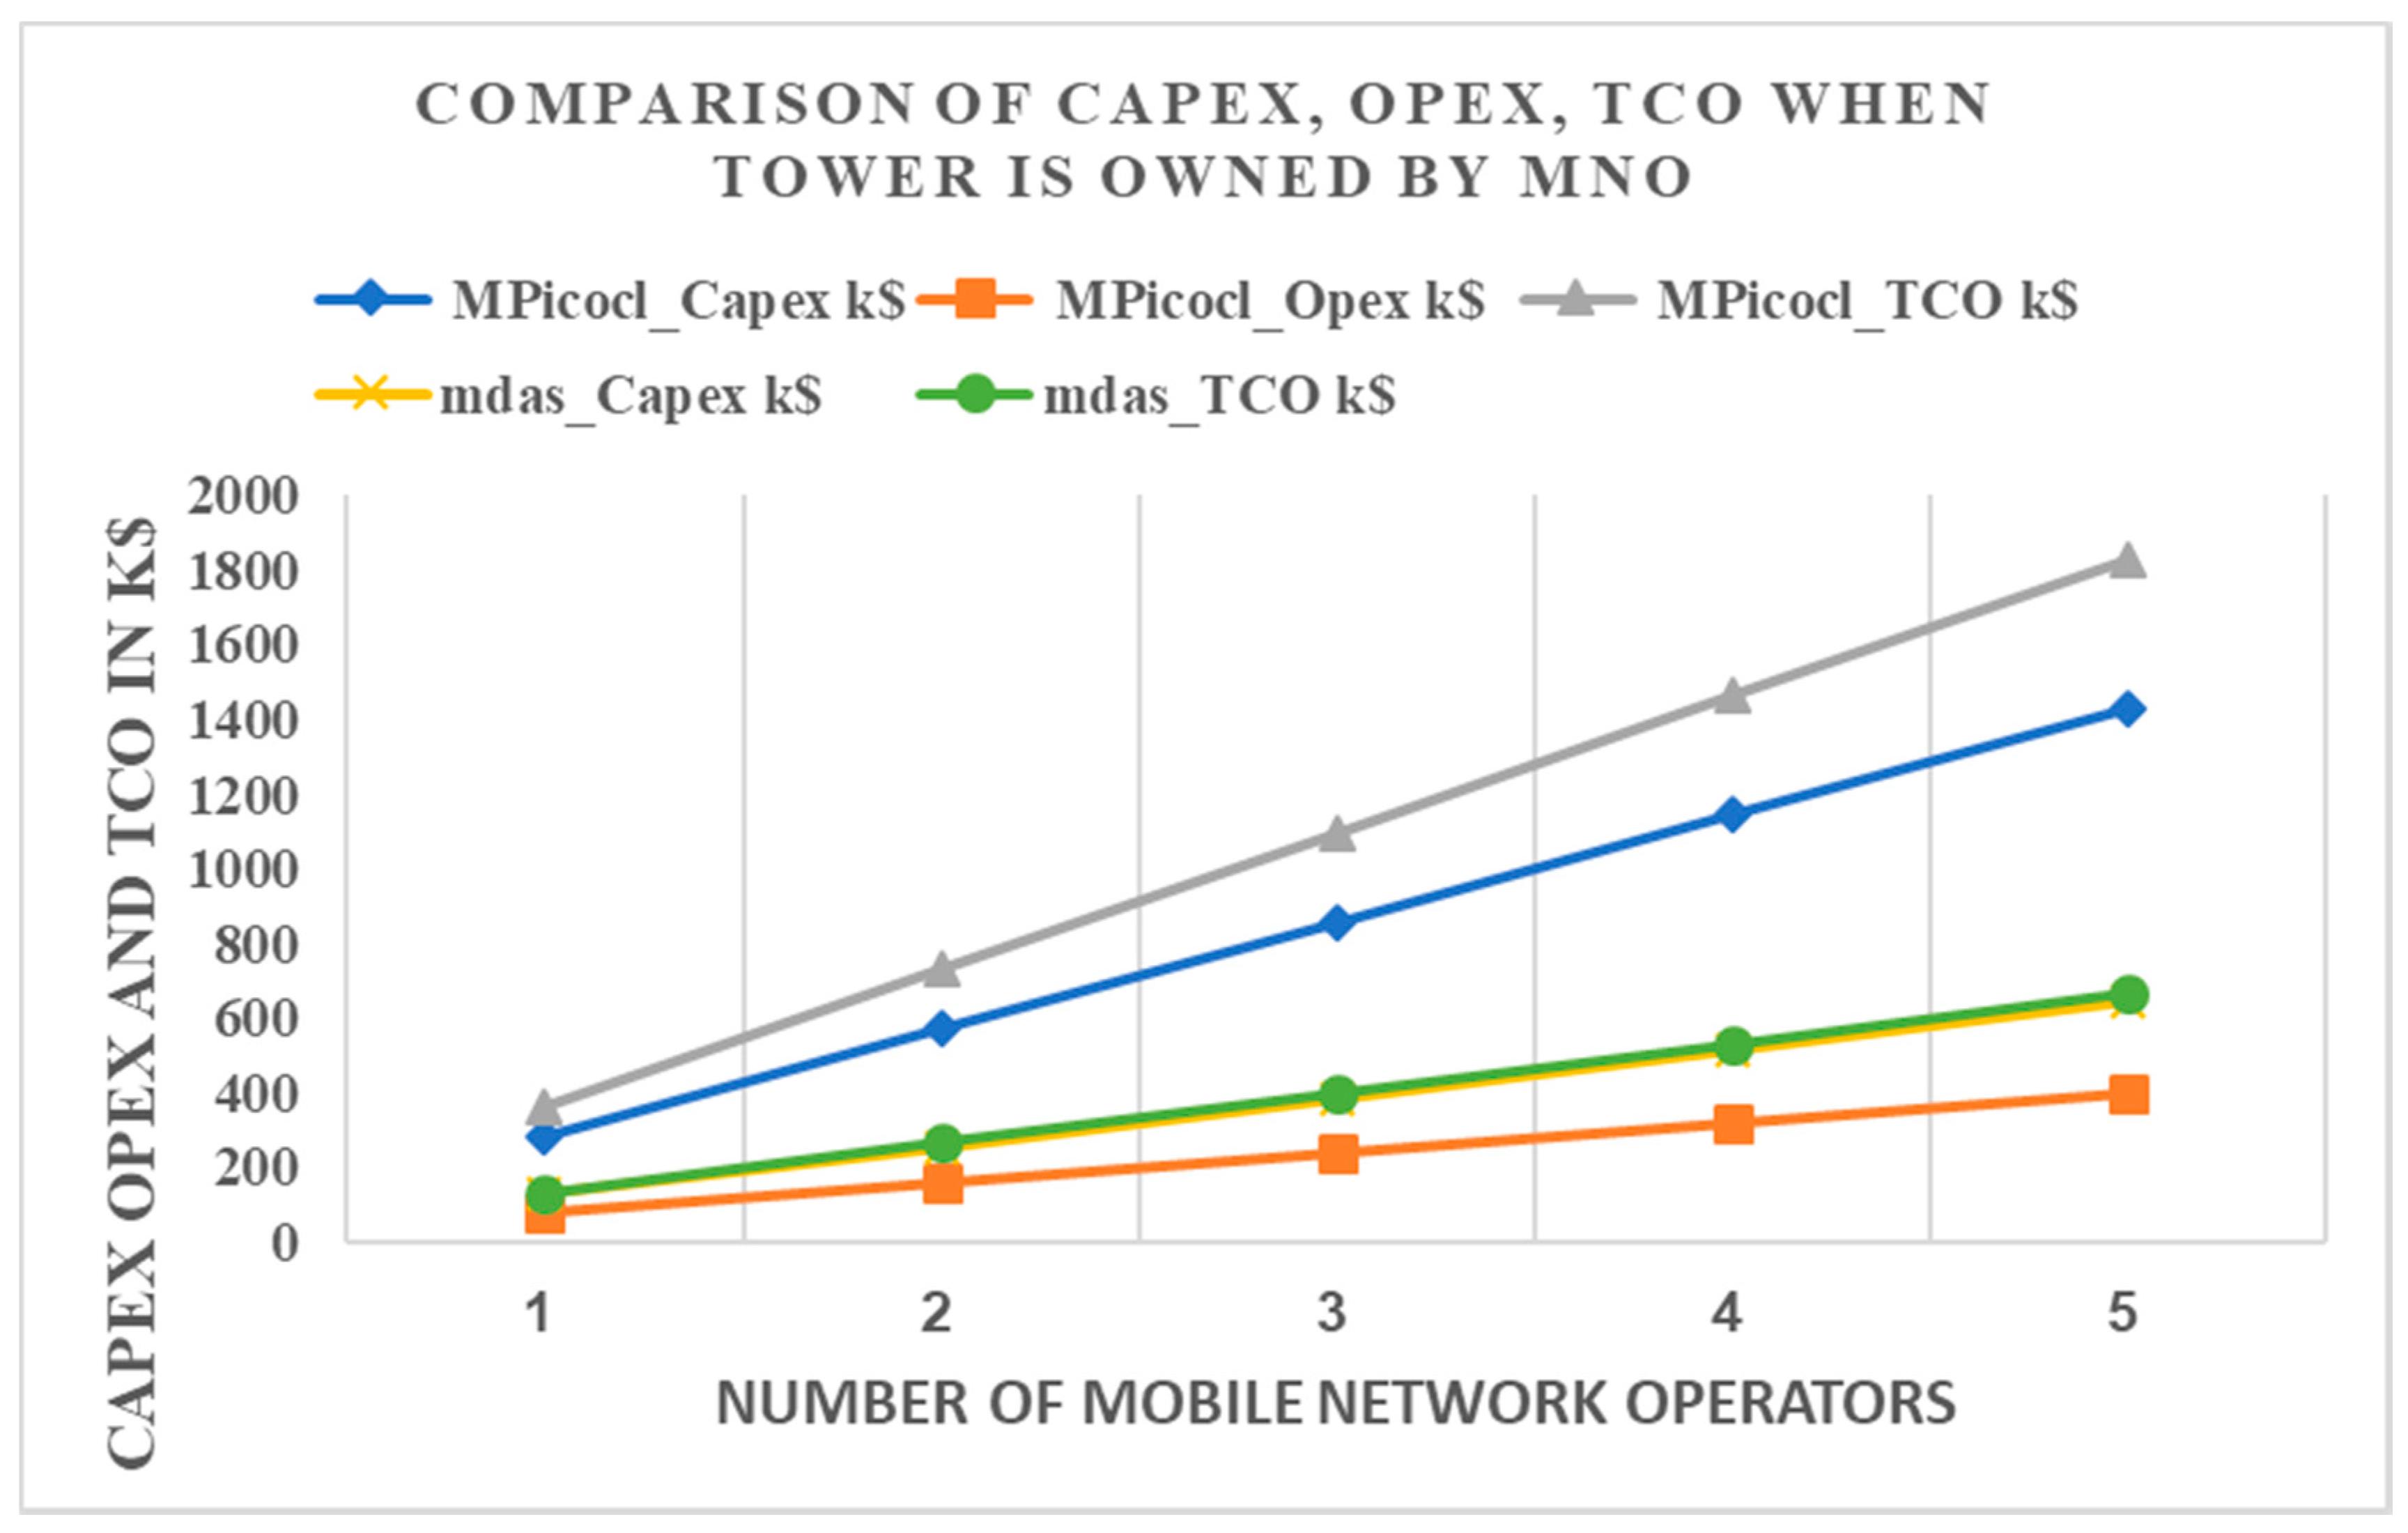
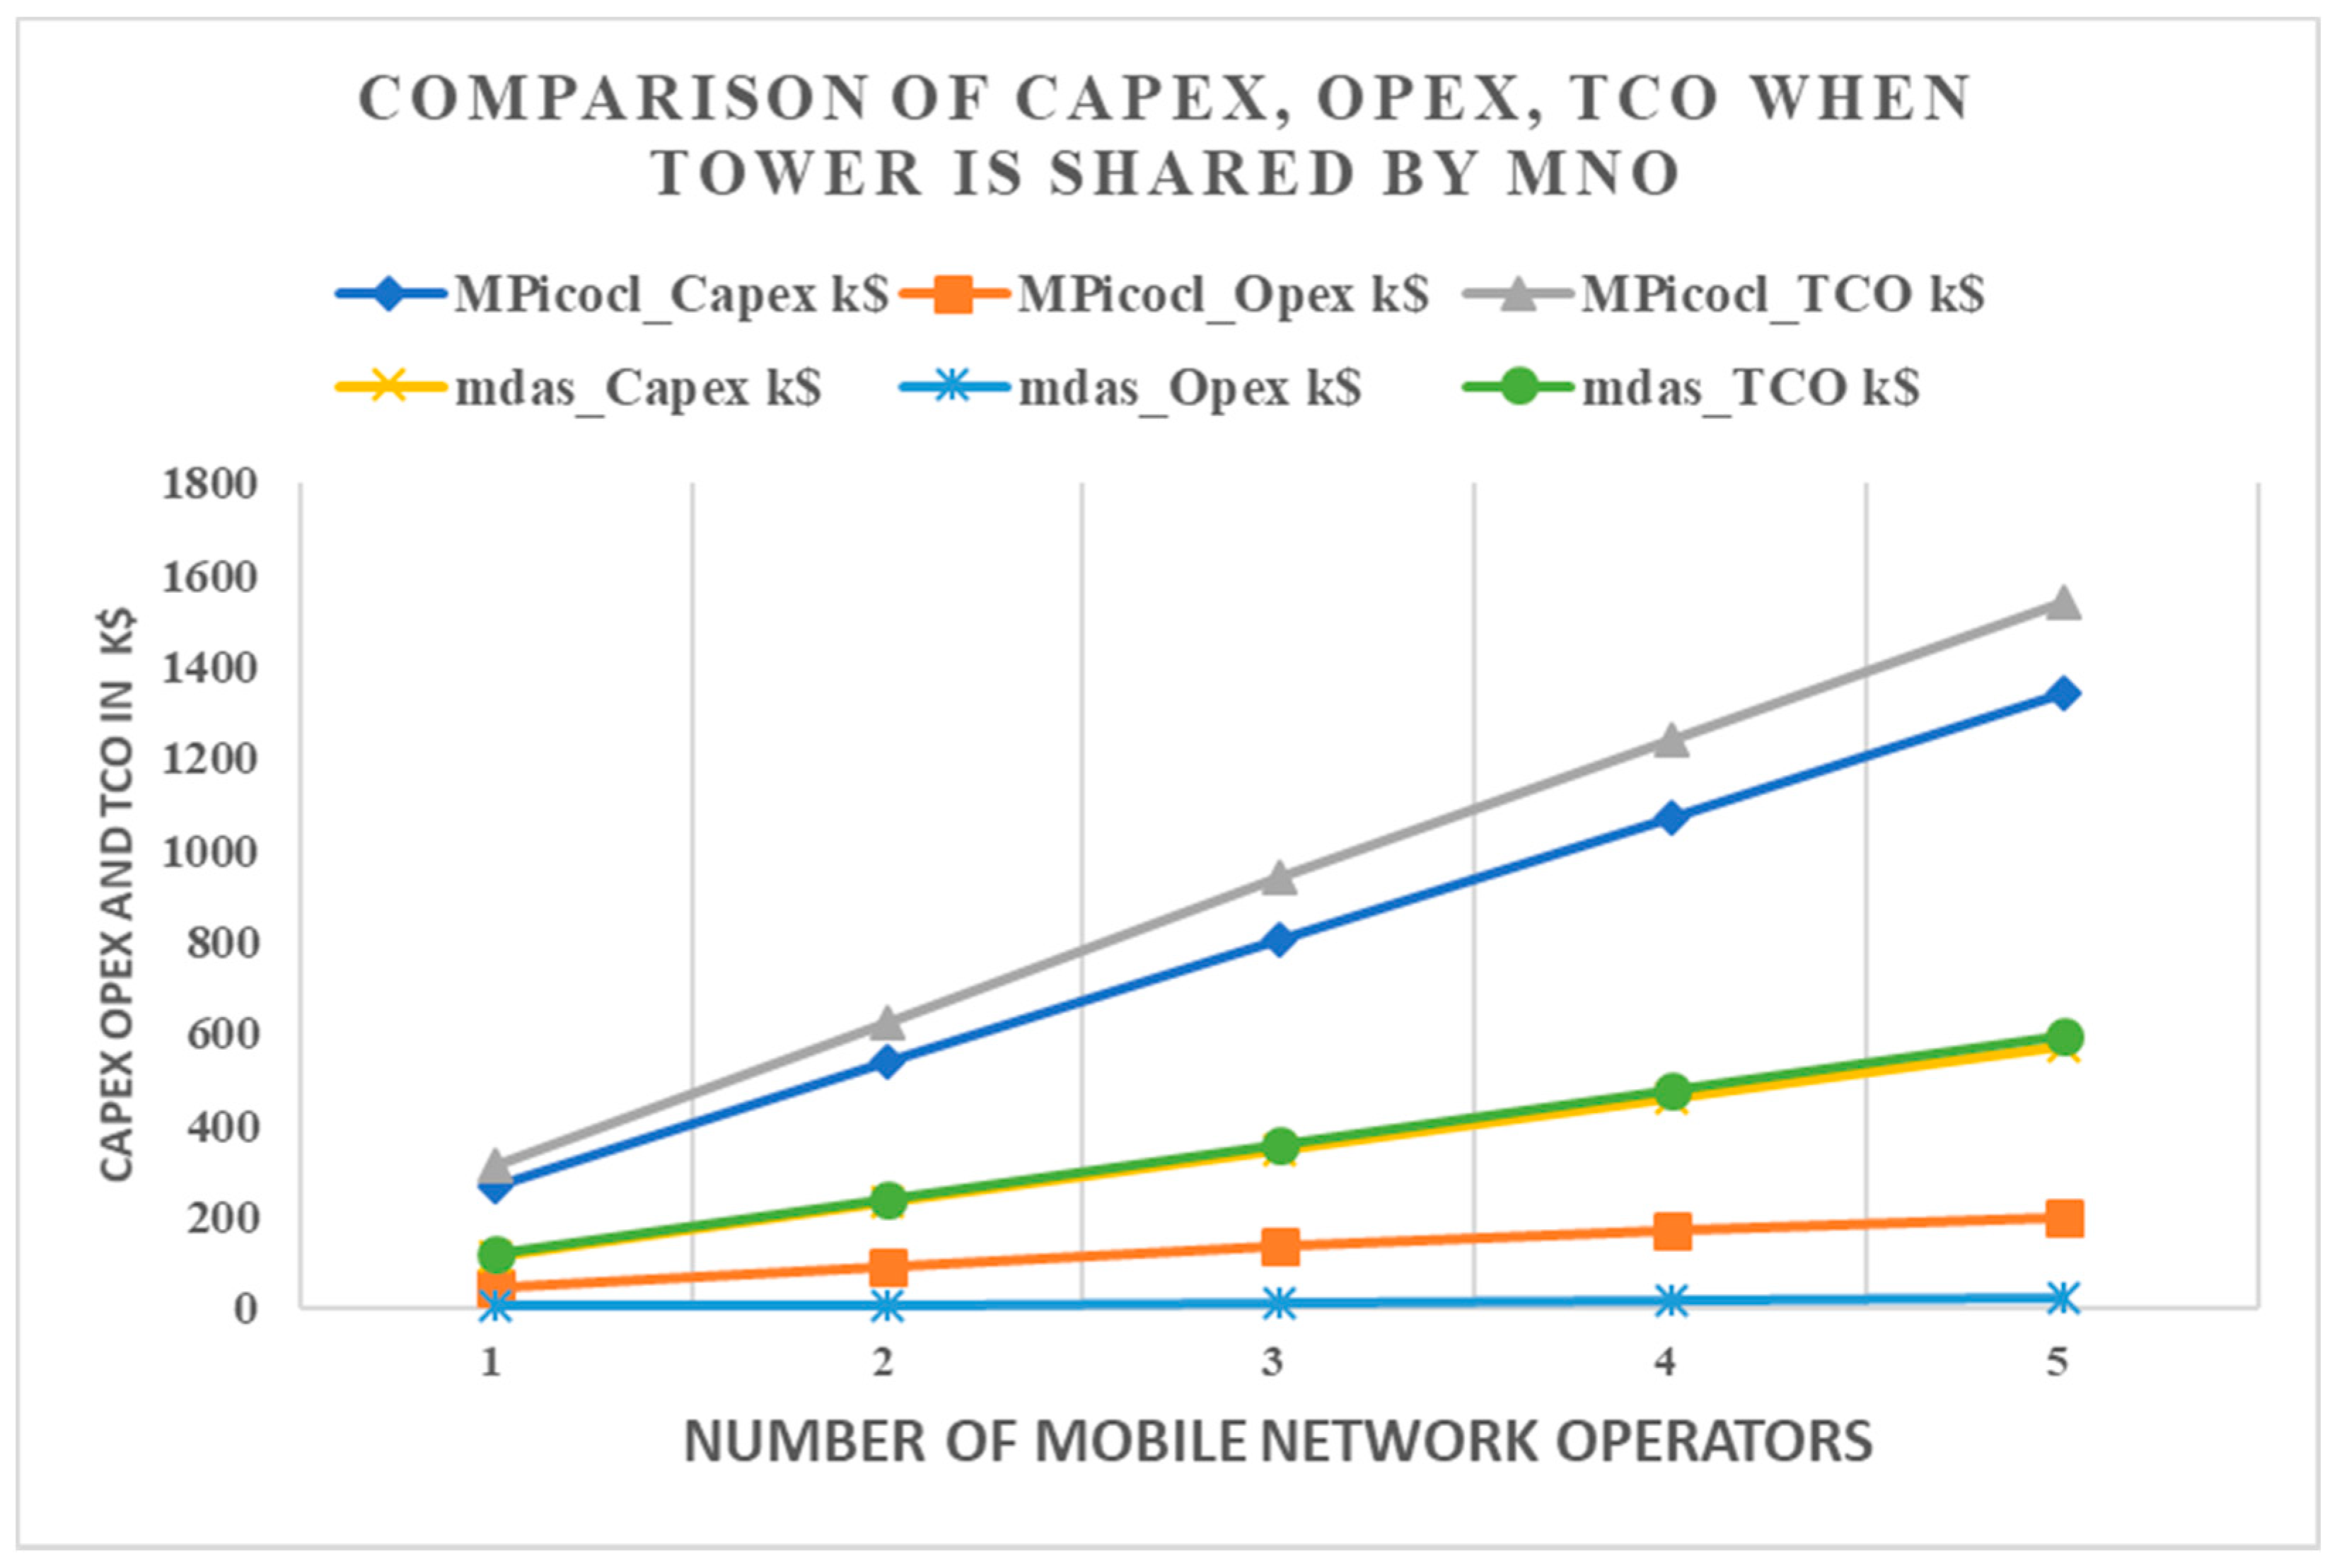
This study will investigate the Capex, Opex and TCO for the MPicocell and MDAS when the MNO owns the tower infrastructure and when the tower infrastructure belongs to tower companies.
A mathematical model of network capacity and throughput for a distributed wireless network using the Shannon capacity theory will be presented.
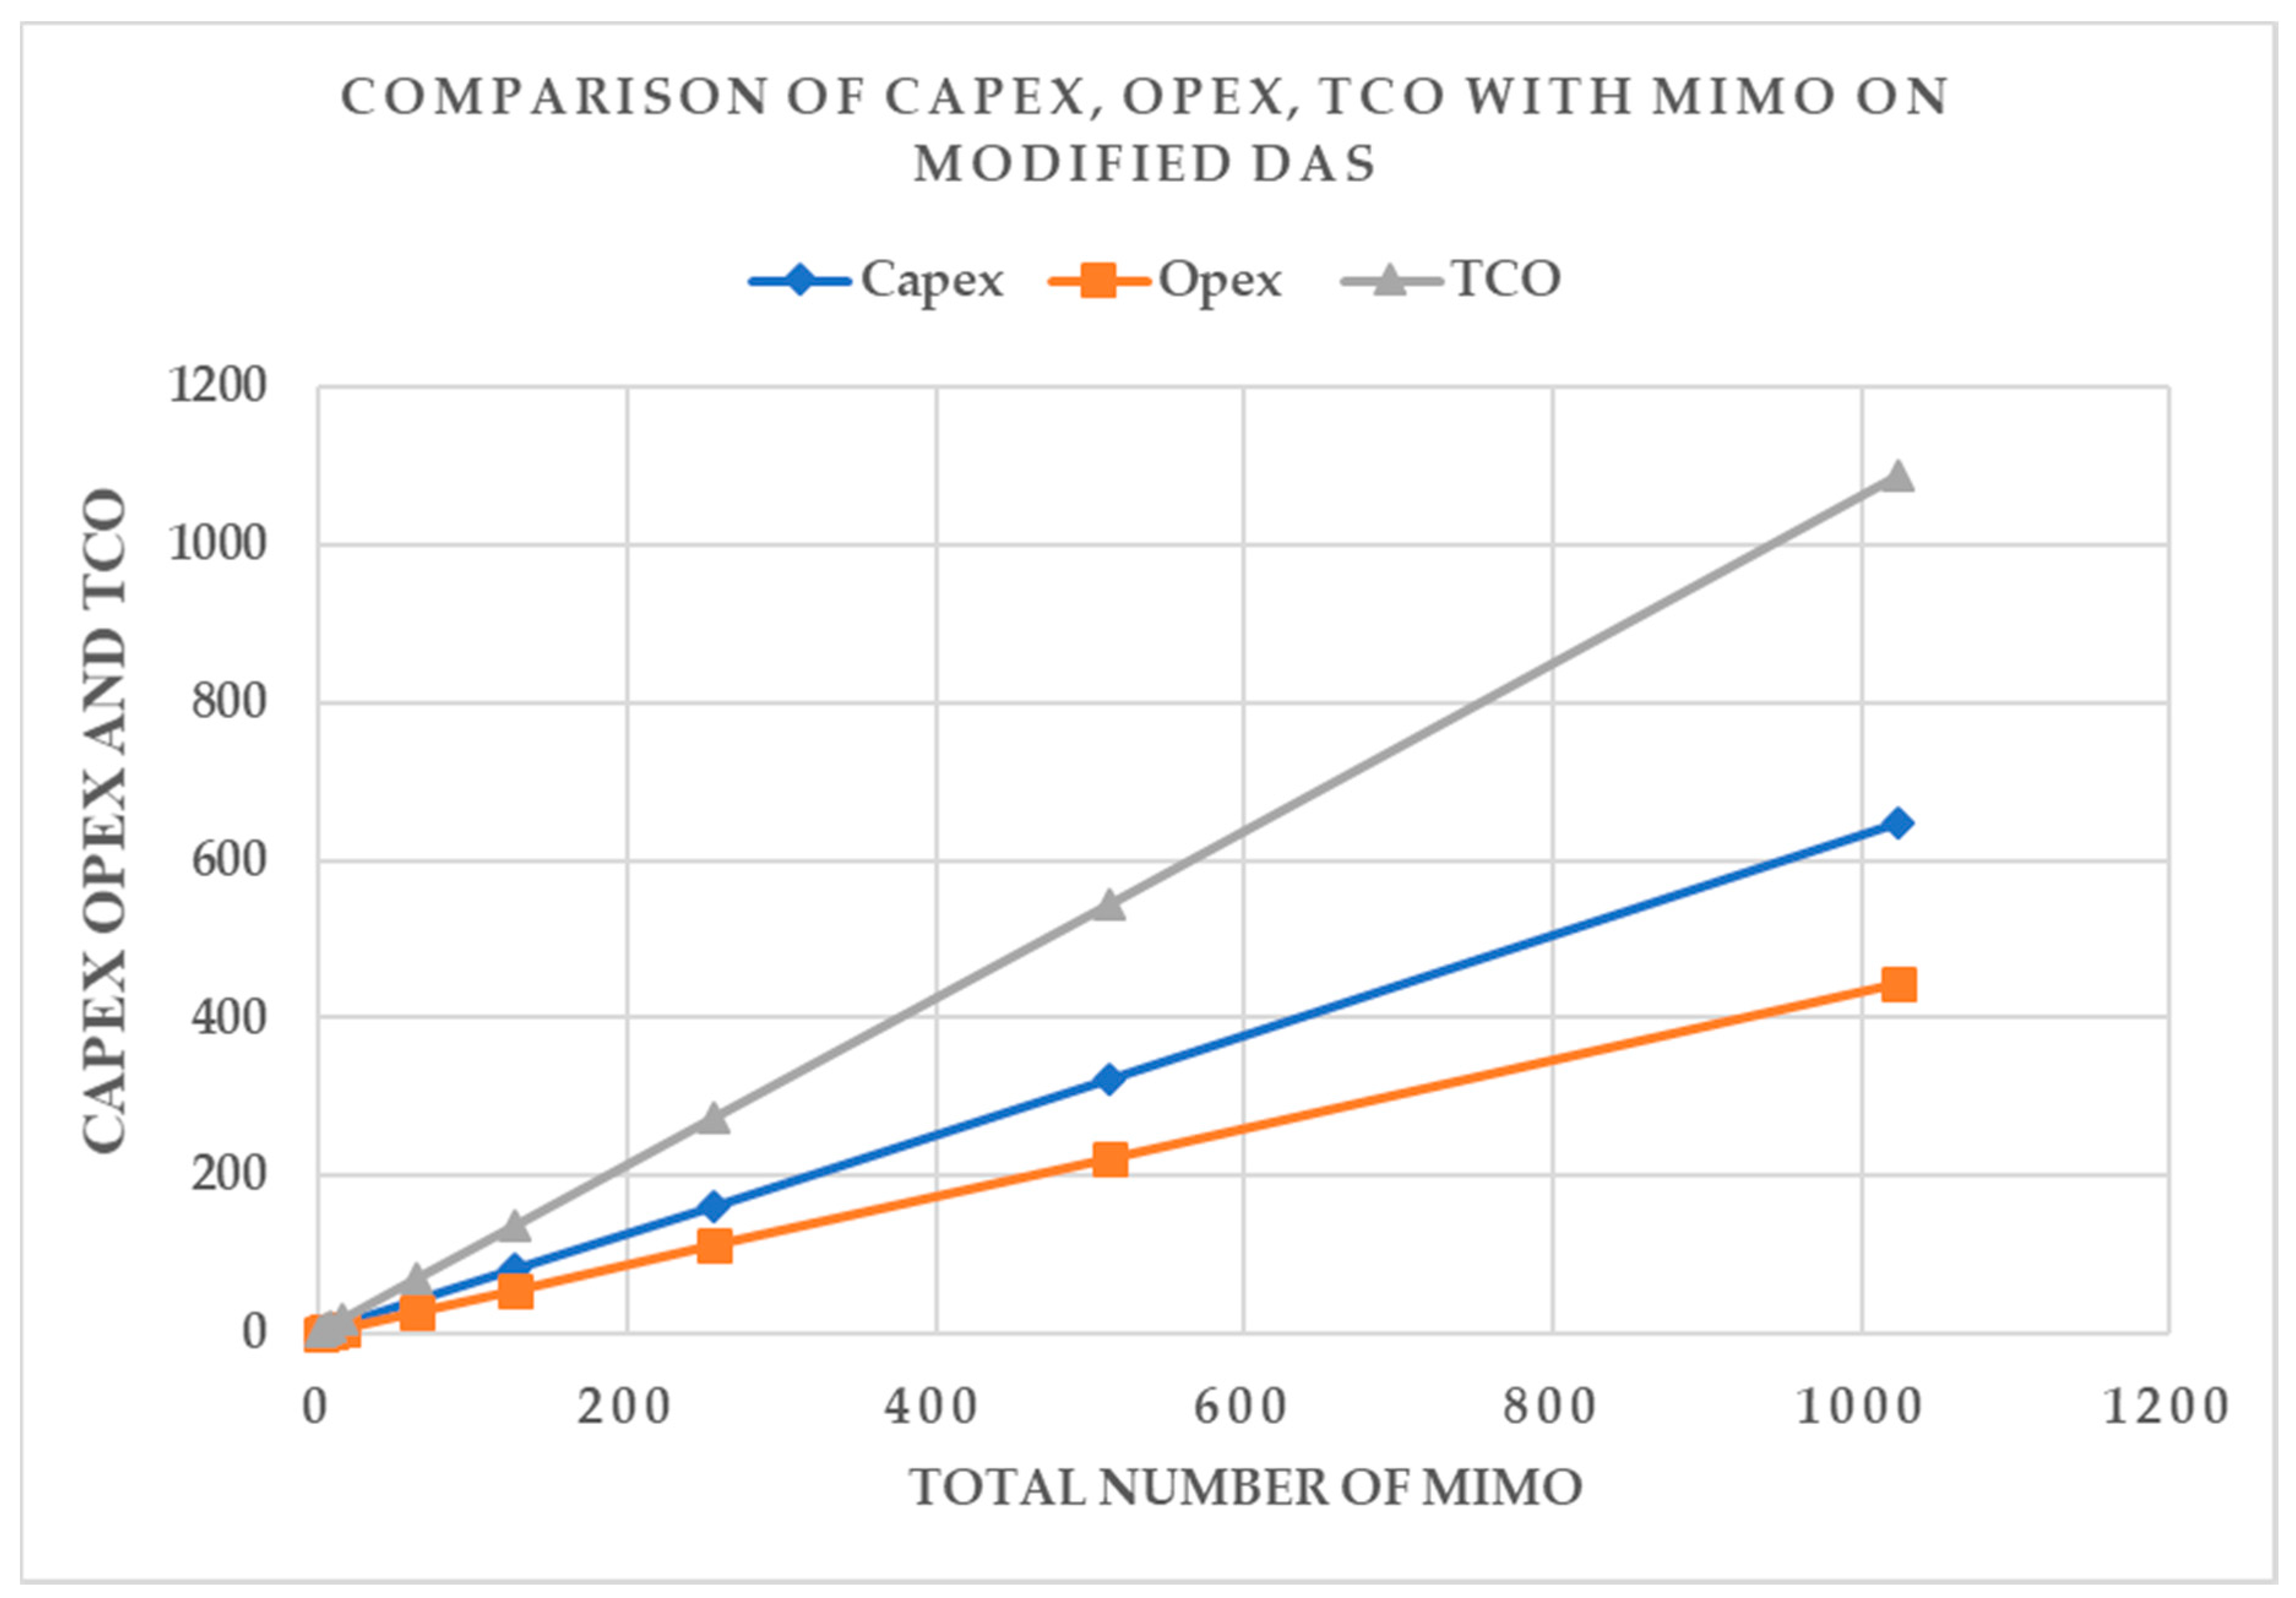
A sensitivity analysis (SA) will be performed to evaluate the Capex, Opex and TCO with MIMO on MPICOC and MDAS. This will be repeated for TCO with MIMO on MPICOC and MDAS
4. Fifth-Generation (5G) Long-Term Evolution (LTE)—Distributed Wireless Network Architectures
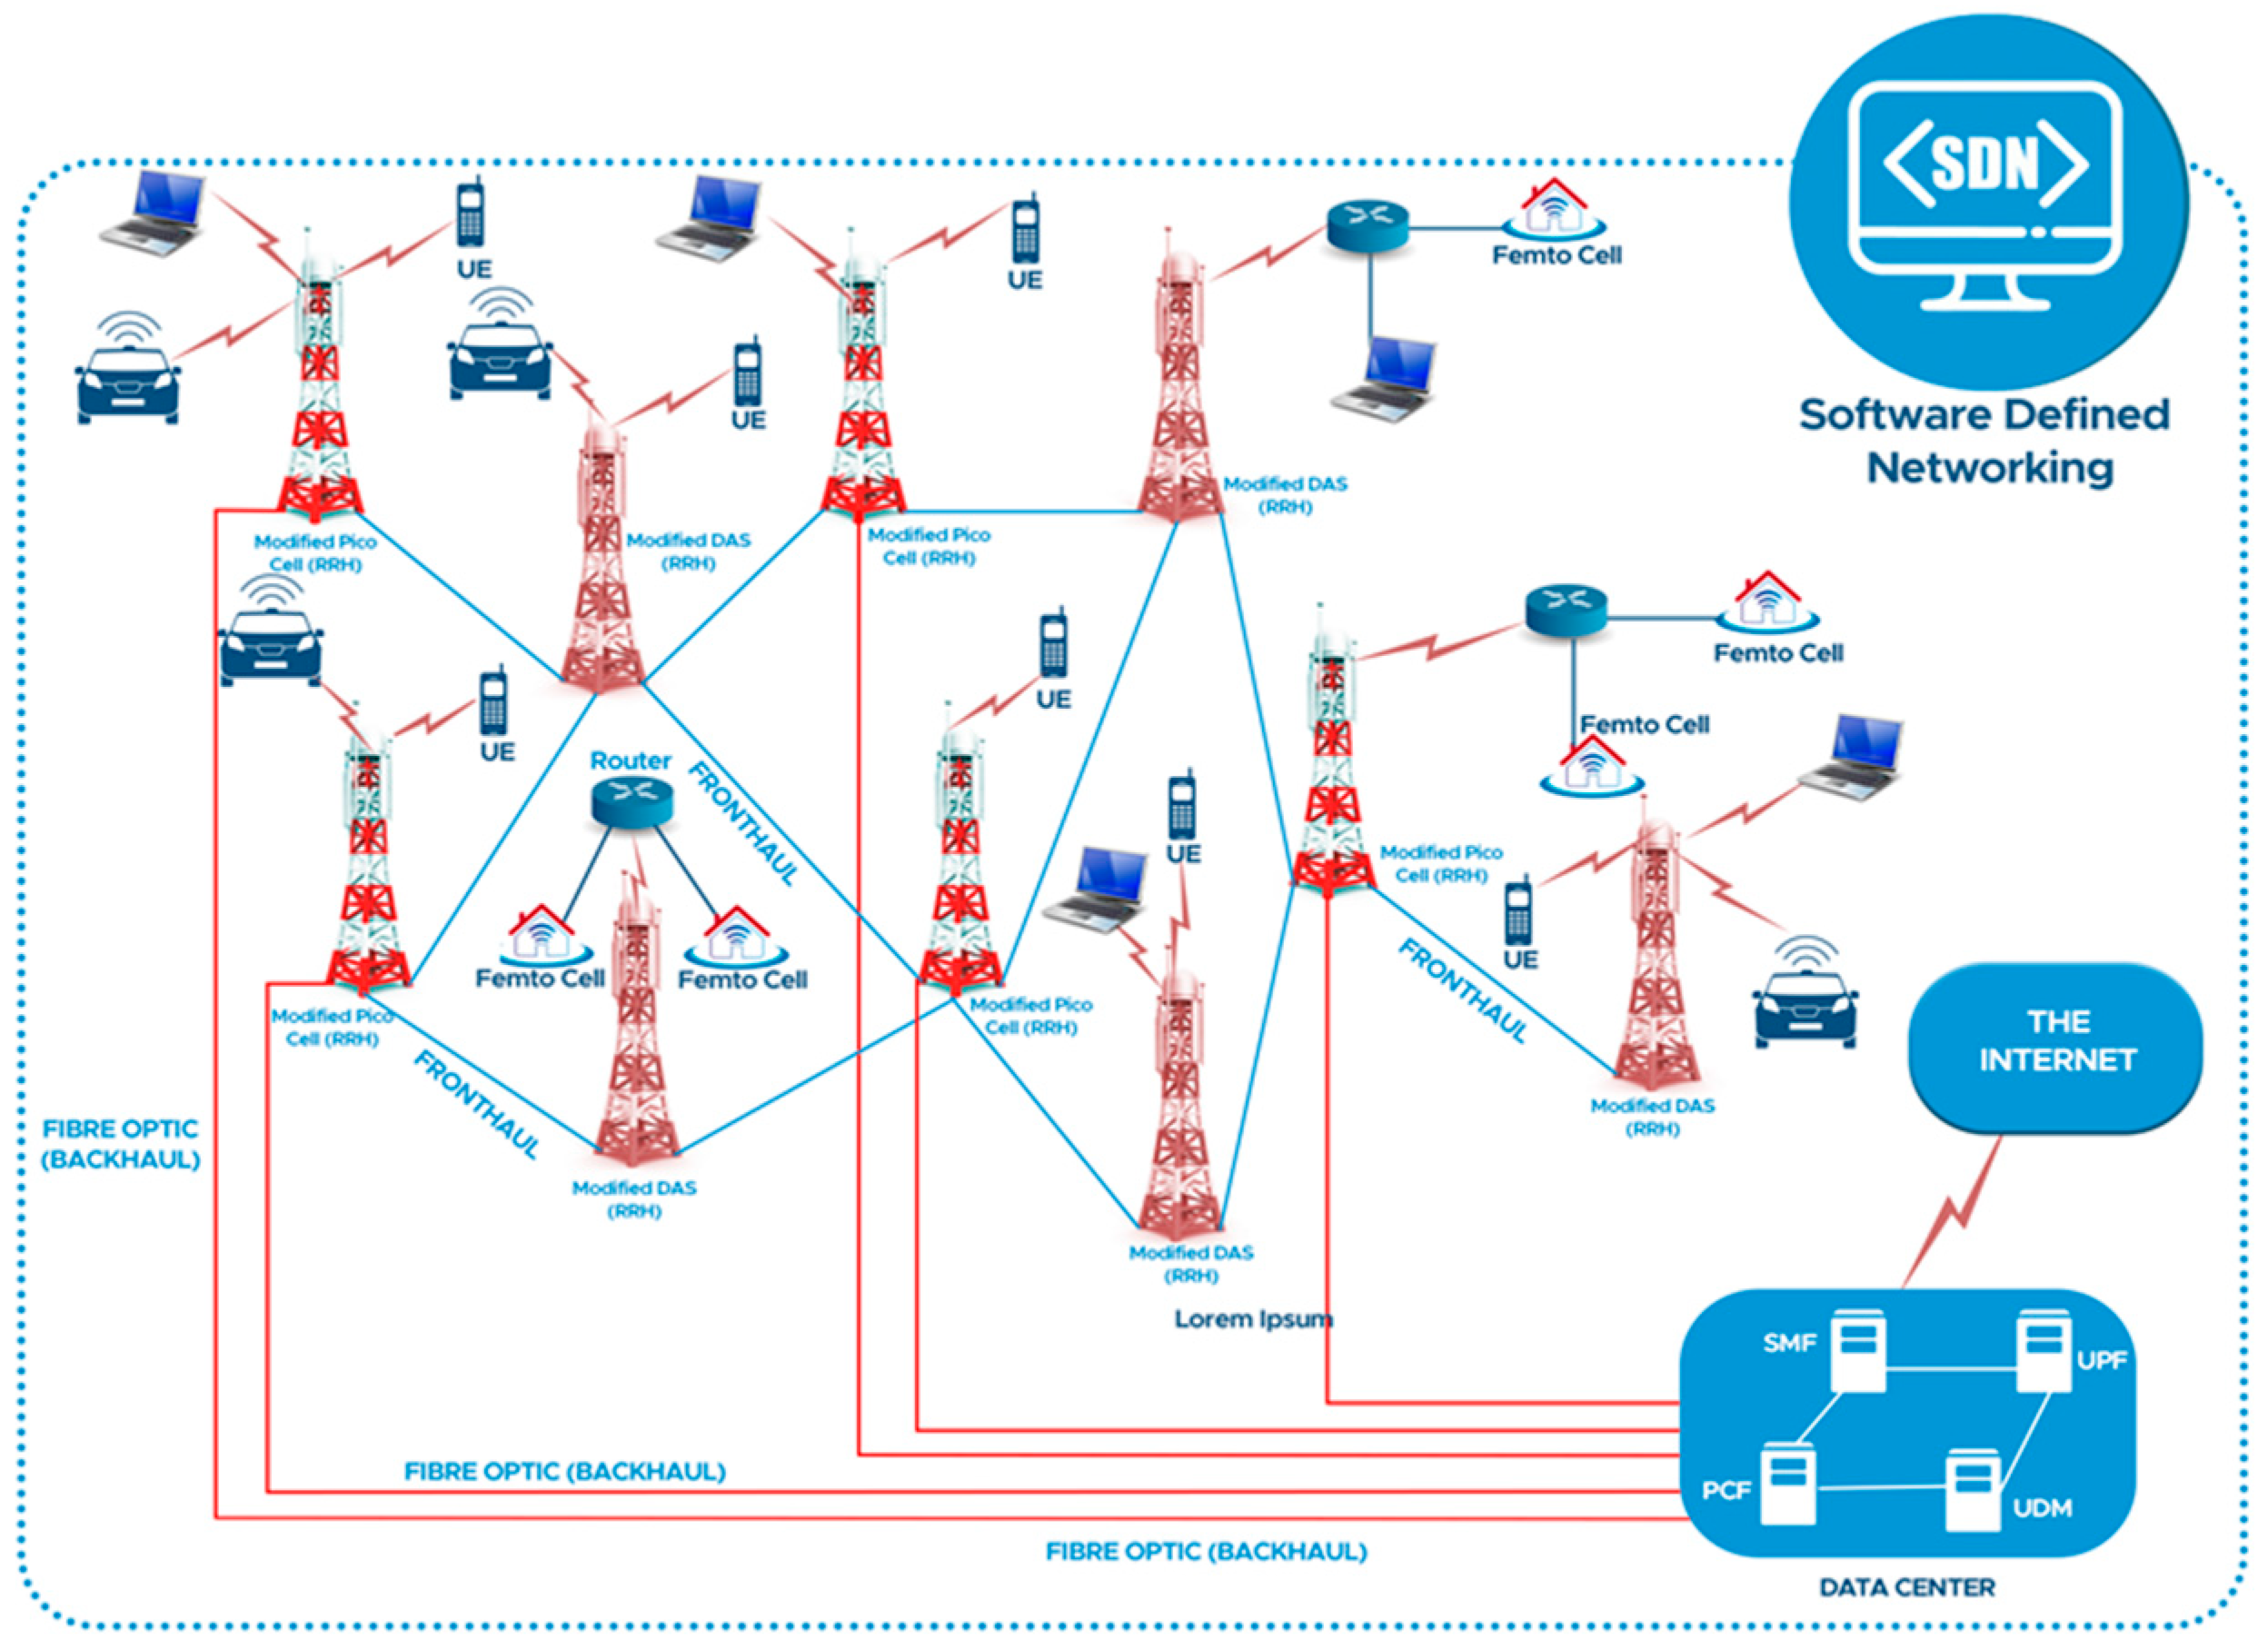
Figure 1 below shows a proposed DWNA for a 5G LTE, using architecture comprising MPICOC for improving the RRH, MIMO and BBU to meet the 5G technology requirement at a reduced TCO. The MPICOC encompasses centralized BBU, RRH and MIMO connected to a localised data centre called a MEC in the cloud through fiber optics whiles the MPICOCs are distributed connected hence the proposed architecture, the existing picocell is modified to support different applications, to support key enabling technology of 5G technology are MEC, SDN, massive MIMO, ultra-dense network (UDN), NFV and D2D communication. The BBU is centralized with L1, L2, L3 functionally, both the MEC and BBU run on a SDN. The implementation SDN will help in improving bandwidth, reliability, availability, monitoring, and end-to-end management capabilities. SDN will separate all the control interface from the individual device, and then create a dynamic, manageable, cost-effective, and adaptable architecture that gives administrators unprecedented automation, and control resulting in reduction in latency. SDN implementation will improve resources utilization, fault finding, and makes resolution very easy. Again, the use of SDN will optimize the performance of a mobile backhaul network by dynamically finding the best backhaul route assigning required wavelength, and the location of the local base band unit.
The MDAS is modified to offload traffic to the MPICOC through a fronthaul network. The MPICOCs are centralized connected to over 50 to 100 MDAS in a cluster. The MDAS is made up of RRH with MIMO technology, improved bandwidth, support IP, improved process speed by moving L1 and L2 overheads to the BBU and to support the new frequency band of 5G technology. The RRH are linked to the BBU through a fronthaul network. The proposed MPICOC and MDAS architecture will drastically reduce latency, since there is no handing over between the MDAS and MPICOC; moreover, dense coverage and high capacity are achieved owing to the number of MDASs and the distance between MDASs. The architecture will use the femtocell as an indoor device and traffic will be offloaded through mmWave, which is the same for a broadband device. The proposed architecture is also integrated with SDN located at a central point and controlling all the operations and maintenance on the MDAS, MPICOC, the fronthaul network and the IP network. The backhaul network is an IP network connecting all the MPICOC to the multi-edge computer in the cloud. Edge computing architecture is C-RAN technology designed to reduce latency. This is achieved by locating the key processing task closer to the user to allow all the data gathered to be processed very close to the end user instead of transmitting it to a centralized server. The edge computing techniques proposed are implemented on IoT and D2D technology to reduce latency. The NR or the gNodeB are special BSs designed to run several services, which include IoT, D2D and M2M communication, all through the mmWave spectrum. The MDAS will reduce energy consumption by 75%, since no cooling is needed, nor BBU, and maintenance occurs bi-annually, making this architecture most economical. The architecture makes it quite easy to extend coverage and increase capacity at a very reduced cost.
5. Techno-Economic Model Formulation
In this section, we built on [
6] to improve the economic model for an annual repeating payment for the telecom infrastructure and the TCO or cost of investment.
Equation (1) is a repeating payment model where
is the recurring payment,
denotes the present value of the cost of individual,
symbolizes the interest rate and
denotes the years of repayment. The parameter
in all the equations above designates the annual repayment plan. Again, Equations (2) and (3) [
17] are the same as 1,
,
and
. Equation (4) [
7,
8] is the TCO for a macrocell with parameters including
is the number of eNodeB,
is the capital cost for a single BS,
the core network’s capital cost for the deployment of a single eNB,
is the backhaul bandwidth (BW)—expressed in €/Gbps—
is site costs apart from maintenance cost, backhaul BW for a site’s interconnection and
site maintenance costs. Equations (4) and (5) [
1] are the same but Equation (6) is for a small cell. Equations (1)–(3) [
18] all have a limitation; imbursement is always made at the end of the investment and this can affect the agreed payment plan or attract a penalty if the MNO defaults on payment. Fluctuation in the interest rate and inflation affect the amount to be paid. The calculation does not take into account the time value for money (TVM), making the model unattractive to investors. Equations (4)–(6) are the TCO for a macrocell and small cell but do not take into consideration whether infrastructure is owned by the MNO or a tower owner. The TCO also does not consider the tower type, which is a principal cost element in tower building, or whether the tower infrastructure is owned by the MNO or rented.
5.1. Techno-Economic Conventional Model Formulation
The aim of the study is to develop a risk-free economic model that will mitigate all the limitations of the models used in [
5,
7]. The model will do away with the effects of TVM, interest rate and inflation control, which are major drawbacks of the models in 1, 2 and 3. The model TCO or total cost of investment (TCI) value will be
times that of the previous model. This makes the developed model more robust and good for MNO, resulting in a good net present value (NPV). The initial capital investment for a 5G network architecture will be proposed. The initial operational investment for a centralized 5G network architecture will be proposed.
Equation (7) is the interest-free, TVM and inflation control model.
5.2. Capex for Telecom 5G Technology Deployment of Modified Picocell (Radio Remote Head, RRH) (gNodeB)
Capex is the sum of money advanced for the implementation of new telecom infrastructure or the purchase of new equipment. Examples are DAS, eNodeB, picocell and EPC. It also comprises the investments made on updating the infrastructure with new hardware, installation, building, back-hauling etc. The costs of installation for the BS nodes alongside the core network, therefore, appertain to this cost category.
Suppose
is the initial Capex,
is the interest for the cost of capital and
is the repayment amount then, based on Equation (7),
The main advantage of this model over what is being used is that the TCO value will be times that of the previous model, making this kind of investment more profitable. The risk level is very low and any increase in the interest rate will have no effect on the return value of the investment.
Assuming that the MNO owns the (mast) telecom tower,
By substituting Equation (10) into (8),
5.3. Opex for Telecom 5G Technology for Modified Picocell (RRH) (gNodeB)
Opex is the amount of money invested in the cost of the day-to-day operation of the system, depending of the type of operations, cost of rent, vehicle maintenance cost, salaries and wages. is the cost of the eNodeB, the cost of the evolved packet, cost of backhauling or transmission networks, the cost of installation, and are the number of antennas at the source and destination. If is the operation expenditure for the MNO.
, where is the site management cost and is the site material cost.
By substituting Equation (12) in to (13),
If the tower is owned by the
and
, the Opex of the telecom (mast) tower will be added to the equation:
5.4. Total Cost of Investments for Modified Picocell (RRH) (gNodeB)
TCO or TCI is a single value that represents the lifespan of a capital purchase. It is a financial estimate that helps in determining the direct and indirect costs of a product or services. It is the sum of the operational cost and the capital cost. It helps in making critical agreement vs. buy comparisons. It concerns vendor selection, prioritization of capital acquisition, and overall corporate budgeting.
factorization of Equation (17):
If the MNO is renting the tower, then
,
and equal to zero (0) and
will be added to the Opex of the MNO. Therefore, Equation (18) will become:
5.5. Capex for Telecom 5G Technology Deployment with Modified Distributed Antenna System (MDAS) (RHH)
Capex includes the cost of purchasing new infrastructure and integrating new items when existing equipment is updated. In MDAS (RHH) BS costs are given by the following equation:
. If there are
BSs, then
is the cost for all the BS. The total capital cost for a year will then be given by
5.6. Opex for Telecom 5G Technology for MDAS (RRH)
The Opex for a picocell (small cell) will be the cost of operation and maintenance of the network and site rental, if
and
is the site rental cost then for
BS, the sum of the Opex variable will be
.
The TCO or cost of investment for the MDAS(RRH) is the sum of the total Capex and the total Opex.
5.7. Distributed Indoor Solution with Femtocell
LTE femtocell technology is used in the indoor environment. The introduction of femtocell brings about a reduction in the deployment of macrocell sites and reduces the millions of dollars operators spend on building macrocell sites. Femtocells provide exceptional improved coverage and capacity, resulting in revenue generation from services such as internet service, video and data service. When femtocell technology is used, the electricity bill is no longer the responsibility of the operators. The ability of a femtocell to do automatic configuration, self-organization, synchronization and timing eliminates the cost of operation and maintenance. Compared to macrocell, microcell and picocell, the deployment of femtocell will reduce capital and operating expenditure, thus reducing the TCI or TCO to the MNO, as shown in Equation (24).
5.8. Total Cost of Investment or Cost of Ownership for Distributed Wireless Network
The total cost of investment for the DWNA designed with picocell and DAS is defined as the sum of all the TCI for the number of BSs deployed.
6. Network Capacity and Throughput for Distributed Wireless Network
Capacity planning in a telecommunications network is studied through the novel application of inventory control techniques aimed at meeting the demand for a certain service level. In transmission, we define capacity as the maximum transmission rate of the link, whether microwave, radio or fiber. Capacity significantly affects the communication quality of 3G and 4G in terms of maximum achievable throughput and end-user’s satisfaction and 5G LTE technology is to address this challenge. Capacity evaluation is, therefore, of great importance for both 5G network planning and management. According to Shannon’s capacity theory, the total system capacity in a 5G wireless cellular network is the sum of the capacity of all sub-channels deployed in heterogeneous networks. In 5G technology, the total network capacity can be increased by increasing the network coverage through heterogamous network implementation of picocells, small cells (DAS), mobile femtocells and D2D clustering and by increasing the number of sub-channels, cognitive radio networks, massive MIMO, mmWaves and visible light communications. Cloud or centralized regional area networks dynamically allocate on demand using the coordination of multiple antenna ports or cells and joint processing of radio signals and centralizes various radio resources to manage.
In this section we drive the capacity model for a DWNA by applying Shannon capacity theory realized in [
19] and the model for the throughput per user will be presented.
If the transmission bandwidth is given by
B, and the signal-to-noise interference ratio [
20] is given as
, then applying Shannon capacity [
21] on macrocell, picocell, small cell and femtocell results in:
7. Model Verification
The 5G technology will require numerous NR to be deployed to achieve dense coverage, high capacity, high throughput and ultra-reliable low latency communication. 5G will require shorter inter-site distances (ISD), meaning MNO will deploy many more sites than in 4G. Both old 4G and 3G of 1 GHz to 2.6 GHz will be required for high coverage, as well as a new high-band spectrum between 3.5 GHz and 40 GHz for high capacity. The deployment will require the installation of RRH (4T4R, 8T8R, 16T16R, 16T16R, 32T32R), with massive MIMO antenna and fronthaul (fiber optics) on the tower (see the centralized architecture in
Figure 1). Based on the needs of 5G technology, the cheaper and easier way of deploying this in Ghana and the rest of Africa would be the implementation of centralized architecture in collaboration with network sharing to enable MNO to meet the ISD of 5G technology. This section will report on the testing of the model using the Mobile telecommunication networks (MTN) network in the Tema metropolitan area.
Table 1 is the TCO cost parameter and independent variables which will be used for the model verification. Tema has an area of 565 km
2 [
22] and a population of about 292,700 living in 40,956 houses. We will verify the economic performance of the models for MPICOC (small cell), MDAS (RRH) and femtocell [
18]. An SA is performed on MPICOC (small cell), MDAS (RRH) and femtocell in a 50 km
2 area. Finally, a sensitivity analysis [
23] is used to assess the influence of a key variable on the Capex, Opex and TCO of the MPICOC (small cell), MDAS (RRH, and femtocell.


