Abstract
Research shows that individuals with heart failure are 60% more likely to develop dementia because of their shared metabolic risk factors. Developing a classification model to differentiate between these two conditions effectively is crucial for improving diagnostic accuracy, guiding clinical decision-making, and supporting timely interventions in older adults. This study proposes a novel method for dementia classification, distinguishing it from its common comorbidity, heart failure, using blood testing and personal data. A dataset comprising 11,124 imbalanced electronic health records of older adults from hospitals in Chiang Rai, Thailand, was utilized. Conditional tabular generative adversarial networks (CTGANs) were employed to generate synthetic data while preserving key statistical relationships, diversity, and distributions of the original dataset. Two groups of ensemble models were analyzed: the boosting group—extreme gradient boosting, light gradient boosting machine—and the bagging group—random forest and extra trees. Performance metrics, including accuracy, precision, recall, F1-score, and area under the receiver-operating characteristic curve were evaluated. Compared with the synthetic minority oversampling technique, CTGAN-based synthetic data generation significantly enhanced the performance of ensemble learning models in classifying dementia and heart failure.
1. Introduction
The world is currently grappling with the challenges of an aging population. In 2017, the number of individuals aged 60 or older reached 962 million—more than double the 392 million recorded in 1980. By 2050, this figure is projected to nearly double again, reaching 2.1 billion and surpassing the adolescent population aged 10–24, which is estimated at 2.0 billion [1]. Aging is a natural process associated with an increased likelihood of developing various diseases. The changes that occur with age can be categorized into normal aging, common diseases, functional changes, cognitive and psychiatric changes, and social changes [2]. Cognitive changes in aging encompass alterations in abilities such as memory, attention, and reasoning. Dementia, a condition within this domain, significantly impacts cognitive function. Research has established a clear and consistent correlation between the onset age of heart disease and the likelihood of developing dementia [3]. It is important to examine cognitive changes and common diseases. According to the literature, heart failure is a significant risk factor for dementia, with individuals with heart failure experiencing a 60% higher risk compared to those without [4]. Additionally, studies have reported that the overall prevalence of cognitive impairment and dementia among heart disease patients is 41.42% and 19.79%, respectively [5]. Given the well-established correlation between heart failure and dementia in terms of their shared risk factors [5], developing a classification model to effectively differentiate between these two conditions is crucial. This study aims to address that need by focusing on a single binary classification model to determine whether a patient has either dementia or heart failure. Given that both dementia and heart failure are frequently encountered in older adults, the proposed model facilitates diagnostic accuracy by integrating both conditions within a single framework, providing a practical approach to guide clinical decision-making, and supporting timely interventions.
Dementia is a disorder that directly affects the brain, impairing cognitive functions, particularly memory. It also significantly impacts language, attention, decision-making, and planning abilities [6]. In 2015, an estimated 47 million people globally were living with dementia, a figure projected to triple by 2050 [7]. Diagnosing dementia involves reviewing medical history, performing cognitive and physical assessments, and conducting laboratory tests and brain imaging. Management strategies include both non-pharmacological and pharmacological approaches, though current treatments remain limited in their effectiveness [8]. At present, there is no definitive cure for dementia [9]. However, some medications inhibit the enzyme responsible for breaking down acetylcholine, a neurotransmitter essential for cholinergic neurons in the central and peripheral nervous systems. These findings underscore the importance of therapies aimed at replacing lost neurons and preventing neuronal death, which have the potential to slow dementia progression and alleviate symptoms [10]. Additionally, managing risk factors such as high blood pressure and diabetes is critical in reducing the likelihood of strokes that may exacerbate dementia [6].
According to a report by the Heart Failure Society of America (HFSA), approximately 6.5 million individuals aged 20 and older in the United States suffer from heart failure, with around 960,000 new cases diagnosed each year. Moreover, 8.5% of deaths related to heart disease are directly attributable to heart failure [11]. Heart failure is often the final stage of various heart conditions, including cardiomyopathy, valvular disease, ischemic heart disease, and others [12]. If untreated, these conditions significantly increase the risk of recurrent hospitalization and mortality [13]. Heart failure is especially prevalent among elderly patients, with its occurrence influenced by aging-related factors such as structural, biochemical, clinical, and psychological changes [14]. The rapid advancement of technology has led to a substantial increase in the detail and volume of patient medical records, encompassing clinical data, diagnoses, and laboratory results.
Machine learning (ML) methods have leveraged this wealth of medical data to develop numerous valuable applications in healthcare, including dementia prediction and classification. Previous studies have primarily focused on using various data types, such as magnetic resonance imaging (MRI) scans and brain functional test scores, to classify dementia, often without accounting for the risk of concurrent diseases [15,16,17]. However, these data types are difficult and expensive to obtain, limiting their applicability for prediction or early diagnosis. In contrast, this study addresses this limitation by proposing a model which primarily used blood test results to facilitate accessibility for the general population and to develop a classification model of dementia by employing binary classification to distinguish between dementia and heart failure—two highly correlated conditions.
Ensemble learning-based models have gained prominence in disease prediction due to their ability to enhance accuracy, reduce overfitting, and handle complex patterns in medical data. These models are particularly effective in addressing class imbalances, are robust against noise, and provide reliable predictions. Ensemble learning methods improve performance by combining multiple models, leveraging model diversity to reduce bias and variance. However, when datasets are limited, ensemble models may learn similar patterns, diminishing diversity. To address this issue, this study utilized conditional tabular generative adversarial networks (CTGANs) to increase data diversity and address the underrepresented minority class—the dementia class. CTGAN is a type of generative adversarial network (GAN) that generates synthetic data while preserving the statistical properties and relationships of the original dataset, ensuring the synthetic data is realistic and of high quality. The hypothesis of this study was that CTGAN-derived synthetic data would enhance the performance of ensemble-based models in both boosting (extreme gradient boosting (XGBoost), light gradient boosting machine (LightGBM), and gradient boosting (GB) and bagging (random forest (RF) and extra trees (ET)) groups for the binary classification of dementia and heart failure. The ultimate goal of this classification model is to enable early detection of both conditions.
2. Literature Review
This section reviews current research on developing a classification model for dementia and heart failure.
2.1. Dementia and Heart Failure Association
Heart failure increases the risk of dementia due to reduced blood flow caused by the heart’s inefficiency. This impaired circulation can lead to cerebral ischemia, a condition that disrupts cerebral blood flow and damages the brain’s blood vessels. Over time, this process contributes to cognitive decline through the accumulation of tau protein and decreased levels of amyloid-β in the plasma [18]. Both tau protein and amyloid-β have been identified as significant biomarkers for predicting dementia risk [19]. The decline in cerebral blood flow associated with heart failure exacerbates cognitive impairment. Conversely, individuals who undergo heart transplantation often experience improved cerebral blood flow, which correlates with enhanced cognitive function [20,21].
Numerous studies have explored the complex relationship between heart failure and dementia, consistently finding that individuals with heart failure face a significantly higher risk of cognitive decline and dementia compared to those without heart-related conditions. For instance, a comprehensive study [22] reported a higher prevalence of dementia among individuals with heart failure. Similarly, Wolters et al. [4] identified heart failure as a major risk factor for dementia, showing a 60% increased risk of developing dementia in individuals diagnosed with heart failure. This aligns with earlier findings on the elevated occurrence of dementia in this population. These statistics underscore the substantial impact of heart failure on cognitive vulnerability, as impaired cerebral perfusion, vascular dysfunction, and shared metabolic risk factors collectively contribute to the development of dementia. This evidence highlights the critical need for early detection of both conditions, which is the primary objective of this study.
2.2. Predictive Model for Dementia Study
Research on predictive models for dementia is continually evolving, with many studies leveraging data from direct MRI scans [23,24,25,26,27,28]. MRI is a critical imaging technique for diagnosing intracranial neurological injuries and predicting cognitive and behavioral outcomes in patients [29,30]. For instance, a study by Ryu et al. [9] developed a model that incorporated MRI data alongside clinical information from dementia patients. This integrated approach enabled the creation of a more comprehensive model, combining imaging data with clinically relevant insights to potentially enhance the accuracy and depth of dementia-related predictions. Despite its advantages, integrating MRI data into research poses significant challenges due to its complexity and high cost, which limit patient accessibility. Additionally, recent studies have increasingly employed ML methods to develop predictive models for dementia. These include ensemble-based approaches such as XGBoost [9], LightGBM [30], RF [31], and ET [32].
2.3. Predictive Model for Heart Failure Study
A review of current studies on heart failure prediction reveals variations in the datasets used, largely stemming from differences in data acquisition sources. For instance, a study by Kerexeta et al. [33] utilized a dataset comprising six primary features: weight, systolic and diastolic blood pressure, heart rate, oxygen saturation, and diuretic usage. Additionally, patient well-being was assessed through responses to eight survey questions. This data was then used to train an XGBoost model to predict cardiac decompensation events in patients with heart disease. In another study by Mavrogiorgou et al. [34], random forest emerged as the most accurate predictive model after evaluating several algorithms on a dataset of 299 heart failure patients. Similarly, a study by Ali et al. [35] categorized data into two groups based on heart disease risk factors. The first group included patients influenced by unavoidable factors such as age and sex, while the second group focused on lifestyle-related behaviors, including chest pain type, resting blood pressure, serum cholesterol, fasting blood sugar, electrocardiographic results, maximum heart rate achieved, exercise-induced angina, old peak, peak exercise slope, number of major vessels colored by fluoroscopy, and thallium scan results. While XGBoostis recognized for its strong performance, other boosting methods such as LightGBM [36], CatBoost [37], and AdaBoost [38] have also demonstrated efficiency in early heart failure detection, handling complex medical datasets effectively. Additionally, ETs [32] and RF [39] have proven effective in analyzing medical data by capturing intricate patterns through random feature selection and sampling, making them invaluable tools for disease prediction and classification tasks.
2.4. Dementia Feature Study
Detecting dementia [40] and heart failure [41] in adults often relies on advanced laboratory methods, which are not well-suited for early detection. To address this limitation, this study proposes the use of electronic health records (EHRs) to develop classification models for these two conditions. Specifically, the study focuses on employing blood test datasets and personal data, given the significant collinearity among their features. Some of these features have demonstrated predictive potential for disease occurrence. Within the blood test dataset, hemoglobin plays a vital role in maintaining cellular bioenergetic homeostasis by facilitating oxygen binding and transportation to tissues [42]. Platelets, commonly used in treating vascular injuries [43], are also associated with disease activity, as their levels correlate with disease progression [43,44,45,46]. Similarly, the neutrophil-lymphocyte ratio, derived from two types of white blood cells—neutrophils and lymphocytes [47]—serves as a biomarker for inflammatory activity during acute coronary syndrome [48]. Potassium, an essential electrolyte, has been suggested as a preventive measure for Alzheimer’s disease when consumed at high intake levels as part of non-pharmacological therapy [49]. Kidney function indicators, such as creatinine and blood urea nitrogen (BUN) levels, combined with urine-specific gravity and osmolality, provide relatively insensitive but valuable insights into kidney health [50]. Personal data also play an important role in disease prediction. For instance, age and biological characteristics are strongly linked to health-related behaviors [51] and are associated with the morbidity burden in patients with multiple chronic conditions [52]. Compared to traditional diagnostic methods such as MRI scans—which can be challenging to access, costly, and associated with certain risks [53]—using blood test datasets offers a cost-effective and accessible alternative, particularly in resource-limited settings with restricted access to advanced medical technology [54]. This study aims to investigate the potential of these alternative features, emphasizing their utility in binary classification tasks.
2.5. Classification Model for Dementia and Heart Failure
Several studies have employed ensemble learning techniques to construct disease prediction and classification models. Ensemble learning methods can be broadly categorized into two groups: boosting and bagging. Boosting methods combine multiple weak learners sequentially, with each subsequent model addressing the errors made by the previous one. These methods typically adjust the weights of misclassified data points, giving them greater importance in subsequent iterations. Prominent examples of boosting techniques include GB, XGBoost, and LightGBM. Bagging (bootstrap aggregating) involves training multiple models in parallel on different random subsets of the training data (sampled with replacement). The predictions of these models are then combined, typically through averaging for regression tasks or voting for classification tasks. Bagging is particularly effective at reducing variance and mitigating overfitting. Common examples of bagging methods include RF and ETs.
For the boosting group, LightGBM improves accuracy through parallel computing, efficiently processing large datasets and complex models. It leverages feature parallelism to speed up learning by handling more features simultaneously, data parallelism to enhance pattern recognition in large datasets, and voting parallelism to improve prediction accuracy by quickly aggregating results from multiple models [55]. GB is an ensemble method that combines weak decision trees (DTs) to form a stronger model. It iteratively adds trees that focus on correcting the residuals of previous trees, minimizing errors through gradient descent. This process reduces prediction errors, enhances accuracy, and controls model complexity, preventing overfitting. The combination of weak learners and regularization makes GB highly effective for classification tasks [56]. XGBoost is an advanced gradient-boosting algorithm designed to manage overfitting and underfitting through regularization. Its objective function combines a loss function for predictive performance with a regularization term to control model complexity. XGBoost is robust to outliers and handles missing data effectively, making it particularly well-suited for this analysis. A study [57] also found that XGBoost outperformed other ensemble classifiers in disease prediction tasks.
For the bagging group, RF is an advanced ensemble learning technique that randomly samples training datasets and aggregates predictions to build decision trees. This approach helps reduce overfitting and effectively handles high-dimensional data, thereby improving pattern recognition [58,59]. ETs enhance DT construction by randomizing both attribute selection and cut-point choices when splitting nodes. This results in entirely random trees, and the independence of these tree structures from the output values ensures the reliability of ETs. Additionally, ETs prioritize computational efficiency while maintaining high accuracy [60].
Besides prediction tasks, machine learning–based models for the classification of dementia and heart failure have gained increasing attention in both binary and multi-class classifications. In binary classification, ensemble learning models have consistently shown strong performance, with ETs being particularly effective [61,62]. Similarly, ensemble learning methods have demonstrated superior performance for multi-class classification, such as GB [63] and XGBoost [64]. However, the previous studies indicate that the ensemble models often require a complex data enrichment framework to achieve robust performance. In this study, the focus is placed on binary classification to determine whether a patient has either dementia or heart failure, leveraging CTGAN to generate synthetic samples that are statistically valid, diverse, and clinically meaningful—outperforming traditional oversampling methods.
2.6. Data Synthetic Generation
The synthetic minority oversampling technique (SMOTE) and CTGAN are popular methods for addressing imbalanced datasets by generating synthetic data. While both methods aim to enhance model performance on imbalanced datasets, they operate differently and have distinct characteristics. SMOTE is a sampling method designed to balance class distribution by creating synthetic instances of the minority class. It generates new examples in the feature space between existing minority class instances by interpolating between similar points [65]. In contrast, CTGAN is a more versatile generative model that uses a GAN architecture to generate synthetic data. Unlike SMOTE, which focuses on interpolation, CTGAN generates new data based on the underlying distribution and correlations of the original dataset, which were used to generate minority class for this study.
In general, data scientists can create diverse datasets that capture various conditions and characteristics, which is essential for understanding complex diseases. Both SMOTE and CTGAN are widely used to generate synthetic data in medical and healthcare domains [66,67,68,69]. In the context of dementia [68] and heart failure [69], this study proposes the use of CTGAN to generate synthetic datasets that closely mirror the original data and aims to compare its performance with the conventional SMOTE in improving model classification performance.
2.7. The Proposed Study
Previous studies have often relied on MRI or cognitive test data to predict dementia. However, these methods are expensive and inaccessible. Therefore, Phanbua et al. [62] combined 4297 clinical records obtained from both dementia and heart failure patients with SMOTE to correct for class imbalance. Nevertheless, when applied to larger and more diverse datasets, SMOTE is often less effective at capturing the complex feature distributions present in data. To overcome this challenge, CTGAN presents a novel method that can model nonlinear relationships and generate diverse and realistic synthetic samples that better reflect the underlying data structure.
In summary, this study proposes a binary classification model that leverages the relationships between features in blood tests and personal data to classify two related diseases—dementia and heart failure—for early detection. The data, obtained from the EHR of two hospitals in Chiang Rai province, Thailand, was analyzed. Synthetic data generation was necessary due to the low-dimensional and imbalanced nature of the raw data. Specifically, this study employed CTGAN to generate diverse synthetic data while preserving the statistical distribution, thereby enhancing the overall performance of ensemble models from both boosting and bagging groups. Additionally, this study includes a performance comparison with SMOTE, highlighting the unique effectiveness of CTGAN in enhancing the overall performance of ensemble learning classification models for dementia and heart failure. The performance of these models was evaluated with metrics including accuracy, precision, recall, F1-score, and area under the receiver-operating characteristic curve (AUC ROC) score.
3. Research Methodology
The research methodology is illustrated in Figure 1 and encompasses data collection, data preprocessing, feature engineering, and model construction.
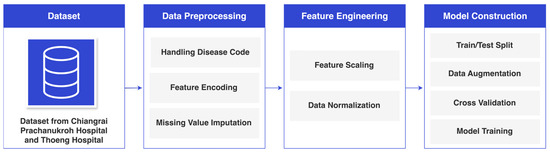
Figure 1.
Research Methodology.
3.1. Data Collection
Table 1 presents data collected from the EHRs of Chiang Rai Prachanukroh Hospital and Thoeng Hospital in Chiang Rai Province, Thailand, spanning the years 2016 to 2022, comprising a total of 11,124 records, including 3372 dementia records (30.3%) and 7752 heart failure records (69.7%). The dataset includes 23 blood test and personal features, classified into two categories: dementia (represented by ICD-10 codes F00, F01, F02, and F03) and heart failure (represented by the ICD-10 code I50). Each record belongs exclusively to one diagnostic category, with no overlap between the two classes. Furthermore, a comprehensive statistical analysis was conducted to explore the relationship between the features and the diseases, revealing low p-values for key factors, including neutrophils, secondary diagnosis, high-density lipoprotein (HDL), white blood cells, and lymphocytes. These extremely low p-values indicate strong statistical significance. For this study, a p-value threshold of 0.05 was adopted to determine statistical significance. The observed p-values for these factors were notably smaller, suggesting an exceptionally low probability that these results occurred by chance.

Table 1.
Dataset Attributes.
3.2. Data Preprocessing
Figure 2 illustrates the data preprocessing process, which includes handling disease codes, feature encoding, and missing value imputation. The details of each step are explained in this section.

Figure 2.
Data Preprocessing.
3.2.1. Handling Disease Codes
The ICD-10 codes directly related to dementia and heart failure were excluded from the principal diagnosis variable in this study to avoid providing the classifier with an unfair advantage by directly indicating the patient’s conditions. However, the remaining ICD-10 codes were retained as secondary diagnosis data to preserve relevant contextual information that does not explicitly identify dementia or heart failure.
3.2.2. Feature Encoding
To enhance the learning process of the machine learning algorithms, this study employed specific encoding techniques to transform the data. Nominal data were subjected to one-hot encoding, while ordinal data were processed using ordinal encoding. These transformations enabled the algorithm to effectively interpret and learn from the dataset.
3.2.3. Missing Value Imputation
To ensure effective learning within the model, it was essential to handle the missing data in the dataset. In this study, missing values were replaced with the median value of the respective feature. This approach was chosen to allow the model to learn from a complete dataset and improve its performance.
3.3. Feature Engineering
The feature engineering framework is shown in Figure 3.

Figure 3.
Feature Engineering.
As shown in Figure 3, following data preprocessing, the feature engineering process began by categorizing the data into categorical and continuous types. Continuous features were then processed using a standard scaler and Yeo–Johnson transformation. Once optimized, these features were combined for model construction.
3.3.1. Dataset Segregation
After preprocessing the dataset, it was divided into two distinct categories: continuous and categorical. The study then focused on enhancing the continuous data through feature engineering. The objective was to enrich the dataset with more informative attributes, thereby improving the machine learning capabilities and achieving more accurate outcomes.
3.3.2. Feature Scaling
The standard scaler used in this study to normalize the data offered several advantages. By centering each feature around a mean of 0 and scaling it to a standard deviation of 1, this technique ensured that all features were uniformly represented on a standard scale. This normalization not only standardizes the data but also reduces the influence of differences in feature magnitude, making the dataset more suitable for models sensitive to feature scaling. Moreover, this process preserves the relative relationships between feature values while enabling fair and accurate comparisons across features. These improvements enhance the interpretability and performance of the subsequent analysis and modeling.
3.3.3. Skewed Data Normalization
The Yeo–Johnson transformation was used in this study to address data skewness, improving model accuracy and ensuring more reliability. Skewed data can significantly hinder machine learning model performance because many algorithms assume a normal distribution. Excessive distortion in the data can cause the model to learn inaccurate patterns, misrepresent true relationships, and introduce bias into predictions. Rectifying skewed data not only improves interpretability by establishing clearer variable relationships but also mitigates these issues.
3.3.4. Dataset Integration
After feature engineering was applied to the continuous data, the refined dataset was combined with the previously separated categorical data. This integration prepared the dataset for partitioning in the subsequent model construction phase.
3.4. Model Construction
Steps for model construction are shown in Figure 4.

Figure 4.
Model Construction.
As illustrated in Figure 4, the model construction process began by dividing the initial dataset into training and test sets. The training dataset was then subjected to 5-fold cross-validation to validate the performance across all ensemble classifiers, including XGBoost, LightGBM, GB, RF, and ET. Subsequently, all classifiers were trained using the oversampled training dataset and evaluated across multiple performance metrics for comparison.
3.4.1. Dataset Splitting for Training and Testing
In accordance with the recommendations in [70], the dataset was split into an 80% training set and a 20% test set. This division was intentionally designed to ensure fair model training and evaluation. By maintaining unbiased representation in both subsets, this approach is essential for developing a robust and reliable model.
3.4.2. Synthetic Data Generation Using CTGAN
Given the significant imbalance between the dementia and heart failure data, this study employed CTGAN to address this issue. CTGAN was selected for its ability to generate high-quality synthetic samples for the minority class, thereby balancing the dataset. Importantly, this approach ensured that the test data remained unbiased, while the model’s reliability was improved by correcting the data imbalance.
As shown in Figure 5, CTGAN operates through two networks: a generator and a discriminator. The generator creates synthetic data samples that resemble the minority class, while the discriminator evaluates their authenticity. These two networks train iteratively, with the generator improving its ability to produce realistic samples. The adversarial process continues, with both networks refining their capabilities over time. The generator learns to produce increasingly convincing samples, while the discriminator hones its ability to distinguish between real and synthetic data. As a result, the generator is pushed to create samples that closely resemble real minority class data, while the discriminator sharpens its ability to identify fake data. By continuously generating synthetic samples and refining both networks, CTGAN enhances the model’s performance on minority class classifications, which would otherwise be underrepresented in the original dataset.
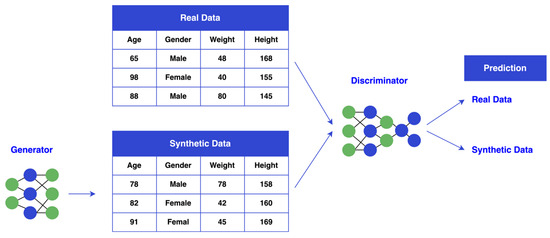
Figure 5.
CTGAN Diagram.
3.4.3. Model Training and Testing
This study evaluated ensemble methods from both the bagging and boosting groups, including XGBoost, LightGBM, GB, RF, and ET. GB sequentially builds decision trees to correct errors at each step, supporting any differentiable loss function. XGBoost enhances gradient boosting with parallel computation, offering faster training and scalability for large datasets. LightGBM, developed by Microsoft, further optimizes training speed and memory efficiency. From the bagging group, RF and ET use multiple decision trees to improve accuracy. RF introduces tree diversity through bootstrap sampling and randomly selects feature subsets at each split. In contrast, ET uses the entire dataset without bootstrapping, introducing randomness by splitting data at randomly chosen thresholds, which can enhance performance in specific scenarios. This study aimed to determine whether data generation using CTGAN could improve the performance of these ensemble methods. To ensure a robust evaluation, a 5-fold cross-validation approach was applied.
3.5. Model Evaluation
The performance of all classifiers was assessed using various metrics, including accuracy, recall, precision, F1-score, and AUC ROC score. Four variables were used to determine the evaluation parameters: true positive (TP), true negative (TN), false positive (FP), and false negative (FN). In this study, TP and FN correspond to heart failure, while FP and TN represent dementia, as shown in Table 2.
Table 2.
Classification Metrics for Model Performance Evaluation.
Accuracy is calculated by dividing the number of correctly classified observations by the total number of observations, as shown in Equation (1). Recall (sensitivity) is defined as the ratio of correctly classified positive observations to all observations in the positive class, as illustrated in Equation (2). Precision represents the ratio of correctly classified positive observations to all classified positive observations, as expressed in Equation (3). The F1-score is calculated as the weighted average of precision and recall values, as demonstrated in Equation (4). This metric is particularly useful when working with imbalanced datasets [71].
3.6. Feature Evaluation
Feature evaluation is a crucial process for understanding the influence of individual features within a model. This assessment typically involves two fundamental methods: the Pearson correlation coefficient, which measures feature correlations, and Shapley additive explanation (SHAP) values, which reveal the impact of each feature on the target variable.
3.6.1. Pearson Correlation Coefficient
The Pearson correlation coefficient, a commonly used measure of linear correlation that ranges from −1 to 1 between two variables, was used to visualize the correlation between features and evaluate their relationships before implementation. It measures the strength and direction of the relationship between the variables, with a value of −1 indicating a perfect negative correlation, 0 indicating no correlation, and 1 indicating a perfect positive correlation, as shown in Equation (5). The interpretation of the coefficient values between the features is provided in Table 3.
where represents the correlation coefficient, denotes the value of the x-variable in the dataset, signifies the mean of the x-variable, represents the value of y-variable, and stands for the mean of the y-variable.
Table 3.
Pearson Correlation Coefficient Interpretation between Feature and Feature.
As presented in Table 4, percentile-based cutoff thresholds were established to interpret the effect sizes between each feature and the target variable. Coefficients below the 25th percentile were classified as negligible, those at the 25th percentile as weak, the 50th percentile as moderate, and the 75th percentile as strong, thereby providing a data-driven framework for interpreting correlation strength [72].
Table 4.
Pearson Correlation Coefficient Interpretation between Feature and Target.
3.6.2. Shapley Value
Understanding how variables affect model classifications requires effective methods. Among various approaches, SHAP values are widely recognized and dominate in their usage. SHAP values reflect the relevance of variables and their directional impact on classifications, thus enhancing model interpretability. They also provide insights into how specific features influence classifications. SHAP values are versatile and inclusive for comprehensive model analysis, as they can be adapted across different model types, unlike methods limited to specific models. By conveying Shapley values, SHAP demonstrates the average marginal contribution of each feature to overall classifications, as well as its significance in different feature combinations. In this study, SHAP is employed to evaluate feature contributions using test data, facilitating a detailed examination of the individual feature impacts on the model’s classifications.
4. Experimental Results and Discussion
This section presents the results obtained from applying all ML classifiers to the synthetic dataset. To ensure reliability and credibility, the study first demonstrates the analysis of the Pearson correlation and Point-Biserial correlation coefficients both before and after using CTGAN. This is followed by the outcomes of 5-fold cross-validation, which highlights the trustworthiness of the models. Finally, all evaluation metrics—accuracy, precision, recall, F1-score, and AUC ROC score—are presented to assess the performance of the classifiers on the synthetic integrated datasets.
4.1. Pearson Correlation Coefficient of Original Dataset
In analyzing the correlation between the encoded target and various study variables, as shown in Figure 6.

Figure 6.
Pearson Correlation Coefficient Results of Original Training Dataset.
As shown from Figure 6, several key relationships emerged from the original training dataset. Age showed a moderate positive correlation of 0.075, indicating that older individuals have a slightly higher likelihood of the target outcome. Weight, height, and systolic blood pressure exhibited weaker correlations, with weight and height having negative correlations of −0.046 and −0.028, respectively, and systolic blood pressure showing a negligible positive correlation of 0.018. Cholesterol and HDL demonstrated stronger positive correlations with the target, at 0.195 and 0.280, respectively, indicating their significant association with the target. In contrast, low-density lipoprotein (LDL) had a moderate positive correlation of 0.074, while triglycerides and fasting blood sugar presented relatively weak correlations of 0.028 and −0.050, respectively. Creatinine and BUN showed negative correlations of −0.130 and −0.189, respectively, reflecting their inverse relationship with the target. Among hematological features, white blood cells and neutrophils exhibited the strongest negative correlations with the target, at −0.218 and −0.246, respectively, suggesting that higher levels of these components are associated with a lower likelihood of the target outcome. Lymphocytes had a moderate positive correlation of 0.117, indicating a slight association with the target. Gender encoding showed a weak positive correlation of 0.031, while smoking and drinking demonstrated moderate negative correlations of −0.055 and −0.043, respectively.
As shown in Figure 7, when the training dataset was generated using CTGAN, the correlation analysis revealed changes in several variables.

Figure 7.
Pearson Correlation Coefficient Results of Synthetic Dataset.
From Figure 7, age demonstrated a higher positive correlation of 0.207, strengthening the association between older individuals and the target outcome. Systolic blood pressure and diastolic blood pressure showed higher correlations, increasing to 0.192 and 0.073, respectively, indicating a stronger relationship with the target. Similarly, weight and height, while still weakly correlated, exhibited reduced negative correlations of −0.107 and −0.020, respectively. Cholesterol and HDL retained their strong positive correlations, though slightly reduced to 0.180 and 0.243, respectively. Among other features, lymphocytes showed an increased positive correlation of 0.211, while neutrophils maintained a negative correlation that intensified slightly to −0.324. White blood cells exhibited a reduction in their negative correlation to −0.165. Smoking and drinking, which were weakly negative in the original dataset, shifted to positive correlations of 0.118 and 0.149, respectively, indicating that CTGAN enhanced the representation of latent associations within the existing data. Gender encoding also increased to a positive correlation of 0.131. Interestingly, CTGAN led to an overall improvement in the Pearson correlation score across the dataset. The mean correlation coefficient rose from 0.010 in the original dataset to 0.018 in the new synthetic dataset, indicating that the synthetic data generated by CTGAN enhanced the linear relationships between the target and the features. This improvement suggests that CTGAN may help uncover latent patterns and strengthen feature-target associations in datasets with limited or imbalanced data.
Additionally, the correlation between each feature and the target variable is presented using the Point-Biserial correlation, as shown in Appendix A. The relationships between features and the target variable are illustrated before applying CTGAN in Figure A1 and after applying CTGAN in Figure A2. Overall, the Point-Biserial correlation score increased from −0.003 to 0.047 after applying CTGAN, suggesting a slightly stronger overall association between features and the target. While this indicates improved data balance and representation, it may also reflect the potential introduction of synthetic correlations, warranting cautious interpretation.
4.2. Cross-Validation Evaluation
Table 5 presents a summary of the 5-fold cross-validation results, showcasing the robustness and reliability of the classifiers across various evaluation metrics.
Table 5.
Comparison of Classification Performance with 5-Fold Cross-Validation.
From the validation results, XGBoost achieves the highest accuracy (96.37%) and the best performance in AUC ROC (99.04%). LightGBM also demonstrates strong performance, matching XGBoost in AUC ROC (99.04%) and achieving a competitive accuracy of 96.31%. GB and RF perform well, with accuracies of 95.89% and 95.70%, respectively, and balanced AUC ROC scores of 98.14% for GB and 98.52% for RF. Meanwhile, ET achieves an accuracy of 94.47%, but its precision and recall are comparatively lower, indicating challenges in handling more complex patterns in the data.
4.3. Performance Evaluation Metrics for Classification Models
In this study, the performance of various classifiers was evaluated under three distinct synthetic data generation techniques: baseline (no generation), SMOTE, and CTGAN. Performance metrics such as accuracy, precision, recall, F1-score, and AUC ROC were used for comparison during the testing process. Detailed comparison results are presented in Table 6. This analysis focused on examining the effect of CTGAN on classifier performance, particularly in the context of imbalanced datasets, and compared its effectiveness to both the baseline and SMOTE across multiple instances.
Table 6.
Comparison of Classification Performance.
4.3.1. Accuracy Evaluation
According to the classification model analysis, all models using synthetic data from CTGAN achieved higher accuracy than those using SMOTE and the baseline models. Among these, XGBoost demonstrated the best accuracy with CTGAN synthetic data generation, reaching 96.94%, compared to 96.45% with SMOTE and 96.36% with the baseline. This improvement in accuracy was observed across all classifiers, highlighting that CTGAN synthetic data generation enhances model performance. By generating more diverse and balanced samples, CTGAN’s synthetic data enabled the models to learn from a broader range of patterns. These results demonstrate that CTGAN is a more effective data generation method than SMOTE and the baseline.
4.3.2. Precision Evaluation
Most classifiers showed improved precision with CTGAN synthetic data generation. XGBoost achieved the highest precision at 96.93% using CTGAN, followed by 96.11% with SMOTE and 96.29% with the baseline. LightGBM, GB, and RF also saw improvements in precision with CTGAN, reaching 96.60%, 96.07%, and 96.18%, respectively. These gains indicate that CTGAN synthetic data generation enhanced the model’s ability to identify positive cases, reducing false positives. CTGAN’s realistic synthetic data contributed to greater precision compared to SMOTE, which only balanced the dataset. However, ET’s precision dropped to 94.86% with CTGAN synthetic data generation, a decrease from its baseline precision of 96.13%. This suggests that ET may be overfitting to the noise in the synthetic data. Overfitting can cause the model to become excessively tuned to the unique characteristics of the synthetic data, leading to a drop in precision when applied to unseen or real data.
4.3.3. Recall Evaluation
XGBoost with CTGAN synthetic data generation achieved the highest recall at 95.79%, surpassing 95.44% with SMOTE and 95.04% with the baseline. Similarly, LightGBM, GB, RF, and ETs all demonstrated improved recall with CTGAN, reaching 95.48%, 94.29%, 94.09%, and 93.89%, respectively. Additionally, all models with CTGAN synthetic data generation outperformed those using SMOTE and baseline models. These results highlight that CTGAN’s synthetic data helped the models identify more true positive instances, which is crucial for addressing imbalanced datasets.
4.3.4. F1-Score Evaluation
Regarding F1-score, which balances precision and recall, CTGAN demonstrated a clear advantage for most models. XGBoost achieved the highest F1-score of 96.34%, followed by LightGBM at 96.01%, and GB at 95.12% with CTGAN synthetic data generation. These models benefitted from the synthetic data generated by CTGAN, which enhanced their ability to correctly classify positives while reducing false negatives and positives. SMOTE also improved the F1-scores, but the gains were slightly lower, as seen with XGBoost at 95.77% and LightGBM at 95.65%. The improvement in F1-score across all models with CTGAN reinforces the argument that CTGAN provides a more balanced and effective learning experience. RF also achieved its best F1-score with CTGAN synthetic data generation, reaching 95.05%. ETs showed an equal F1-score of 94.35% with both CTGAN and SMOTE, slightly surpassing its baseline score of 93.96%, suggesting that the synthetic and more balanced data contributed to a performance improvement.
4.3.5. AUC ROC Score Evaluation
Finally, regarding AUC ROC, which measures the model’s ability to discriminate between classes, all ensemble learning models with CTGAN synthetic data generation achieved relatively high AUC ROC scores, similar to those obtained with SMOTE and baseline models. For instance, XGBoost achieved an AUC ROC score of 99.09% with CTGAN synthetic data generation, slightly lower than its 99.13% score with SMOTE and its baseline score of 99.06%. LightGBM, GB, RF, and ETs also exhibited similar trends. This suggests that while CTGAN’s synthetic data may not significantly improve the models’ ability to rank positive and negative instances, the high AUC ROC values across all models indicate that CTGAN synthetic data generation preserves the models’ discriminative power.
4.4. Model Performance Discussion
The classification results show that CTGAN synthetic data generation helped ensemble models better capture diverse patterns in the dataset, leading to improvements in key metrics, including accuracy, precision, recall, and F1-score. For instance, XGBoost with CTGAN synthetic data generation achieved 96.93% precision, an improvement over SMOTE’s 96.11%. In terms of recall, XGBoost surpassed the baseline, scoring 95.04% and increasing to 95.79% with CTGAN synthetic data generation. These results suggest that the additional synthetic data helped reduce false negatives, thereby improving the model’s ability to identify positive cases. The F1-score also saw significant gains with CTGAN synthetic data generation; for example, XGBoost scored 96.34%, compared to 95.77% with SMOTE. Table 6 highlights the substantial improvements in model performance achieved with CTGAN synthetic data generation, which proved more effective than SMOTE across multiple ensemble classifiers.
Table 6 also shows that XGBoost achieved the best results among the models with CTGAN synthetic data generation. XGBoost trains models sequentially, correcting errors at each step, making it more sensitive to the balanced patterns introduced by CTGAN. This iterative learning process allows the model to effectively leverage the complex relationships in the synthetic data, making it the most responsive to the synthetic data generation. LightGBM, GB, ETs, and RF demonstrated similar improvements across all key metrics when trained with CTGAN-generated data. These models were able to capture complex data patterns and interactions due to the more balanced distribution and improved feature relationships introduced by CTGAN. Although the improvements were not as pronounced as with XGBoost, their performance still indicated a strong capacity to leverage the synthetic data effectively. This suggests that CTGAN synthetic data generation provides enough consistency to enhance their classification power, particularly in scenarios where data imbalances might otherwise hinder learning.
The least improvement was observed in AUC ROC. All models showed relatively high values for both the SMOTE-generated and original baseline models. Despite improvements in accuracy, precision, recall, and F1-score, AUC ROC may not show significant enhancement because it assesses a model’s ability to rank probabilities and discriminate between classes, rather than simply making accurate classifications. While synthetic data generation with CTGAN can enhance certain aspects of model performance, its effect on AUC ROC may be limited. However, the high AUC ROC values obtained for the data generation with CTGAN demonstrate the effective models’ discriminative power.
While SMOTE also provided performance improvements over the baseline, its impact was not as significant as CTGAN’s, particularly in terms of precision and recall. This suggests that the synthetic data generated by CTGAN was more effective in refining the models’ ability to correctly classify positive instances, thereby enhancing both precision and recall. The overall performance improvements across most classifiers highlight the importance of selecting the right data generation method, with CTGAN emerging as the more robust option for enhancing model performance in this specific task.
4.5. Feature Contribution
Although all ensemble learning models benefit from the proposed generated data provided by CTGAN, XGBoost consistently demonstrated the best overall performance with CTGAN. This section presents the performance results and feature contributions of XGBoost as a representative example.
4.5.1. Feature Importance Using XGBoost
As shown in Figure 8, the feature importance analysis of the XGBoost model reveals the key factors influencing classification outcomes. The top contributors were neutrophil (29.02%), triglyceride (14.90%), and LDL (9.19%), all playing significant roles in the model’s performance. Neutrophil exhibited a strong negative Pearson correlation (−0.247) with the target, suggesting that higher neutrophil levels are associated with lower target values. While triglyceride and LDL demonstrated moderate Pearson correlations with the target (0.29 and 0.082, respectively), their high feature importance in XGBoost indicates that the model captured complex patterns beyond simple linear relationships. Other features, such as potassium (6.21%) and lymphocyte (5.19%), were also relevant, with lymphocyte showing a consistent positive correlation (0.117). Interestingly, despite HDL having the highest positive correlation (0.28) with the target, it exhibited lower feature importance (4.15%), indicating its relationship with the target is predominantly linear. The interplay between LDL and HDL provides further insight: while both cholesterol markers are biologically related, HDL is often inversely correlated with LDL, which results in differing roles within the model. LDL’s higher feature importance suggests its involvement in more complex, nonlinear interactions influencing the target, despite its weaker Pearson correlation with the target compared to HDL. Conversely, features such as smoker (0.59%), age (0.61%), and drinker (0.88%) had a minimal effect on classifications. Their relatively low target correlations (−0.055 for smokers and −0.043 for drinkers) further demonstrate their limited classification power. In summary, neutrophil, triglyceride, and LDL emerged as the most critical predictors, while demographic and lifestyle factors contributed minimally to this binary classification task.

Figure 8.
Feature Importance Using XGBoost (Version 2.0.0).
4.5.2. Impact of Features on Model Classification by XGBoost
Figure 9 illustrates the impact of each feature on the model’s classifications based on the mean absolute SHAP scores analysis.
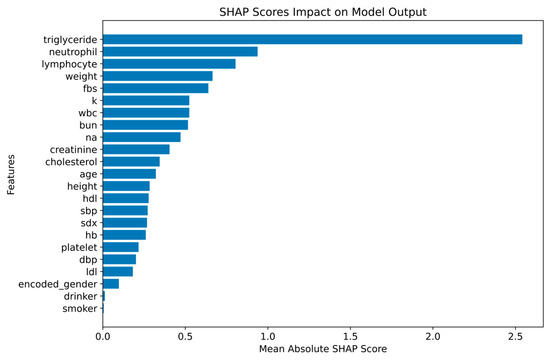
Figure 9.
Mean Shapley Values for Feature Impact of XGBoost.
From Figure 9, the most influential features identified were triglyceride (2.54), neutrophil (0.94), and lymphocyte (0.80), with triglyceride having the highest SHAP score and the strongest effect on the model’s output. Neutrophil and lymphocyte also demonstrated notable contributions to the model’s classifications, underlining their importance in determining the outcome. Additional features, such as weight (0.66), fasting blood sugar (0.64), and other covariates, also played a role in boosting the model’s performance, highlighting their relevance in predicting the target variable. Despite a strong relationship with the target, HDL (0.28) and LDL (0.18) cholesterol markers had lower SHAP scores compared to other features, suggesting that the model captures more complex, nonlinear interactions than simple linear correlations. Demographic and lifestyle factors, including smoking (0.01), drinking (0.01), and gender (0.10), had minimal impact on the model’s classifications. This indicates that these variables contribute less to the model’s performance compared to clinical and biochemical data. The results from the mean absolute SHAP scores analysis confirm that triglycerides, neutrophils, and lymphocytes are the most important drivers of the model’s classifications, with clinical and biochemical markers playing a more significant role than lifestyle factors. This supports the conclusion that clinical and biochemical data are crucial for accurate classification outcomes, while lifestyle factors have less influence in this context.
4.6. Study Scope and Limitations
This study focused on subjects diagnosed with dementia and heart failure, as these two conditions are highly prevalent among older adults and share several overlapping vascular and metabolic risk factors. The data were retrieved from hospital electronic health records, where most patients naturally present with existing health conditions. This limited the inclusion of truly healthy individuals, and focusing on clinically diagnosed groups provided more practical relevance. In elderly populations, the majority of hospital visitors are not entirely healthy due to age-related physiological decline. Thus, predicting disease presence or differentiation between dementia and heart failure are more meaningful than comparison with a small, non-representative healthy cohort. However, this focused design inevitably limits the model’s generalizability to broader populations. To minimize potential overfitting, the study employs CTGANs to balance class distribution, along with ensemble-based classifiers and stratified cross-validation to enhance the robustness. Future research should expand the dataset to include healthy subjects and additional disease groups to improve the generalizability of the results. However, the observed improvement is considered modest; this should be interpreted with caution.
4.7. Summary of the Findings
This study proposed a new method for dementia classification, distinct from its common comorbidity, heart failure. The results showed that the proposed features led to superior performance of the ensemble models and deep interpretability, offering practical insights into the critical features driving the classification. This emphasis on practical implications sets a new standard in dementia early detection and personalized intervention strategies in clinical practice. Moreover, the study also demonstrated that CTGAN can significantly enhance model performance by generating more realistic and diverse synthetic data. The performance improvements observed across all models indicate CTGAN’s potential to enhance classification models, making it a valuable tool for handling low-dimensional and imbalanced datasets while improving classification reliability. These findings highlight the importance of incorporating advanced synthetic data generation techniques like CTGAN in the development of classification models, particularly when dealing with such datasets. Future research could explore further optimizations of CTGAN and its integration with other advanced classification algorithms to improve the generalizability of other disease classification models. Additionally, expanding the dataset and refining feature engineering methods will be crucial in enhancing model robustness and ensuring applicability in real-world clinical scenarios.
5. Conclusions
In conclusion, this study proposed an alternative method for dementia classification by distinguishing it from its common comorbidity, heart failure. Blood tests and personal data were used to construct the models, aiming to facilitate the early detection of both diseases in primary care settings with limited resources. More specifically, this study highlighted the use of synthetic data generation with CTGAN to enhance the performance of ensemble learning classifiers, including boosting (XGBoost, LightGBM, GB) and bagging (ETs and RF) models. The dataset, sourced from two local hospitals in Chiang Rai, Thailand, contained 11,124 records with 23 features. Among the evaluated models, CTGAN consistently outperformed SMOTE and baseline models across multiple metrics, including accuracy, precision, recall, and F1-score. These improvements suggest that CTGAN is a more effective method for addressing data imbalances, and enhancing model generalization, ultimately leading to more reliable classifications.
Author Contributions
Conceptualization, P.P., S.A., G.H. and P.T.; methodology, P.P., S.A. and P.T.; software, P.P.; validation, P.P. and S.A.; formal analysis, G.H. and P.T.; resources, S.A.; data curation, P.P.; Visualization, P.P.; writing—original draft preparation, P.P.; writing—review and editing, S.A. and P.T.; supervision, S.A. and P.T.; project administration, P.T.; funding acquisition, G.H. and P.T. All authors have read and agreed to the published version of the manuscript.
Funding
This study is supported in part by Program Management for Human Resources & Institutional Development, Research, and Innovation Office of National Higher Education Science Research and Innovation Policy Council: Contract No. B04G640071; and in part by European Union (EU) NextGenerationEU through the National Recovery and Resilience Plan, Bulgaria, under Project BG-RRP-2.013-0001.
Institutional Review Board Statement
This study received a certificate of exemption from Mae Fah Luang University Ethics committee on Human Research (protocol number EC 23130-13, dated 17 August 2023), as well as a certificate of ethical approval from Chiangrai Prachanukroh Hospital (protocol code EC CRH 112/64 In, dated 7 February 2022).
Informed Consent Statement
Not applicable.
Data Availability Statement
Access to the dataset is currently restricted, as the study is still ongoing.
Acknowledgments
The authors would like to bring the gratitude to Chiangrai Prachanukroh Hospital and Thoeng Hospital, Chiang Rai, Thailand for the data and valuable assistant.
Conflicts of Interest
The authors declare no conflict of interest.
Abbreviations
The following abbreviations are used in this manuscript:
| CTGANs | Conditional Tabular Generative Adversarial Networks |
| HFSA | Heart Failure Society of America |
| MRI | Magnetic Resonance Imaging |
| GAN | Generative Adversarial Network |
| XGBoost | Extreme Gradient Boosting |
| LightGBM | Light Gradient Boosting Machine |
| GB | Gradient Boosting |
| RF | Random Forest |
| ET | Extra Trees |
| ML | Machine Learning |
| EHRs | Electronic Health Records |
| BUN | Blood Urea Nitrogen |
| DTs | Decision Trees |
| SMOTE | Synthetic Minority Oversampling Technique |
| AUC ROC | Area Under the Receiver-Operating Characteristic Curve |
| ICD-10 | International Classification of Diseases, Tenth Revision |
| HDL | High-Density Lipoprotein |
| SBP | Systolic Blood Pressure |
| DBP | Diastolic Blood Pressure |
| FBS | Fasting Blood Sugar |
| LDL | Low-Density Lipoprotein |
| HB | Hemoglobin |
| K | Potassium |
| NA | Sodium |
| WBC | White Blood Cells |
| SDX | Secondary Diagnosis |
| TP | True Positive |
| TN | True Negative |
| FP | False Positive |
| FN | False Negative |
| SHAP | Shapley Additive Explanation |
Appendix A. Point-Biserial Correlation with Target

Figure A1.
Point-Biserial Correlation with Target Variable Before CTGAN Application.

Figure A2.
Point-Biserial Correlation with Target Variable After CTGAN Application.
References
- Rudnicka, E.; Napierała, P.; Podfigurna, A.; Męczekalski, B.; Smolarczyk, R.; Grymowicz, M. The World Health Organization (WHO) approach to healthy ageing. Maturitas 2020, 139, 6–11. [Google Scholar] [CrossRef]
- Jaul, E.; Barron, J. Age-Related Diseases and Clinical and Public Health Implications for the 85 Years Old and Over Population. Front. Public Health 2017, 5, 335. [Google Scholar] [CrossRef] [PubMed]
- Cross, P.I. Coronary Heart Disease Diagnosis Before Age 45 May Increase Dementia Risk by 36%. Medical News Today. Available online: https://www.medicalnewstoday.com/articles/coronary-heart-disease-early-diagnosis-age-45-increase-dementia-risk#Heart-health-important-when-evaluating-dementia-risk (accessed on 6 December 2023).
- Wolters, F.J.; Segufa, R.A.; Darweesh, S.K.L.; Bos, D.; Ikram, M.A.; Sabayan, B.; Hofman, A.; Sedaghat, S. Coronary heart disease, heart failure, and the risk of dementia: A systematic review and meta-analysis. Alzheimer’s Dement. J. Alzheimer’s Assoc. 2018, 14, 1493–1504. [Google Scholar] [CrossRef] [PubMed]
- Yap, N.L.X.; Kor, Q.; Teo, Y.N.; Tey, T.; How, C.H.; Chan, Y.H.; Lam, C.S.P. Prevalence and incidence of cognitive impairment and dementia in heart failure: A systematic review, meta-analysis and meta-regression. Hell. J. Cardiol. 2022, 67, 48–58. [Google Scholar] [CrossRef] [PubMed]
- Arvanitakis, Z.; Bennett, D.A. What Is Dementia? JAMA 2019, 322, 1728. [Google Scholar] [CrossRef]
- Yang, H.; Bath, P.A. The use of data mining methods for the prediction of dementia: Evidence from the English Longitudinal Study of Ageing. IEEE J. Biomed. Health Inform. 2020, 24, 345–353. [Google Scholar] [CrossRef]
- Arvanitakis, Z.; Shah, R.C.; Bennett, D.A. Diagnosis and Management of Dementia: Review. JAMA 2019, 322, 1589–1599. [Google Scholar] [CrossRef]
- Ryu, S.-E.; Shin, D.-H.; Chung, K. Prediction model of dementia risk based on XGBoost using derived variable extraction and hyperparameter optimization. IEEE Access 2020, 8, 177708–177720. [Google Scholar] [CrossRef]
- Ferreira-Vieira, T.H.; Guimaraes, I.M.; Silva, F.R.; Ribeiro, F.M. Alzheimer’s disease: Targeting the Cholinergic System. Curr. Neuropharmacol. 2016, 14, 101–115. [Google Scholar] [CrossRef]
- Harrington, D.; McDonald Lenahan, C.; Beacom, R. Heart failure management: Updated guidelines. Am. Nurse J. 2023, 18, 6–11. [Google Scholar] [CrossRef]
- Guha, K.; McDonagh, T. Heart failure epidemiology: European perspective. Curr. Cardiol. Rev. 2013, 9, 123–127. [Google Scholar] [CrossRef]
- Berliner, D.; Hänselmann, A.; Bauersachs, J. The Treatment of Heart Failure with Reduced Ejection Fraction. Dtsch. Arztebl. Int. 2020, 117, 376–386. [Google Scholar] [CrossRef]
- Bader, F.; Atallah, B.; Brennan, L.F.; Rimawi, R.H.; Khalil, M.E. Heart failure in the elderly: Ten peculiar management considerations. Heart Fail. Rev. 2017, 22, 219–228. [Google Scholar] [CrossRef]
- Pellegrini, E.; Ballerini, L.; Hernandez, M.D.C.V.; Chappell, F.M.; González-Castro, V.; Anblagan, D.; Danso, S.; Muñoz-Maniega, S.; Job, D.; Pernet, C.; et al. Machine learning of neuroimaging for assisted diagnosis of cognitive impairment and dementia: A systematic review. Alzheimer’s Dement. Diagn. Assess. Dis. Monit. 2018, 10, 519–535. [Google Scholar] [CrossRef]
- Grueso, S.; Viejo-Sobera, R. Machine learning methods for predicting progression from mild cognitive impairment to Alzheimer’s disease dementia: A systematic review. Alzheimer’s Res. Ther. 2021, 13, 162. [Google Scholar] [CrossRef] [PubMed]
- Javeed, A.; Dallora, A.L.; Berglund, J.S.; Skoog, I.; Anderberg, P. Machine learning for dementia prediction: A systematic review and future research directions. J. Med. Syst. 2023, 47, 17. [Google Scholar] [CrossRef] [PubMed]
- Justin, B.N.; Turek, M.; Hakim, A.M. Heart disease as a risk factor for dementia. Clin. Epidemiol. 2013, 5, 135–145. [Google Scholar] [CrossRef]
- Winston, C.N.; Goetzl, E.J.; Akers, J.C.; Carter, B.S.; Rockenstein, E.M.; Galasko, D.; Masliah, E.; Rissman, R.A. Prediction of conversion from mild cognitive impairment to dementia with neuronally derived blood exosome protein profile. Alzheimer’s Dement. Diagn. Assess. Dis. Monit. 2016, 3, 63–72. [Google Scholar] [CrossRef] [PubMed]
- Alves, T.C.; Rays, J.; Fráguas, R., Jr.; Wajngarten, M.; Meneghetti, J.C.; Prando, S.; Busatto, G.F. Localized cerebral blood flow reductions in patients with heart failure: A study using 99mTc-HMPAO SPECT. J. Neuroimaging Off. J. Am. Soc. Neuroimaging 2005, 15, 150–156. [Google Scholar] [CrossRef]
- Gruhn, N.; Larsen, F.S.; Boesgaard, S.; Knudsen, G.M.; Mortensen, S.A.; Thomsen, G.; Aldershvile, J. Cerebral blood flow in patients with chronic heart failure before and after heart transplantation. Stroke 2001, 32, 2530–2533. [Google Scholar] [CrossRef]
- Hjelm, C.; Broström, A.; Dahl, A.; Johansson, B.; Fredrikson, M.; Strömberg, A. Factors associated with increased risk for dementia in individuals age 80 years or older with congestive heart failure. J. Cardiovasc. Nurs. 2014, 29, 82–90. [Google Scholar] [CrossRef] [PubMed]
- Ahmed, M.R.; Zhang, Y.; Feng, Z.; Lo, B.; Inan, O.T.; Liao, H. Neuroimaging and Machine Learning for Dementia Diagnosis: Recent Advancements and Future Prospects. IEEE Rev. Biomed. Eng. 2019, 12, 19–33. [Google Scholar] [CrossRef] [PubMed]
- Zeighami, Y.; Fereshtehnejad, S.M.; Dadar, M.; Collins, D.L.; Postuma, R.B.; Mišić, B.; Dagher, A. A clinical-anatomical signature of Parkinson’s disease identified with partial least squares and magnetic resonance imaging. NeuroImage 2019, 190, 69–78. [Google Scholar] [CrossRef] [PubMed]
- Armananzas, R.; Iglesias, M.; Morales, D.A.; Alonso-Nanclares, L. Voxel-Based Diagnosis of Alzheimer’s Disease Using Classifier Ensembles. IEEE J. Biomed. Health Inform. 2017, 21, 778–784. [Google Scholar] [CrossRef]
- Sharma, S.; Gupta, S.; Gupta, D.; Altameem, A.; Saudagar, A.K.J.; Poonia, R.C.; Nayak, S.R. HTLML: Hybrid AI Based Model for Detection of Alzheimer’s Disease. Diagnostics 2022, 12, 1833. [Google Scholar] [CrossRef]
- Lombardi, G.; Crescioli, G.; Cavedo, E.; Lucenteforte, E.; Casazza, G.; Bellatorre, A.G.; Lista, C.; Costantino, G.; Frisoni, G.; Virgili, G.; et al. Structural magnetic resonance imaging for the early diagnosis of dementia due to Alzheimer’s disease in people with mild cognitive impairment. Cochrane Database Syst. Rev. 2020, 3, CD009628. [Google Scholar] [CrossRef]
- Buckner, R.L.; Snyder, A.Z.; Sanders, A.L.; Raichle, M.E.; Morris, J.C. Functional brain imaging of young, nondemented, and demented older adults. J. Cogn. Neurosci. 2000, 12 (Suppl. 2), 24–34. [Google Scholar] [CrossRef]
- Nadel, J.; McNally, J.S.; DiGiorgio, A.; Grandhi, R. Emerging Utility of Applied Magnetic Resonance Imaging in the Management of Traumatic Brain Injury. Med. Sci. 2021, 9, 10. [Google Scholar] [CrossRef]
- Roopalakshmi, R.; Sreelatha, R. A novel light GBM framework combined with gain optimization for predicting dementia severity of Alzheimer’s disease. Comput. Methods Biomech. Biomed. Eng. Imaging Vis. 2024, 12, 2422408. [Google Scholar] [CrossRef]
- Armañanzas, R. Consensus Policies to Solve Bioinformatic Problems: Through Bayesian Network Classifiers and Estimation of Distribution Algorithms; LAP Lambert Academic Publishing: Saarbrücken, Germany, 2012. [Google Scholar]
- Aldossary, Y.; Ebrahim, M.; Hewahi, N. A comparative study of heart disease prediction using tree-based ensemble classification techniques. In Proceedings of the 2022 International Conference on Data Analytics for Business and Industry (ICDABI), Sakhir, Bahrain, 25–26 October 2022; IEEE: New York, NY, USA, 2022; pp. 353–357. [Google Scholar] [CrossRef]
- Kerexeta, J.; Larburu, N.; Escolar, V.; Lozano-Bahamonde, A.; Macía, I.; Beristain Iraola, A.; Graña, M. Prediction and Analysis of Heart Failure Decompensation Events Based on Telemonitored Data and Artificial Intelligence Methods. J. Cardiovasc. Dev. Dis. 2023, 10, 48. [Google Scholar] [CrossRef]
- Mavrogiorgou, A.; Kiourtis, A.; Kleftakis, S.; Mavrogiorgos, K.; Zafeiropoulos, N.; Kyriazis, D. A Catalogue of Machine Learning Algorithms for Healthcare Risk Predictions. Sensors 2022, 22, 8615. [Google Scholar] [CrossRef]
- Ali, L.; Niamat, A.; Khan, J.A.; Golilarz, N.A.; Xingzhong, X.; Noor, A.; Nour, R.; Bukhari, S.A.C. An optimized stacked support vector machines–based expert system for the effective prediction of heart failure. IEEE Access 2019, 7, 54007–54014. [Google Scholar] [CrossRef]
- Omotehinwa, T.O.; Oyewola, D.O.; Moung, E.G. Optimizing the light gradient-boosting machine algorithm for an efficient early detection of coronary heart disease. Inform. Health 2024, 1, 70–81. [Google Scholar] [CrossRef]
- Ahmed, F.; Saleem, M.; Noor, A. Intelligent Heart Disease Prediction Using CatBoost Empowered with XAI. Int. J. Comput. Innov. Sci. 2023, 2, 8–13. [Google Scholar]
- Mahesh, T.R.; Dhilip Kumar, V.; Vinoth Kumar, V.; Asghar, J.; Geman, O.; Arulkumaran, G.; Arun, N. AdaBoost Ensemble Methods Using K-Fold Cross Validation for Survivability with the Early Detection of Heart Disease. Comput. Intell. Neurosci. 2022, 2022, 9005278. [Google Scholar] [CrossRef]
- Sumwiza, K.; Twizere, C.; Rushingabigwi, G.; Bakunzibake, P.; Bamurigire, P. Enhanced cardiovascular disease prediction model using random forest algorithm. Inform. Med. Unlocked 2023, 41, 101316. [Google Scholar] [CrossRef]
- Angelillo, M.T.; Balducci, F.; Impedovo, D.; Pirlo, G.; Vessio, G. Attentional pattern classification for automatic dementia detection. IEEE Access 2019, 7, 57706–57716. [Google Scholar] [CrossRef]
- Guidi, G.; Pettenati, M.C.; Melillo, P.; Iadanza, E. A machine learning system to improve heart failure patient assistance. IEEE J. Biomed. Health Inform. 2014, 18, 1750–1756. [Google Scholar] [CrossRef]
- Drvenica, I.T.; Stančić, A.Z.; Maslovarić, I.S.; Trivanović, D.I.; Ilić, V.L. Extracellular Hemoglobin: Modulation of Cellular Functions and Pathophysiological Effects. Biomolecules 2022, 12, 1708. [Google Scholar] [CrossRef]
- Zhong, X.; Na, Y.; Yin, S.; Yan, C.; Gu, J.; Zhang, N.; Geng, F. Cell Membrane Biomimetic Nanoparticles with Potential in Treatment of Alzheimer’s Disease. Molecules 2023, 28, 2336. [Google Scholar] [CrossRef]
- Li, X.; Tan, C.; Zhang, W.; Zhou, J.; Wang, Z.; Wang, S.; Wang, J.; Wei, L. Correlation Between Platelet and Hemoglobin Levels and Pathological Characteristics and Prognosis of Early-Stage Squamous Cervical Carcinoma. Med. Sci. Monit. Int. Med. J. Exp. Clin. Res. 2015, 21, 3921–3928. [Google Scholar] [CrossRef] [PubMed]
- Dos Santos, G.A.A.; Pardi, P.C. Biomarkers in Alzheimer’s disease: Evaluation of platelets, hemoglobin and vitamin B12. Dement. Neuropsychol. 2020, 14, 35–40. [Google Scholar] [CrossRef] [PubMed]
- Murdaca, G.; Banchero, S.; Casciaro, M.; Tonacci, A.; Billeci, L.; Nencioni, A.; Pioggia, G.; Genovese, S.; Monacelli, F.; Gangemi, S. Potential Predictors for Cognitive Decline in Vascular Dementia: A Machine Learning Analysis. Processes 2022, 10, 2088. [Google Scholar] [CrossRef]
- Rustam, F.; Aslam, N.; De La Torre Díez, I.; Khan, Y.D.; Mazón, J.L.V.; Rodríguez, C.L.; Ashraf, I. White Blood Cell Classification Using Texture and RGB Features of Oversampled Microscopic Images. Healthcare 2022, 10, 2230. [Google Scholar] [CrossRef]
- Yilmaz, M.; Tenekecioglu, E.; Arslan, B.; Bekler, A.; Ozluk, O.A.; Karaagac, K.; Agca, F.V.; Peker, T.; Akgumus, A. White Blood Cell Subtypes and Neutrophil-Lymphocyte Ratio in Prediction of Coronary Thrombus Formation in Non-ST-Segment Elevated Acute Coronary Syndrome. Clin. Appl. Thromb. /Hemost. Off. J. Int. Acad. Clin. Appl. Thromb./Hemost. 2015, 21, 446–452. [Google Scholar] [CrossRef]
- Cisternas, P.; Lindsay, C.B.; Salazar, P.; Silva-Alvarez, C.; Retamales, R.M.; Serrano, F.G.; Vio, C.P.; Inestrosa, N.C. The increased potassium intake improves cognitive performance and attenuates histopathological markers in a model of Alzheimer’s disease. Biochim. Biophys. Acta 2015, 1852, 2630–2644. [Google Scholar] [CrossRef]
- Wallig, M.A.; Haschek, W.M.; Rousseaux, C.G.; Bolon, B.; Mahler, B.W. (Eds.) Fundamentals of Toxicologic Pathology, 3rd ed.; Academic Press: Cambridge, MA, USA, 2018. [Google Scholar] [CrossRef]
- Deeks, A.; Lombard, C.; Michelmore, J.; Teede, H. The effects of gender and age on health related behaviors. BMC Public Health 2009, 9, 213. [Google Scholar] [CrossRef]
- Schäfer, I.; Hansen, H.; Schön, G.; Höfels, S.; Altiner, A.; Dahlhaus, A.; Gensichen, J.; Riedel-Heller, S.; Weyerer, S.; Blank, W.A.; et al. The influence of age, gender and socio-economic status on multimorbidity patterns in primary care. First results from the multicare cohort study. BMC Health Serv. Res. 2012, 12, 89. [Google Scholar] [CrossRef]
- Shen, F.X.; Wolf, S.M.; Bhavnani, S.; Deoni, S.; Elison, J.T.; Fair, D.; Garwood, M.; Gee, M.S.; Geethanath, S.; Kay, K.; et al. Emerging ethical issues raised by highly portable MRI research in remote and resource-limited international settings. NeuroImage 2021, 238, 118210. [Google Scholar] [CrossRef]
- Dairi, A.; Harrou, F.; Sun, Y. Deep generative learning-based 1-SVM detectors for unsupervised COVID-19 infection detection using blood tests. IEEE Trans. Instrum. Meas. 2022, 71, 1–11. [Google Scholar] [CrossRef]
- Yang, H.; Chen, Z.; Yang, H.; Tian, M. Predicting coronary heart disease using an improved LightGBM model: Performance analysis and comparison. IEEE Access 2023, 11, 23366–23380. [Google Scholar] [CrossRef]
- Theerthagiri, P. Predictive analysis of cardiovascular disease using gradient boosting based learning and recursive feature elimination technique. Intell. Syst. Appl. 2022, 16, 200121. [Google Scholar] [CrossRef]
- Budholiya, K.; Shrivastava, S.K.; Sharma, V. An optimized XGBoost based diagnostic system for effective prediction of heart disease. J. King Saud. Univ.–Comput. Inf. Sci. 2022, 34, 4514–4523. [Google Scholar] [CrossRef]
- Guo, X.; Hao, P. Using a Random Forest Model to Predict the Location of Potential Damage on Asphalt Pavement. Appl. Sci. 2021, 11, 10396. [Google Scholar] [CrossRef]
- Purwanto, A.D.; Wikantika, K.; Deliar, A.; Darmawan, S. Decision Tree and Random Forest Classification Algorithms for Mangrove Forest Mapping in Sembilang National Park, Indonesia. Remote Sens. 2023, 15, 16. [Google Scholar] [CrossRef]
- Geurts, P.; Ernst, D.; Wehenkel, L. Extremely randomized trees. Mach. Learn. 2006, 63, 3–42. [Google Scholar] [CrossRef]
- Chaiyo, Y.; Rueangsirarak, W.; Hristov, G.; Temdee, P. Improving Early Detection of Dementia: Extra Trees-Based Classification Model Using Inter-Relation-Based Features and K-Means Synthetic Minority Oversampling Technique. Big Data Cogn. Comput. 2025, 9, 148. [Google Scholar] [CrossRef]
- Phanbua, P.; Arwatchananukul, S.; Temdee, P. Classification model of dementia and heart failure in older adults using Extra Trees and oversampling-based technique. In Proceedings of the 2025 Joint International Conference on Digital Arts, Media and Technology with ECTI Northern Section Conference on Electrical, Electronics, Computer and Telecommunications Engineering (ECTI DAMT & NCON), Nan, Thailand, 29 January–1 February 2025; IEEE: New York, NY, USA, 2025; pp. 322–327. [Google Scholar] [CrossRef]
- Yongcharoenchaiyasit, K.; Arwatchananukul, S.; Temdee, P.; Prasad, R. Gradient boosting–based model for elderly heart failure, aortic stenosis, and dementia classification. IEEE Access 2023, 11, 48677–48696. [Google Scholar] [CrossRef]
- Yongcharoenchaiyasit, K.; Arwatchananukul, S.; Hristov, G.; Temdee, P. Enhanced Multi-Model Machine Learning-Based Dementia Detection Using a Data Enrichment Framework: Leveraging the Blessing of Dimensionality. Bioengineering 2025, 12, 592. [Google Scholar] [CrossRef]
- Blagus, R.; Lusa, L. SMOTE for high-dimensional class-imbalanced data. BMC Bioinform. 2013, 14, 106. [Google Scholar] [CrossRef]
- Ferdib-Al-Islam Sanim, M.S.; Islam, M.R.; Rahman, S.; Afzal, R.; Hasan, K.M. Prediction of dementia using SMOTE-based oversampling and stacking classifier. In Hybrid Intelligent Systems; Springer Nature: Cham, Switzerland, 2023; pp. 441–452. [Google Scholar] [CrossRef]
- Ishaq, A.; Sadiq, S.; Umer, M.; Ullah, S.; Mirjalili, S.; Rupapara, V.; Nappi, M. Improving the prediction of heart failure patients’ survival using SMOTE and effective data mining techniques. IEEE Access 2021, 9, 39707–39716. [Google Scholar] [CrossRef]
- Oyama, K.; Isogai, T.; Nakayama, Y.; Kobayashi, R.; Kitano, D.; Sakatani, K.; Karako, K. Enhancing dementia risk screening with CTGAN-synthesized periodontal examination and general blood test data. In Proceedings of the 2024 IEEE International Conference on Digital Health (ICDH), Shenzhen, China, 7–13 July 2024; IEEE: New York, NY, USA, 2024; pp. 76–78. [Google Scholar] [CrossRef]
- Abd-Alhussain, R.S.; Obayes, H.K.; Al-Shareefi, F. Utilizing Synthetic Tabular Data Method to Improve Heart Attack Prediction Accuracy. Al-Salam J. Eng. Technol. 2023, 3, 11–22. [Google Scholar] [CrossRef]
- Rácz, A.; Bajusz, D.; Héberger, K. Effect of Dataset Size and Train/Test Split Ratios in QSAR/QSPR Multiclass Classification. Molecules 2021, 26, 1111. [Google Scholar] [CrossRef]
- Ghanem, M.; Ghaith, A.K.; El-Hajj, V.G.; Bhandarkar, A.; de Giorgio, A.; Elmi-Terander, A.; Bydon, M. Limitations in Evaluating Machine Learning Models for Imbalanced Binary Outcome Classification in Spine Surgery: A Systematic Review. Brain Sci. 2023, 13, 1723. [Google Scholar] [CrossRef]
- Gómez Penedo, J.M.; Flückiger, C. How to interpret correlational process-outcome effect sizes in psychotherapy: A meta-analytic benchmark study. Psychother. Res. 2025, 1–11. [Google Scholar] [CrossRef]
Disclaimer/Publisher’s Note: The statements, opinions and data contained in all publications are solely those of the individual author(s) and contributor(s) and not of MDPI and/or the editor(s). MDPI and/or the editor(s) disclaim responsibility for any injury to people or property resulting from any ideas, methods, instructions or products referred to in the content. |
© 2025 by the authors. Licensee MDPI, Basel, Switzerland. This article is an open access article distributed under the terms and conditions of the Creative Commons Attribution (CC BY) license (https://creativecommons.org/licenses/by/4.0/).