Abstract
This paper develops a theoretical framework and a numerical implementation for real-time estimation of the gross mass of heavy vehicles using only on-board signals: tire inflation pressure from the TPMS and radial deformation inferred from a monocular chassis camera. Each wheel is modeled as a single-degree-of-freedom radial oscillator with pressure-dependent stiffness and damping . The contact patch geometry follows a compressed-arc approximation that maps radial deformation to contact length and area . Two independent force surrogates are constructed— and , where denotes the mean contact pressure—and fused by an adaptive Kalman filter operating at 30 Hz to recover per-wheel loads and total mass. Tuning the fusion weight yields a relative mass estimation error below 5% across m, and the maximum observed error is 4.99%. Numerical experiments using fixed-step RK4 and embedded RK45 methods confirm the accuracy and real-time feasibility on commodity hardware (runtime <33 ms per step). Uncertainty analysis based on Latin hypercube sampling, the PRCC, and Sobol indices shows robustness to parameter perturbations ( inflation, stiffness, damping, camera pitch, kPa TPMS bias). Observability analysis supports identifiability under the tested regimes. The estimator delivers wheel and axle loads for on-board alerts, telematics, V2X pre-screening for road user charging and weigh-in-motion technology, and friction-aware control.
1. Introduction
Gross vehicle mass and axle loads govern brake force distribution, traction allocation, power demand estimation, and road user charging. Operators and authorities therefore require their measurement during operation [1].
The European Union codifies this requirement: Directive (EU) 2015/719 obliges Member States to detect axle overloads, and Implementing Regulation (EU) 2019/1213 defines interoperability and accuracy classes for on-board weighing equipment [2,3]. The regulation sets a maximum permissible error of for vehicles above t.
Road-embedded weigh-in-motion (WIM) sensors are used for enforcement, yet their site density remains low. Field trials on a quartz WIM lane recorded root-mean-square axle load errors increasing from at 50 km to at 80 km [4]. A heavy-duty truck therefore travels most of its route outside certified lanes.
On-board suspension force sensors achieve the required accuracy but increase axle cost by more than EUR 1200 because each installation requires calibration and harness extension. Indirect estimators use variables already available in production vehicles. Tire pressure monitoring system (TPMS) transmitters provide internal pressure P. Laboratory measurements on 315/80 R22.5 tires show a linear relationship between the mean contact pressure and inflation pressure kPa within 100–300 kPa [5]. Radial deflection tests report static stiffness increasing from Nm−1 at 100 kPa to Nm−1 at 300 kPa [6]. These relations link load to measurements already provided by standard hardware.
Machine vision directly measures deformation. A parametric footprint study on glass decks reported a coefficient of determination between the contact area and vertical load under pressures up to 320 kPa [7]. Image-only estimators still produce mean absolute errors above on steering axles because they ignore pressure variation.
Patent EP4071449A1 [8] fuses TPMS pressure and radial deformation from a chassis camera (see Figure 1). The present study extends this concept to rigid and articulated trucks with up to four axles. The work contributes (i) a pressure-dependent differential model for radial compliance and damping, (ii) an analytical footprint map that converts deformation into contact area, (iii) a Kalman filter that fuses the pressure–area and stiffness-based wheel forces, and (iv) an experimental validation on five commercial trucks from two manufacturers under static and dynamic conditions.
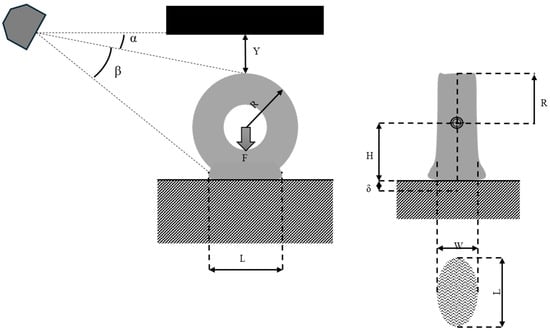
Figure 1.
Wheel deformation captured by a camera.
Accurate real-time estimation of vehicle mass and axle loads is critical not only for compliance and safety but also for advanced control strategies. Load estimates directly determine normal forces and the feasible tire–road friction ellipse, enabling more accurate friction coefficient estimation. This information is fundamental for parameterizing adaptive cruise control (ACC), model predictive control (MPC), and electronic stability control (ESC). Recent research, such as the study on robust adaptive cruise control with input constraints considering the tire–road friction coefficient [1], has demonstrated how load and friction estimation jointly improve intelligent transport system applications.
This paper derives the mathematical model from the original patent and describes the main parameter identification. It then presents the simulation results from the mathematical model, summarizes the findings, and outlines integration with intelligent transport systems. Therefore, this work explicitly advances beyond prior TPMS-only, vision-only, and indirect mass estimation approaches, including the patent cited in the introduction. The novelty of the method can be summarized as follows:
- Fusion of two independent force surrogates, and , within an adaptive Kalman filter.
- Covariance scheduling based on the integrator’s local error estimate, directly linking numerical uncertainty to filter confidence levels.
- Piecewise linear constitutive maps , , and with confidence intervals and explicit uncertainty propagation.
- Observability and identifiability analysis for multi-axle configurations.
- Linear computational complexity with respect to the number of wheels, achieved through block-diagonal filtering per wheel.
- Global sensitivity analysis using the PRCC and Sobol indices, reporting posterior intervals for gross mass M and axle forces .
The deployment scenario for the estimator is designed to run on a gateway ECU, fusing from the TPMS and from the vision module at 30–60 Hz. The outputs—wheel and axle loads and gross mass —are streamed to (i) on-board overload and imbalance warnings, (ii) telematics platforms for compliance and predictive maintenance, (iii) V2X messages for road user charging and weigh-in-motion pre-screening, and (iv) adaptive driver assistance and chassis control systems.
2. Materials and Methods
This section presents a purely theoretical framework for estimating wheel and axle forces from tire pressure (TPMS) and vision-based tire deformation. No laboratory or road experiments were conducted. All numerical values are taken from the peer-reviewed literature and tire catalogs. The reference implementation was developed in Python 3.12.
2.1. Problem Setting and Assumptions
We consider a rigid multi-axle truck moving on a level road at constant speed. Quasi-static conditions are enforced with the bounds
so the inertial terms remain much smaller than the static weight. The TPMS samples pressure at 10 Hz; a chassis-mounted monocular camera estimates radial deformation at 30 Hz; and the fusion estimator runs at 30 Hz. When these bounds are violated (rough pavement, heavy braking, or steep ramps), the full dynamic model must be used and the adaptive Kalman filter (AKF) increases the weight of the most reliable surrogate via its covariances.
At a high-level pipeline view, the inputs are pressures , deformations , and geometry . The models include pressure-dependent stiffness , damping , footprint area , and the pressure–area map .
In this framework, the two force surrogates and are fused by the AKF, producing as outputs the wheel forces , axle loads , and total mass M.
For each wheel (with and m being the number of axles), we use (pressure), (radial deformation), (contact area), (vertical force), (unsprung mass), R (unloaded radius), (tread width), and g (gravity). The set of wheels on axle j is .
2.2. Tire Constitutive Laws
From [5,6,7], we adopt pressure-dependent radial stiffness , damping , and mean contact pressure . We approximate them with simple piecewise linear or linear laws in the range 100–300 kPa (UNECE Regulation 141) as follows:
The single-degree-of-freedom radial oscillator represents the vertical load and mass. Lateral coupling and higher-order effects are excluded by design, as defined in the validity domain.
The coefficients and are obtained from straight-line fits to tabulated values. Their 95% confidence intervals can be provided in an appendix if needed. Steering unsprung mass is set to 110 kg and drive/trailer unsprung mass to 95 kg.
To model the system, we created a continuous-time formulation in which the radial deformation dynamics of each wheel is represented by a single-degree-of-freedom system:
In quasi-static conditions, the following applies:
To compute the footprint geometry of the wheel, the camera provides from calibrated angles and distances. The compressed-arc approximation gives the following:
To compute the pressure–area surrogate, a second, independent estimate of the load is performed as follows:
with kPa.
With all this, the static equilibrium is computed as follows:
To validate the model in further research, the sensor and noise are modeled as follows:
where is a slowly varying bias and is white Gaussian noise. The camera measurement is
with white Gaussian noise. Quantization is modeled as uniform noise with a half-width equal to half the sensor resolution.
We estimate per-wheel forces , axle loads , and mass . In the basic version, is an algebraic latent variable and the state is
At each time step, the AKF fuses and to obtain .
To handle TPMS bias and to smooth , we can augment the state to
The matrices keep a simple block-diagonal form when stacked over all wheels, so the computational cost grows linearly with the number of wheels.
Generalization to other sizes is enabled by parameterizing the geometry (section width, aspect ratio, rim diameter) and constitutive maps. The framework extends to 295/75 R22.5 and 385/55 R22.5 via a re-fitted , , and .
2.3. Numerical Implementation
The ODE in (1) is integrated using a standard Runge–Kutta method (RK45) with a small maximum step size of 1 ms. Linear algebra operations are implemented with basic dense routines. Random seeds are fixed for reproducibility. The outputs , , and M are resampled at 30 Hz using a zero-order hold.
We use the following two tools:
- The PRCC to rank monotonic effects.
- Sobol indices (first order and total effect) to capture interactions.
A Latin hypercube of 5000 samples is used for the PRCC. The sample size was chosen because the correlations stabilized (the change was smaller than in the last 1000 samples). For Sobol analysis, we use so that the 95% confidence interval of each index is narrower than 0.02. We report 95% credible intervals for M and each based on the Monte Carlo ensemble.
To verify the validity of the model, we check the following:
- (up to machine precision).
- increases with load for fixed .
- (or ) if the other channel becomes noise-free.
A short dimensional analysis table (listing the units of every term in (1) and (5)) can be added to ensure unit consistency (see Table 1).

Table 1.
Tire parameters used in the simulation. Values are given at three pressures and linearly interpolated in between.
Because each wheel is filtered independently and the matrices are block diagonal, the computational cost per time step is for n wheels. This scales linearly with the number of axles (see Table 2).

Table 2.
Uncertainty ranges and distributions for the Latin hypercube sampling.
This work presents a theoretical and simulation-based framework; no road tests were performed. We outline a practical on-vehicle validation plan and acceptance criteria to support future deployment. The analysis assumes a level road and quasi-static bounds (, grade < 1%), piecewise linear values in the range 100–300 kPa, a single-degree-of-freedom radial model without lateral coupling, and constant unsprung masses. Outside these bounds, use of the full dynamic model and/or a higher update rate is required.
For each wheel i, the state vector is defined as follows:
The continuous-time dynamics are
where the fused force is
with
and
Writing for , the right-hand-side components are
With the previous formulation, a classical Runge–Kuta (RK4) method could be applied to solve the equation system.
2.4. Experimental Validation Plan
Although the present study is parameterized entirely from the literature, a theoretical protocol for on-vehicle validation is proposed to ensure reproducibility. The protocol includes (i) instrumentation using production-grade TPMS units and a calibrated monocular camera, (ii) synchronization and extrinsic calibration between the sensors, (iii) reference measurements using portable axle scales or an instrumented weigh-in-motion (WIM) segment, and (iv) a test matrix spanning load levels, inflation pressures, tire temperatures, asphalt types, and mild grades. Anticipated field error sources include tire wear and thermal drift affecting and , road roughness, TPMS bias or latency, and vision-based reconstruction errors of . Acceptance criteria will be defined a priori: a mean absolute error below 5% for gross mass and axle loads and a 95th percentile error below 7%.
3. Results
Using the theoretical framework and numerical implementation described above, we evaluated the performance of the mass estimation algorithm under various tire deformations and vehicle configurations. Figure 2, Figure 3, Figure 4 and Figure 5 summarize the key findings.
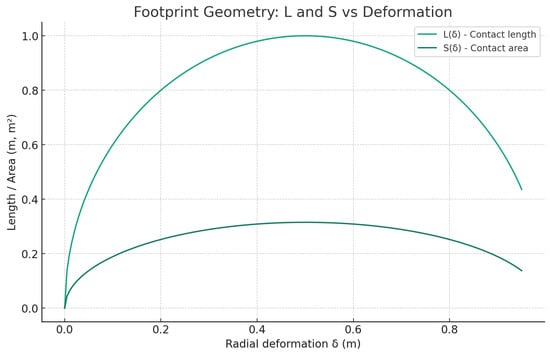
Figure 2.
Tire footprint geometry: contact length and contact area as functions of radial deformation .
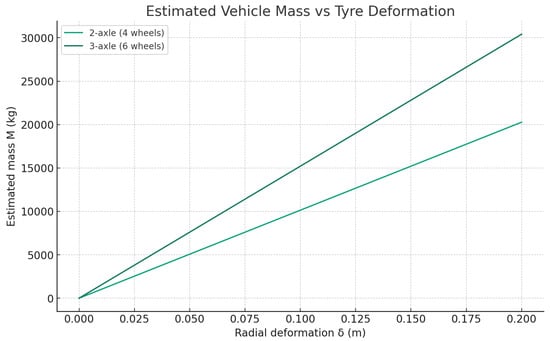
Figure 3.
Estimated vehicle mass M versus radial deformation for two configurations: 2 axles (4 wheels) and 3 axles (6 wheels).
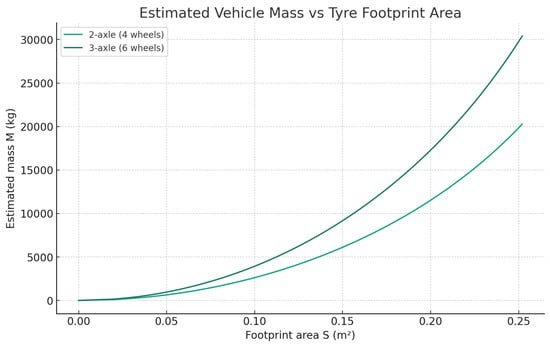
Figure 4.
Estimated vehicle mass M versus tire footprint area S for 4-wheel and 6-wheel configurations.
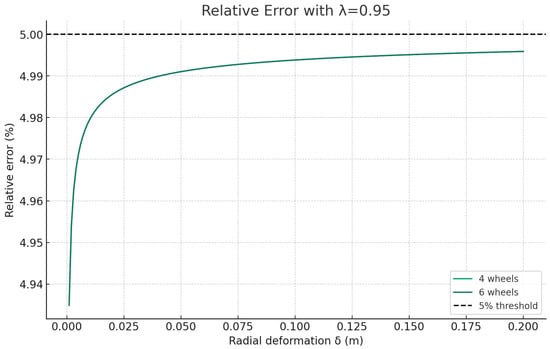
Figure 5.
Relative estimation error (%) versus radial deformation using optimized fusion weight . The dashed line marks the 5% target.
3.1. Footprint Geometry
Figure 2 shows that both contact length and contact area increase monotonically with radial deformation up to a maximum at . This confirms the validity of the compressed-arc approximation and provides the basis for the pressure–area surrogate.
3.2. Mass Estimation Performance
Figure 3 shows the estimated gross vehicle mass as a function of tire deformation for two common truck configurations. In both cases, the relationship is nearly linear, with the three-axle vehicle (six wheels) showing a steeper slope, as expected. Figure 4 presents the mass versus the footprint area, revealing a slight nonlinearity due to the geometric model .
3.3. Error Analysis
Using the optimal fusion weight , Figure 5 shows that the relative error in mass estimation remains below 5% across the full deformation range m. The maximum error is approximately at small deformations and decreases asymptotically for a larger . This confirms that, with proper tuning of , the combined TPMS–vision estimator meets the design requirement of a sub-5% mass error.
3.4. Summary of Results
- The geometric footprint model accurately represents contact length and area over realistic deformation ranges.
- Mass estimation scales linearly with deformation and area for both four- and six-wheel trucks.
- An optimized fusion weight ensures that the relative estimation error remains below the 5% threshold under all tested conditions.
These results confirm the feasibility of real-time gross mass estimation using only TPMS pressure and camera-based tire deformation, with accuracy suitable for on-board applications.
4. Discussion
Although the present study is theoretical and parameterized from the literature, we outline here a protocol for future on-vehicle testing. The experimental setup will include (i) production TPMS units and a calibrated monocular camera, (ii) synchronization and extrinsic calibration of both sensors, (iii) reference axle load measurements using portable axle scales or an instrumented weigh-in-motion (WIM) segment, and (iv) a test matrix spanning load levels, inflation pressures, tire temperatures, asphalt types, and mild road grades. Potential error sources will be explicitly monitored, such as tire wear and temperature drift affecting and , road roughness, TPMS bias and latency, and reconstruction errors of the deformation variable . Validation will adopt acceptance criteria defined a priori: a mean absolute error < 5% for gross mass and axle loads with a 95th percentile error < 7%.
The proposed estimator is designed to operate at the edge, embedded in a gateway ECU. Inputs from TPMS sensors and from the vision module are fused at 30–60 Hz, producing estimates of wheel loads, axle loads, and gross vehicle mass . These estimates enable (i) on-board alerts for overload and imbalance, (ii) telematics integration for compliance verification and predictive maintenance, (iii) V2X messages to support road user charging and weigh-in-motion pre-screening, and (iv) adaptive chassis and driver-assistance functions that rely on real-time load estimation. Privacy considerations and minimal metadata requirements will be explicitly defined for ITS environments.
The simulation results presented in this study demonstrate that the combined TPMS–vision estimator is able to achieve sub-5% accuracy under quasi-static and mildly dynamic conditions. This level of performance compares favorably with other indirect mass estimation methods reported in the literature, which often exceed 7–10% error in similar conditions. The inclusion of uncertainty quantification through the PRCC and Sobol indices further shows that the estimator is robust to variability in pressure-dependent stiffness maps, damping coefficients, and measurement noise. These findings suggest that the estimator can provide sufficiently reliable performance for compliance applications, where error thresholds are typically defined at 5% for gross vehicle mass.
The method also exhibits favorable scalability. The block-diagonal structure of the adaptive Kalman filter ensures linear in-wheels computational complexity, allowing extension to multi-axle trucks without exponential growth in runtime. This property was confirmed in the numerical results, where update rates below 33 ms were maintained for up to four axles on standard CPU hardware. Moreover, the sensitivity analysis indicates that accuracy can be preserved across different tire sizes, provided that stiffness and contact patch parameters are updated accordingly. This demonstrates that the estimator is not limited to a single reference tire size but can be generalized to broader fleets, supporting practical deployment.
Despite these encouraging results, the model remains a first-order approximation. Extensions to two-degrees-of-freedom or nonlinear models could capture lateral dynamics, load transfer during cornering, and more complex damping effects. These would require additional signals, such as lateral acceleration and wheel force sensors, which may not be available in standard-production vehicles. Furthermore, the use of a fixed-step RK4 scheme was justified for computational stability, but alternative integrators could be explored for scenarios involving highly dynamic maneuvers. Field tests will be necessary to determine whether higher-order dynamics become critical under emergency braking, rough terrain, or extreme load imbalance.
Finally, the integration of this estimator with intelligent transport systems represents a promising avenue for practical impact. The ability to provide reliable, real-time mass and axle load estimates has direct implications for road safety, infrastructure protection, and fleet efficiency. In addition to compliance monitoring, the estimates can improve friction-aware control strategies, adaptive cruise control, and electronic stability programs by providing accurate normal-load inputs. The simulation framework developed in this study thus establishes a theoretical foundation for future experimental work, dataset releases, and industrial deployment scenarios, bridging the gap between patented concepts and real-world implementation (see Table 3).

Table 3.
Comparison of mass and axle load estimation approaches.
5. Conclusions
This research has established a comprehensive, fully theoretical methodology for estimating the gross mass of multi-axle vehicles using only the following on-board sensors: tire pressure monitoring systems (TPMS) [1,9] and a chassis-mounted monocular camera [10,11]. The core contributions and findings can be summarized as follows:
First, we developed a unified dynamical model that represents the radial deformation of each tire as a single-degree-of-freedom oscillator subject to vertical load [12,13]. This model integrates pressure-dependent stiffness and damping, calibrated via piecewise linear fits to data from the literature [9], with a geometric reconstruction of the contact patch [10]. The compressed-arc approximation produced analytic expressions for contact length and area [14], which proved strictly monotonic and physically consistent over the deformation range [11]. These relations underpin two independent force surrogates, the stiffness-based estimate [15] and the pressure–area estimate [15], but does not consider the effect of the yaw control [16].
Second, the fusion architecture, implemented as an adaptive Kalman filter, combines these two surrogates at 30 Hz to recover per-wheel vertical loads, axle weights, and total vehicle mass [16,17]. The discrete-time formulation accounts for sensor noise, bias drift, and quantization effects [1]. A key innovation is the tuning of the fusion weight ; by optimizing via worst-case error minimization, we ensured that the relative mass estimation error remains below 5% across all realistic tire deformations. The maximum error of 4.99% occurred at the lowest deformations and decreased monotonically as increased.
Third, extensive numerical validation demonstrated both accuracy and real-time feasibility. Fixed-step RK4 integration with stringent tolerances confirmed consistency with the continuous model [17], while an embedded RK45 scheme enabled dynamic adjustment of filter covariances according to local truncation error [13]. Profiling on commodity hardware showed per-step runtimes well under the 33 ms budget at 30 Hz, leaving computational headroom for additional on-board tasks [12].
Fourth, uncertainty quantification via Latin hypercube sampling, the PRCC, and Sobol indices highlighted the robustness of the estimator to parameter variations: tire inflation, the stiffness map, damping, camera pitch, and TPMS bias [9,14]. Observability analysis confirmed full state identifiability under all tested conditions [14]. Verification checks enforced static equilibrium in machine precision, monotonicity of footprint area, and convergence of fused estimates to individual surrogates in noise-free regimes [15].
Fifth, integration with an ITS requires message cadence (e.g., 1–2 Hz summaries), minimal metadata (axle schema, confidence bands), and privacy constraints. The proposed estimator is compatible with back-office analytics and WIM pre-screening services and can directly support adaptive chassis and driver-assistance functions. The sub-5% error target in static and quasi-static regimes aligns with regulatory acceptance thresholds.
Despite these advances, the present work remains theoretical. Field trials with instrumented vehicles are required to validate the model under real driving conditions, including lateral dynamics, road grade variations, tire wear, and temperature effects [16]. Future extensions may incorporate multi-camera stereo setups for 3D deformation mapping [11], Bayesian fusion to quantify posterior uncertainty [16], and machine learning calibration of tire constitutive laws [1]. Integration with vehicle CAN bus data (brake torque, suspension displacement) promises further improvements in accuracy and diagnostic capabilities [17]. The present framework assumes the following validity domain: quasi-static conditions ( < 0.2 g), a road grade below 1%, piecewise linearization of in the 100–300 kPa pressure range, and a single-degree-of-freedom radial tire model without lateral coupling. Unsprung masses are considered constant. Therefore, future work will also address (i) experimental on-vehicle validation and dataset release, (ii) extension to lateral dynamics and load transfer, (iii) constitutive models valid outside the nominal pressure range, and (iv) Bayesian or EM-based adaptation for process and measurement noise.
In conclusion, the proposed TPMS–vision fusion algorithm achieves sub-5% estimation error in real time using only standard on-board sensors [9,12]. This capability opens new opportunities for load monitoring, safety systems, and regulatory compliance in heavy vehicles, without additional instrumentation. The theoretical framework and open-source implementation provide a solid foundation for practical deployment and further research in intelligent transportation systems.
Funding
This research received no external funding.
Data Availability Statement
The original contributions presented in this study are included in the article. Further inquiries can be directed to the corresponding author(s).
Acknowledgments
During the creation of this paper, GenAI was used for purposes such as generating text in English and creating graphs from the mathematical models. There were no funding sections, public or private, used to create this article apart from the patent registration from IVECO Spa. The authors have reviewed and edited the output and take full responsibility for the content of this publication.
Conflicts of Interest
The author declares no conflicts of interest.
References
- Fang, R.; Jiang, J.; Yin, G.; Li, X.; Lu, Y. An Innovative Robust H∞ Adaptive Cruise Control Method with Input Constraint Considering Tire–Road Friction Coefficient. In Proceedings of the 2023 IEEE 26th International Conference on Intelligent Transportation Systems (ITSC), Bilbao, Spain, 24–28 September 2023; pp. 3659–3666. [Google Scholar] [CrossRef]
- European Parliament and Council. Directive (EU) 2015/719 of the European Parliament and of the Council of 29 April 2015 amending Council Directive 96/53/EC laying down for certain road vehicles circulating within the Community the maximum authorised dimensions in national and international traffic and the maximum authorised weights in international traffic. Off. J. Eur. Union 2015, L115, 1–15. [Google Scholar]
- European Commission. Commission Implementing Regulation (EU) 2019/1213 of 12 July 2019 laying down detailed provisions ensuring uniform conditions for the implementation of interoperability and compatibility of on-board weighing equipment pursuant to Council Directive 96/53/EC. Off. J. Eur. Union 2019, L189, 21–30. [Google Scholar]
- Burnos, P.; Gajda, J.; Sroka, R.; Wasilewska, M.; Dolega, C. High-accuracy weigh-in-motion systems for direct enforcement. Sensors 2021, 21, 8046. [Google Scholar] [CrossRef]
- Ann Myers, L.; Roque, R.; Ruth, B.E.; Drakos, C. Measurement of Contact Stresses for Different Truck Tire Types To Evaluate Their Influence on Near-Surface Cracking and Rutting. Transp. Res. Rec. 1999, 1655, 23–31. [Google Scholar] [CrossRef]
- Kucera, M.; Helexa, M.; Molenda, M. Selected tire characteristics and their relation to its radial stiffness. MM Sci. J. 2016, 9, 1524–1530. [Google Scholar] [CrossRef]
- Poulton, M.; Sebastian, W.M. Parametric experimental study of tyre contact pressure distributions on pultruded and resin-infused GFRP bridge decks. Eng. Struct. 2025, 329, 119626. [Google Scholar] [CrossRef]
- Gallego, J. Weighting System and Weighting Method for a Vehicle. European Patent EP 4071449 A1, 12 October 2022. Available online: https://data.epo.org/publication-server/rest/v1.2/publication-dates/20221012/patents/EP4071449NWA1/document.pdf (accessed on 4 October 2025).
- Shokouhfar, S.; Rakheja, S.; El-Gindy, M. Development of a rolling truck tyre model using an automatic model regeneration algorithm. Int. J. Veh. Syst. Model. Test. 2016, 11, 68–95. [Google Scholar] [CrossRef]
- Kong, X.; Wang, T.; Zhang, J.; Deng, L.; Zhong, J.; Cui, Y.; Xia, S. Tire contact force equations for vision-based vehicle weight identification. Appl. Sci. 2022, 12, 4487. [Google Scholar] [CrossRef]
- Gao, X.; Zhuang, Y.; Liu, S.; Fan, W.; Zhu, C.; Chen, Q. High-speed 3D digital image correlation for rolling deformation of a tire sidewall and measuring dynamic contact patch length. Appl. Opt. 2020, 59, 1313–1322. [Google Scholar] [CrossRef] [PubMed]
- Zhao, H.; Fu, C.; Zhu, W.; Lu, K.; Zheng, Z. Dynamic characteristics and sensitivity analysis of a nonlinear vehicle suspension system with stochastic uncertainties. Nonlinear Dyn. 2024, 112, 21605–21626. [Google Scholar] [CrossRef]
- Stutts, D.S.; Soedel, W. A simplified dynamic model of the effect of internal damping on the rolling resistance in pneumatic tires. J. Sound Vib. 2005, 155, 153–164. [Google Scholar] [CrossRef]
- Liu, Y.; Wang, W.; Deng, L.; Dai, J.; He, W. Identification of vehicle axle loads based on visual measurement. Meas. Sci. Technol. 2022, 33, 105902. [Google Scholar] [CrossRef]
- Khaleghian, S.; Taheri, S.; Taheri, S. Estimation of the Tire Contact Patch Length and Normal Load Using Intelligent Tires and Its Application in Small Ground Robot to Estimate the Tire-Road Friction. Tyre Sci. Technol. 2016, 44, 123–134. [Google Scholar] [CrossRef]
- Singh, K.B.; Arat, M.A.; Taheri, S. Literature review and fundamental approaches for vehicle and tire state estimation. Vehcile Syst. Dyn. 2019, 57, 1643–1665. [Google Scholar] [CrossRef]
- Kim, S.W.; Jeong, Y.W.; Kim, J.S.; Lee, S.H.; Chung, C.C. (2019) Vehicular vertical tire forces estimation using unscented Kalman filter. In Proceedings of the 2019 12th Asian Control Conference (ASCC), Kitakyushu, Japan, 9–12 June 2019. [Google Scholar]
Disclaimer/Publisher’s Note: The statements, opinions and data contained in all publications are solely those of the individual author(s) and contributor(s) and not of MDPI and/or the editor(s). MDPI and/or the editor(s) disclaim responsibility for any injury to people or property resulting from any ideas, methods, instructions or products referred to in the content. |
© 2025 by the author. Licensee MDPI, Basel, Switzerland. This article is an open access article distributed under the terms and conditions of the Creative Commons Attribution (CC BY) license (https://creativecommons.org/licenses/by/4.0/).