Article

Experimental Study on Coefficient of Restitution of Small-Sized Spherical Particles during Low-Speed Impact

1
School of Optical-Electrical and Computer Engineering, University of Shanghai for Science and Technology, Shanghai 200093, China
2
School of Medical Instruments, Shanghai University of Medicine & Health Sciences, Shanghai 201318, China
*
Author to whom correspondence should be addressed.
Condens. Matter 2024, 9(1), 18; https://doi.org/10.3390/condmat9010018
Submission received: 2 January 2024 / Revised: 19 February 2024 / Accepted: 2 March 2024 / Published: 5 March 2024
(This article belongs to the Special Issue Progress in Granular Materials Research in the Asia-Pacific Region)

Abstract

:
This study presents experimental investigations on the normal restitution coefficients of a titanium bead (Ti), zirconia bead (ZrO2), and amorphous zirconium alloy sphere (Amor). The research explores the influence of particle diameter and collision velocity on the normal restitution coefficient between two independent, identical spherical particles of different materials. The experimental findings demonstrate that increasing the particle diameter results in more effective plastic deformation, leading to higher energy losses and, subsequently, smaller coefficients of restitution. Similarly, higher particle velocities cause more energy dissipation during collisions, resulting in smaller restitution coefficients. Comparing particles of different materials, those with larger yield strengths exhibit more elastic behavior, experience less initial energy loss due to deformation, and reach the maximum restitution coefficient (elastic state) with fewer collisions. This finding suggests that material properties significantly influence the overall energy dissipation and elastic response in the particles. To validate the experimental results, existing models are compared and discussed. Furthermore, potential physical mechanisms responsible for the observed behavior are explored, providing valuable insights into the collision dynamics in spherical particle interactions. Overall, this study contributes to a better understanding of the factors affecting the normal restitution coefficient in particle collisions, enabling the design and optimization of particle systems for diverse applications in condensed matter and related fields.

1. Introduction

The NCOR (Normal coefficient of restitution) is very important in the study of particulate matter because it is the basis of the dynamic theory, which is based on the Boltzmann equation [1], the particle fluid dynamics theory [2], and the efficient event-driven molecular dynamics of particulate matter [3,4,5]. In all theories relating to event-driven simulations and dynamics of non-viscous particulate matter, it is commonly assumed that the coefficient of restitution is a constant or simply a function used to monotonically decrease collision velocity through appropriate mathematical models [6,7,8]. However, a common feature in current theories regarding the coefficient of restitution is that they often overestimate its value by tens of percentage points compared with physical measurements [9]. An increasing number of studies have shown that the main reason for this is that the NCOR is not a simple material constant but is controlled by a variety of factors, and the influencing mechanism is complex [10]. Therefore, a comprehensive and accurate calculation model for reference does not currently exist. Considering the interaction between the influencing factors and the nonlinear relationship between some influencing factors and the NCOR, these uncertain relationships will exist even if ideal geometry is used in an experiment, which may lead to more uncertain conditions for naturally occurring particles [11]. The objective of this study was to obtain the NCOR of small-sized ( d < 3   m m ) beads used in a vibrating fluidized bed under low-speed collision conditions and to explore the possible physical mechanisms affecting the NCOR.
Regarding the impact of parameters such as collision frequency, particle size (R), initial velocity ( v 0 ), particle densities ( ρ ), Poisson’s ratio ( v ), Young’s modulus (E), yield pressure ( Y ), and stress and strain parameters ( σ = b ε n ) on the restitution coefficient, typically, relevant studies have separately investigated the effects in three types of collisions: normal impacts, oblique impacts, and repeated impacts. Cross et al. landed several types of balls vertically on a brass rod, obtained the velocity variation during the impact process, and presented the dynamic hysteresis curve during the low-speed impact condition [12]. Even at low impact speeds, the experimental spheres still produced local damage and plastic deformation, and similar results were obtained in Johnson’s study [9]. In addition, it was found that the energy loss of the spheroids in dynamic analysis was greater than that in static analysis. Stevens et al. [13] also studied the influence of impact velocity on the coefficient of restitution in the velocity range of 0.2   m / s 1.2   m / s . Bridges et al. [14] studied the effect of impact velocity on the coefficient of restitution in the very low velocity range of 0 to 0.01   m / s . It was established that both the coefficient of restitution and collision duration decreased with the increase in collision velocity. In another experiment [15], Minamoto et al. carried out a high-speed collision (up to the maximum 20   m / s ) between two steel balls using an air gun and verified the results using finite element analysis. It was found that, when the incident velocity increased, the collision restitution coefficient decreased. In collision experiments between steel balls and two types of aluminum rods, Seifried et al. [16] found that the restitution coefficient increased with the number of impacts until it reached a fixed value. This was due to the plastic deformation and the residual stress generated in the contact area. Ultimately, the plastic deformation did not expand, and all the energy loss was attributed to the wave propagation. In addition, Minamoto et al. [17] obtained similar results in the collision analysis of viscoplastic models in finite elements. Weir et al. [11] presented experimental data regarding the restitution coefficient between brass balls and brass plates at the collision velocity of 0.7   m / s . They concluded that, with balls of the same size, the restitution coefficient of ball–ball collision was about 19% smaller than that of ball–plate collision, and the restitution coefficient tended to become stable after 5 to 10 repeated collisions. Aryaei et al. [18] studied the dependence of the restitution coefficient on ball size when steel balls with diameters ranging from 6 mm to 12 mm were collided with steel plates and aluminum plates. Higa et al. [19] investigated the effect of particle size on the coefficient of restitution of a puck at speeds ranging from 0.1   m / s to 1.0   m / s . The experimental results showed that the coefficient of restitution (COR) value gradually decreased with the increase in the ball diameter. However, this result contradicts the theoretical expression derived by Stronge et al. [20], who suggested that sphere size has no effect on the restitution coefficient. Sandeep et al. [21] developed a micromechanical impact-loading device for the measurement of the coefficient of restitution and studied the coefficient of restitution (COR) and energy loss between various particles and base blocks. The device could test particles that were approximately 1–3 mm in diameter. The height of the drop could be adjusted to about 500 mm. In a study by Zhao et al. [22], improved particle-tracking velocimetry (IPTV) was used to measure collision behavior between irregular maltodextrin particles (with characteristic sizes of about 100 μm) and horizontal substrates. The measured data were compared with DEM simulation results using a multi-sphere model and a super quadratic model. The distribution of the total values of the normal restitution coefficients and their corresponding relationships with the absolute difference in rotational speed, incident angle, and rebound angle after collision were analyzed. Wang et al. [23] used the discrete element method (DEM) to simulate “particle–particle” collision between corn kernels, obtained the relationship between the input quantity and the energy COR, and verified it using the energy value data of corn kernels obtained in the experiment. The simulation results showed that the energy COR method was more accurate than the kinematic COR method, and the effects of impact velocity and impact angle on the high-energy COR were also studied. The COR is used in the analysis of many DEM models [24,25,26,27,28,29,30,31,32] that simulate particle flow. Li et al. [33] studied the influence of surface roughness on the COR through an impact experiment between particles and walls with different levels of roughness, and the results showed that the COR decreased with the increase in surface roughness.
Many previous experiments and famous contact theories have studied the influence of different factors on the COR, and most of them have focused on larger particles or the restitution coefficient between small particles and base blocks. However, most particle flows consist of collisions between particles with radii of 1 mm or less, which are smaller than those used in typical particle impact experiments. However, the literature on the restitution coefficient of small-sized “particle–particle” collision is not sufficient, and accurate numerical models for theoretical and numerical studies of collisions are not yet available. The main reason for this is that the COR of small-sized “particle–particle” collisions differs from that of large particles; it is measured using a simple pendulum system. The influence of the traction rope in the simple pendulum system on the measurement of the COR of small particles cannot be ignored. This means that it has become exponentially more difficult to create experimental designs to measure the COR of small “particle–particle” collisions. This is also the main reason why most studies regarding the COR choose to avoid using small particles. In short, in the study of particle gases and fluids, a large number of collisions occur between particles that are smaller than 1 mm. Therefore, the restitution coefficient obtained via collisions between particles and a flat plate may not be a good representation of the restitution coefficient during collisions between particles. Regarding the suspension method, although the restitution coefficient during a collision between two balls can be measured directly, due to the influence of the quality of the lanyard, a large error will be present when measuring the collision of smaller particles. Therefore, the current experiments only measure collisions between larger particles. Therefore, more systematic measurements and studies regarding the COR of small-sized “particle–particle” collisions and related influencing factors are needed to investigate the behavior of beads during vibrational fluidization. More experimental results relating to collisions between smaller particles are needed to support the few relevant studies that exist. In this study, the drop collision system was considered. This system can not only exclude the influence of the traction rope on the measurement of the coefficient of restitution, but it can also directly obtain the normal restitution coefficient of small particles without the need to calculate the normal component of the restitution coefficient obtained from an oblique collision. A limitation of the drop collision test is that it is not easy to make a small particle ( 1   m m d < 3   m m ) collide with another fixed small particle during free falling, and it is even more difficult to make them collide in the normal direction. To address this challenge, this study adopted the repeated collision method, in which the first collision can still fall vertically after bouncing, the second collision with the fixed particle is selected as the effective collision, and the normal collision is defined by this standard. In this method, a flexible material is used for the platform to release the free particles, m 2 , so as to ensure that the initial velocity of m 2 is zero and to improve the collision efficiency of the two particles. By fixing the other particle, m 1 , to ensure that it is always stationary ( v = 0 ) during the collision process, the absorption of collision energy by other media is avoided, the method of particle collision is simplified, the acquisition efficiency of the NCOR data is enhanced, and the accuracy of the NCOR is improved.

2. Materials and Methods
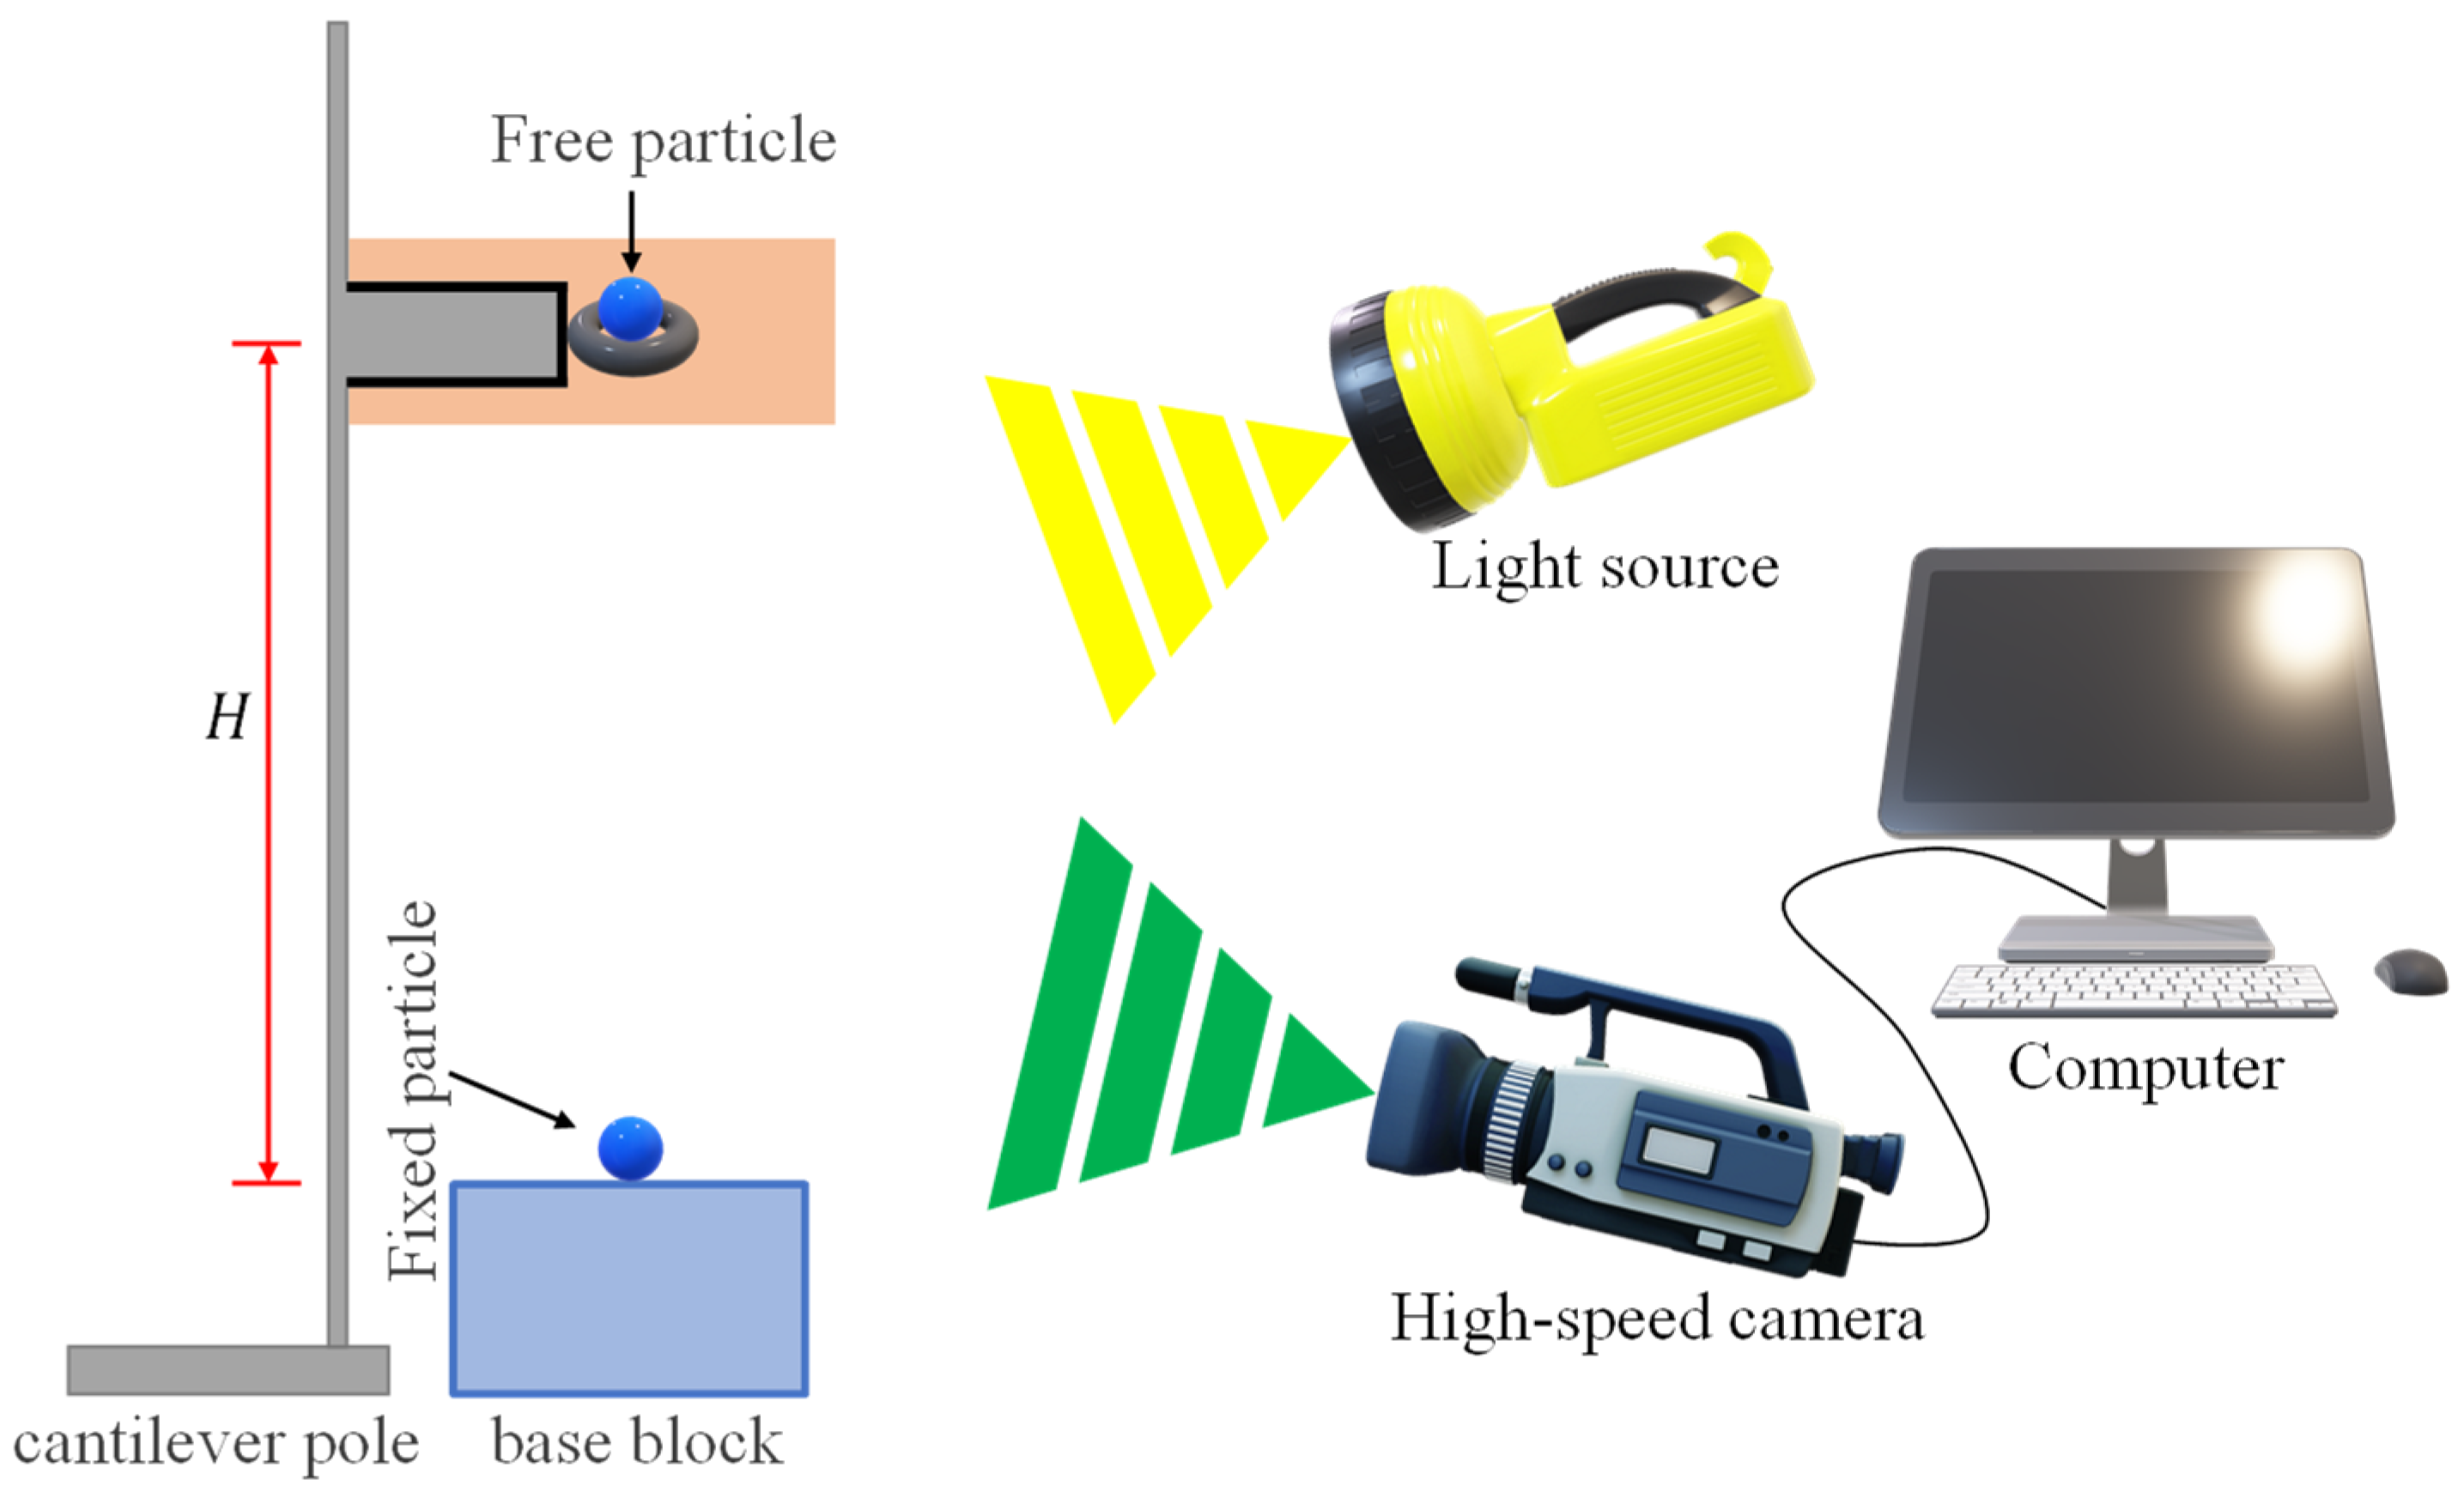
In this section, the following six main components in our experimental system are discussed: the drop platform, the high-speed camera, the computer and software, materials, experimental steps, and measurement methods.

2.1. Drop Platform

As shown in Figure 1, the free particle, m 2 , was placed on the drop platform, which was covered ted with sticky tape to ensure that the initial speed of m 2 was zero. Concurrently, markings were applied to the non-impacted surface of sphere m 2 to endeavor towards its consistent descent in precisely identical positions, ensuring that sphere m 2 was struck at the same point during each impact event. A ruler was used to connect it to the impact platform below. This facilitated the extraction of the location-related information regarding m 2 from the sequence images. A thin layer of rosin was utilized to affix sphere m 1 onto the platform, ensuring that sphere m 1 was struck at the same point with each impact.

2.2. High-Speed Camera

Giga View, a high-speed camera from the American Southern Vision System, was used. The collision process for two particles was recorded at 1050 fps for about 10 s, and nearly 10,000 photos were saved each time. The pixel size could reach 720 × 576, and the camera’s exposure could be adjusted to 0.2 ms to capture the high-speed impact process more clearly.

2.3. Computers and Software
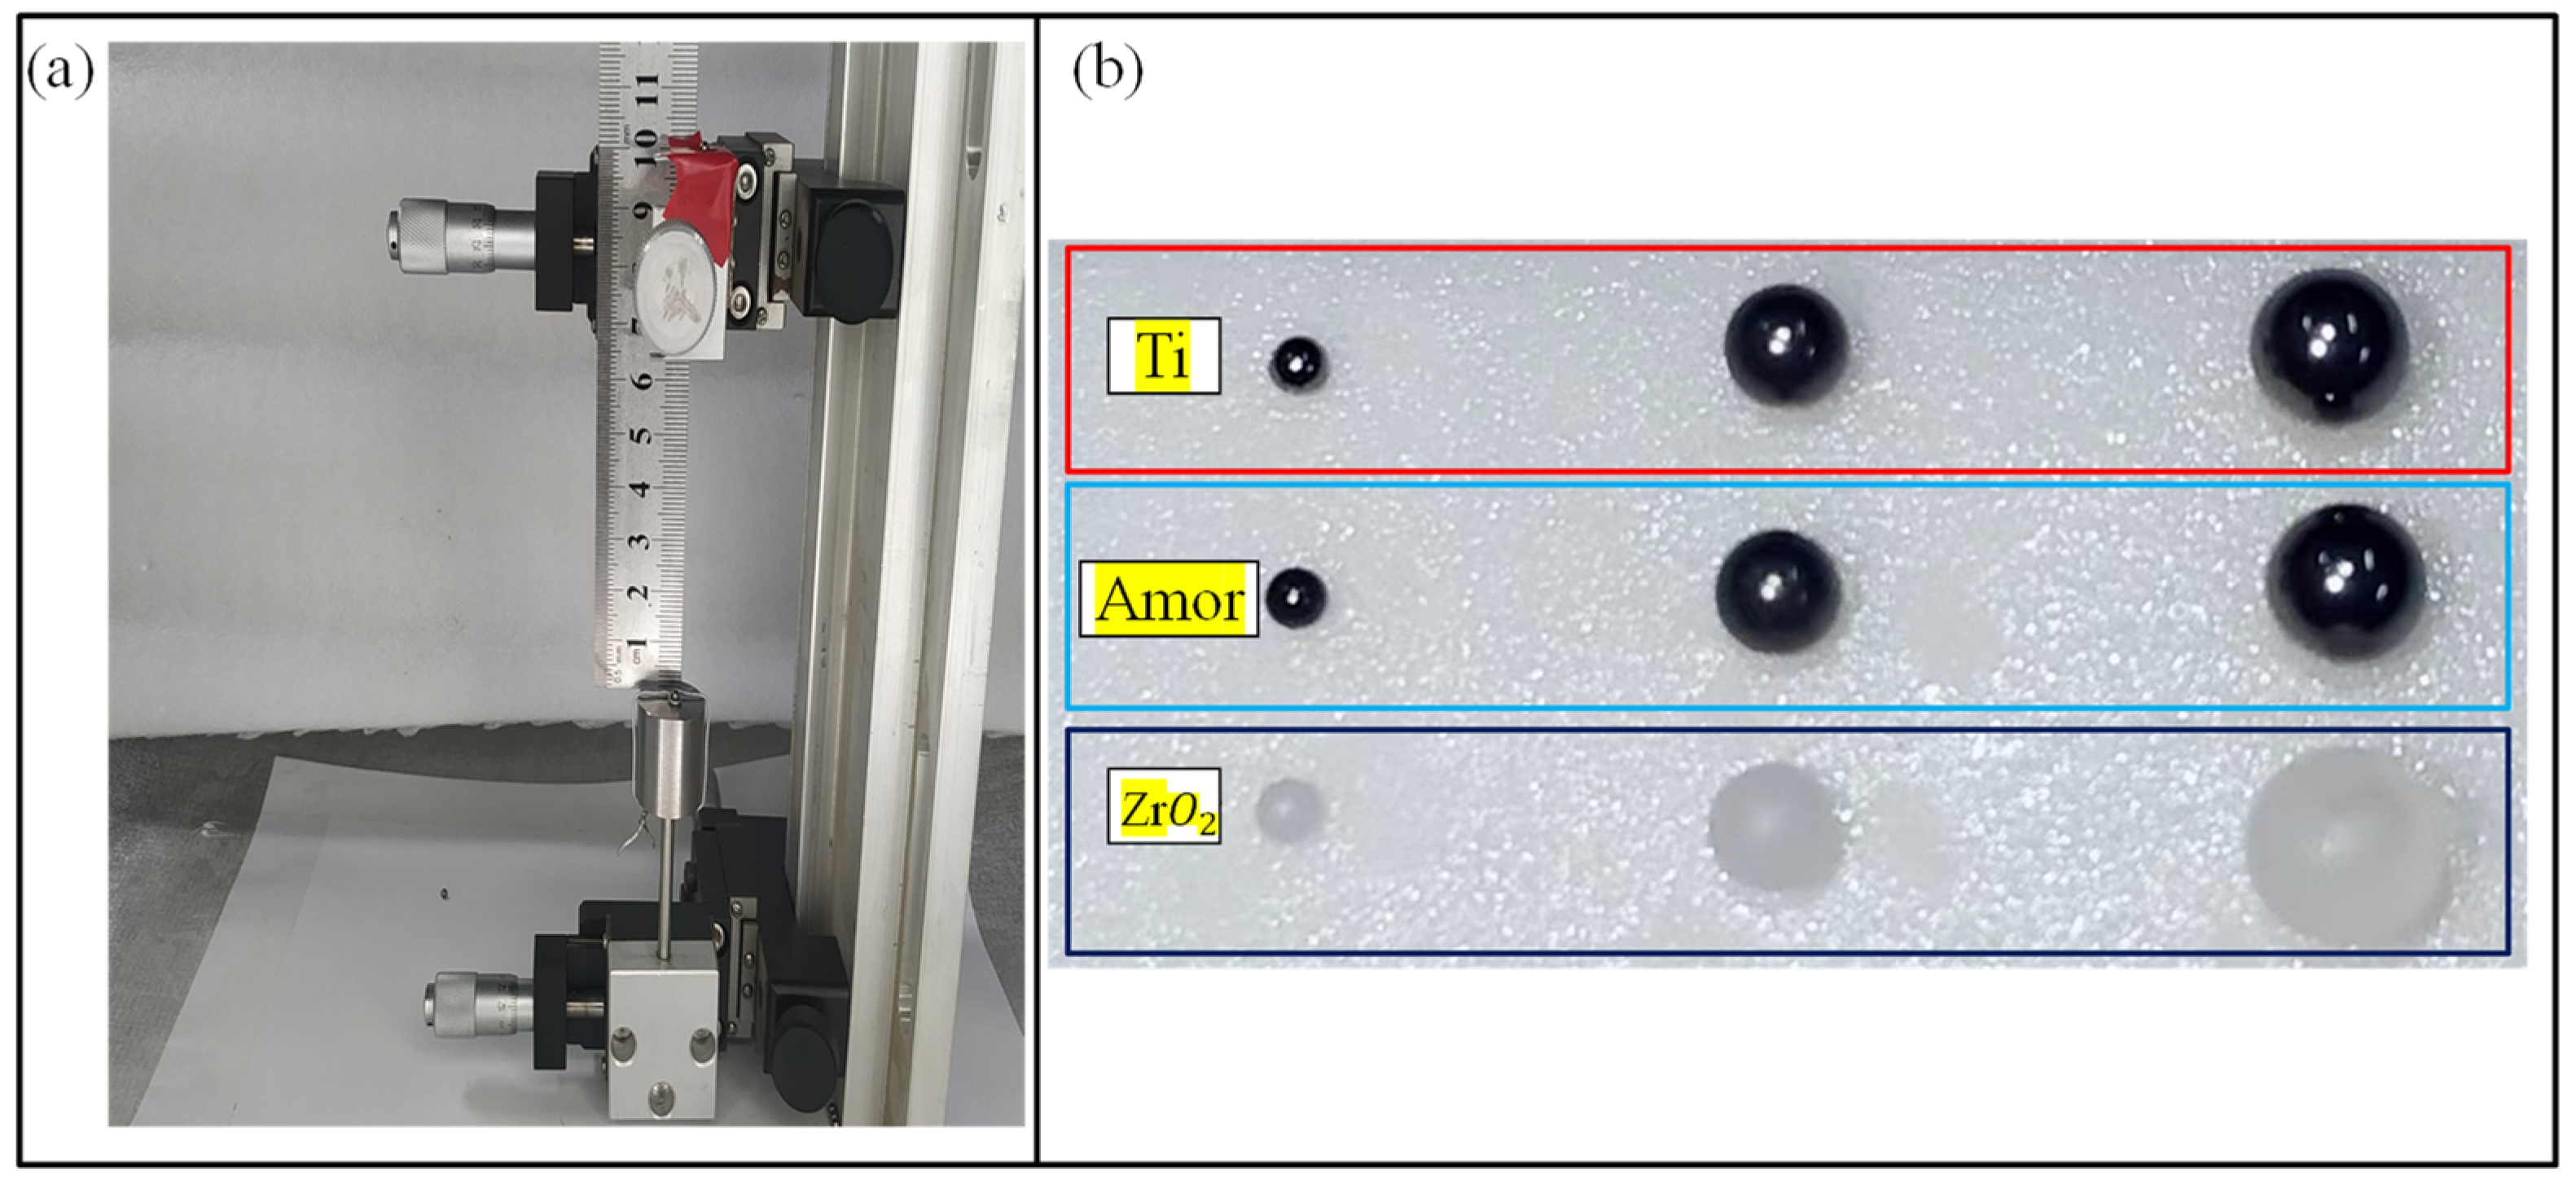
The camera was controlled by the built-in software in Giga View, and the whole motion process was saved to the computer in the form of sequence images.
Position-related information regarding m 2 was extracted from the sequence images by IDL.
Then, the position information which was extracted from the sequence images was plotted as a function of time using Origin. The velocity of m 2 before and after the collision was calculated using polynomial fitting, and then the COR was obtained.

2.4. Material

A diagram of the experimental system and particle material is shown in Figure 2. The particle materials used in the experiment and their size are shown in Table 1.

2.5. The Experimental Steps

First, m 2 was placed on the drop platform within an accuracy of 0.01 mm.
Then, the horizontal and vertical positions of m 2 were adjusted using a high-speed camera so that they were aligned to m 1 , with a vertical height of 10 cm for all data.
Finally, m 2 was released, and its collision with m 1 was recorded. We treated the situation when a second collision occurred as a valid collision, i.e., we recorded the collision with the lowest θ , as shown in Figure 3a. m 2 was raised to the given height again and then released, and the process of effective collision was recorded. This effective collision was repeated 15 times. Figure 3b shows the trajectory of m 2 after the second collision.

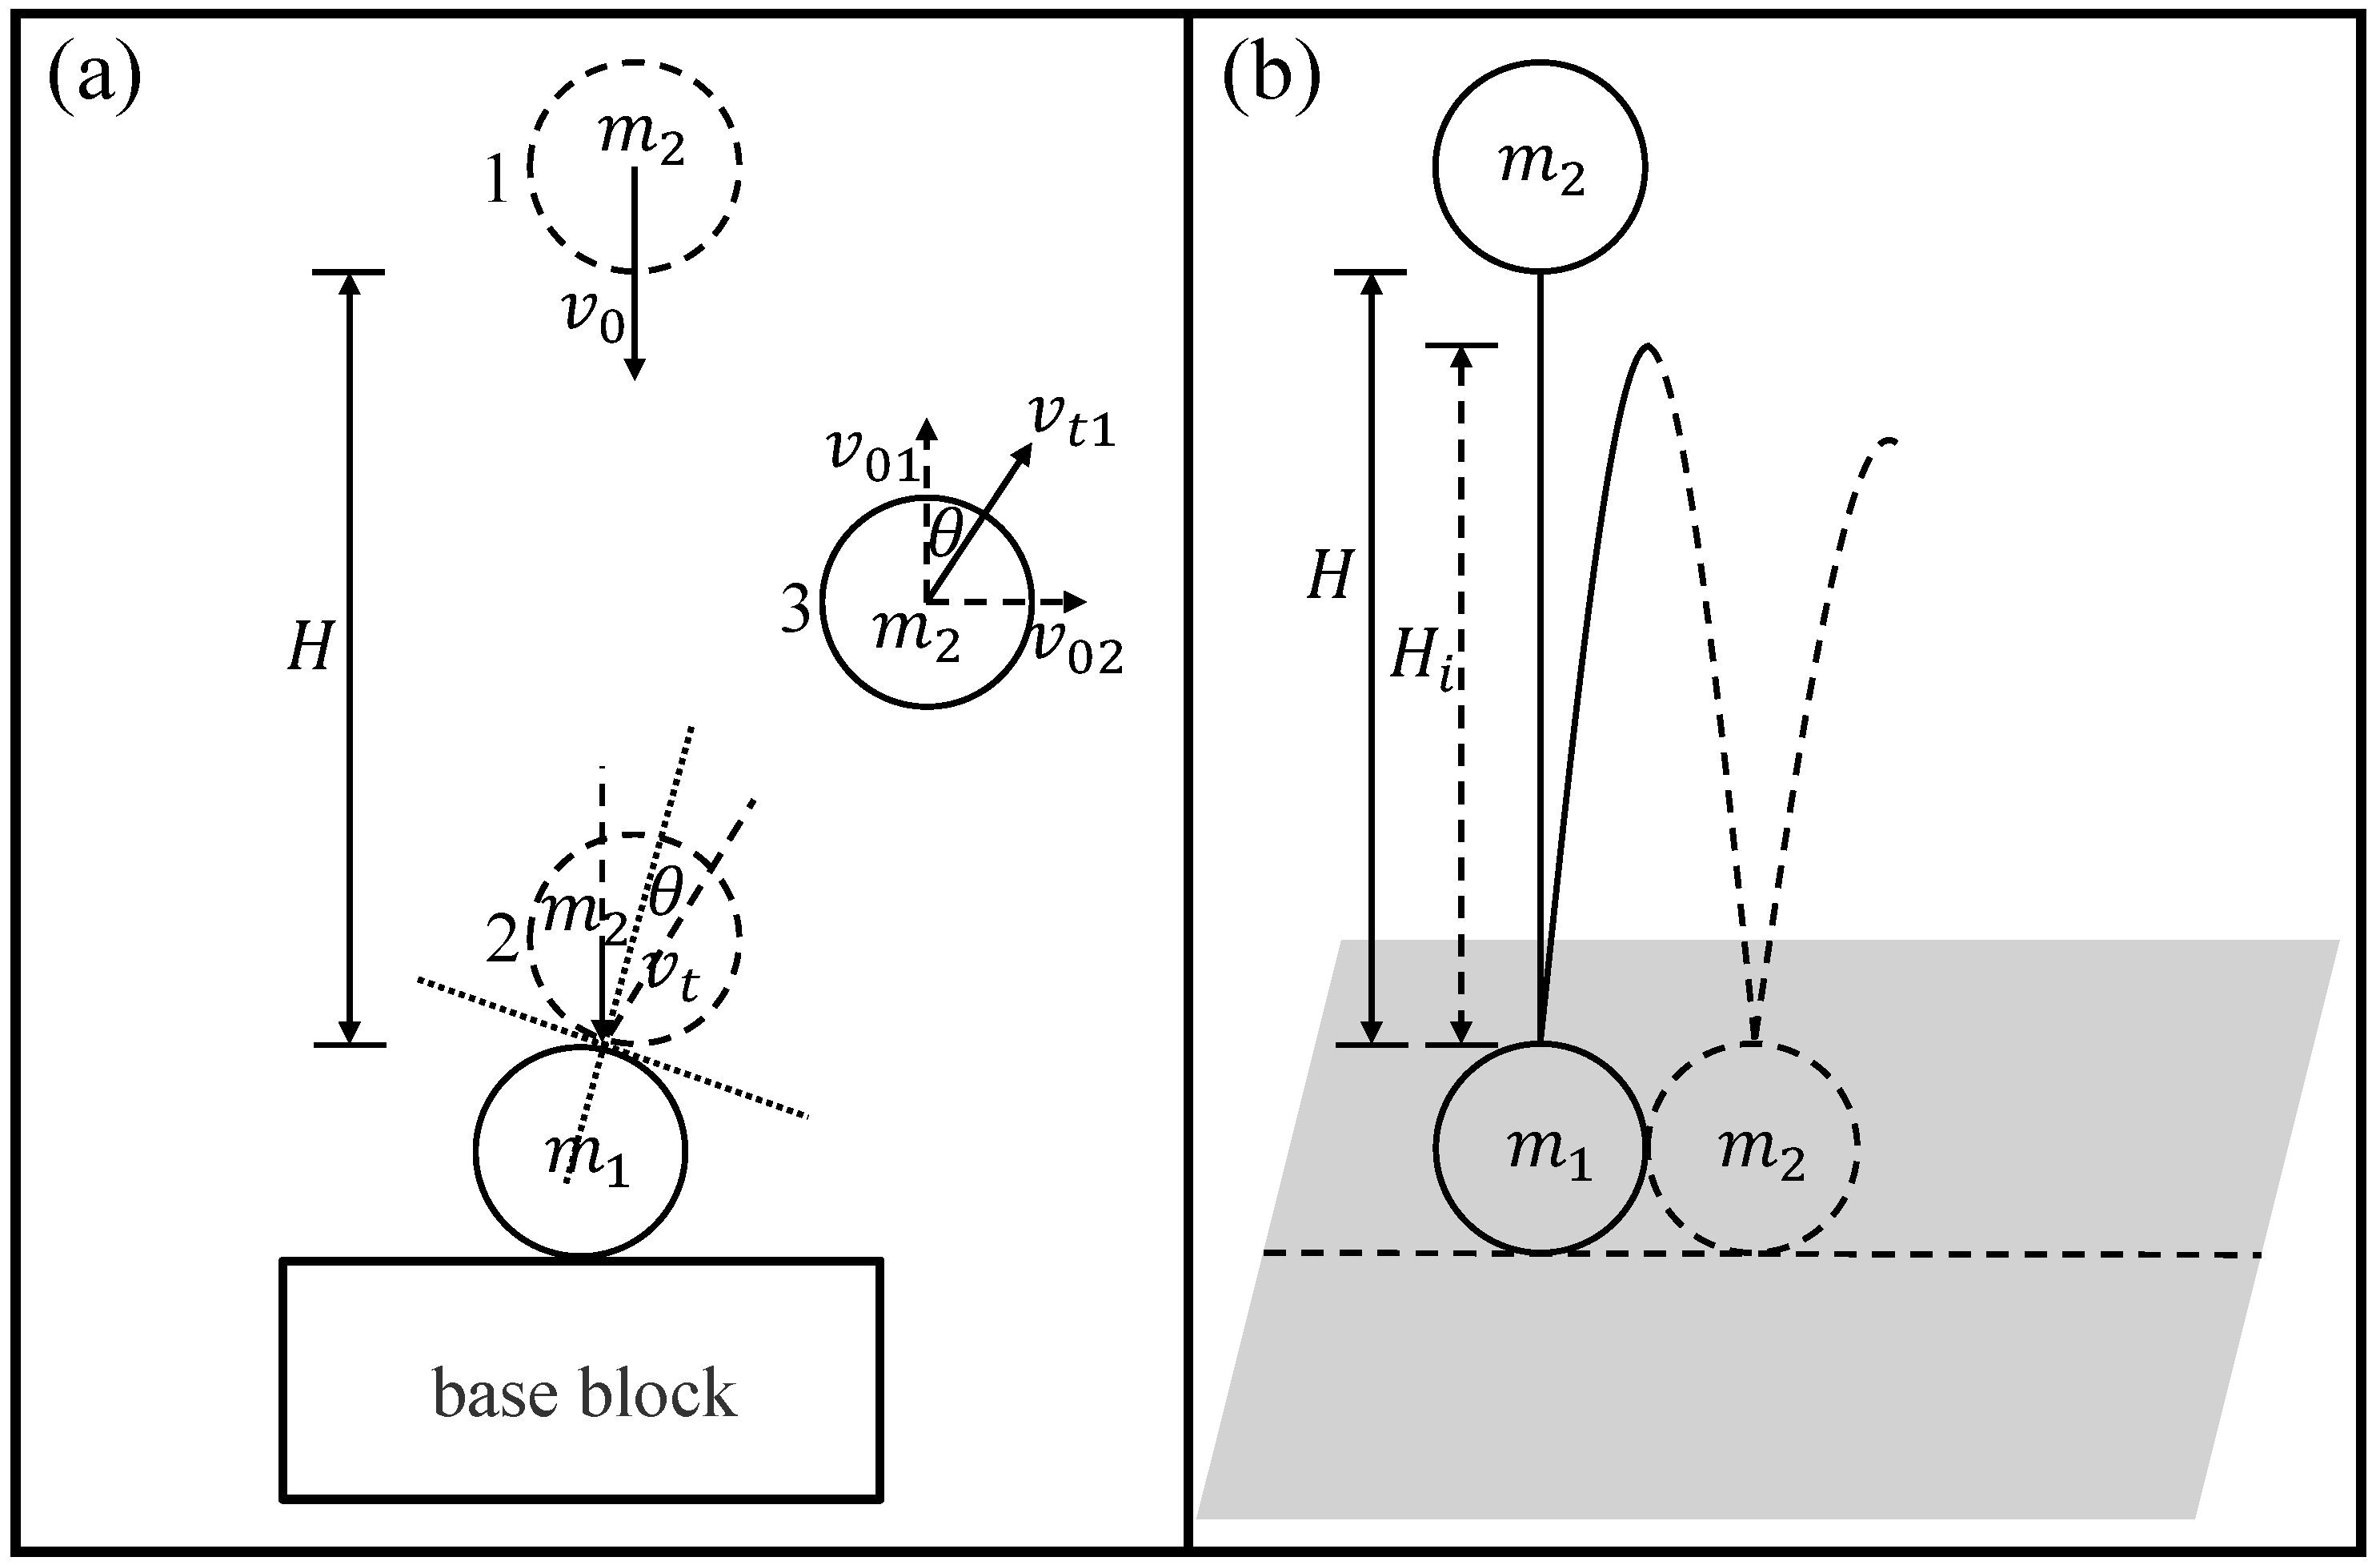
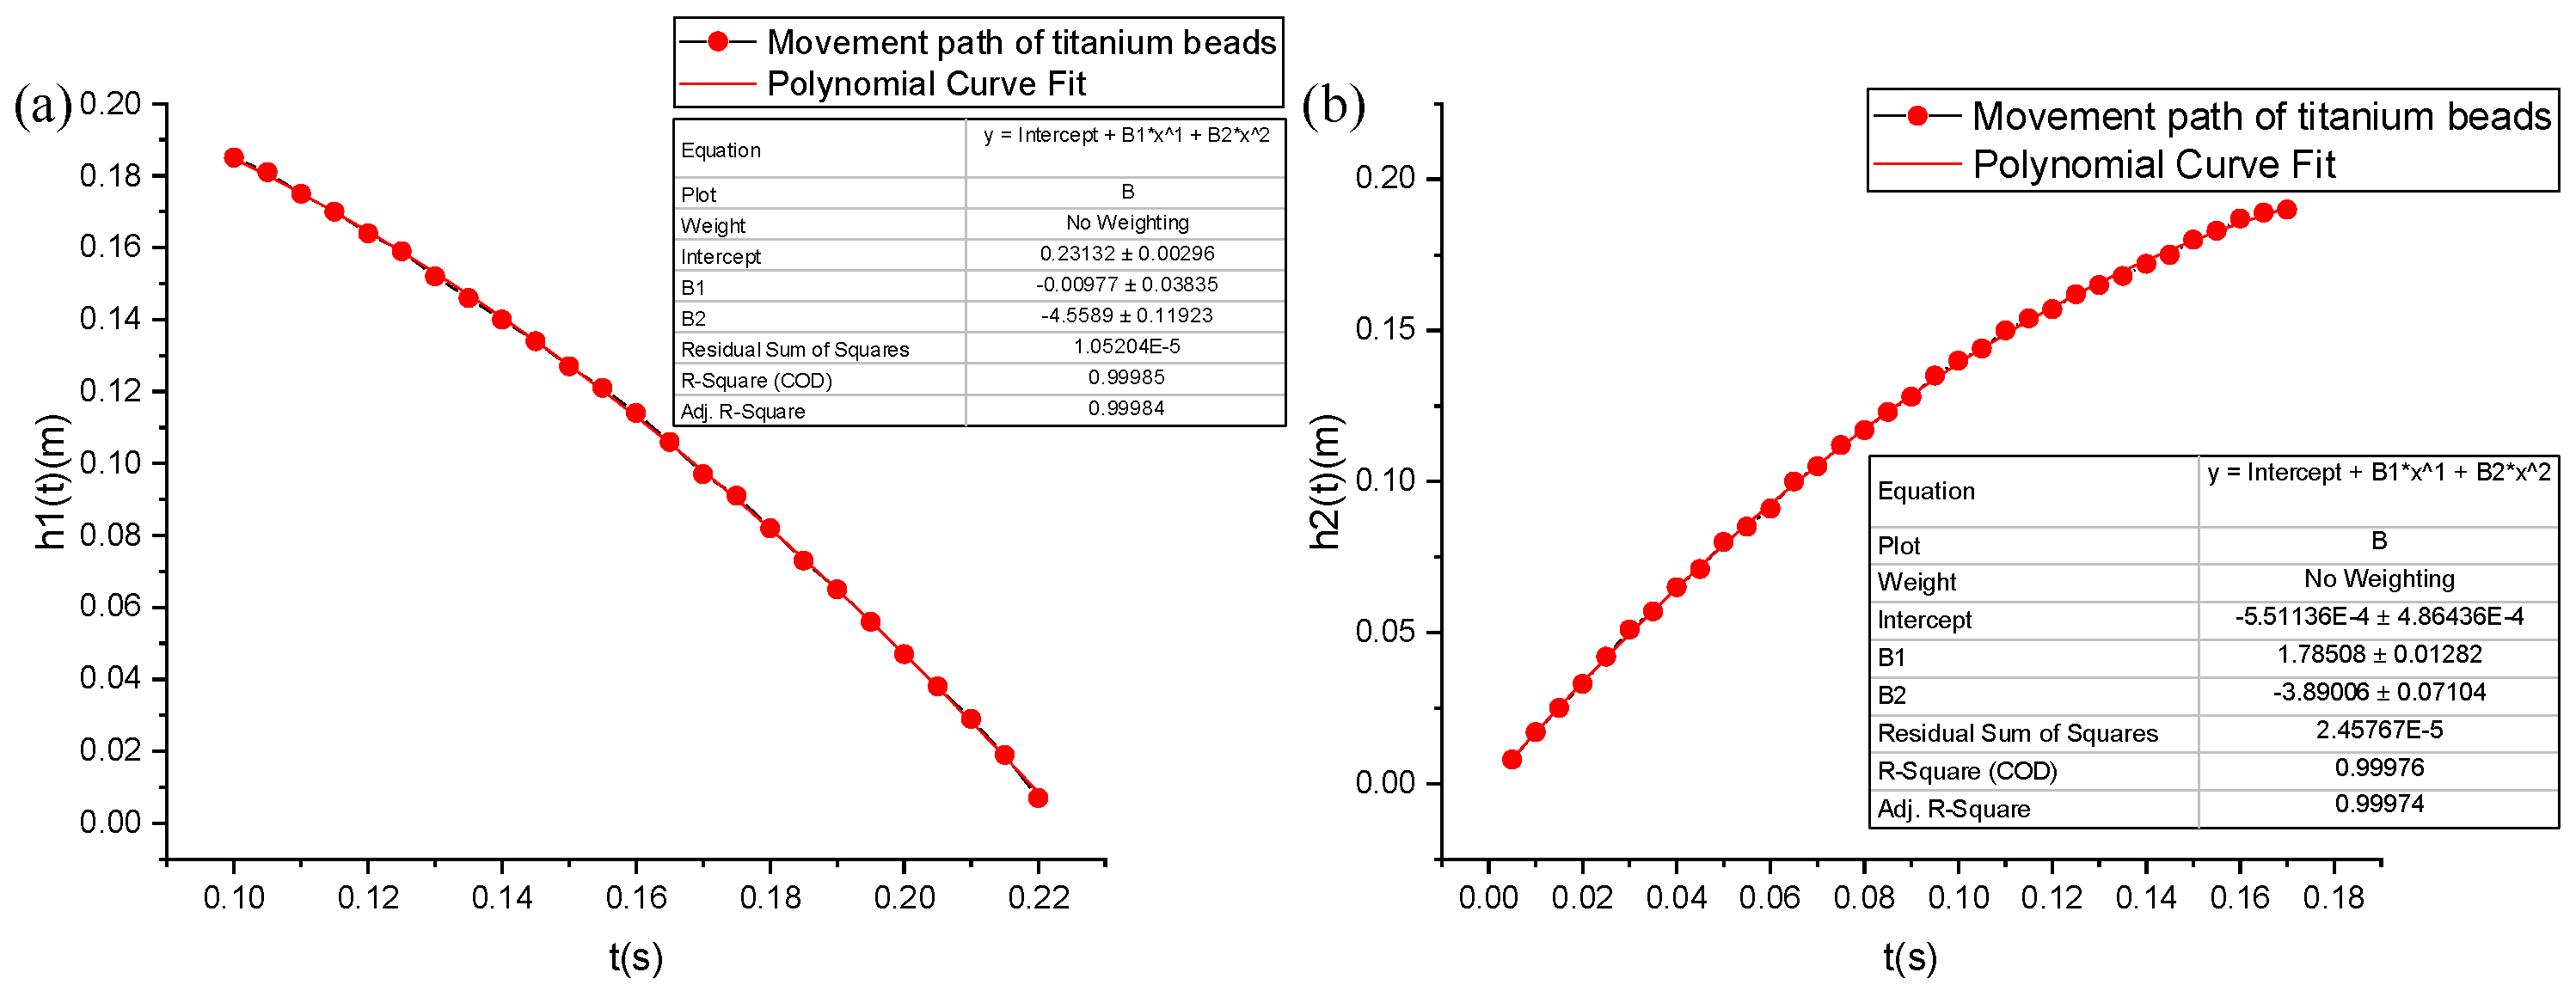
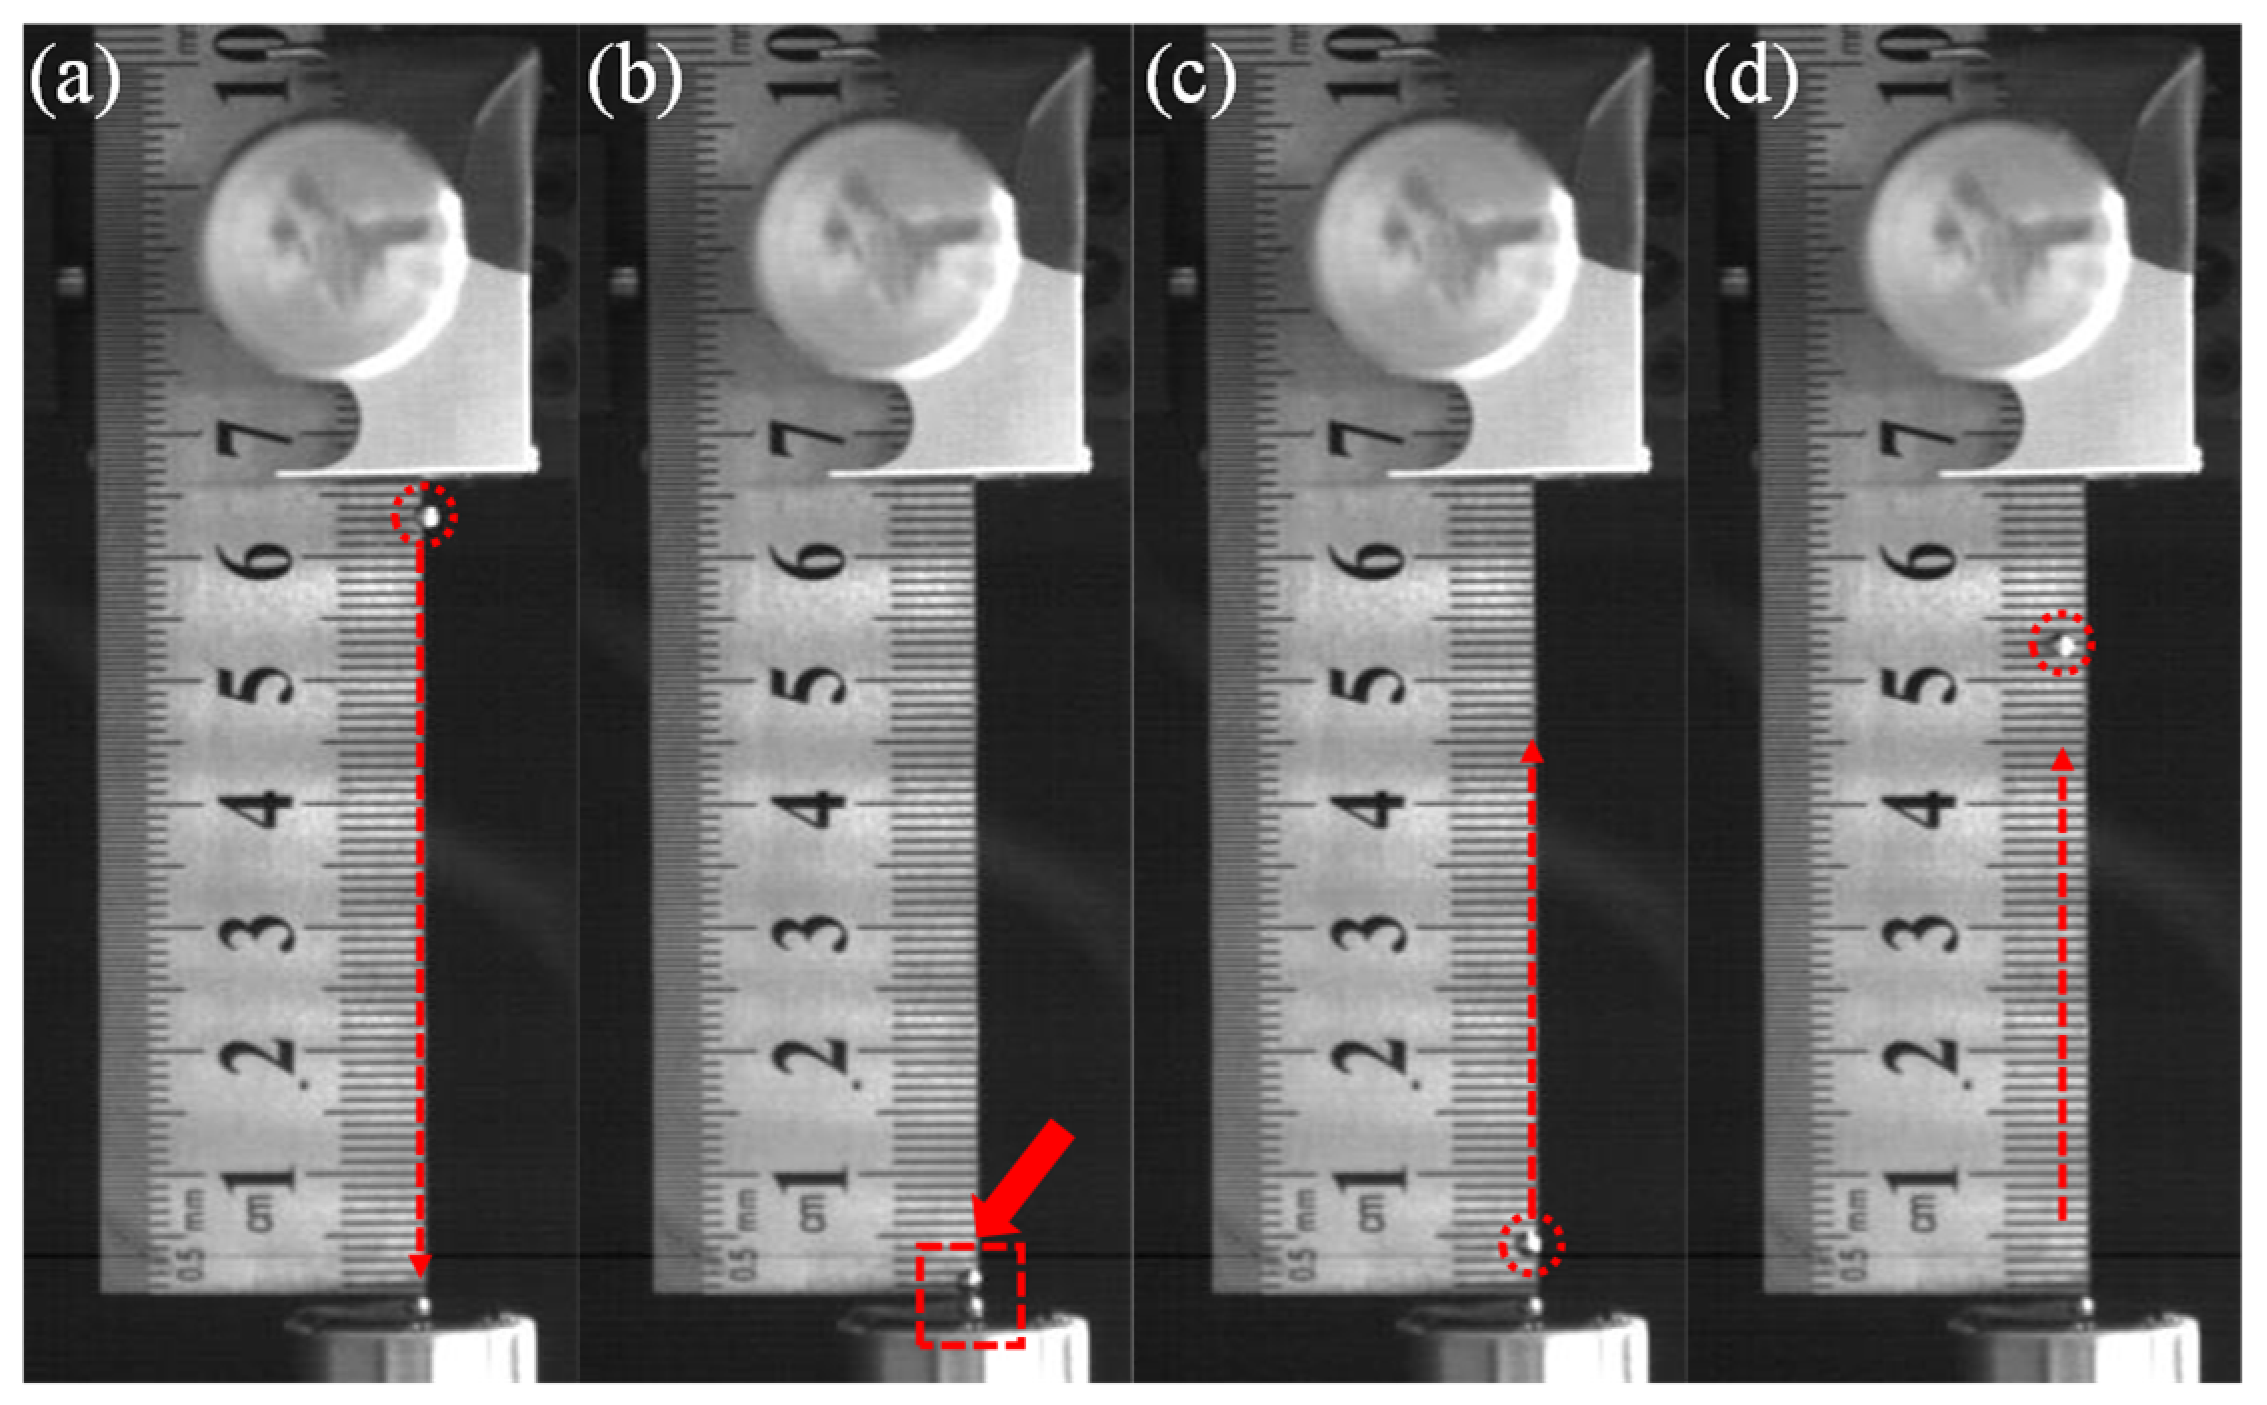
2.6. Method of Measurement

Usually, the COR determined using the normal component of the collision velocity is called the NCOR ( r ), and the COR determined using the tangential component of the collision velocity is called the TCOR. The basic definition of the COR is as follows:
r = ( v 1 v 2 ) v 1 v 2
where v 1 and v 2 are the respective velocities of particles m 1 and m 2 before the collision, and v 1 and v 2 are the respective velocities after the collision.
As shown in Figure 4, taking a collision of Ti–Ti with diameters of 2 mm as an example, the rebound height of Ti after the collision is 0.1950 m. This is shown in Equations (2) and (3) as follows:
h 1 t = H v 0 t 1 2 a t 2
where h 1 t is the instantaneous position of Ti, H is the initial position of Ti (all positions start with the collision point), v 0 is the initial velocity of Ti, a is the acceleration during movement, and t is the movement time of Ti.
v t = v 0 + a t 2
where v t is the instantaneous velocity the moment before the Ti collision, and t 2 is the total falling time actually measured for Ti.
According to the fitting in Figure 4a, the formula can be obtained as follows: h 1 ( t ) = 0.23132 0.00977 t 4.5589 t 2 . Therefore, we can determine the following:
H = 0.23132 ( m ) v 0 = 0.00977 ( m s ) a = 4.5589 × 2 = 9.1178 ( m / s 2 )
In addition, the time of each frame of our high-speed camera is t 1 = 1 / 200 = 0.005   s , and the total falling time is t 2 = 0.22   s . Therefore, by substituting Equation (4) and t 2 into Equations (2) and (3), we can obtain the following: v t = 0.00977 + 9.1178 × 0.22 = 2.015686   ( m / s ) .
According to the fitting in Figure 4b, the velocity after the collision of Ti can be obtained as v 01 = 1.78508   ( m / s ) ; therefore, the COR calculated at this time is x = v 01 / v t = 1.78508 / 2.015686 = 0.886 .
After multiple statistics, the velocity error before and after the collision obtained via fitting is less than E r = 0.626 / 100 , and, even when considering the height and gravity acceleration, the error E r = 4.631 / 100 is the largest. In this study, all the experimental data regarding the COR were obtained using this method.

2.7. Limitations of the Experiment

The largest sources of experimental error are the inaccuracy in particle calibration and error in the measurement of falling distance. If particles are incorrectly calibrated, the calculated COR increases because the loss of energy in the lateral motion of the particles cannot be observed using the camera.
Measurement errors in the height of the fall result from the fact that the specific speed required is slow. Because the speed during the movement is low, the difference between the required fall heights for each speed is small. The lower the required impact velocity, the greater the error in the measurement of the fall height.
One source of error arises from the progressive adherence of the static sphere on the base, which becomes firmer as impacts are repeated. However, if the influence of the rosin, a thin layer used to fix sphere m 1 , is considered without accounting for the effects of repeated collision counts, it may be disregarded.
Another source of error arises from the inability to ensure that the collisions between the two spheres are strictly normal collisions. Hence, we adopt a criterion where, following the rebound of sphere m 2 , a subsequent collision with sphere m 1 can occur, thus deeming such an event as a single effective collision. However, the measurement of the coefficient of restitution still relies on the data obtained from the initial collision. Therefore, it is possible to compute the maximum deviation angle between the experimental collision results and the normal collisions by means of calculation, as illustrated in the modification in Figure 3.
v 02 = D / 2 2 H i / g
v 01 = 2 H i g
θ = arctan v 02 / v 01 = arctan ( D / 4 H i )
Above, D represents the diameter of sphere m 1 (which is identical to the diameter of sphere m 2 ), H i denotes the rebound height after the initial collision, g stands for the gravitational acceleration, and θ signifies the angular deviation between the experimental collision outcomes and the normal collisions. Equation (7) reveals that the angular deviation θ shows a positive correlation to the diameter D of sphere m 1 and negative correlation to the rebound height H i . By considering the experimental parameters, the maximum angular deviation can be derived: θ m a x < 0.70 ° . This result shows that our experimental errors are within ± 1.2 % of the NCOR. This signifies that, within the scope of this error, our measurements adhere to the NCOR. In fact, regardless of the direction, our measurement errors fall within this range.
Inconsistent materials represent another factor that can lead to experimental error. For each set of collisions with a new ball (especially an alloy), the area of the contact point may contain slightly different percentages of material. As new balls may have slight material inconsistencies during manufacturing, it is important to consider these factors in experimental data.
Figure 5 illustrates the rebound after the second collision.

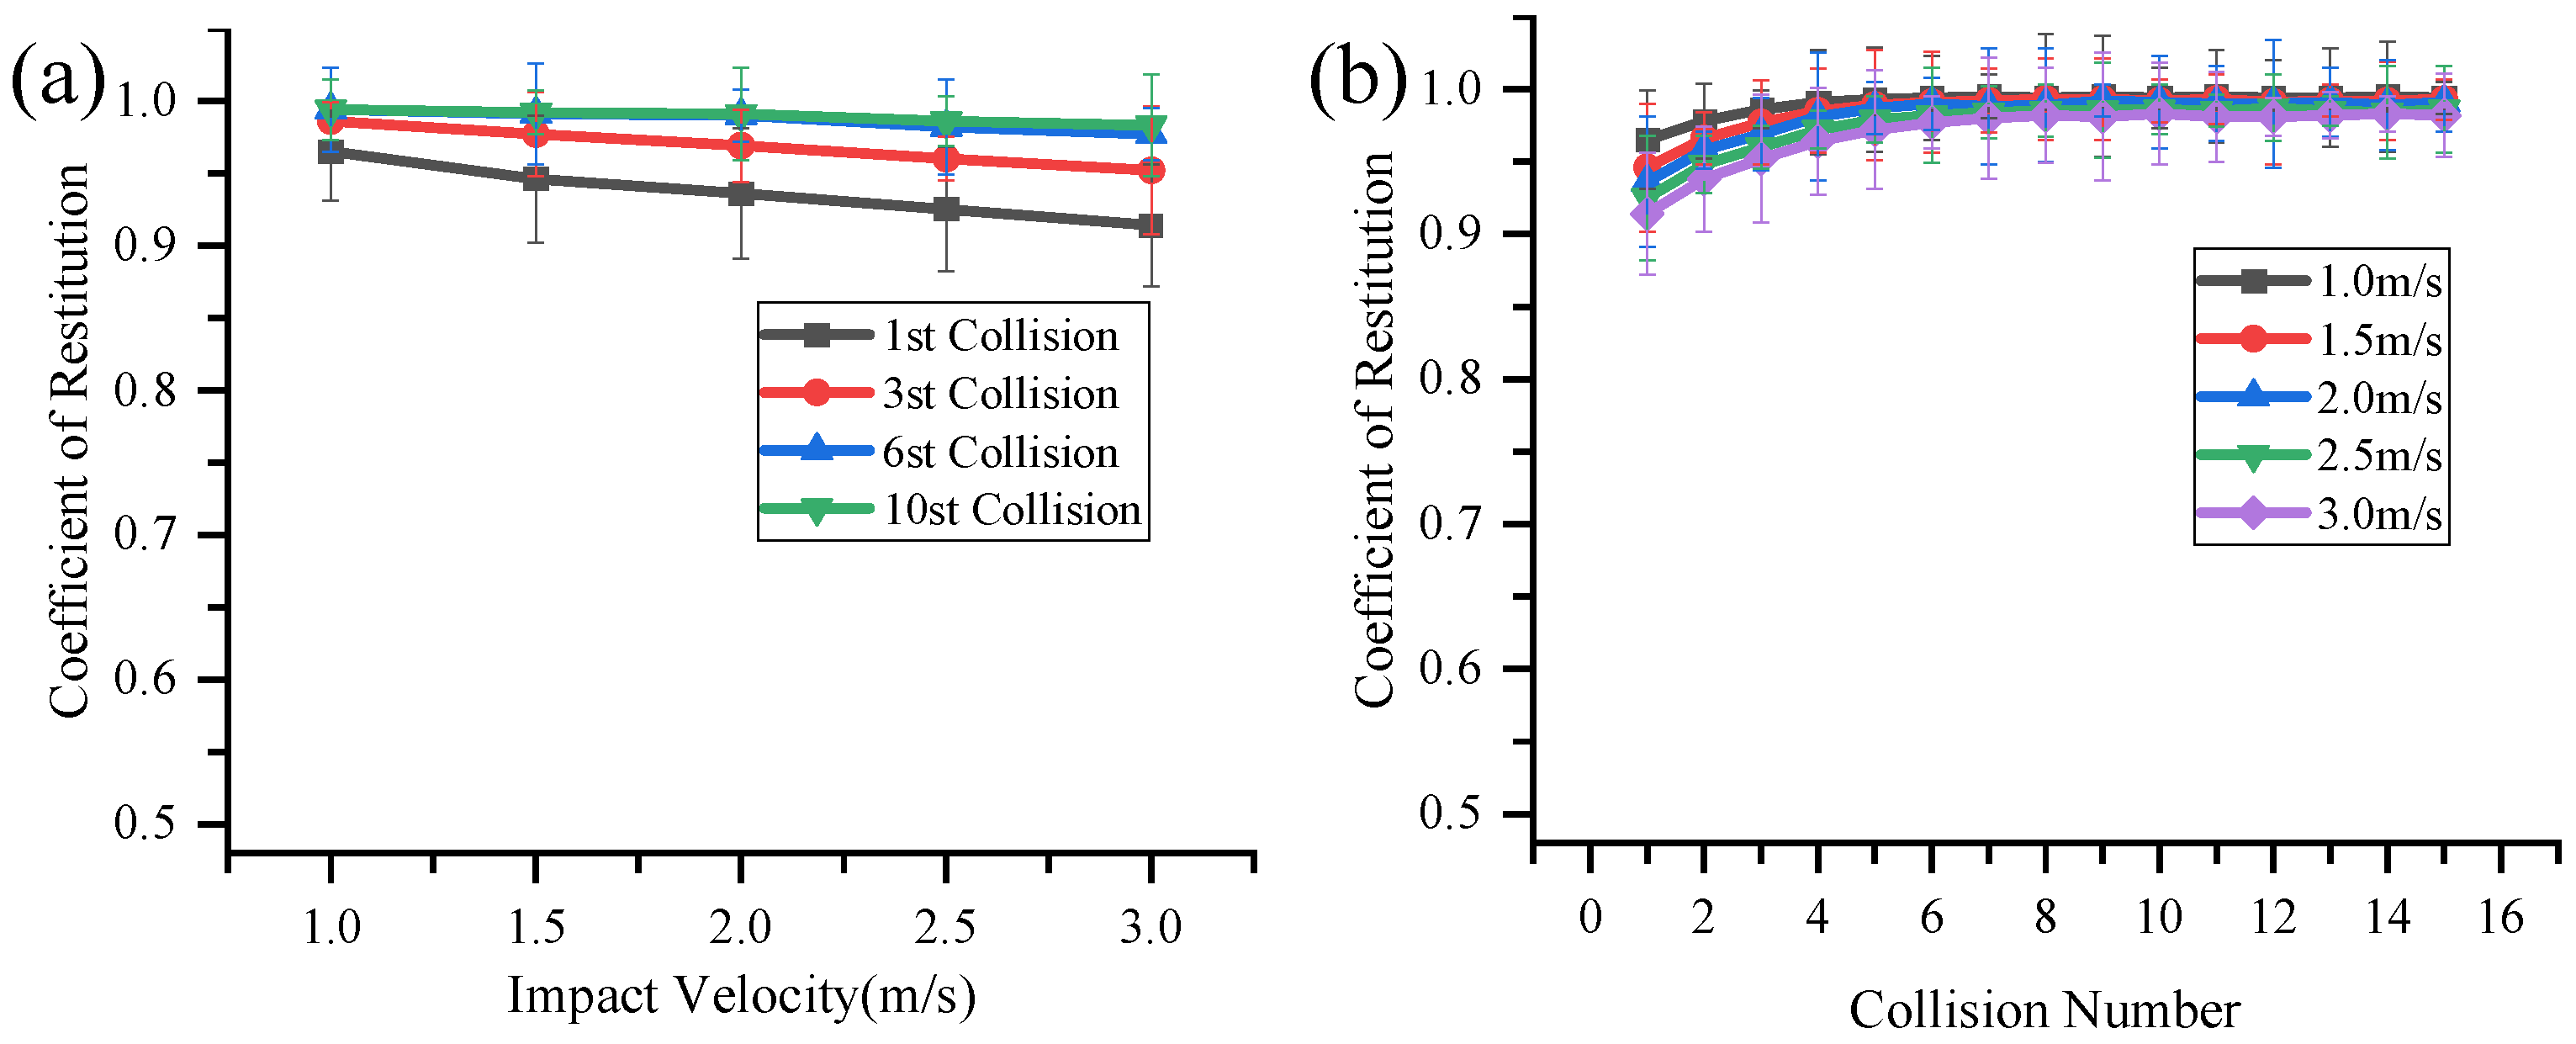
3. Results and Discussion
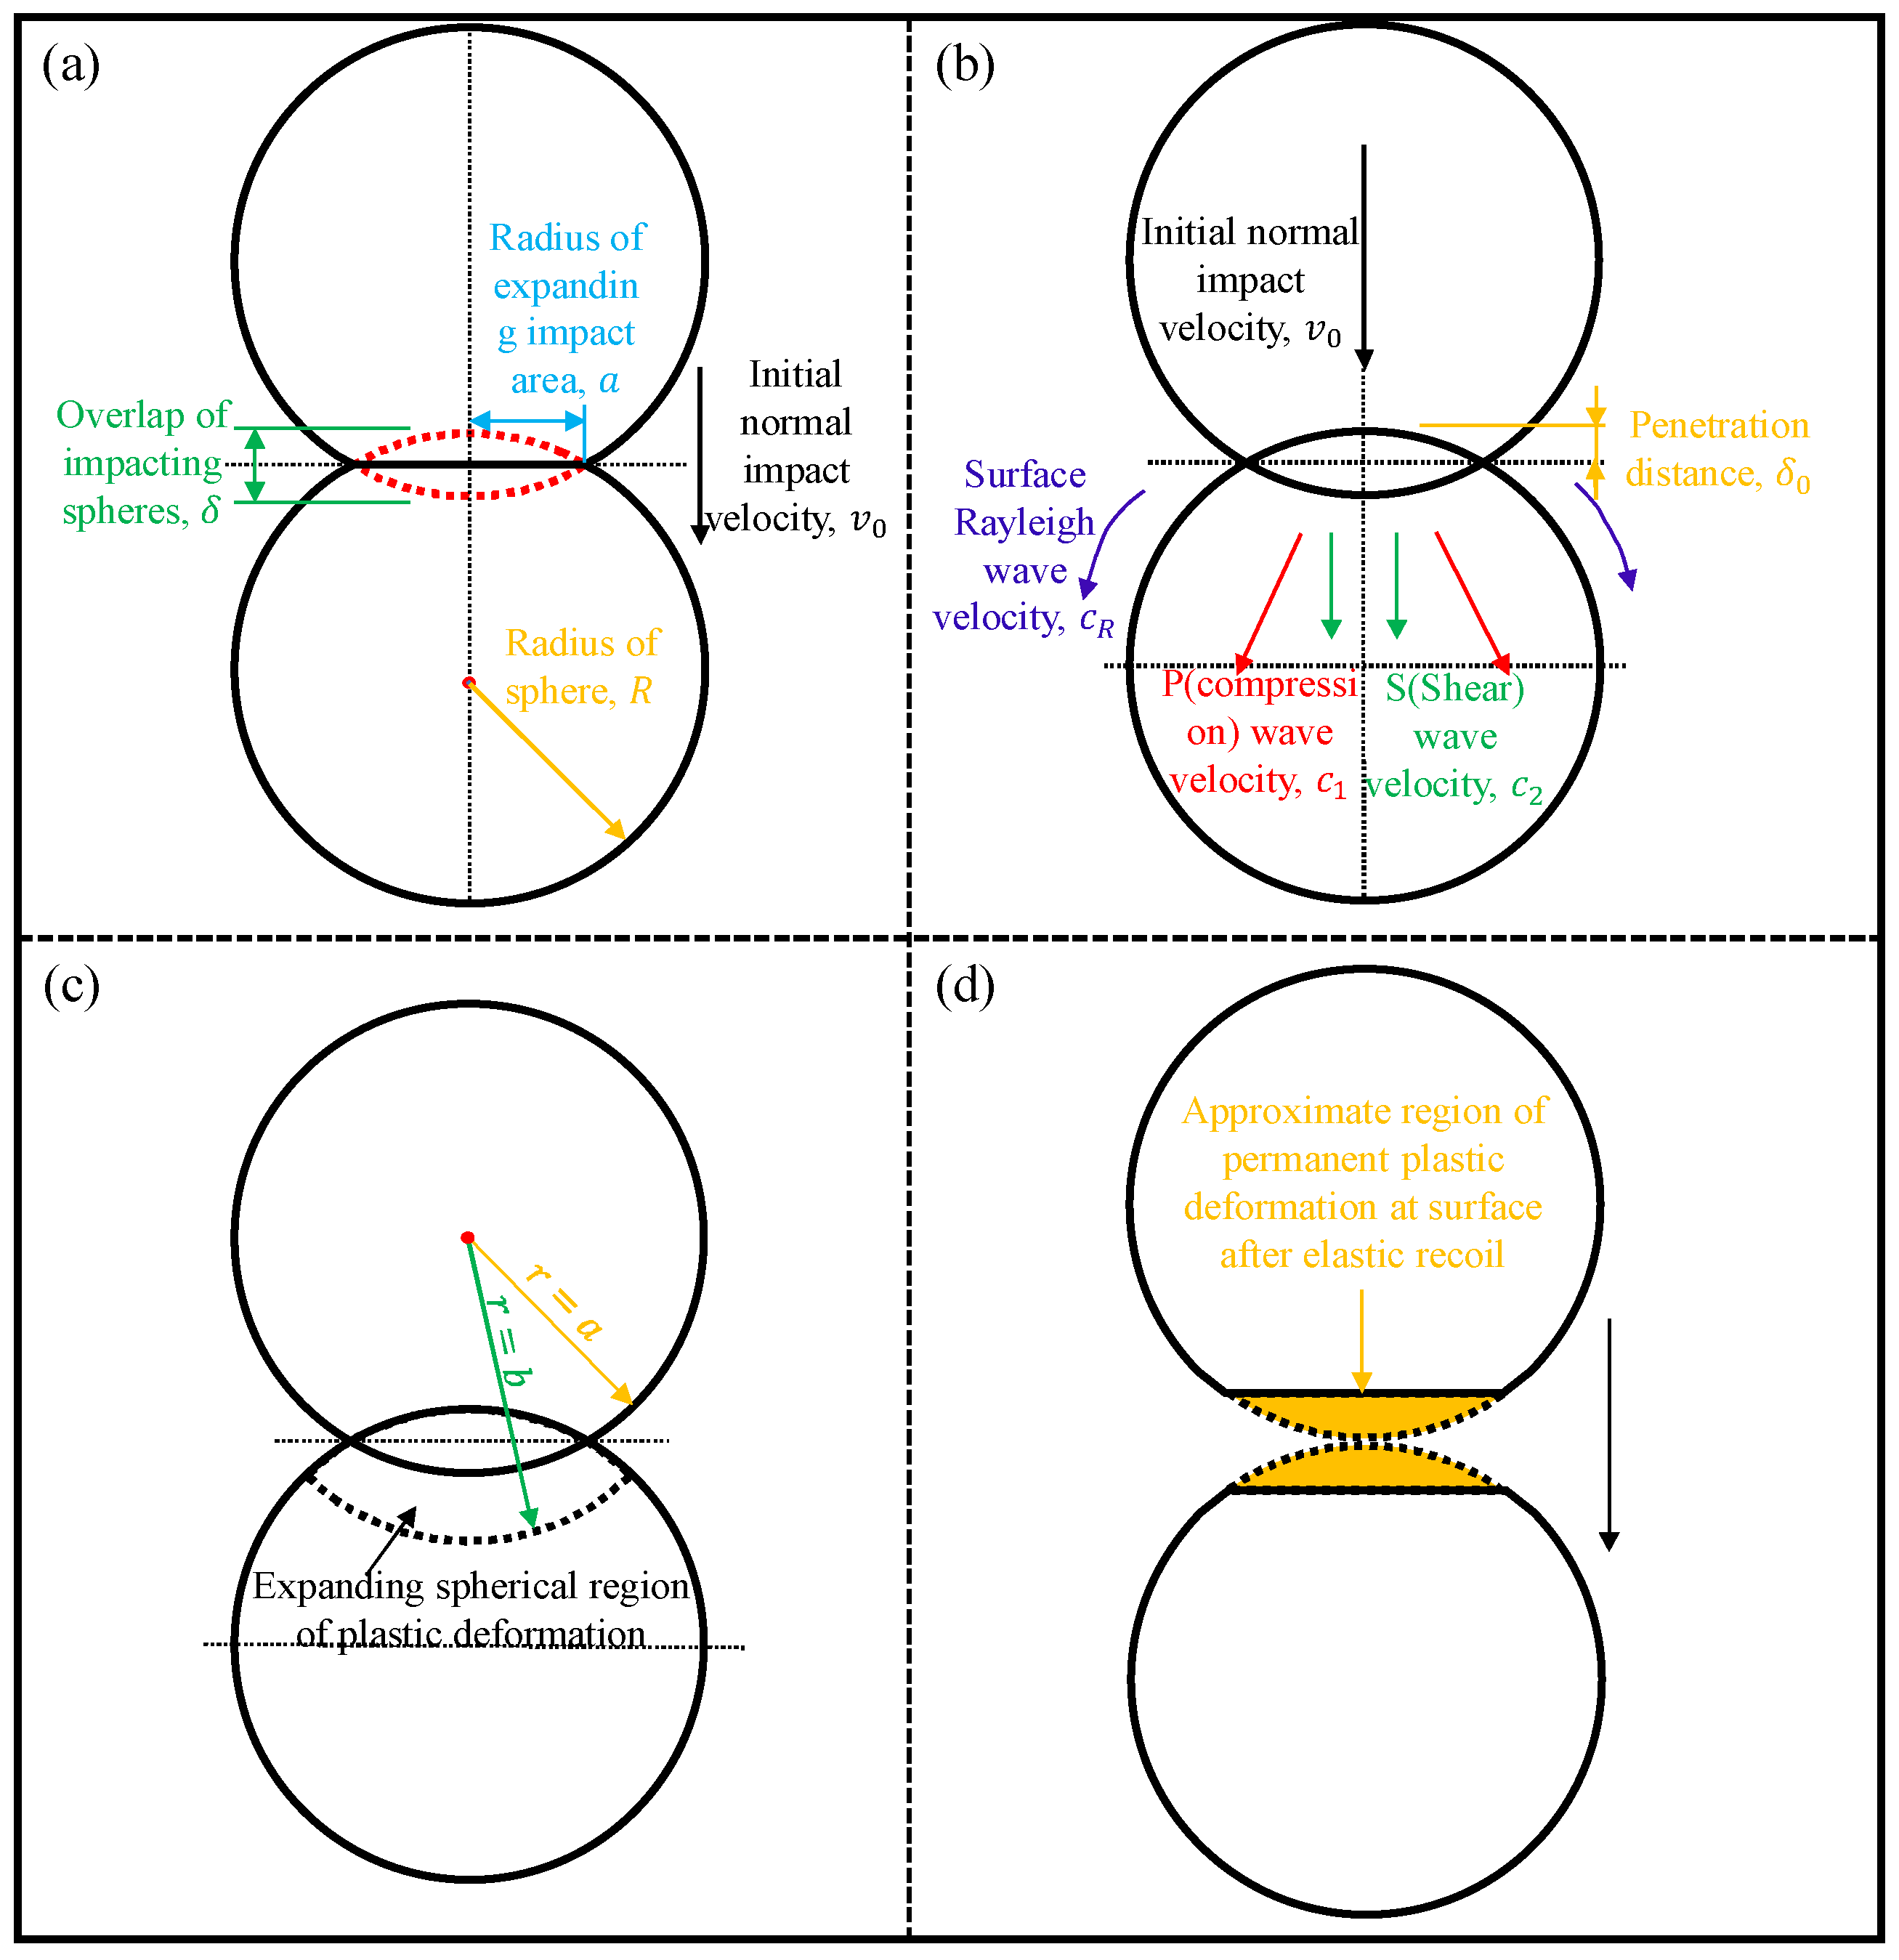
The yield strengths of Ti, ZrO2, and Amor are 300 MPa, 900 MPa, and 2500 MPa, respectively. It can be seen from Figure 6 that, no matter how the particle size changes, the particle with a higher level of yield stress also has a larger COR. In addition, the particle with a higher level of yield stress exhibits a smaller initial upward deformation trend, a smaller difference between the limit value reached by the COR and the initial value, and a smaller number of collisions needed to reach the limit value of the COR. A change in particle size does not affect this trend between the COR and the yield stress of the particle.
The main reasons for this include the fact that the particle material with a higher level of yield stress is more elastic, the initial energy loss due to deformation during the collision process is lower, and the number of collisions needed to reach the maximum value (elastic state) of the COR is also lower. In addition, the plastic deformation state of the particle with a lower level of yield stress is much steeper, resulting in more energy loss during the initial collision. Moreover, these effects are present in particles even when the yield velocity is much higher than the experimental impact velocity.
The trend in the COR of particles with respect to particle diameter is illustrated in Figure 7. It can be seen from this figure that the NCOR of particles of any material decreases with the increase in the particle diameter, which is consistent with the conclusion made by Higa et al. [20], further verifying that the variation trend in the NCOR of small particles with particle size in the low-speed range is the same as that in large particles. Both of these values decreased with the increase in the particle diameter. According to the Hertz contact theory, a fundamental model for elastic contact between spheres, larger particles with greater diameters exhibit decreased curvature at contact points, fostering larger contact areas during collisions. This enlarged contact area amplifies energy dissipation, as particles deform more extensively, transforming kinetic energy into potential energy associated with deformation. Consequently, the coefficient of restitution, which measures the elasticity of collisions, diminishes with increasing particle diameter due to heightened energy loss and reduced relative velocities upon separation.
By adjusting the initial positions of particles, we obtained the NCOR data regarding small particles at different impact velocities. Here, we discuss the dependence of the NCOR of small spherical particles on impact velocity in the low-speed range. An amorphous zirconium alloy sphere with a diameter D = 2   m m was used; the impact velocities were v = 1.0 , 1.5 , 2.0 , 2.5 , 3.0   m / s , and each impact velocity was obtained using the average of 15 repeated impacts.
Figure 8 shows the variation trend in the COR with impact velocity during the first collision. This figure reflects an almost linear trend, as also shown in the experiment by Seifried et al. [16]. Stevens et al. [13] reviewed various theories on the variation trend in the COR with the impact velocity, but none of them could accurately fit the theoretical curve.
The theoretical curve obtained by Tallon et al. [11] by modifying the fitting parameters was qualitative, but the theory was different from our experimental data. The theory was fitted by Spahn et al. [34] by modifying the only unknown part of the theory—the dissipation parameter, A. The dissipation constant, A, can be understood using the article by Schwager et al. [35], whose experimental results seemed to partially qualitatively validate the abovementioned theory.
Figure 9a,b show that the COR of subsequent repeated collisions after the first collision were also consistent with the view of Spahn et al. [34], who determined that, in subsequent collisions, the COR decreases as the impact velocity increases. At present, there is no relevant theoretical research on the dependence of the COR on the impact velocity of subsequent repeated collisions under the same initial impact velocity. The experimental data presented in this study provide a reference for subsequent related theoretical research.
The Boltzmann Fit method was used to fit the variation trend in the COR, as shown in Figure 10. It can be seen from this figure that the variation trend in the COR could be effectively fitted using the Boltzmann Fit method. The trend was an exponential curve that varied with the material: y = A 2 + ( A 1 A 2 ) / ( 1 + exp ( ( x x 0 ) / d x ) ) , and, here, A 1 , A 2 are related to the material of the particle. Qualitatively, this was very similar to the theoretical curves proposed by Weir and Tallon. According to the theory proposed by Weir and Tallon, the elastic regime of a curve exhibits greater elasticity (i.e., the COR is close to 1), and such a model can effectively predict plastic deformation states. However, in this theory, the change in the elastic state after repeated collisions is ignored. In this respect, the big difference between the model and the experimental results proves that they cannot accurately describe the elastic state after repeated collisions.
In summary, the possible states of small-sized particles during a low-speed collision are shown in Figure 11. There are four possible stages in the particle collision process: the super seismic regime, the elastic regime, the plastic regime, and elastic recoil.
(1)
Super-seismic regime: In the initial stages of impact, the velocity of the expanding impact area exceeds the velocity of seismic waves in the spheres. This occurs over a small time and distance scale and can be ignored in many systems. For a radius of 1   m m , v 0 of 1   m / s , and c 0 of 10 3   m / s , the time of existence of the super-seismic regime needs to be greater than about a nanosecond. This is such a small time period that the super-seismic regime can be ignored for such examples;
(2)
Elastic regime: The generation of elastic waves contributes to energy losses in the particle collision, c 1 > c 2 > c R . Approximately 67% of the radiated energy is in Rayleigh waves [36];
(3)
Plastic regime: If elastic yield stresses are exceeded, plastic deformation occurs around the impact region. Here, this is approximated as an expanding spherical region of plastic deformation;
(4)
Elastic recoil: The unloading of stresses in the particle is assumed to be entirely elastic.

4. Conclusions

The experimental results regarding three different materials and three different sizes of particles show that, for particles with higher levels of yield stress, the change in the COR under deformation is smaller, the limit value of collision is higher, and the speed at which the limit value is reached is faster. However, the particle with a lower level of yield stress has a steeper plastic deformation state and loses more energy during the initial collision. In the velocity range of 1.0   m / s to 3.0   m / s , the COR displays an almost linear trend with the impact velocity. The essential reason for this is that, the higher the velocity is at the time of collision, the more energy that will be lost during the collision process, meaning that the COR decreases linearly. Poschel et al. [7] proposed relevant theories regarding the dependence of COR on speed, which may need to be modified to fit the speed range we studied.
For the particles made of the same material after the first collision or repeated collisions, the NCOR decreased with the increase in the particle size. This is consistent with the conclusion made by Higa et al. [20], which further verifies that the NCOR of small particles in low-speed ranges with the tendency of the particle size to change is the same as the law of large particles. Both decrease with the increase in the particle diameter. The larger the particle diameter, the smaller the curvature at the collision point, and, the larger the contact area at the collision point, the easier it is to produce effective plastic deformation, which increases the average energy loss during the collision process. Therefore, the COR decreases with the increase in the particle diameter. The larger the particle size, the smaller the COR during the first collision, the larger the initial upward plastic deformation trend, and the larger the difference between the initial value and the limit value of the COR. The smaller the particle size, the smaller the tendency toward plastic deformation (i.e., the deformation state of the statue is much gentler), and the less energy that is lost in the first collision. We believe that, in the same experimental system, the only difference between particles with different sizes in the collision process is that the contact area at the collision junction is different due to the different curvature. A smaller curvature in larger particles makes the contact area at the collision junction larger, which increases the energy loss during the collision process and reduces the energy transfer efficiency between particles during the collision process. This is equivalent to a disguised reduction in particle elasticity, resulting in a smaller COR. Smaller particles have larger curvatures, which makes the contact area at the collision junction smaller, enhances the energy transfer efficiency during the collision process, and reduces the energy loss during the collision process, which is equivalent to improving the elasticity of the particles and making the NCOR larger.
The experimental results also show that the actual COR obtained is smaller than the theoretical value, except for the factor of air friction. It is concluded that this is the result of reciprocal transformation between translational and rotational degrees of freedom of particles during the collision process. In our experimental system design, the particle was fixed and stationary, but, in the normal collision of incomplete particles, particles rotate after the collision; this means that the particles can exchange energy between rotational and dynamic degrees of freedom during collision. As we only used the velocity of translational degrees of freedom to calculate the COR and ignored the portion of energy that was converted from translational degrees of freedom to rotational degrees of freedom during the collision process, the COR obtained using this algorithm cannot accurately describe the energy conversion process of particles during the collision process. Therefore, we speculate that, if a certain degree of rotational DOF were to be given to the particle before collision, it would be possible to obtain a COR that exceeded the limit value of 1 (i.e., the velocity of the translational DOF after the collision would be greater than that before the collision), which means that we could observe the phenomenon of hyperelastic collision. In other words, as long as certain rotational degrees of freedom are given to the particles before collision, the hyperelastic collision phenomenon can be observed, and further experiments can be carried out to verify this speculation. The transformation between rotational and translational degrees of freedom is inevitable in the collision process. Therefore, it is necessary to consider the energy of rotational degrees of freedom in the COR and improve the algorithm of COR, so as to make it applicable in a wider range of situations.

Author Contributions

Conceptualization, T.L. and R.L.; methodology, T.L.; software, T.L.; validation, T.L., Z.C. and Y.Z.; formal analysis, T.L.; investigation, T.L.; resources, H.Y.; data curation, Z.C.; writing—original draft preparation, T.L.; writing—review and editing, R.L.; visualization, T.L.; supervision, H.Y.; project administration, H.Y.; funding acquisition, H.Y. All authors have read and agreed to the published version of the manuscript.

Funding

This research was funded by the Qingdao National Laboratory for Marine Science and Technology, grant number 2015ASKJ01; the National Natural Science Foundation of China, grant number (12072200, 12372384); and the Program of Shanghai Academic Research Leader (23XD1421400).

Data Availability Statement

The data presented in this study are available on request from the corresponding author. The data are not publicly available due to restrictions, i.e., privacy and ethical.

Acknowledgments

We wish to extend our gratitude to Meiying Hou, a distinguished research fellow at the Institute of Physics, Chinese Academy of Sciences, for her invaluable professional advice on experimental design and extensive guidance throughout the manuscript composition process.

Conflicts of Interest

The authors declare no conflicts of interest. The funders had no role in the design of the study; in the collection, analyses, or interpretation of data; in the writing of the manuscript; or in the decision to publish the results.

References

  1. Brilliantov, N.V.; Pöschel, T. Kinetic Theory of Granular Gases; Oxford University Press: New York, NY, USA, 2004; pp. 10–16. [Google Scholar]
  2. Goldhirsch, I. Rapid granular flows. Annu. Rev. Fluid Mech. 2003, 35, 267–293. [Google Scholar] [CrossRef]
  3. Rapaport, D.C. The event scheduling problem in molecular dynamic simulation. J. Comput. Phys. 1980, 34, 184–201. [Google Scholar] [CrossRef]
  4. Lubachevsky, B.D. How to simulate billiards and similar systems. J. Comput. Phys. 1991, 94, 255–283. [Google Scholar] [CrossRef]
  5. Pöschel, T.; Schwager, T. Computational Granular Dynamics: Models and Algorithms; Springer Science & Business Media: Berlin/Heidelberg, Germany, 2005; pp. 21–25. [Google Scholar]
  6. Lun, C.K.; Savage, S.B. The effects of an impact velocity dependent coefficient of restitution on stresses developed by sheared granular materials. Acta Mech. 1986, 63, 15–44. [Google Scholar] [CrossRef]
  7. Luding, S.; Clément, E.; Rajchenbach, J.; Duran, J. Simulations of pattern formation in vibrated granular media. Europhys. Lett. 1996, 36, 247. [Google Scholar] [CrossRef]
  8. Brilliantov, N.; Saluena, C.; Schwager, T.; Pöschel, T. Transient structures in a granular gas. Phys. Rev. Lett. 2004, 93, 134301. [Google Scholar] [CrossRef] [PubMed]
  9. Renger, A.; Johnson, K.L. Contact Mechanics; Cambridge Press: Cambridge, UK, 1985. [Google Scholar]
  10. Ji, Z.M.; Chen, Z.J.; Niu, Q.H.; Wang, T.H.; Wang, T.J.; Chen, T.L. A calculation model of the normal coefficient of restitution based on multi-factor interaction experiments. Landslides 2021, 18, 1531–1553. [Google Scholar] [CrossRef]
  11. Weir, G.; Tallon, S. The coefficient of restitution for normal incident, low velocity particle impacts. Chem. Eng. Sci. 2005, 60, 3637–3647. [Google Scholar] [CrossRef]
  12. Cross, R. Enhancing the bounce of a ball. Phys. Teach. 2010, 48, 450–452. [Google Scholar] [CrossRef]
  13. Stevens, A.B.; Hrenya, C.M. Comparison of soft-sphere models to measurements of collision properties during normal impacts. Powder Technol. 2005, 154, 99–109. [Google Scholar] [CrossRef]
  14. Bridges, F.G.; Hatzes, A.; Lin, D.N.C. Structure, stability and evolution of Saturn’s rings. Nature 1984, 309, 333–335. [Google Scholar] [CrossRef]
  15. Minamoto, H.; Kawamura, S. Moderately high speed impact of two identical spheres. Int. J. Impact Eng. 2011, 38, 123–129. [Google Scholar] [CrossRef]
  16. Seifried, R.; Schiehlen, W.; Eberhard, P. Numerical and experimental evaluation of the coefficient of restitution for repeated impacts. Int. J. Impact Eng. 2005, 32, 508–524. [Google Scholar] [CrossRef]
  17. Minamoto, H.; Seifried, R.; Eberhard, P.; Kawamura, S. Experimental and numerical analysis of repeated impacts between two spheres. Appl. Mech. Mater. 2014, 566, 250–255. [Google Scholar] [CrossRef]
  18. Aryaei, A.; Hashemnia, K.; Jafarpur, K. Experimental and numerical study of ball size effect on restitution coefficient in low velocity impacts. Int. J. Impact Eng. 2010, 37, 1037–1044. [Google Scholar] [CrossRef]
  19. Higa, M.; Arakawa, M.; Maeno, N. Size dependence of restitution coefficients of ice in relation to collision strength. Icarus 1998, 133, 310–320. [Google Scholar] [CrossRef]
  20. Coaplen, J.; Stronge, W.J.; Ravani, B. Work equivalent composite coefficient of restitution. Int. J. Impact Eng. 2004, 30, 581–591. [Google Scholar] [CrossRef]
  21. Sandeep, C.S.; Senetakis, K.; Cheung, D.; Choi, C.E.; Wang, Y.; Coop, M.R.; Ng, C.W.W. Experimental study on the coefficient of restitution of grain against block interfaces for natural and engineered materials. Can. Geotech. J. 2021, 58, 35–48. [Google Scholar] [CrossRef]
  22. Jiang, Z.; Du, J.; Rieck, C.; Bück, A.; Tsotsas, E. PTV experiments and DEM simulations of the coefficient of restitution for irregular particles impacting on horizontal substrates. Powder Technol. 2020, 360, 352–365. [Google Scholar] [CrossRef]
  23. Wang, L.; Zheng, Z.; Yu, Y.; Liu, T.; Zhang, Z. Determination of the energetic coefficient of restitution of maize grain based on laboratory experiments and DEM simulations. Powder Technol. 2020, 362, 645–658. [Google Scholar] [CrossRef]
  24. Dahl, S.R.; Clelland, R.; Hrenya, C.M. Three-dimensional, rapid shear flow of particles with continuous size distributions. Powder Technol. 2003, 138, 7–12. [Google Scholar] [CrossRef]
  25. Clelland, R.; Hrenya, C.M. Simulations of a binary-sized mixture of inelastic grains in rapid shear flow. Phys. Rev. E 2002, 65, 031301. [Google Scholar] [CrossRef]
  26. Xiao, E.; Wang, Y.; Li, R.; Zeng, Q.; Yang, H. Feature extraction and prediction of granular flow under obstacle influence. Powder Technol. 2024, 433, 119183. [Google Scholar] [CrossRef]
  27. Dai, H.; Li, Y.; Wang, S.; Li, R.; Yang, H. 3D Measurement of Particle Movement in a Silo Using Magnetic Positioning and Inertial Navigation. IEEE Access. 2024, 3351381. [Google Scholar] [CrossRef]
  28. Yang, M.Y.; Li, R.; Xiu, Y.N.; Zeng, Q.; Ye, X.Y.; Yang, H. The propagation of Quasi-static region during granular impact. Particuology 2023, 83, 1–7. [Google Scholar] [CrossRef]
  29. Okura, Y.; Kitahara, H.; Sammori, T. Fluidization in dry landslides. Eng. Geol. 2000, 56, 347–360. [Google Scholar] [CrossRef]
  30. Rosenkranz, S.; Breitung-Faes, S.; Kwade, A. Experimental investigations and modelling of the ball motion in planetary ball mills. Powder Technol. 2011, 212, 224–230. [Google Scholar] [CrossRef]
  31. Barrios, G.K.; de Carvalho, R.M.; Kwade, A.; Tavares, L.M. Contact parameter estimation for DEM simulation of iron ore pellet handling. Powder Technol. 2013, 248, 84–93. [Google Scholar] [CrossRef]
  32. Makris, N.; Roussos, Y.S. Rocking response of rigid blocks under near-source ground motions. Geotechnique 2000, 50, 243–262. [Google Scholar] [CrossRef]
  33. Li, X.; Dong, M.; Jiang, D.; Li, S.; Shang, Y. The effect of surface roughness on normal restitution coefficient, adhesion force and friction coefficient of the particle-wall collision. Powder Technol. 2020, 362, 17–25. [Google Scholar] [CrossRef]
  34. Brilliantov, N.V.; Spahn, F.; Hertzsch, J.M.; Pöschel, T. Model for collisions in granular gases. Phys. Rev. E 1996, 53, 5382. [Google Scholar] [CrossRef] [PubMed]
  35. Schwager, T.; Pöschel, T. Coefficient of restitution for viscoelastic spheres: The effect of delayed recovery. Phys. Rev. E 2008, 78, 051304. [Google Scholar] [CrossRef] [PubMed]
  36. Miller, G.F.; Pursey, H.; Bullard, E.C. On the partition of energy between elastic waves in a semi-infinite solid. Proc. R. Soc. Lond. Ser. A Math. Phys. Sci. 1995, 233, 55–69. [Google Scholar] [CrossRef]
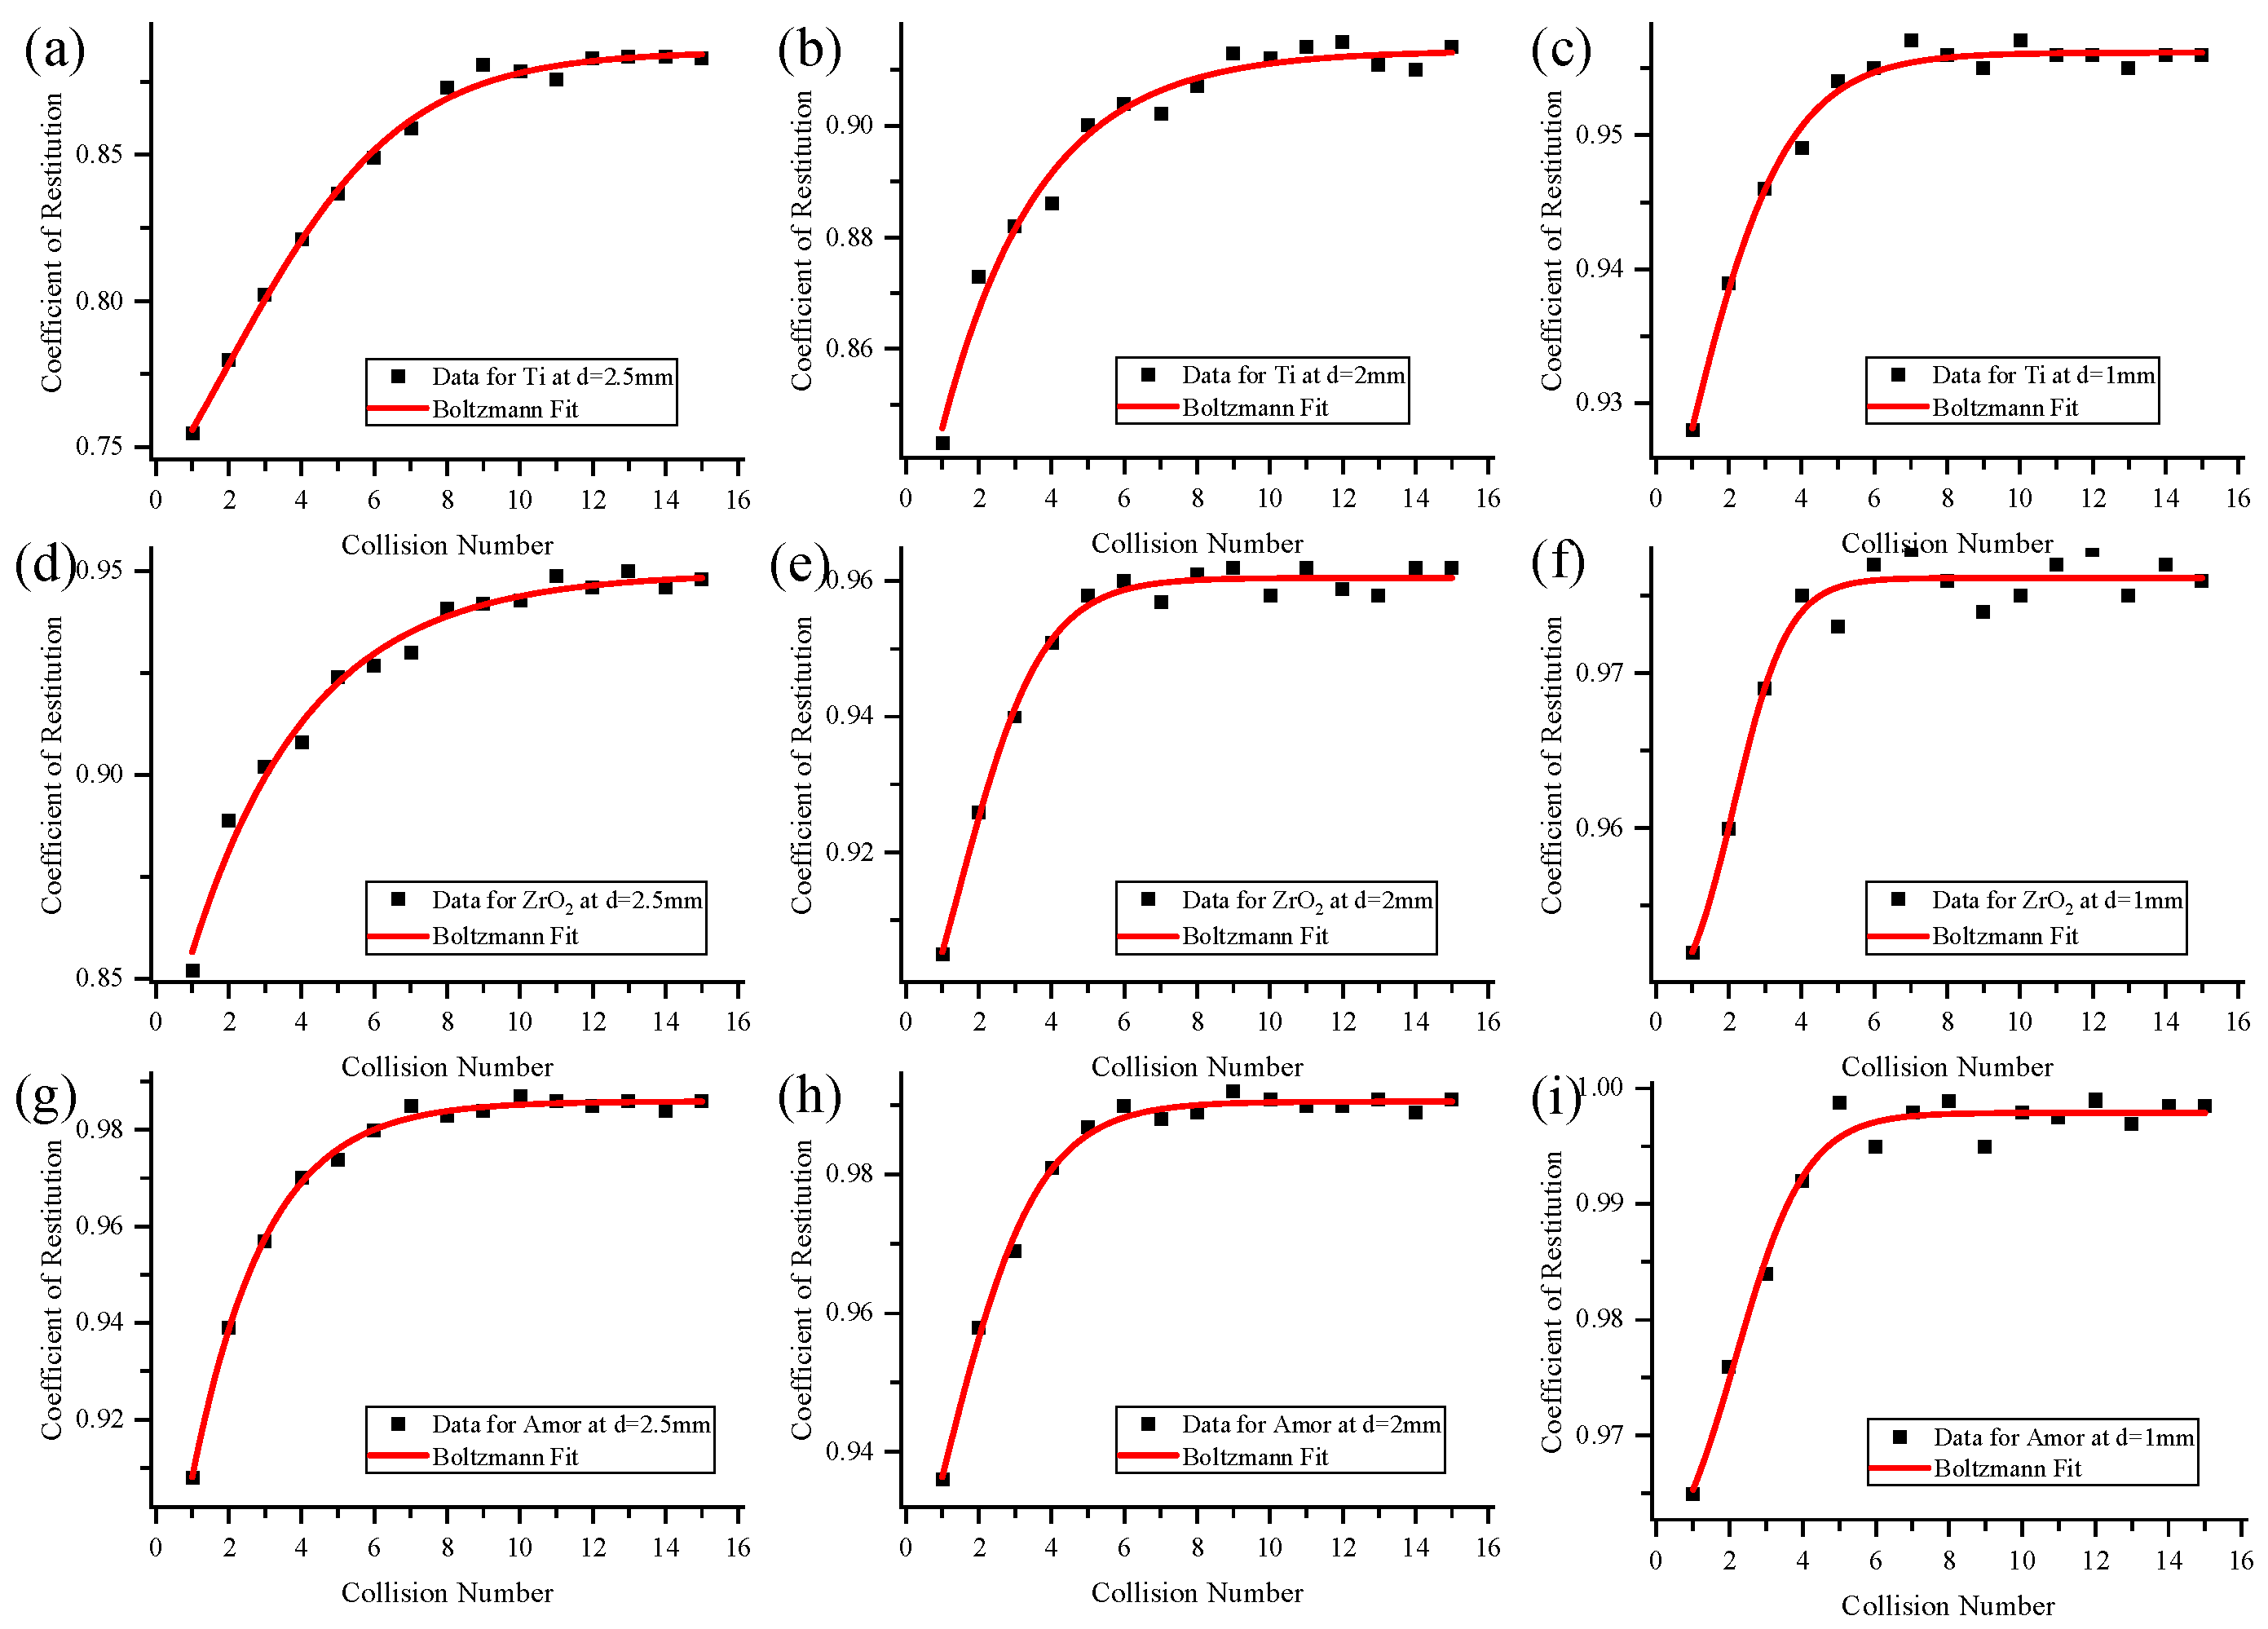
Figure 1. Schematic of the experimental configuration.
Condensedmatter 09 00018 g001
Figure 2. (a) Experimental system diagram. (b) Granular materials: d = 1   m m , 2   m m , 2.5   m m ; Ti, ZrO2, Amor.
Condensedmatter 09 00018 g002
Figure 3. (a). Schematic of the particle–particle collision. (b). Bouncing curve of a sphere with body mass m 2 dropped from height H with initial velocity v 0 = 0 .
Condensedmatter 09 00018 g003
Figure 4. Experimental data for Ti–Ti collision with diameter of 2 mm. (a). Variation in the measured position of Ti with time before collision and its nonlinear fitting curve. (b). Change in measurement position of Ti with time after collision and its nonlinear fitting curve.
Condensedmatter 09 00018 g004
Figure 5. Various stages of the particle-particle collision. (a) Stage of initial drop. (b) Stage of the particle–particle collision. (c,d) Stage of rebound.
Condensedmatter 09 00018 g005
Figure 6. COR of three kinds of particles with diameters of d = 1   m m , 2   m m , 2.5   m m . (a) Ti. (b) ZrO2. (c) Amor.
Condensedmatter 09 00018 g006
Figure 7. The variation trend in the COR of particles as a function of particle diameter.
Condensedmatter 09 00018 g007
Figure 8. The variation trend in COR of amorphous zirconium alloy spheres of diameter 2 mm with impact velocity when collision occurs for the first time.
Condensedmatter 09 00018 g008
Figure 9. (a) Variation trend in the coefficient of restitution of the 1st, 3rd, 6th, and 10th collision of 2 mm amorphous zirconium alloy spheres with impact velocity. (b) Repeated collision results of 2 mm amorphous zirconium alloy spheres under different impact velocities.
Condensedmatter 09 00018 g009
Figure 10. Boltzmann Fit of the experimental data for the COR. (a) Ti at d = 2.5   m m . (b) Ti at d = 2   m m . (c) Ti at d = 1   m m . (d) ZrO2 at d = 2.5   m m . (e) ZrO2 at d = 2   m m . (f) ZrO2 at d = 1   m m . (g) Amor at d = 2.5   m m . (h) Amor at d = 2   m m . (i) Amor at d = 1   m m .
Condensedmatter 09 00018 g010
Figure 11. (a) Conceptual sketch of super-seismic regime. Here, the region of overlap is exaggerated. (b) Conceptual sketch of wave propagation in the elastic regime. Here, the region of overlap is exaggerated. (c) Conceptual sketch showing the approximate region of plastic deformation extending between r = a (the extent of physical overlap) and r = b. (d) Conceptual sketch of particle geometry after separation.
Condensedmatter 09 00018 g011
Table 1. Particle material and size used in the experiment.
MaterialSize (mm)
Ti122.5
ZrO2122.5
Amor122.5
Disclaimer/Publisher’s Note: The statements, opinions and data contained in all publications are solely those of the individual author(s) and contributor(s) and not of MDPI and/or the editor(s). MDPI and/or the editor(s) disclaim responsibility for any injury to people or property resulting from any ideas, methods, instructions or products referred to in the content.

