Article

Enhancing Performances of the VOXES Bragg Spectrometer for XES Investigations

1
INFN, Laboratori Nazionali di Frascati, Via E. Fermi 54, I-00044 Rome, Italy
2
The M. Smoluchowski Institute of Physics, Jagiellonian University, 30-348 Kraków, Poland
3
Centro Ricerche Enrico Fermi—Museo Storico della Fisica e Centro Studi e Ricerche “Enrico Fermi”, Via Panisperna 89a, I-00184 Rome, Italy
4
IFIN-HH, Institutul National pentru Fizica si Inginerie Nucleara Horia Hulubei, 077125 Măgurele, Romania
*
Author to whom correspondence should be addressed.
Condens. Matter 2024, 9(1), 19; https://doi.org/10.3390/condmat9010019
Submission received: 25 January 2024 / Revised: 26 February 2024 / Accepted: 29 February 2024 / Published: 7 March 2024

Abstract

:
Utilizing a dispersive crystal for X-ray Emission Spectroscopy (XES) significantly enhances the energy resolution when compared with spectroscopy performed with just silicon drift detectors. This high resolution is particularly valuable for studying metals, as it offers essential insights into their electronic structures and chemical environments. Conducting such experiments in the laboratory, as opposed to synchrotron light sources, presents challenges due to the reduced intensities of X-ray tubes and, consequently, low signal rates, with the effect of increasing the acquisition time. In this study, we demonstrate that XES spectra can be acquired within a few hours for a CuNiZn metallic sample alloy while still maintaining a good energy resolution and a large dynamic range. This is achieved with the VOXES spectrometer, developed at INFN National Laboratories of Frascati (LNF), along with a background reduction procedure that enhances the signal from emission lines under study. This study is a showcase for improving the efficiency of XES in tabletop setup experiments.
Keywords:
XES; mosaic crystal; HAPG

1. Introduction

Light–matter interaction at X-ray energies can manifest through various mechanisms [1], offering diverse insights into the material under examination. Specifically, the absorption and emission of X-rays can provide similar or complementary information about the elements present within the sample and their properties.
High-Resolution X-ray Emission Spectroscopy (XES) [2] has been established as a technique for extracting valuable information about atoms and their chemical surroundings. XES is particularly valuable for metals, especially transition elements, as it does not only indicate their presence in the material but also provides information regarding their valence spin state [3], coordination chemistry [4], and ligand properties [5].
For instance, the core-to-core emission from the 2p to the 1s state, the K α line, based on its strong fluorescence yield, is a standard indicator for extracting information about a metal’s presence. Further insight can be extracted from the K α line [6], like the spin–orbit coupling and Auger effect. The emission from the 3p to the 1s, the K β , represents a richer source of information about the metal’s state. Indeed, due to the exchange splitting interaction between the 3p and 3d electrons, it exhibits a stronger sensitivity towards both the spin states and the chemical coordination of the metal. This information can be deduced by analyzing the complex and intricate lineshape of the K β , which is a combination of several peaks, as a result of the correlation between electrons. In the simplest scenario, the lineshape can be decomposed into two primary peaks: the main peak, the K β 1 , 3 , and a shoulder, the K β , about 10 eV below the K β 1 , 3 . The latter determines the spin sensitivity of the K β , as its prominence relative to the lineshape is sensitive to the number of unpaired electrons and, therefore, to high or low spin configurations of the metal [7]. At higher energies, close to K β 1 , 3 , an additional peak is present: the K β 2 , 5 , characterized by reduced intensity. It is determined by valence to core transitions and hence is strongly influenced by the chemical coordination of the metal.
XES’s possibility to probe the local electronic structure and magnetic and chemical properties of the chemical element finds several applications in various fields, particularly in the characterization of metals, for instance, in coordination chemistry [8], where this method plays an important role in explaining the electronic states of metal complexes and understanding the coordination environment around metal ions. Additionally, in materials science, it aids in the comprehensive characterization of metallic materials, while in catalysis [9], it helps in understanding the intricate electronic structures of metal catalysts, providing crucial insights into their reactivity and catalytic mechanisms.
In XES experiments, it is required to excite the sample and induce the transition of electrons down to deeply bound core states. The initial excitation can be achieved, for instance, using X-rays, electrons, or protons. The typical X-ray sources are the synchrotron light ones, which, thanks to their large intensity over a broad energy range, enable the acquisition of XES spectra in a reduced amount of time. In recent decades, there have been a growing number of attempts to enhance the efficiency of such experiments when conducted in the laboratory. In this context, the source is an X-ray tube [10] that possesses a lower effective intensity, as most of the power is dissipated as heat, which results in an increased acquisition time.
Detecting the emitted X-rays is also crucial in order to extract the properties mentioned before. In this context, an extremely good resolution is needed to resolve the emission lines. For this purpose, an energy resolution at a few eV level is required at keV energies. Silicon Drift Detectors (SDD) [11], which possess an intrinsic resolution (FWHM) of about 120 eV at 6 keV, are not able to finely resolve emission lines but only distinguish the K α and K β for a given metal. Transition Edge Sensors [12], instead, can be used to finely resolve the emission line based on a few eV resolutions at 6 keV [13]. The drawback of such detectors is their high cost due to the required operating temperature of about 50 mK.
Alternatively, exploiting Bragg’s law to monochromate the emitted X-ray with a crystal is the standard approach to obtain high-resolution XES spectra. Various crystal geometries and combinations of crystals have been employed, such as Von Hamos [14] and Johann/Johansson configurations [15]. Additionally, utilizing mosaic crystals [16] offers the possibility to extend the energy’s dynamic range for the XES spectra. Due to the presence of microcrystallites with different crystal orientations, a mosaic crystal can deflect a range of X-rays around the selected energy; this effect is quantified by their mosaicity value. The critical aspect of employing mosaic crystals is the nontrivial calibration needed to relate the energy of the emitted X-ray to its position in space on a strip detector or on the hit pixel for a CCD [17].
Efforts to enhance the efficiency of XES measurements in the laboratory have been pursued with the VOXES spectrometer, developed and optimized at the National Laboratory of Frascati (LNF) of INFN [18,19,20]. The setup is using an X-ray tube and HAPG crystal in the Von Hamos configuration, which makes it possible to acquire XES spectra for both solid and liquid samples in a few hours, thanks to the possibility of effectively shaping the emitted X-rays with two slits. This has the effect of increasing the effective source size up to the order of mm and enhancing the overall signal rates. It’s important to note that there is always an intrinsic trade-off between the collected intensity and energy resolution, which varies depending on the required application. With such improvements, VOXES still maintains an energy resolution below 10 eV in the range of 4–12 keV.
In this work, we showcase the potential of utilizing the VOXES setup to efficiently acquire XES spectra in a reduced amount of time. As a demonstration, we discuss the spectrum of a CuNiZn alloy, captured in one hour of acquisition time. This represents a significant reduction in the typical duration required for a tabletop setup, especially considering that peak rates in these experiments usually fall within the Hz range. The spectrum has a large dynamical range of 600 eV and a good energy resolution (FWHM) of less than 10 eV at 8 keV, allowing the simultaneous examination of multiple emission peaks from the three distinct elements of the alloy. Such properties are possible thanks to a refined background reduction procedure applied to the spectrum.
We show that we can effectively clean the spectrum with this procedure, enhancing the signal-to-background ratio of the emission lines under investigation. We then discuss the energy calibration and further explore the possibility of calibrating the spectrum without the inclusion of the nickel line.
The paper is structured as follows. Section 2 provides details about the experimental apparatus and the spectrum acquisition. In Section 3, the spectrum of the CuNiZn alloy is first presented. Subsequently, the procedure for background reduction is outlined, together with the determination of the calibration function and a comparison with the reference energy values of the emission lines. Section 4 concludes the paper and outlines possible future directions for the employed methods.

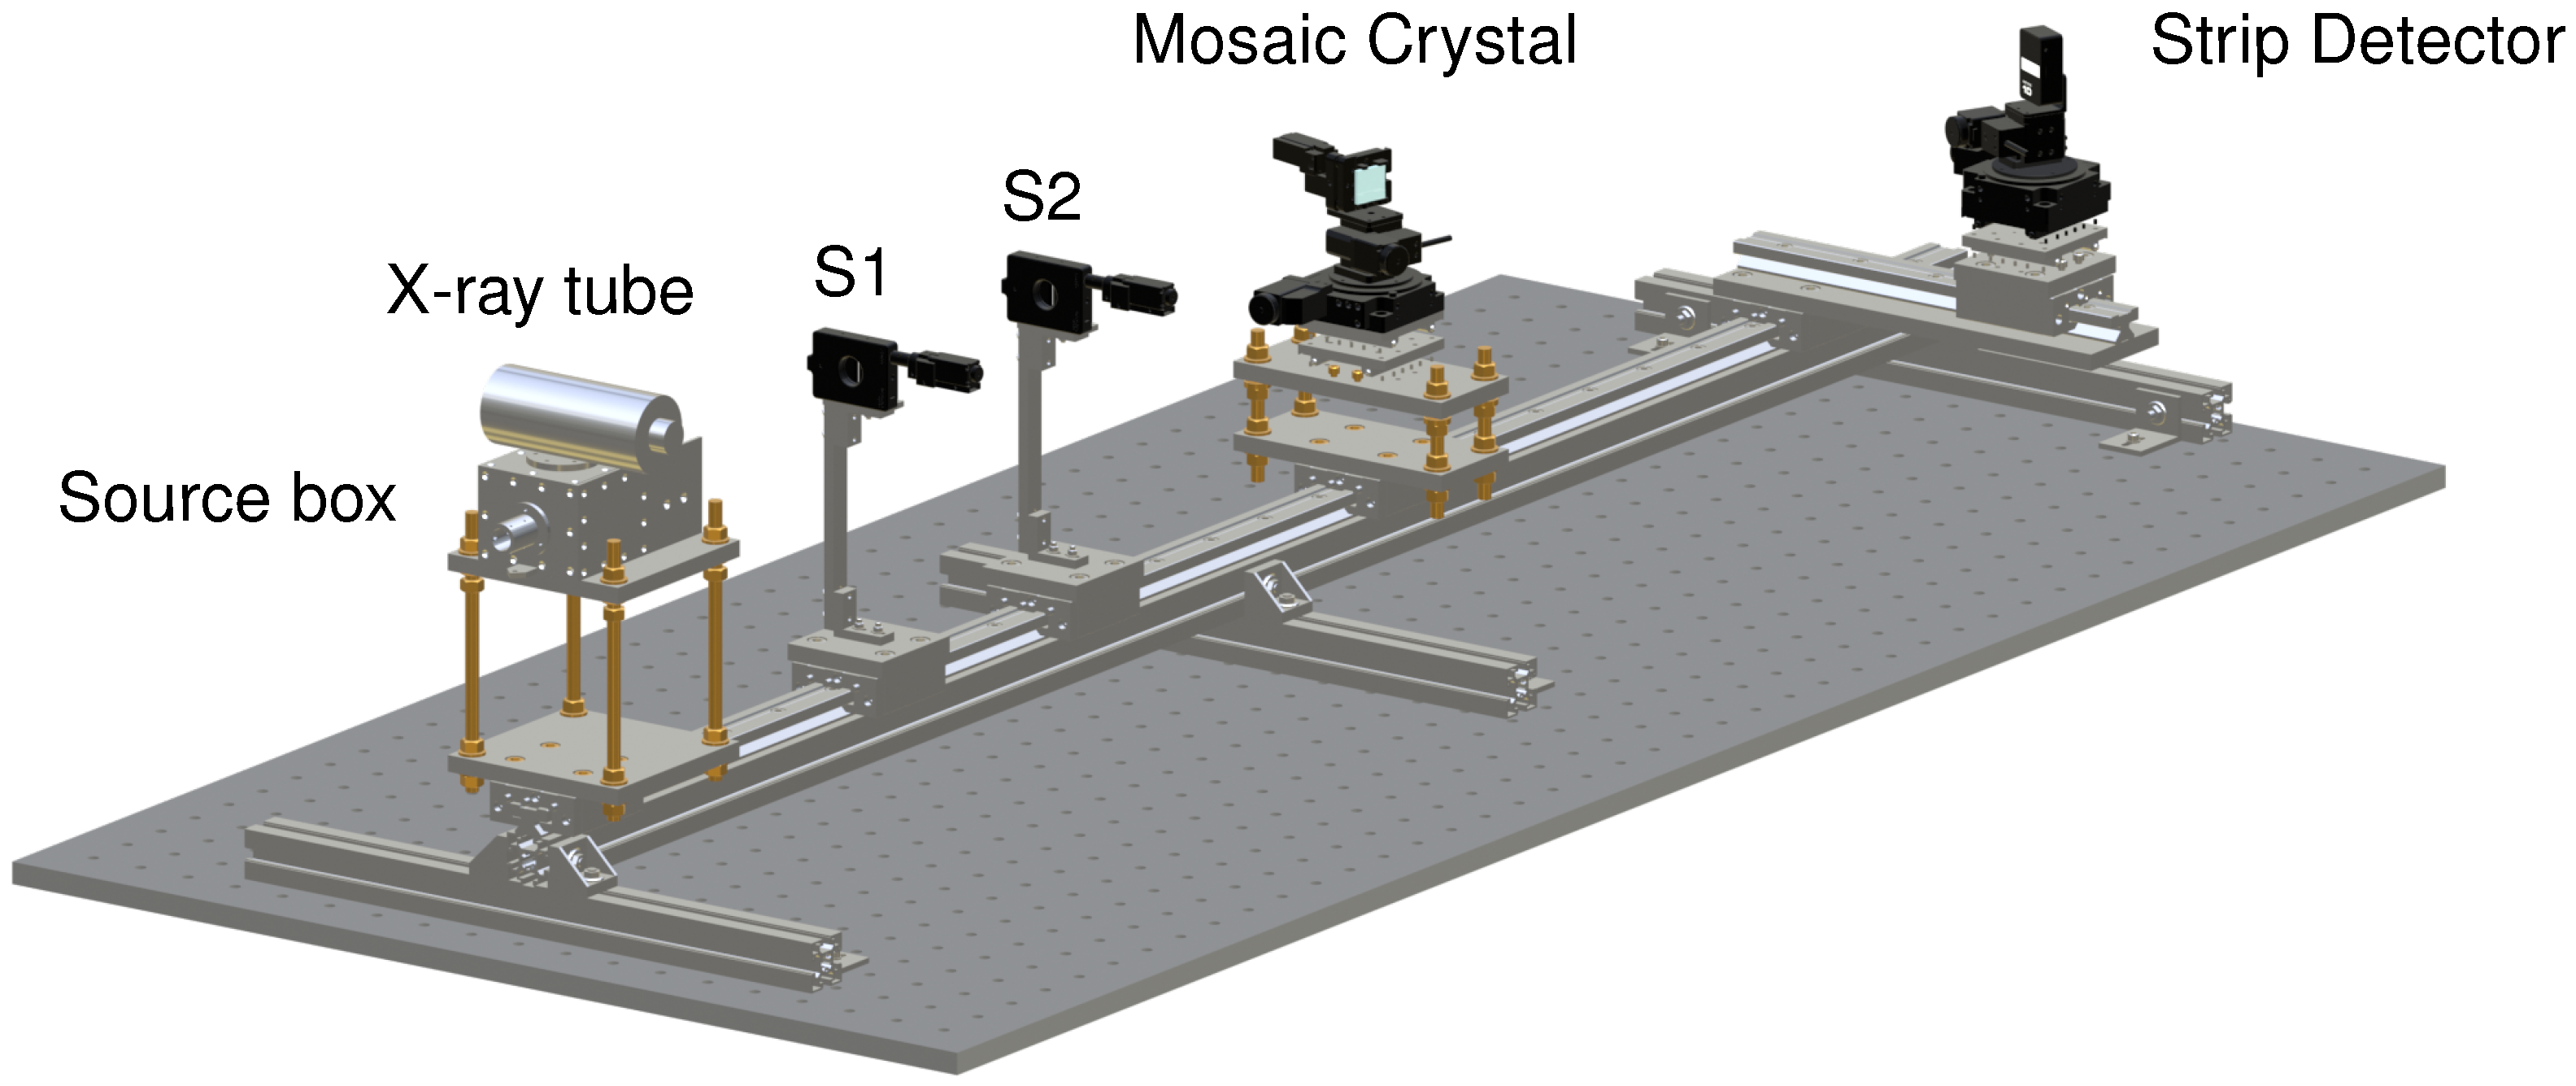
2. Setup and Methods

For the measurements reported in this paper, we utilized the VOXES spectrometer, as already discussed in our earlier works [18,19]; additional details can be found in those references. As depicted in Figure 1, VOXES operates in air and it consists of four main components. A source box accommodates the sample and houses an OXFORD XTF-5011 X-ray tube, whose anode is made of tungsten. A slit system with two STANDA slits, denoted as S1 and S2, is used to shape the X-rays from the source box, required to enlarge the effective source size, which impacts the resulting energy resolution and recorded rate of the spectrum. For this study, the selected values for S0′ and angular acceptance Δ θ were 1.0 mm and 0.4°, respectively, as defined in the referenced literature. A HAPG mosaic crystal made of pyrolytic graphite with a declared mosaicity of 0.1 ± 0.01, a thickness measuring 100 μ m, and a curvature radius ρ c = 206.7 mm was used. Finally, a MYTHEN2 strip detector, manufactured by DECTRIS, with an active area of 32 × 8 mm2, equally divided into 640 strips, each with a depth of 450 μ m and 50 μ m pitch, was used for X-ray detection.
Movements for aligning the crystal and the detector to the specific emission line angle θ B are facilitated by FESTO electrical motors. For more precise adjustments, a 5-axis system from STANDA controls the positioning of both the crystal and detector. The CuNiZn sample used in this experiment is produced by Goodfellow and consists of 64% Cu, 24% Ni, and 12% Zn. It has dimensions of 25 × 25 mm and a thickness of 100 μ m.
During the spectrum acquisition, the X-ray tube operated with an applied current of 500 μ A and a voltage of 20 kV. The acquisition lasted one hour and was divided into one-second frames, during which counts over the detector strips were collected. The frame duration was optimized to ensure a sufficient number of events to allow the background reduction procedure described in the next section.

3. Results and Discussion

In this section, we present the results obtained for the CuNiZn alloy. The procedure for the background reduction is outlined, together with the description of the methodology used for calibrating the spectrum.

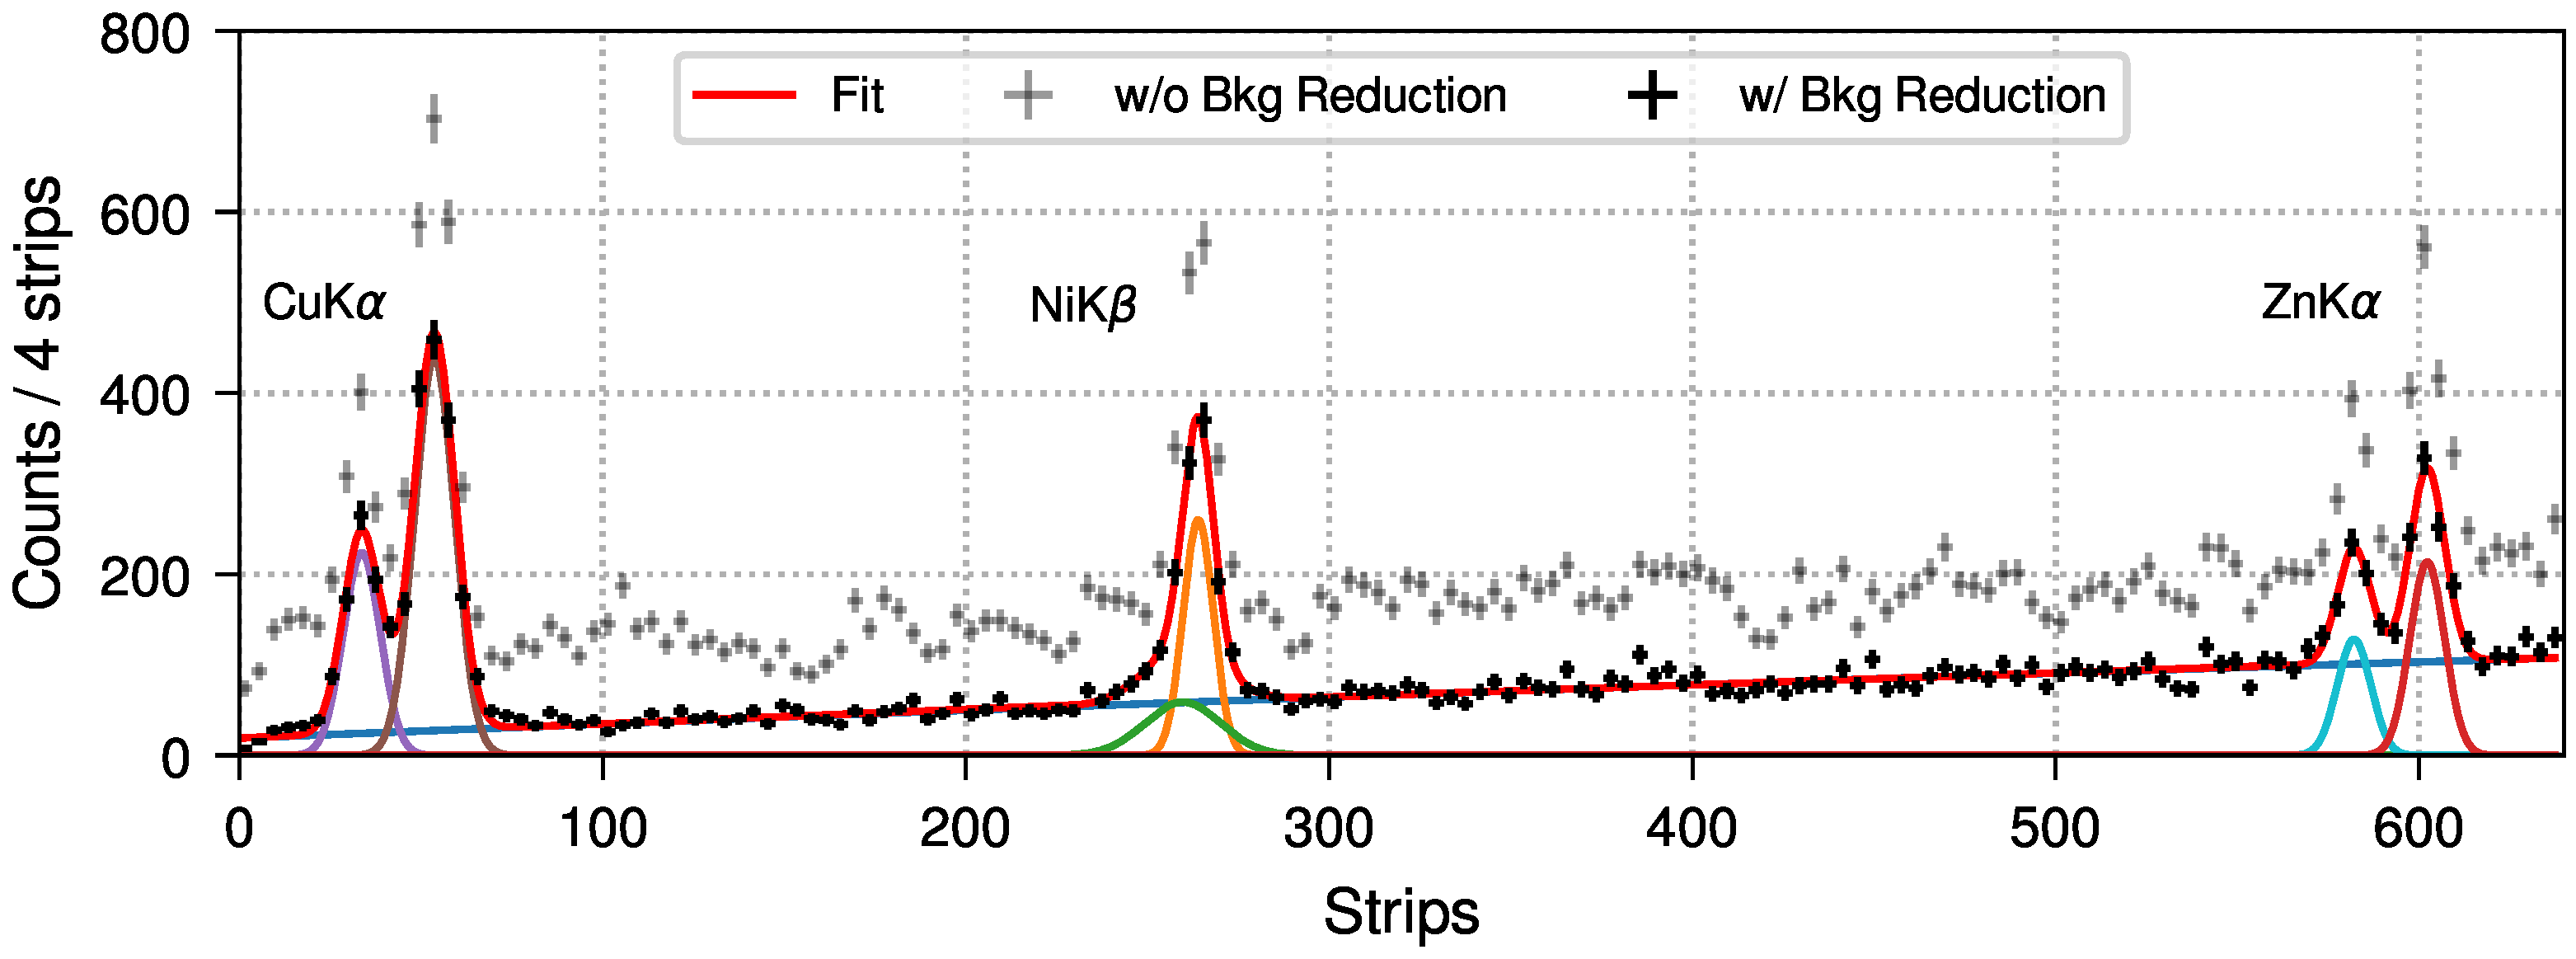
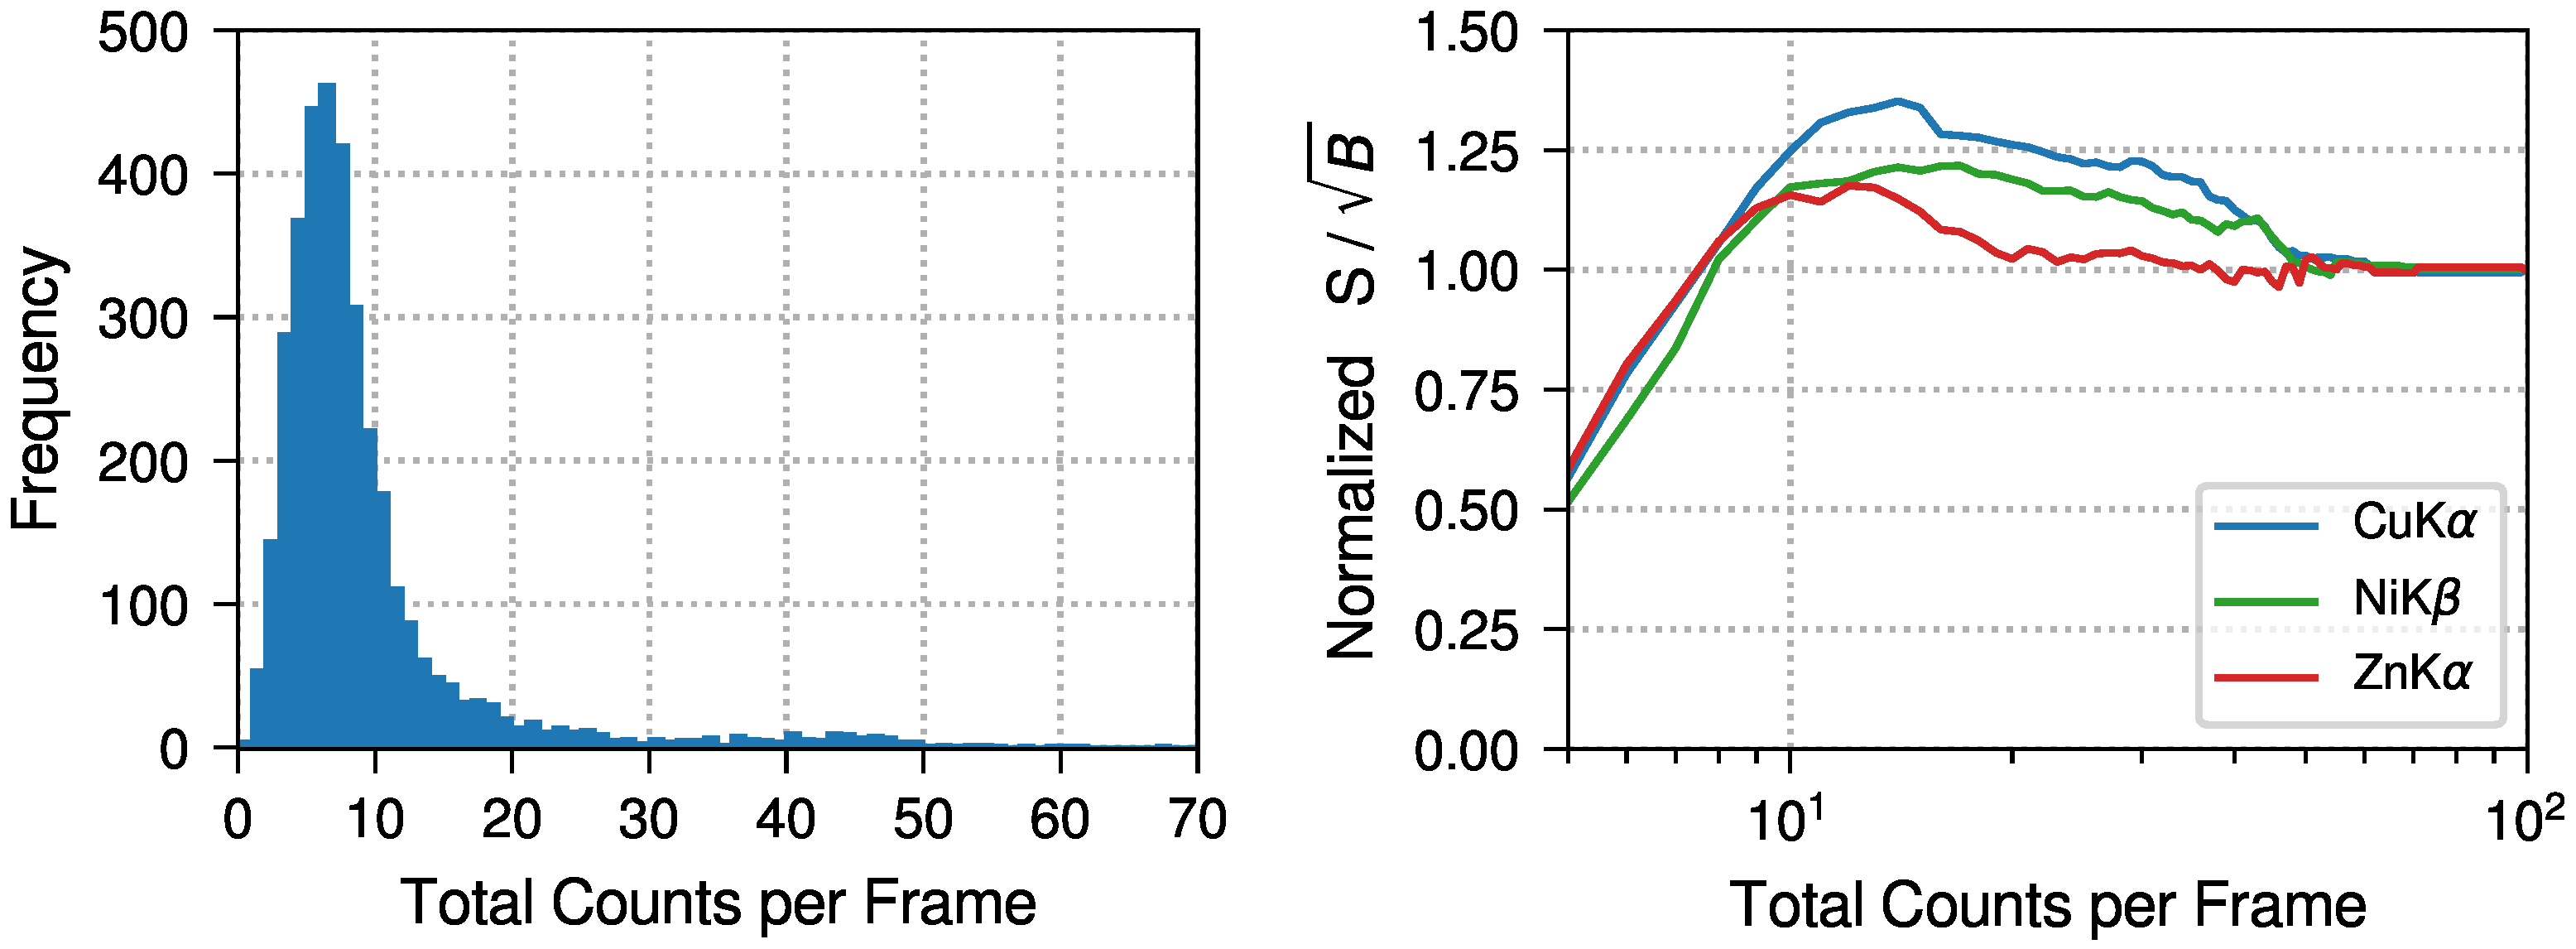
3.1. Background Reduction

The CuNiZn XES spectrum exhibits three principal emission lines (see Figure 2), namely the copper’s K α , the nickel’s K β , and zinc’s K α . The spectra before and after background reduction are displayed in Figure 2, where the data from 640 strips are rebinned four times and the fit is performed on the background-subtracted spectrum. Due to the resolution at FWHM below 10 eV at 8 keV of our configuration, the K α lines are well-approximated with two Gaussians for K α 1 and K α 2 . For the K β line of nickel, we utilized a sum of two gaussians for the K β 1 , 3 and K β peaks. The latter is justified by the emerging asymmetric profile of the K β at lower energies.
The idea behind the background reduction stems from the fact that three types of events are possible during the acquisition: from emission lines of interest, specifically from the lines of the elements of the alloy, from random events caused by thermal fluctuations or from cosmic rays, which are consistently present, and from artifacts in the electronics of the detector, such as crosstalk among different strips.
Here, we outline a procedure specifically designed to clean the spectra, aiming to preserve the expected physical properties of the emission peaks. During the hour-long acquisition, we analyzed the distribution of Total Counts per Frame (TCF) across the strips for each frame, identifying a main peak and a tail, as depicted in Figure 3. By selecting only those frames where the number of counts in the spectrum exceeds a certain threshold, we effectively reduced the background. This is demonstrated in Figure 2, where the raw spectrum is shown in gray, and the spectrum with a TCF threshold set to 10 appears in black. This approach results in a minimal reduction in the overall intensity of the peaks of interest, while effectively enhancing the signal from the emission peaks relative to the background.
To further illustrate this procedure, we performed a fit for each TCF value, as shown in Figure 3. Here, the ratio of the number of events for the three lines over the background events is plotted as a function of TCF. For clarity, signal-to-background ratios corresponding to the same emission line are combined (i.e., K α 1 and K α 2 to K α ), and the ratios are normalized to the value without a threshold. Notably, the application of a TCF threshold leads to an immediate increase in these ratios, indicating that most of the background events are effectively removed. For low values, there’s an observable enhancement in the ratios before they decline at smaller TCF values, where events are removed more uniformly across the spectrum. To identify the optimal threshold value, as detailed in the following section, we chose the value that, after the energy calibration, aligns the peaks more closely to their reference values in the literature. For an unknown sample with unidentified elements, one approach could involve fitting the distribution of total counts and selecting frames that fall within 1 or 2 standard deviations (sigma) from the distribution’s mean.

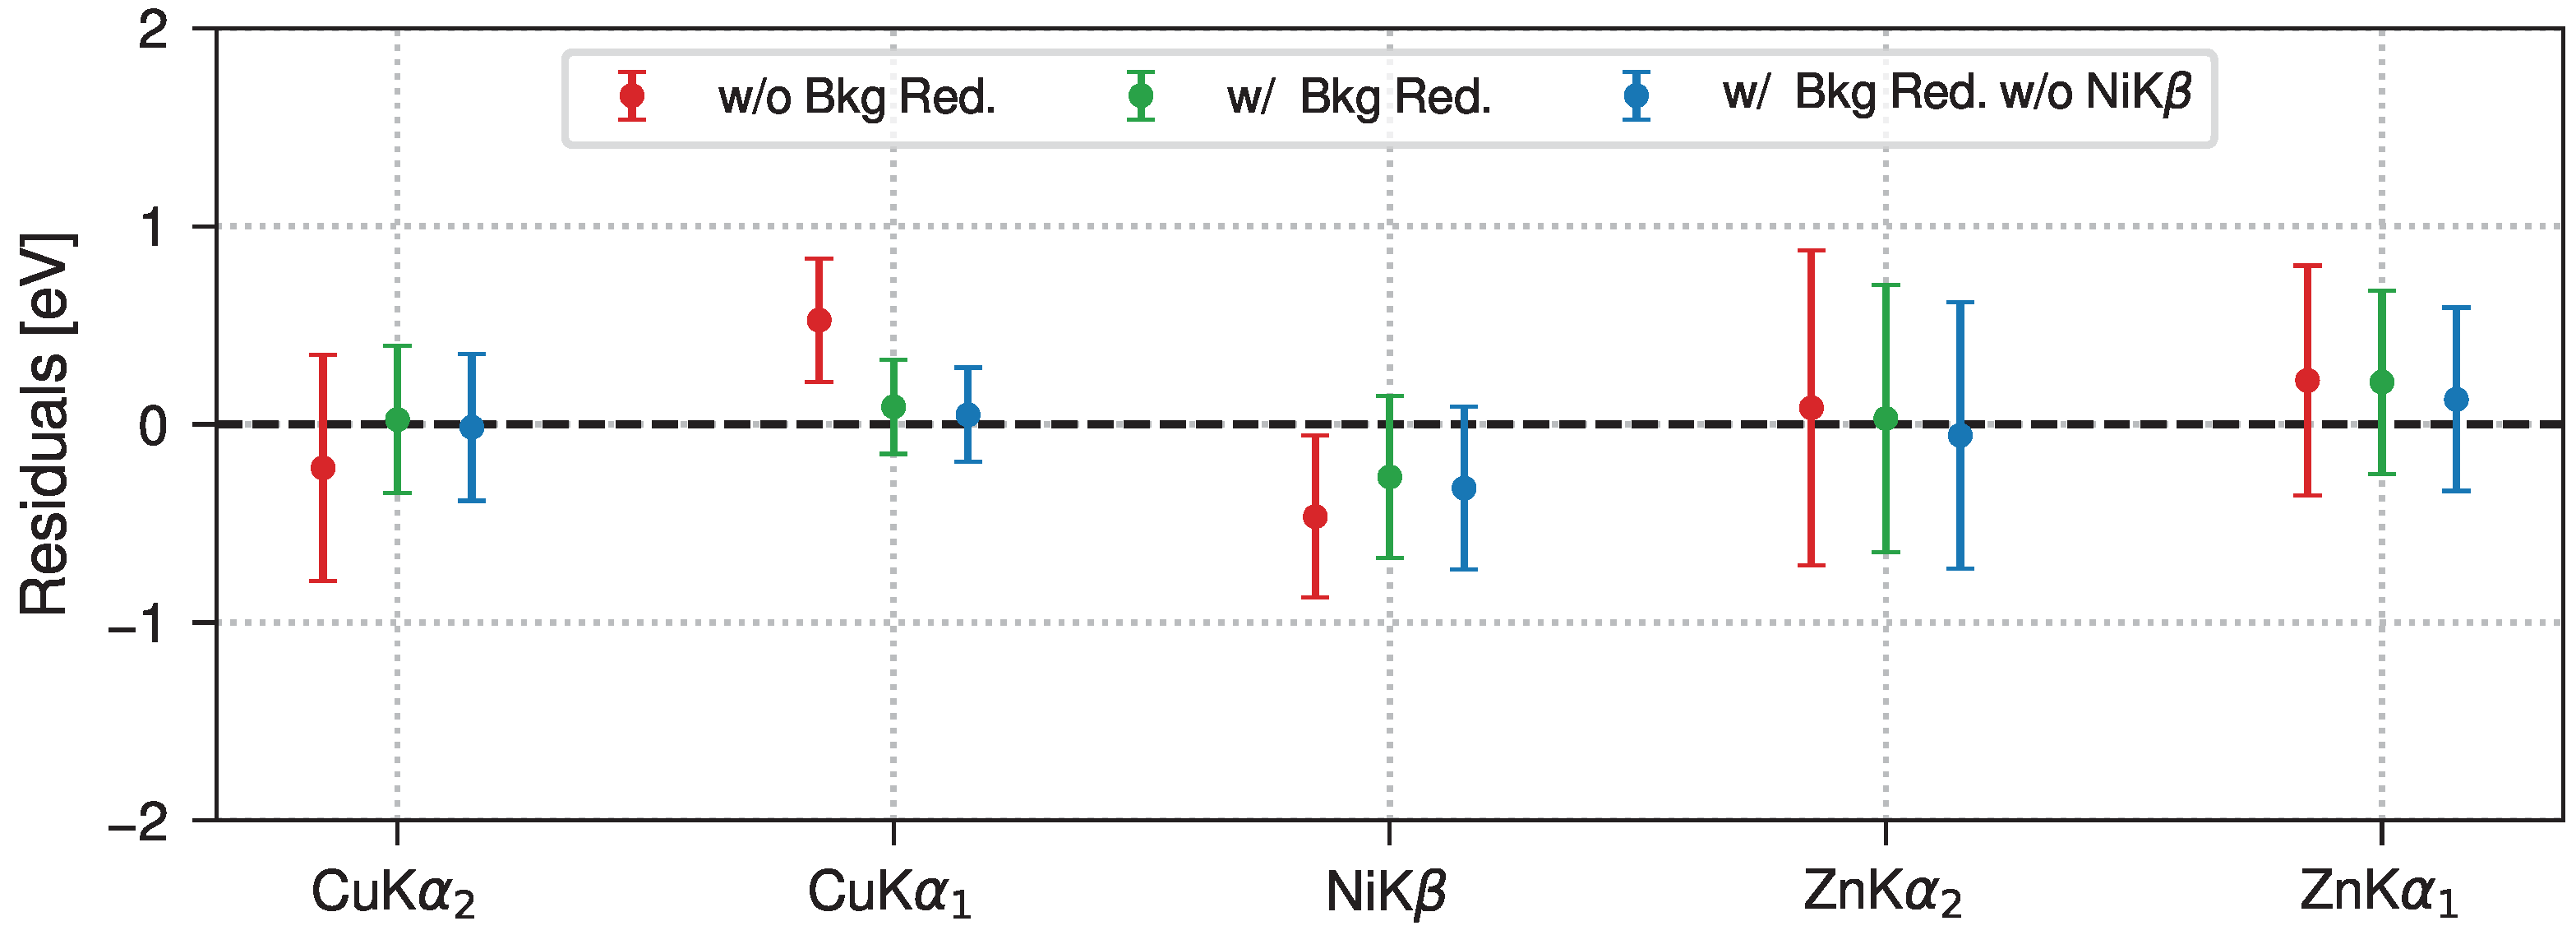
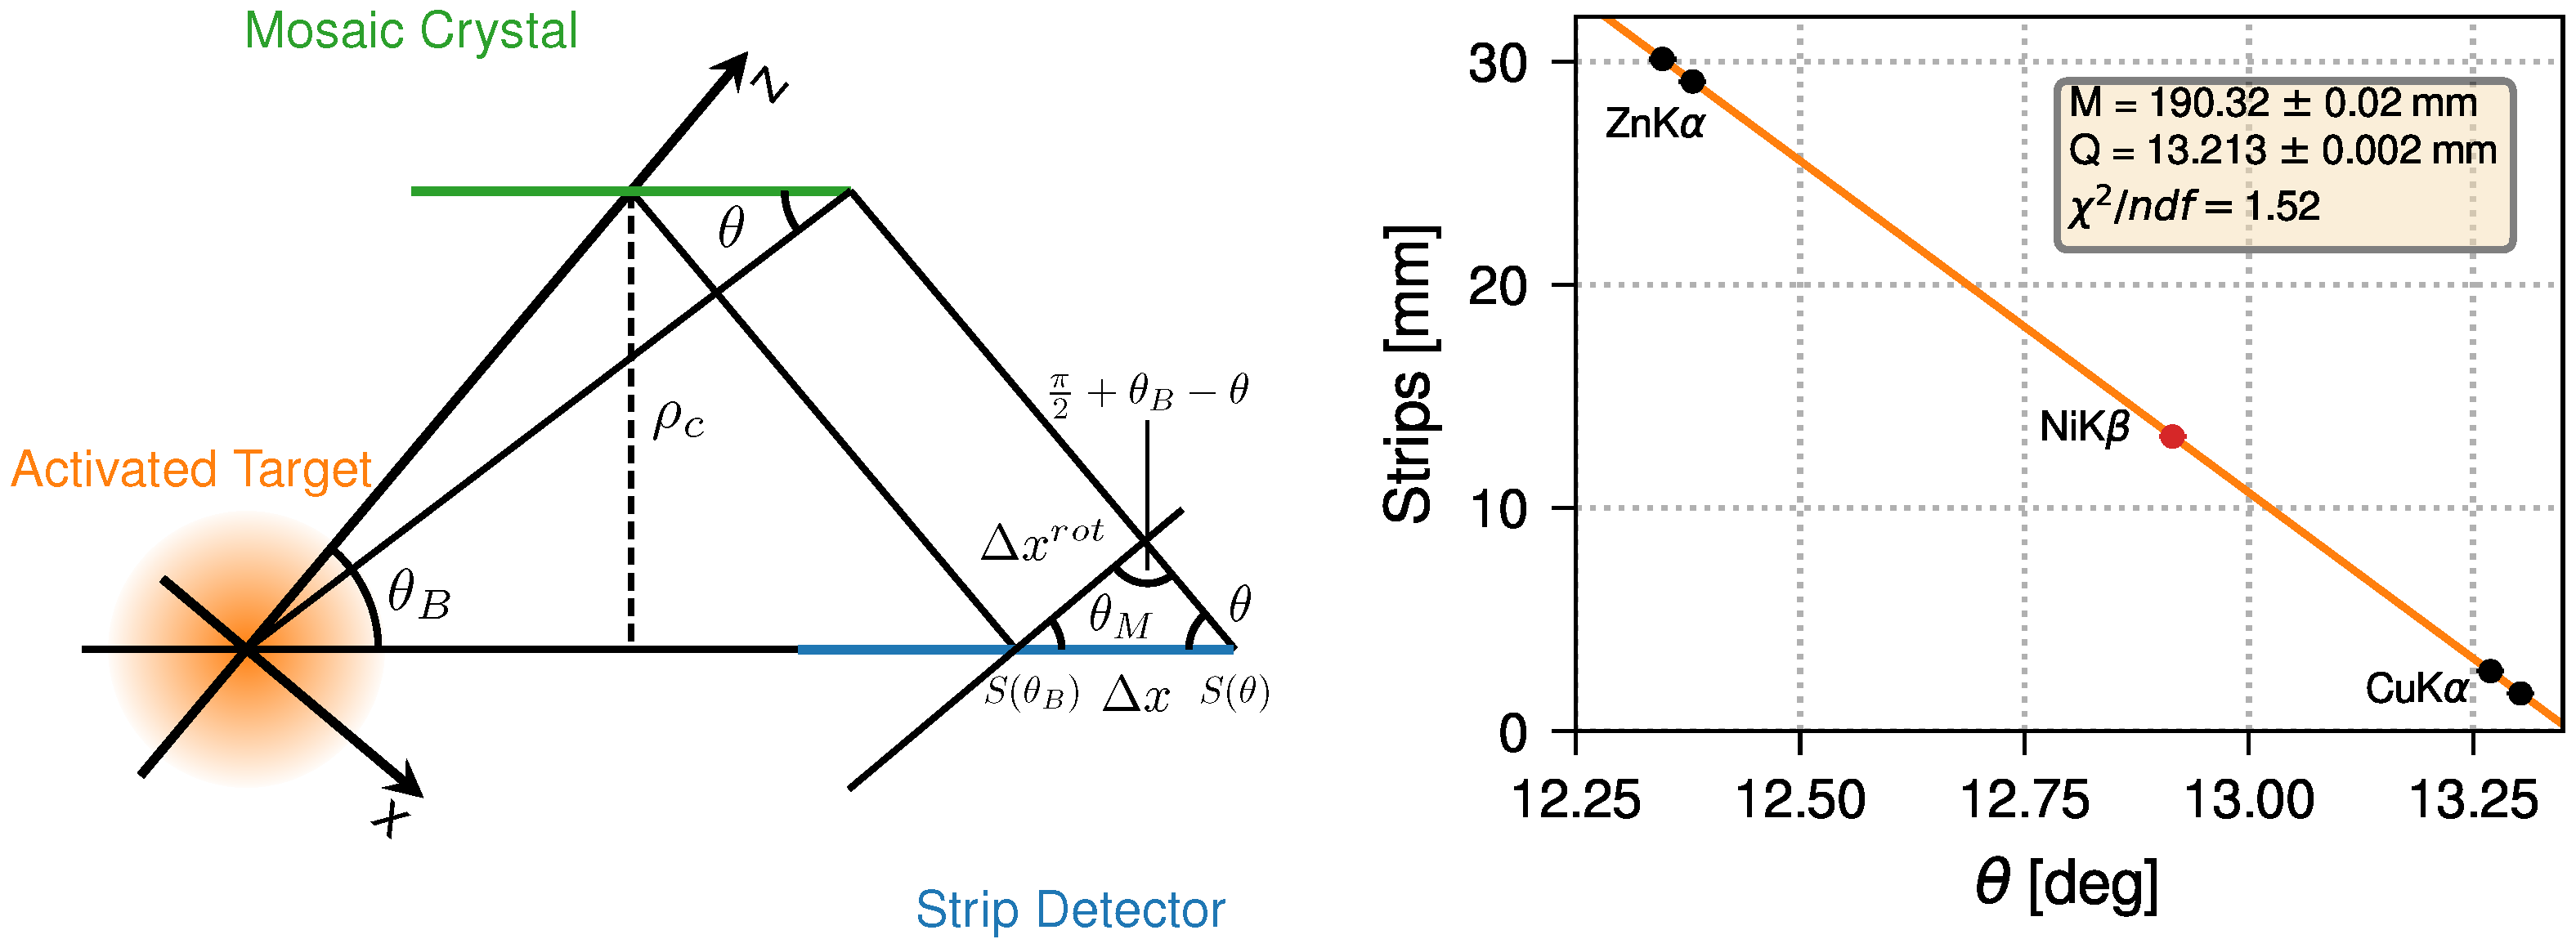
3.2. Energy Calibration

The calibration of XES spectra was largely discussed in our previous works [19]. In this current study, we refined the calibration function, and we conducted further calibrations to determine the optimal threshold value for the background reduction procedure. This involved finding the threshold value that reduces the difference between the energy positions of the calibrated peaks and their reference values.
The geometry required for defining a calibration function is depicted in Figure 4, illustrating all the key elements of the VOXES setup: an extended source, a mosaic crystal with curvature radius ρ c , and a position strip detector. Photons matching the exact energy of the line of interest possess the correct Bragg angle θ B , and they are deflected to hit the detector at the nominal position S ( θ B ) . In this case, we focused on the K β of nickel, which results in a θ B = 12.75°. Due to the mosaic nature of the crystal, photons without the proper orientation are also impinging on the detector. The position of a general photon on the detector is denoted by S ( θ ) .
Exploiting the fact that these positions on the detector, as a function of the curvature radius of the crystal and the angle of deflection, are S ( θ B ) = 2 ρ c cot θ B and S ( θ ) = 2 ρ c cot θ , the difference between the distances on a plane parallel to the crystal is Δ x , and it is equal to
Δ x ( θ ) = 2 ρ c ( cot ( θ ) cot ( θ B ) )
where we adopted a definition for the sign of Δ x to establish the correct inverse proportionality between the distance Δ x and the angle θ . On the rotated plane where the detector is positioned, this distance is transformed (utilizing the law of sines) to
Δ x r o t ( θ ) = [ 2 ρ c ( cot ( θ ) cot ( θ B ) ) ] sin ( θ ) cos ( θ θ B )
The latter equation relates (and unequivocally identifies) the angle of the photon to the position on the detector. The conversion from angle to energy is then performed with the usual Bragg’s law, λ = 2 d sin θ , where, for the mosaic crystal, d = 3.356 Å. To use such a formula for our case, two modifications are needed. First, there should be an offset term because we positioned our detector to have all three lines in the spectrum. This has the effect that the distance Δ x r o t ( θ ) is not zero for θ = θ B . Another aspect is related to the alignment of the experiment. We rotated the crystal around the nominal angle θ B N i and the detector perpendicular to that, but due to the non-linear behavior of the mosaic crystal, even small misalignments produce large displacements in the position of X-rays on the detector. To account for this effect, we introduced a scaling parameter M in the calibration function, which takes into account this aspect. The employed calibration function is then
Δ x r o t ( θ ; M , Q ) = [ 2 M ( cot ( θ ) cot ( θ B ) ) ] sin ( θ ) cos ( θ θ B ) + Q
The scaling parameter M and offset Q have units of measurement in mm, and we determine their values with a fit between the reference energies (expressed as angles) of the peaks and their position on the detector. This process involves converting values from strips to millimeters, with the understanding that each strip measures 50 μ m. The reference energies for the emission lines were taken from xraylib [21], namely E K α 2 Cu = 8027.9 eV, E K α 1 Cu = 8047.8 eV, E K β 1 , 3 Ni = 8264.7 eV, E K α 2 Zn = 8615.8 eV, and E K α 1 Cu = 8638.9 eV.
We performed two types of calibrations, with and without the inclusion of the nickel K β line in the fit. This was done because the K β 1 , 3 position may vary in general, as was largely discussed in the first section, and it makes it not really suitable for the determination of the calibration function. In the end, we compared the energies of the peaks with the reference values using the two approaches to estimate the systematic errors for not including the nickel K β line.
As the two functions are nearly indistinguishable, we report only the fit of the calibration function for the case without the inclusion of the nickel K β , as shown in Figure 4. From the fit, just using the K α line’s peak’s position (black dots), it is possible to recover the K β position (red dot). For the offset term Q, we recovered the position in space of the nickel K β , as expected. For the scaling parameter M, we found the value of 195.32 ± 0.02 mm. This value is, remarkably, within 5% of the crystal’s nominal radius of curvature ρ c , a measure of the fact that our configuration is almost perfectly aligned.
To validate the accuracy of the approach, we computed residuals between the reference energy peaks and the center position by fitting the calibrated spectra. In Figure 5, the residuals before and after the background reduction are reported. The threshold value employed to filter the frame was 10 counts, as it gives the smallest residuals, and, with this value, there is still a gain in the signal-to-background ratio. The effect of the background reduction is to center the residuals around zero, but, most importantly, to reduce, on average by 30%, the uncertainties over the residuals and, therefore, over the position of the peak. The difference is also qualitative, as the background reduction is also able to reveal the asymmetric structure of the K β of nickel. Additionally, we also calculated the residuals for the case where the K β of nickel is not included, and the residuals are still within 0.1 eV with respect to the case where all the lines were included.

4. Conclusions and Outlook

In this paper, we reported a combined procedure that allows for the obtaining of high-resolution XES spectra with a reduced acquisition time. This was done by developing a background reduction procedure that permits cleaning the spectra and enhancing the emission peaks under examination. We used Bragg spectroscopy with the VOXES setup at INFN LNF, and we showcase the emission lines from a CuNiZn alloy. In the region of interest of our spectrum, there are the K α lines of copper and zinc and K β of nickel. The background reduction was made possible by analyzing the distribution of the total number of counts for each frame of the acquisition. We demonstrated that applying a threshold to the total counts per frame qualitatively cleans the spectrum. This is clear from the reduced background noise and from the fact that it reveals the typical asymmetric structure of the K β line of nickel. We also measured the effect of the background quantitatively by calculating the signal-to-background ratio of the emission peaks as a function of the total number of counts for every frame. The ratios increased when frames with counts below a certain threshold were selected, and we determined an optimal threshold of 10 total counts per frame, as it minimizes the residuals between the calibrated peaks and their reference values. This procedure further enhances the precision of the calibrated spectrum by reducing, on average by 30%, the uncertainties associated with the peak centers of the emission lines, compared with the spectrum obtained without background reduction.
Further improvements are possible. For instance, adjusting the two slits can improve the energy resolution, despite reducing the emission rate and therefore increasing the acquisition time. This approach could even lead to fully resolving the lineshape by achieving precision below the intrinsic linewidth of the peaks. Further aspects to explore include refining the parameters for the calibration function to maintain a parameter-free calibration function. These refinements would significantly improve the consistency and reproducibility of our results and show the utility of XES in tabletop experiments for exploring the emission lines of metals.

Author Contributions

Conceptualization, A.S.; methodology, S.M., D.S., A.C., K.P., G.M. and A.S.; software, S.M., K.P., A.C., D.S. and F.N.; formal analysis, S.M., F.N., G.M. and D.S.; investigation, S.M. and A.S.; writing—original draft preparation, S.M.; writing—review and editing, S.M., F.N., C.C. and A.S.; supervision, A.S., C.C. and F.N.; project administration, A.S. and C.C.; funding acquisition, A.S. and C.C. All authors have read and agreed to the published version of the manuscript.

Funding

MITIQO project n. A0375-2020-36647 from regione Lazio. VOXES was supported by the 5th National Scientific Committee of INFN in the framework of the Young Researcher Grant 2015, no. 17367/2015. This project has received funding from the European Union’s Horizon 2020 research and innovation programme EU STRONG-2020, under grant agreement No. 824093 and with the support of Grant No. 62099 (QUBO Project) from the John Templeton Foundation.

Data Availability Statement

The data presented in this study are available on request from the corresponding author.

Acknowledgments

We thank C. Capoccia and G. Fuga from LNF-INFN for their fundamental contribution in designing and building the VOXES spectrometer. We also thank the SMI staff and in particular Doris Pristauz-Telsnigg, for the support in the preparation of the setup.

Conflicts of Interest

The authors declare no conflicts of interest.

References

  1. De Groot, F. High-Resolution X-ray Emission and X-ray Absorption Spectroscopy. Chem. Rev. 2001, 101, 1779–1808. [Google Scholar] [CrossRef] [PubMed]
  2. Rovezzi, M.; Glatzel, P. Hard X-ray emission spectroscopy: A powerful tool for the characterization of magnetic semiconductors. Semicond. Sci. Technol. 2014, 29, 023002. [Google Scholar] [CrossRef]
  3. Gamblin, S.D.; Urch, D.S. Metal Kβ X-ray emission spectra of first row transition metal compounds. J. Electron Spectrosc. Relat. Phenom. 2001, 113, 179–192. [Google Scholar] [CrossRef]
  4. Lafuerza, S.; Carlantuono, A.; Retegan, M.; Glatzel, P. Chemical Sensitivity of Kβ and Kα X-ray Emission from a Systematic Investigation of Iron Compounds. Inorg. Chem. 2020, 59, 12518–12535. [Google Scholar] [CrossRef]
  5. Beckwith, M.A.; Roemelt, M.; Collomb, M.N.; DuBoc, C.; Weng, T.C.; Bergmann, U.; Glatzel, P.; Neese, F.; DeBeer, S. Manganese Kβ X-ray Emission Spectroscopy As a Probe of Metal–Ligand Interactions. Inorg. Chem. 2011, 50, 8397–8409. [Google Scholar] [CrossRef]
  6. Kawai, J.; Suzuki, C.; Adachi, H.; Konishi, T.; Gohshi, Y. Charge-transfer effect on the linewidth of Fe Kα X-ray fluorescence spectra. Phys. Rev. B 1994, 50, 11347–11354. [Google Scholar] [CrossRef] [PubMed]
  7. Glatzel, P.; Smolentsev, G.; Bunker, G. The electronic structure in 3d transition metal complexes: Can we measure oxidation states? J. Phys. Conf. Ser. 2009, 190, 012046. [Google Scholar] [CrossRef]
  8. Pollock, C.J.; Delgado-Jaime, M.U.; Atanasov, M.; Neese, F.; DeBeer, S. Kβ Mainline X-ray Emission Spectroscopy as an Experimental Probe of Metal–Ligand Covalency. J. Am. Chem. Soc. 2014, 136, 9453–9463. [Google Scholar] [CrossRef] [PubMed]
  9. Malzer, W.; Grötzsch, D.; Gnewkow, R.; Schlesiger, C.; Kowalewski, F.; Van Kuiken, B.; DeBeer, S.; Kanngießer, B. A laboratory spectrometer for high throughput X-ray emission spectroscopy in catalysis research. Rev. Sci. Instrum. 2018, 89, 113111. [Google Scholar] [CrossRef] [PubMed]
  10. Haschke, M.; Flock, J.; Haller, M. X-ray Fluorescence Spectroscopy for Laboratory Applications; John Wiley & Sons: Hoboken, NJ, USA, 2021. [Google Scholar]
  11. Miliucci, M.; Scordo, A.; Sirghi, D.; Amirkhani, A.; Baniahmad, A.; Bazzi, M.; Bosnar, D.; Bragadireanu, M.; Carminati, M.; Cargnelli, M.; et al. Silicon drift detectors system for high-precision light kaonic atoms spectroscopy. Meas. Sci. Technol. 2021, 32, 095501. [Google Scholar] [CrossRef]
  12. Doriese, W.B.; Abbamonte, P.; Alpert, B.K.; Bennett, D.A.; Denison, E.V.; Fang, Y.; Fischer, D.A.; Fitzgerald, C.P.; Fowler, J.W.; Gard, J.D.; et al. A practical superconducting-microcalorimeter X-ray spectrometer for beamline and laboratory science. Rev. Sci. Instrum. 2017, 88, 053108. [Google Scholar] [CrossRef] [PubMed]
  13. Uhlig, J.; Doriese, W.B.; Fowler, J.W.; Swetz, D.S.; Jaye, C.; Fischer, D.A.; Reintsema, C.D.; Bennett, D.A.; Vale, L.R.; Mandal, U.; et al. High-resolution X-ray emission spectroscopy with transition-edge sensors: Present performance and future potential. J. Synchrotron Radiat. 2015, 22, 766–775. [Google Scholar] [CrossRef] [PubMed]
  14. Von Hámos, L. Röntgenspektroskopie und Abbildung mittels gekrümmter Kristallreflektoren. I. Geometrisch-optische Betrachtungen. Ann. Phys. 1933, 409, 716–724. [Google Scholar] [CrossRef]
  15. Zimmermann, P.; Peredkov, S.; Abdala, P.M.; DeBeer, S.; Tromp, M.; Müller, C.; van Bokhoven, J.A. Modern X-ray spectroscopy: XAS and XES in the laboratory. Coord. Chem. Rev. 2020, 423, 213466. [Google Scholar] [CrossRef]
  16. Grigorieva, I.; Antonov, A.; Gudi, G. Graphite Optics—Current Opportunities, Properties and Limits. Condens. Matter 2019, 4, 18. [Google Scholar] [CrossRef]
  17. Wansleben, M.; Kayser, Y.; Hönicke, P.; Holfelder, I.; Wählisch, A.; Unterumsberger, R.; Beckhoff, B. Experimental determination of line energies, line widths and relative transition probabilities of the Gadolinium L X-ray emission spectrum. Metrologia 2019, 56, 065007. [Google Scholar] [CrossRef]
  18. Scordo, A.; Curceanu, C.; Miliucci, M.; Sirghi, F.; Zmeskal, J. Pyrolitic Graphite Mosaic Crystal Thickness and Mosaicity Optimization for an Extended Source Von Hamos X-ray Spectrometer. Condens. Matter 2019, 4, 38. [Google Scholar] [CrossRef]
  19. Scordo, A.; Breschi, L.; Curceanu, C.; Miliucci, M.; Sirghi, F.; Zmeskal, J. High resolution multielement XRF spectroscopy of extended and diffused sources with a graphite mosaic crystal based Von Hamos spectrometer. J. Anal. At. Spectrom. 2020, 35, 155–168. [Google Scholar] [CrossRef]
  20. Scordo, A.; De Leo, V.; Curceanu, C.; Miliucci, M.; Sirghi, F. Efficiency measurements and simulations of a HAPG based Von Hamos spectrometer for large sources. J. Anal. At. Spectrom. 2021, 36, 2485–2491. [Google Scholar] [CrossRef]
  21. Schoonjans, T.; Brunetti, A.; Golosio, B.; Sanchez del Rio, M.; Solé, V.A.; Ferrero, C.; Vincze, L. The xraylib library for X-ray–matter interactions. Recent developments. Spectrochim. Acta Part B At. Spectrosc. 2011, 66, 776–784. [Google Scholar] [CrossRef]
Figure 1. The VOXES setup. The experimental apparatus consists of an X-ray tube mounted on a source box where the sample is placed, two motorized slits, S1 and S2, a HAPG mosaic crystal, and a strip detector.
Condensedmatter 09 00019 g001
Figure 2. Spectrum of CuNiZn. The XES spectrum of the CuNiZn sample, with background reduction depicted in black and without it shown in gray; various colors are used to illustrate different Gaussian contributions for each emission line.
Condensedmatter 09 00019 g002
Figure 3. TCF distribution and background reduction effect. Distribution of the Total Counts per Frame (TCF) over the detector’s strip during the acquisition (left). On the (right): the effect of selecting frames with a threshold of TCF distribution for the signal to background ratio, normalized to the value before the reduction procedure.
Condensedmatter 09 00019 g003
Figure 4. Geometry of the configuration and the calibration function. Schematization of the geometry (not in scale) employed for the VOXES setup (left) and the fit for determining the calibration function (right) without the inclusion of the nickel K β . The peak’s position extracted from the fit for the K α lines is in black and the position of the nickel’s K β , not included in the fit, is in red.
Condensedmatter 09 00019 g004
Figure 5. Effect of background reduction on residuals. Residuals obtained from the fit of the calibrated spectra without (red) and with the background reduction (green). The case with background reduction and without the inclusion of the nickel’s K β in the calibration fit (blue) is also reported.
Condensedmatter 09 00019 g005
Disclaimer/Publisher’s Note: The statements, opinions and data contained in all publications are solely those of the individual author(s) and contributor(s) and not of MDPI and/or the editor(s). MDPI and/or the editor(s) disclaim responsibility for any injury to people or property resulting from any ideas, methods, instructions or products referred to in the content.

