

Differentiation of Spatial Units of Genus Euthynnus from the Eastern Atlantic and the Mediterranean Using Otolith Shape Analysis

 ,
,  and
and 
Abstract

1. Introduction
2. Materials and Methods
2.1. Tuna Sampling and Otoliths Collection
2.2. Otoliths Image Processing and Shape Analysis
2.3. Preliminary Data Analysis
2.4. Data Analysis
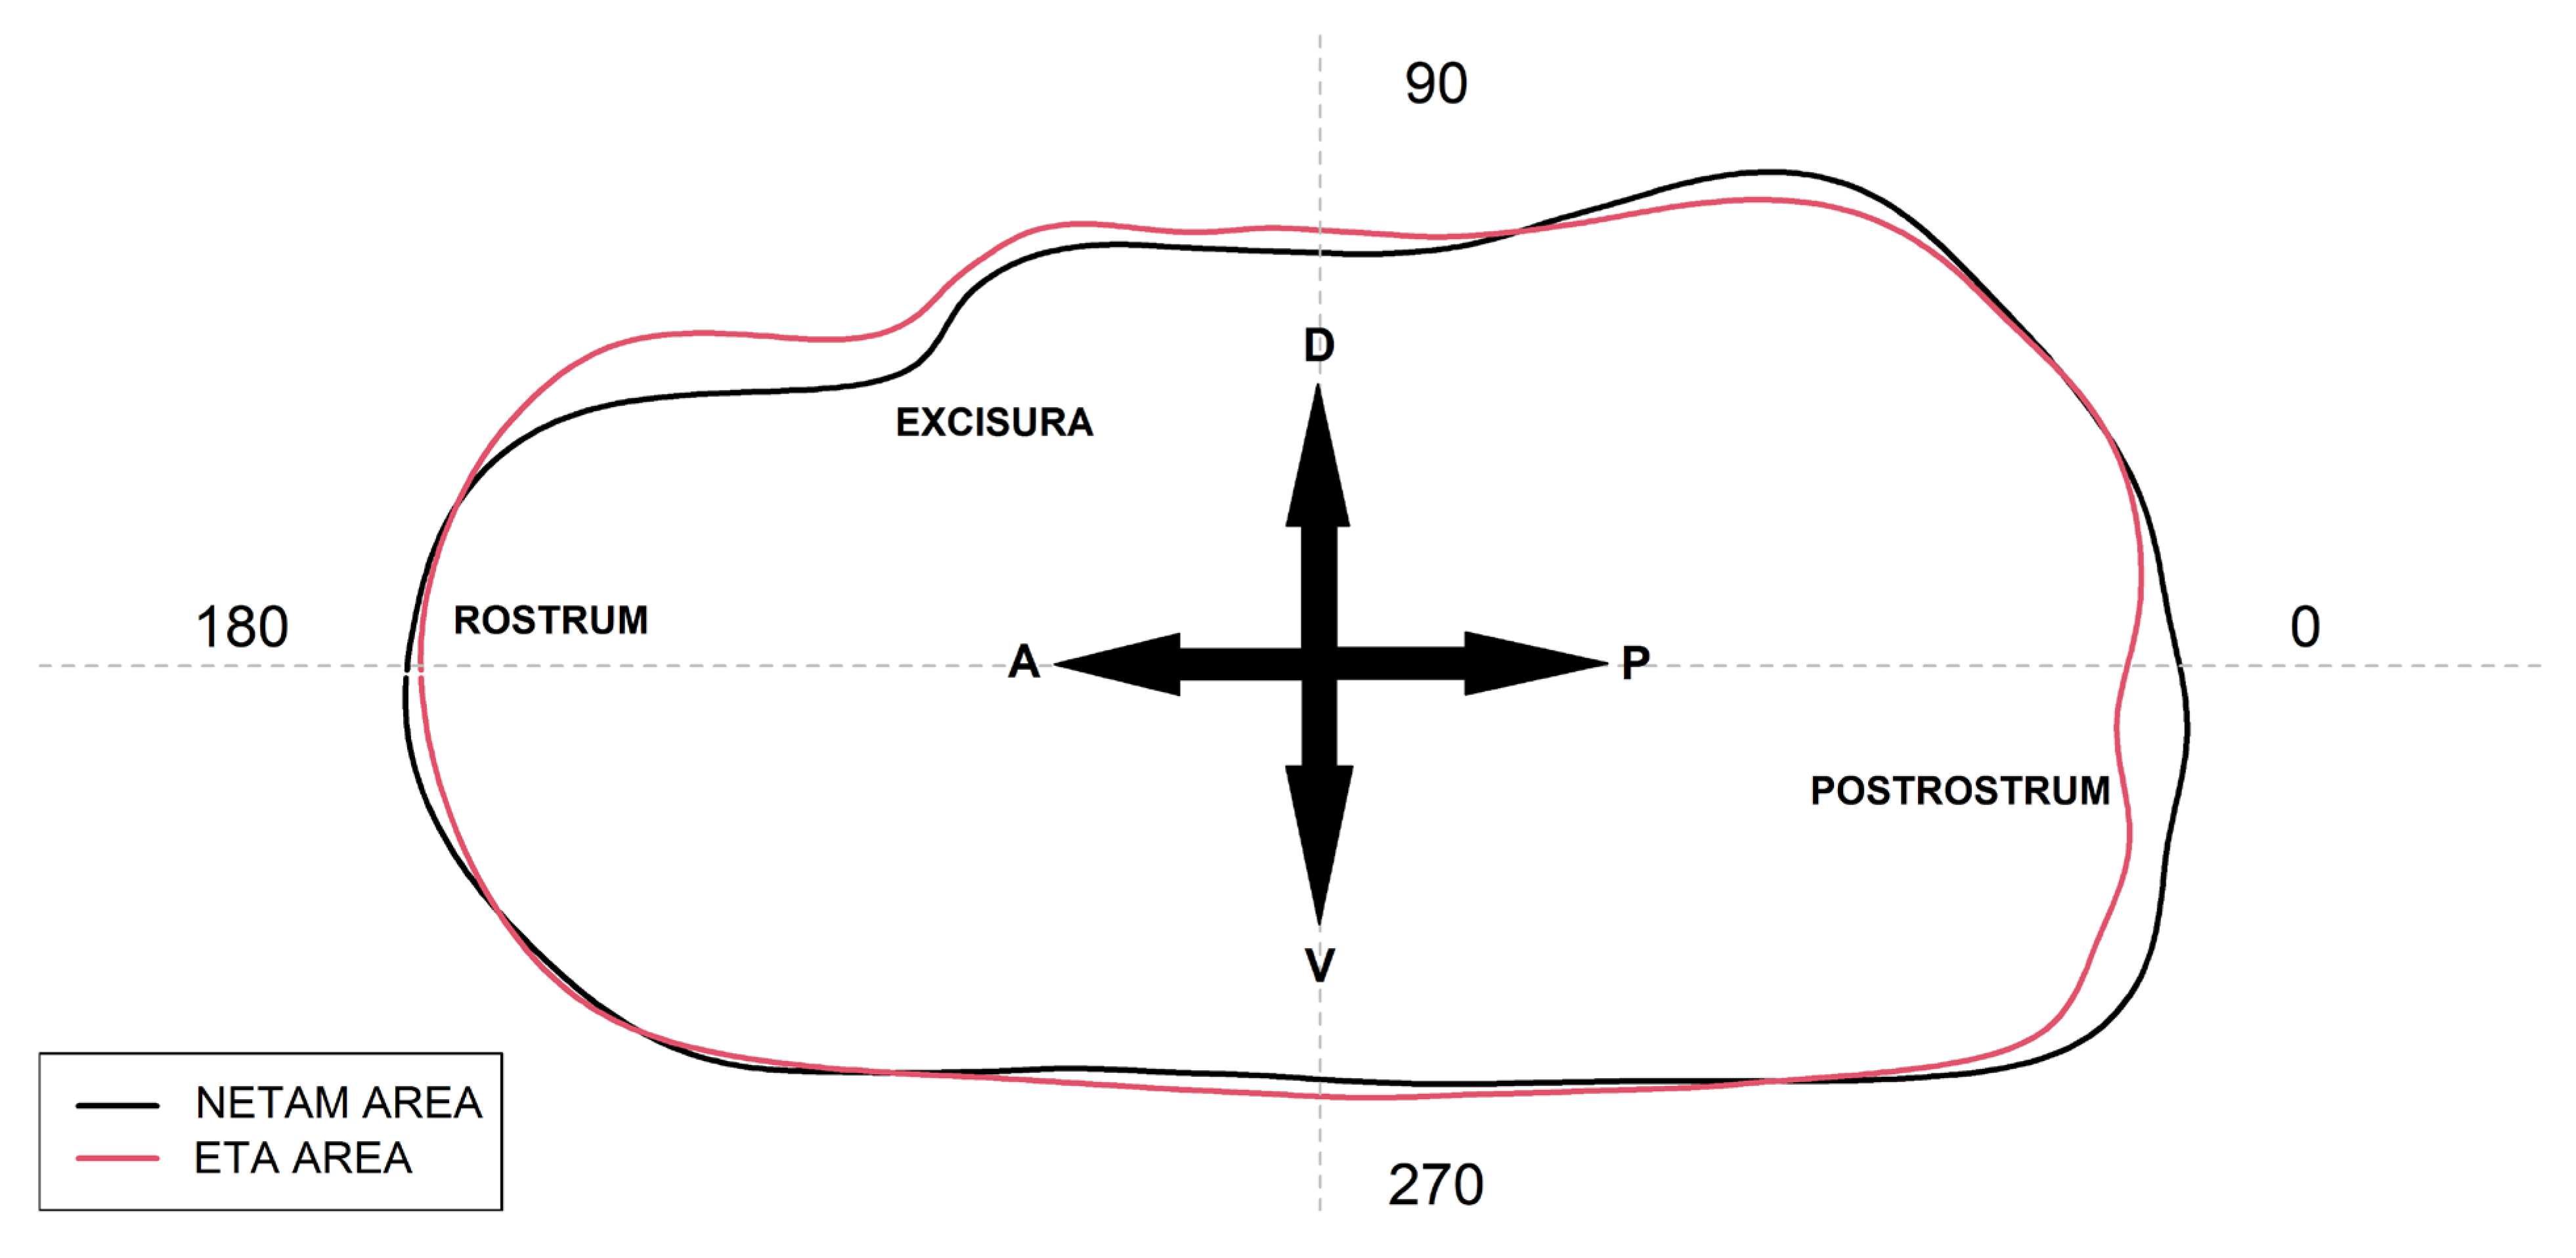
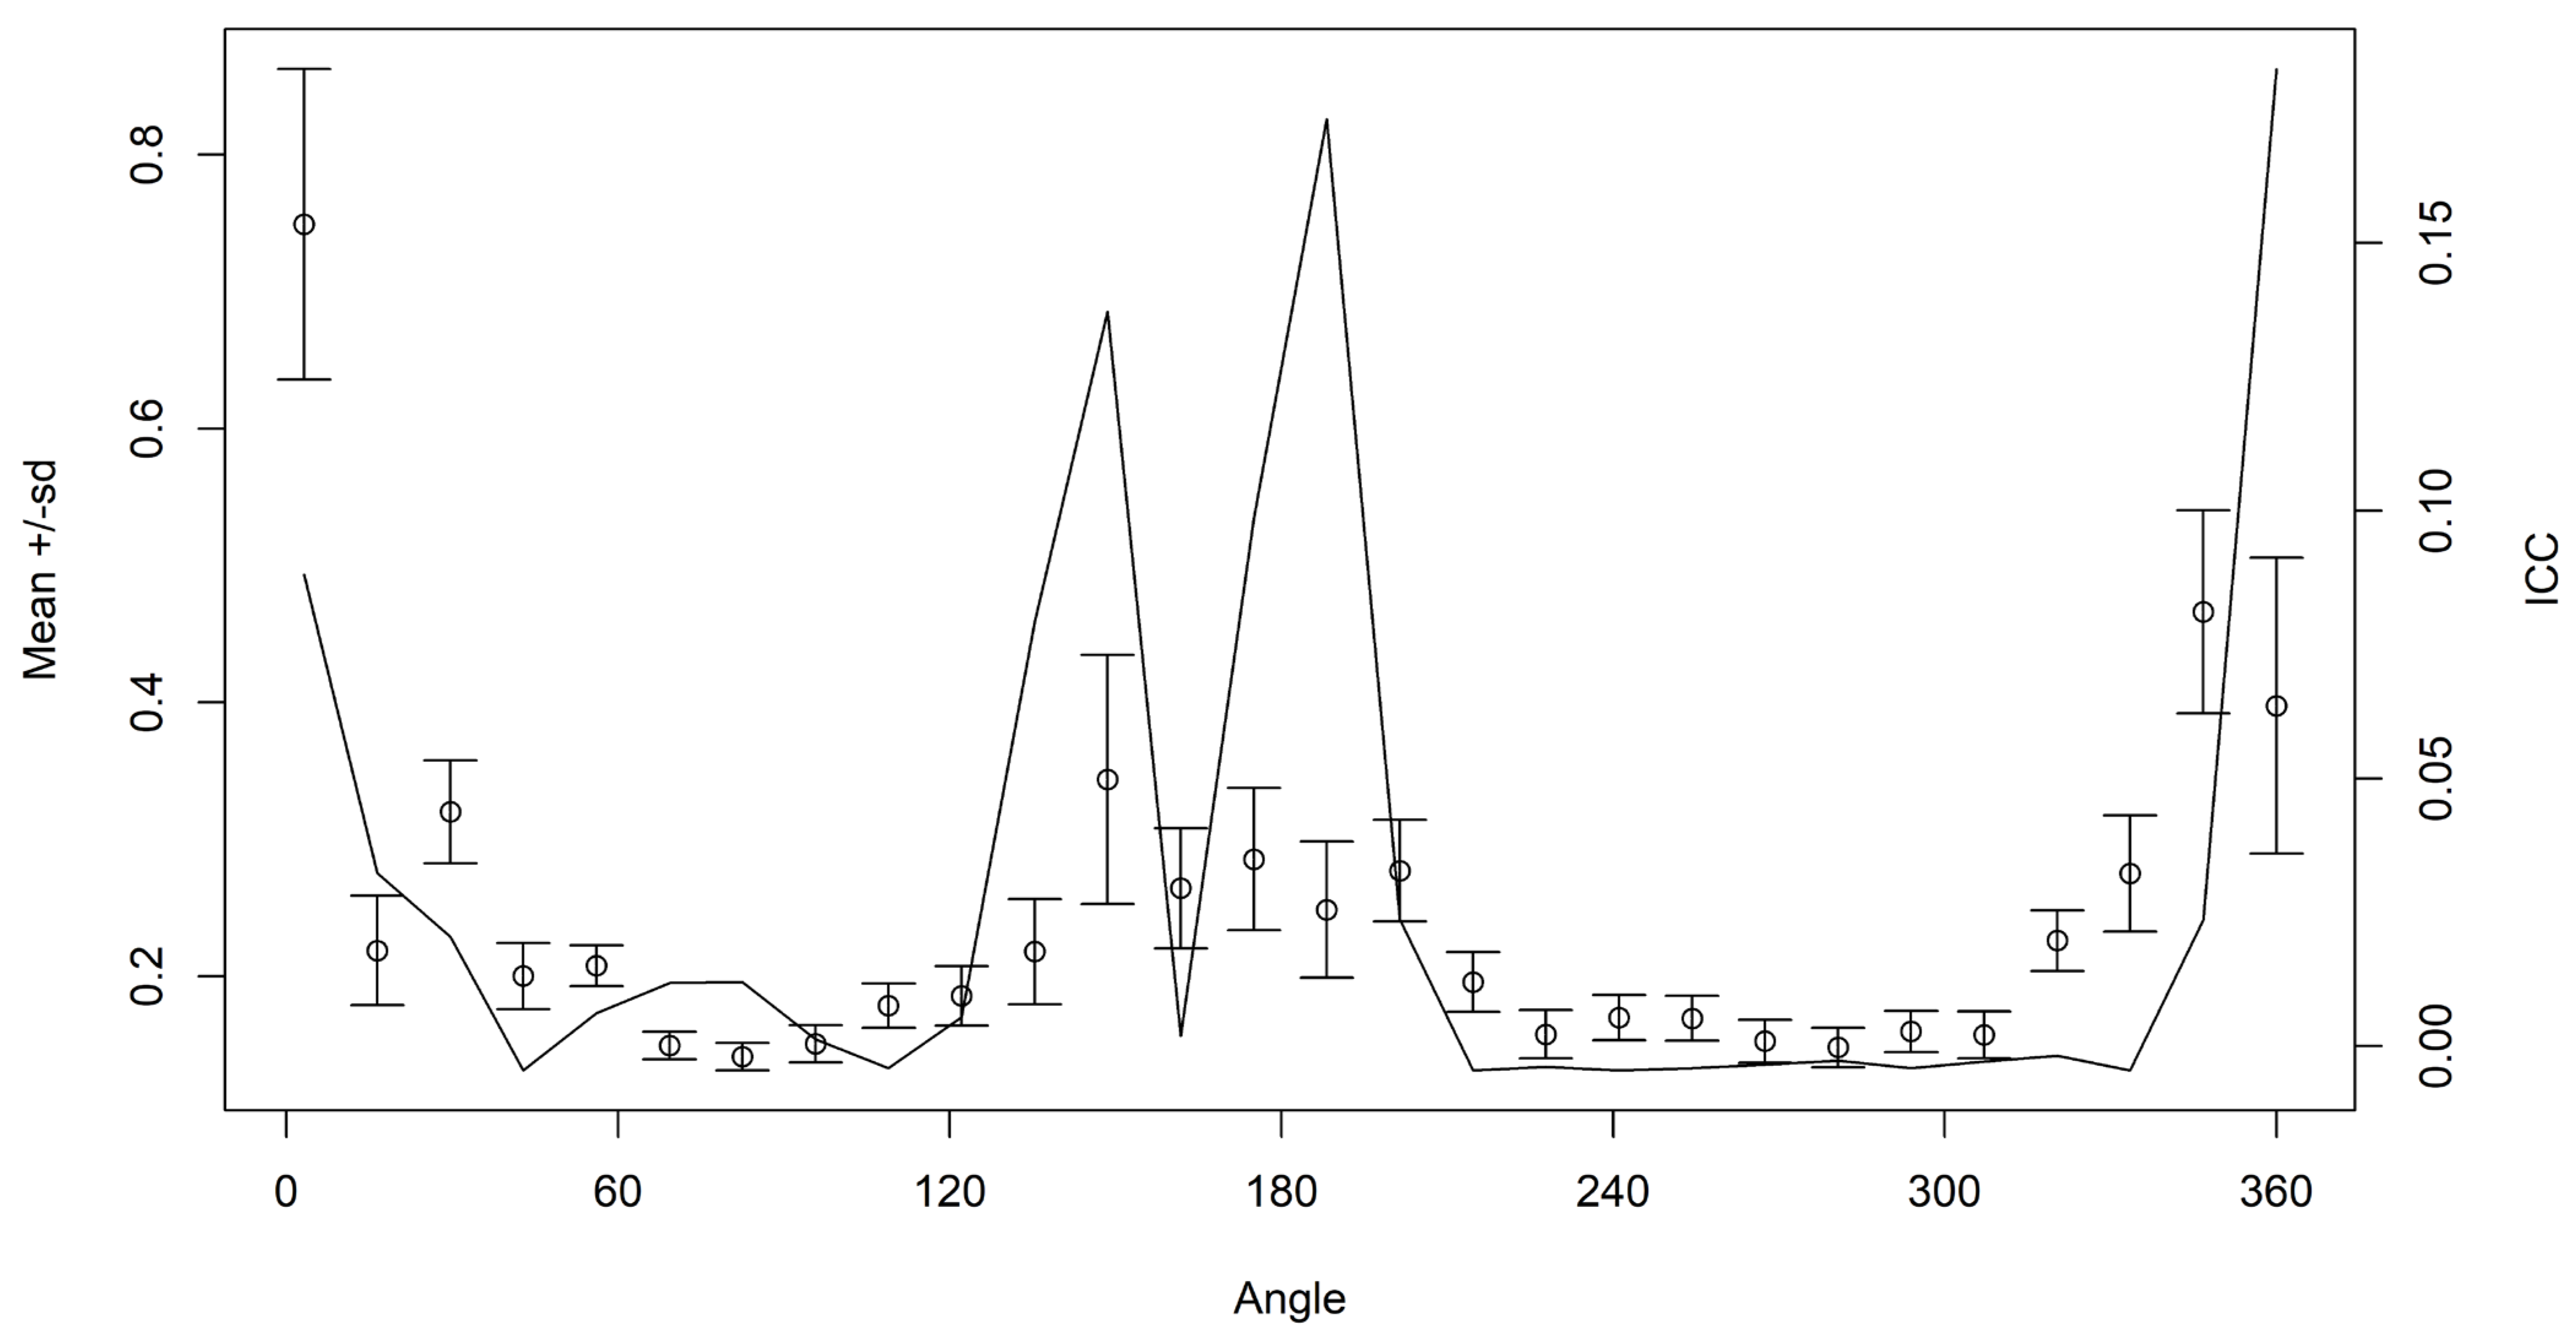
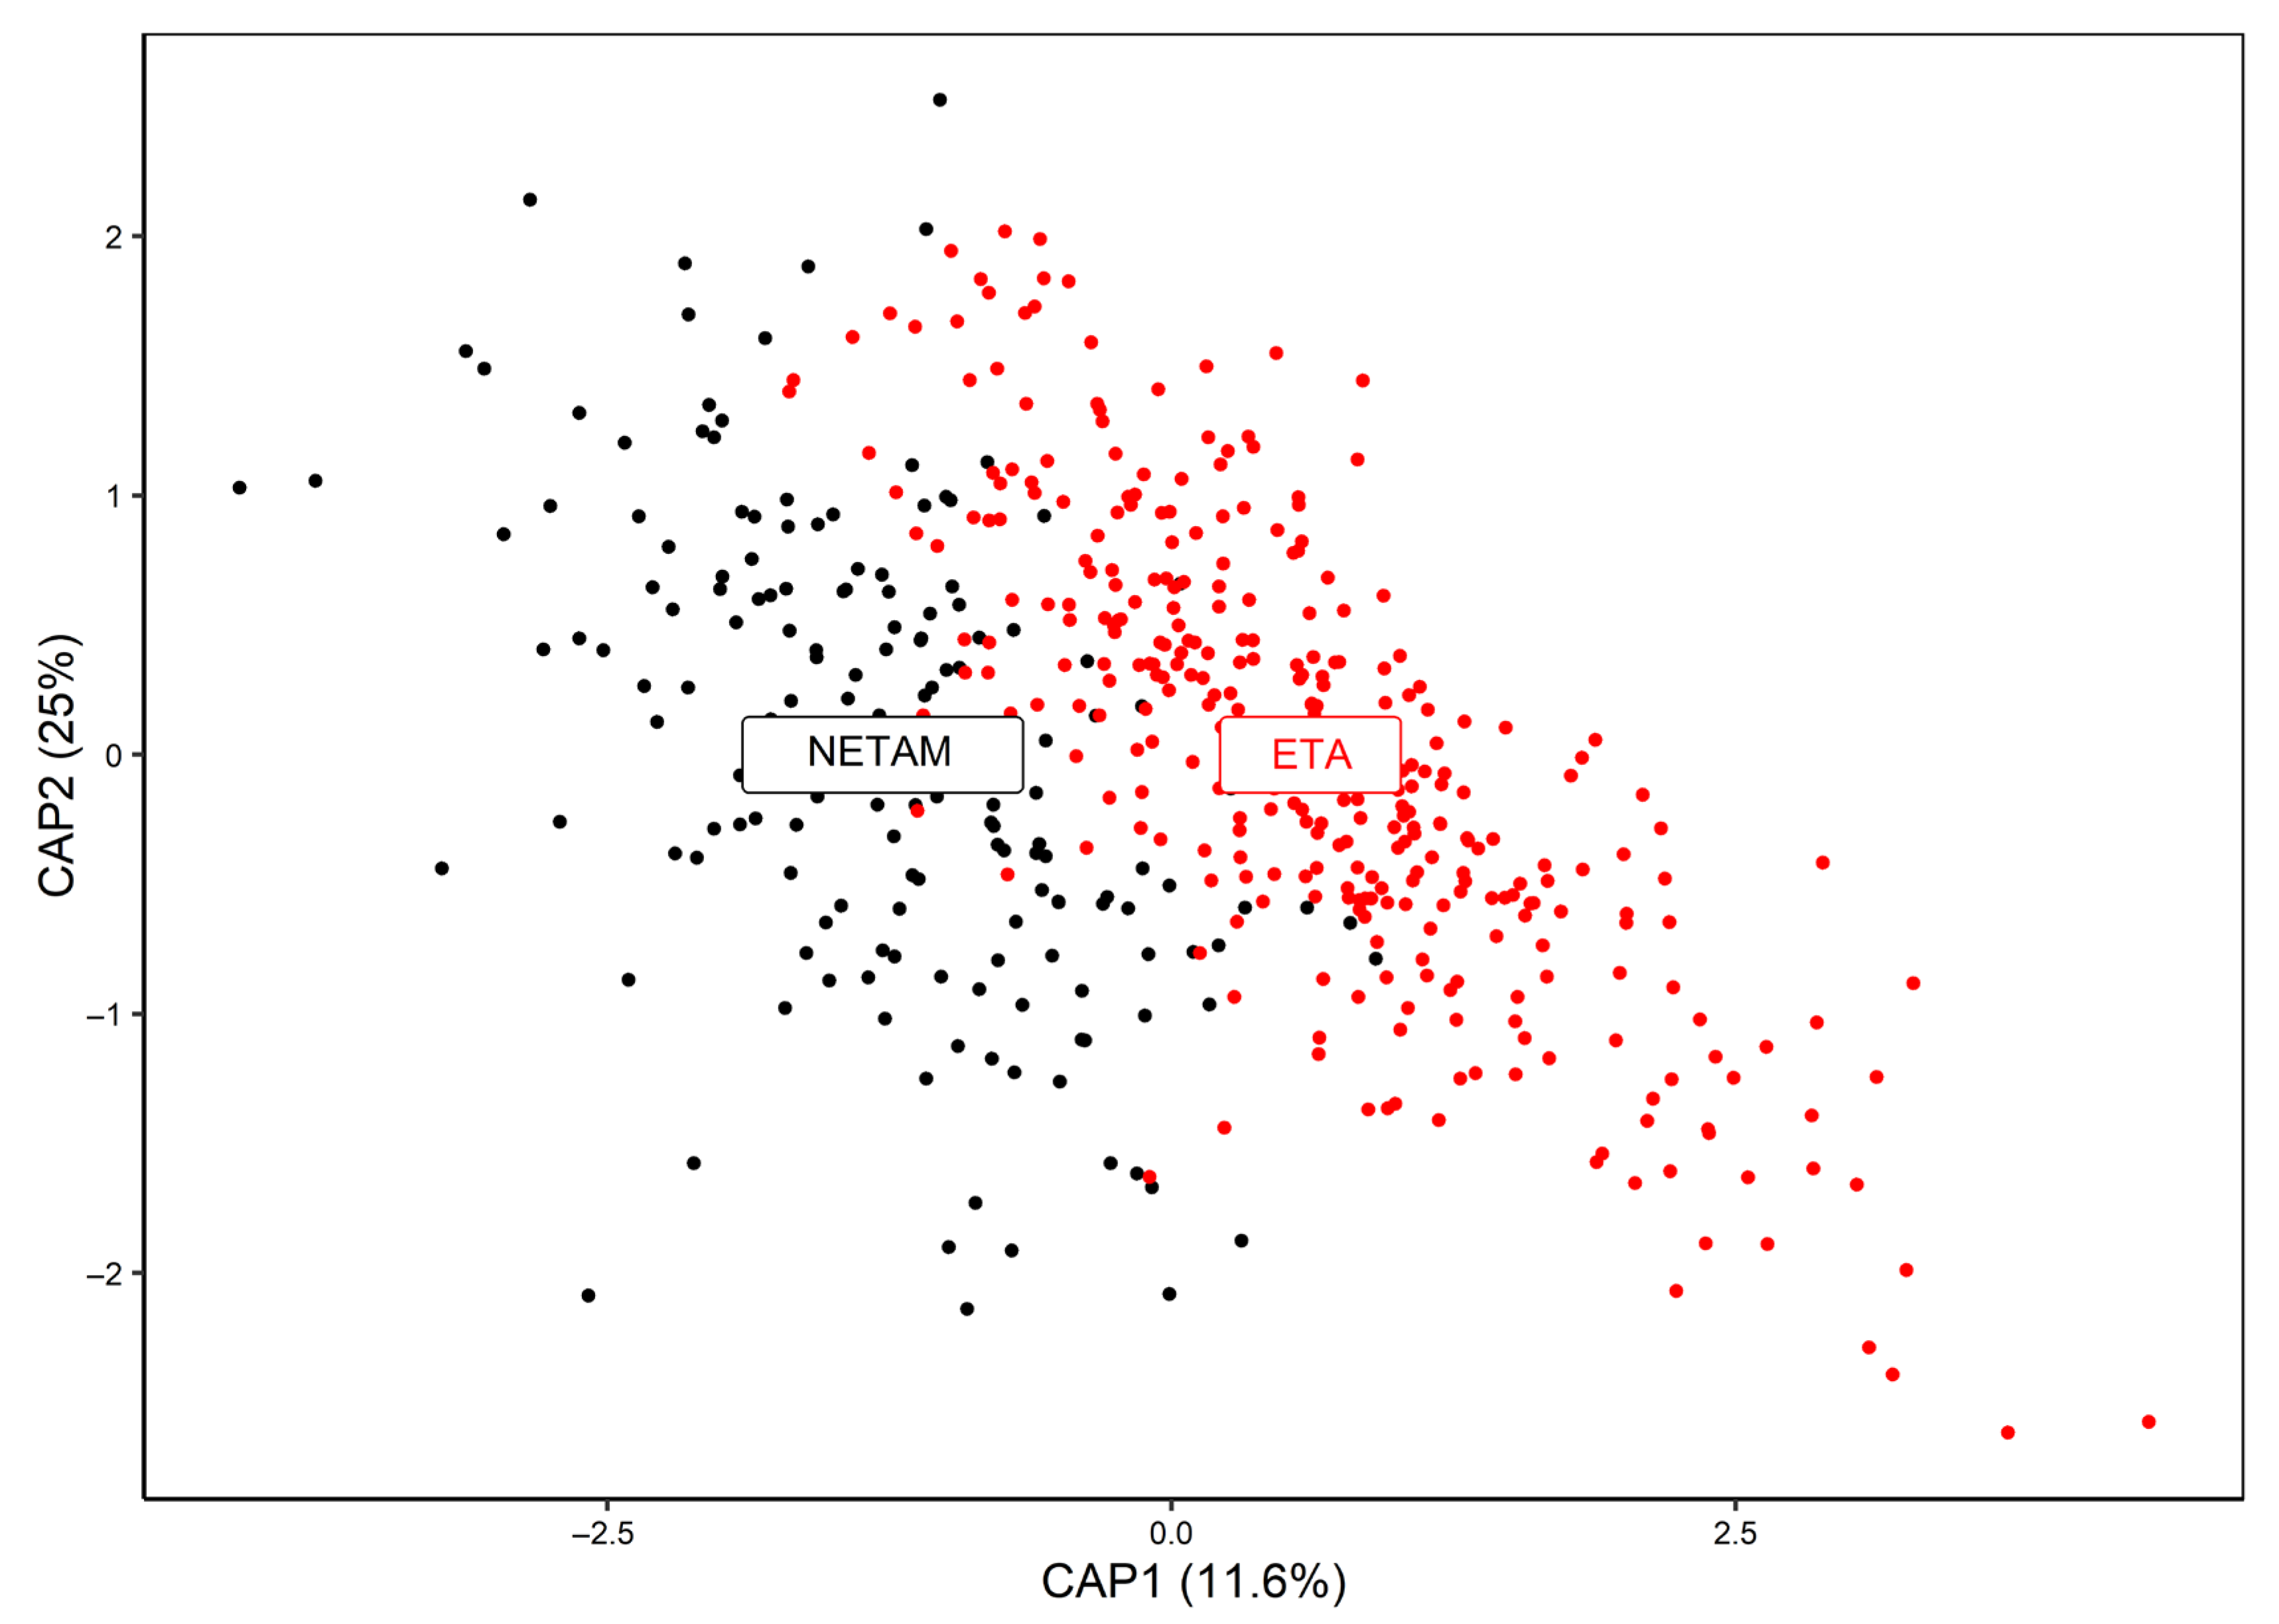
3. Results
4. Discussion
5. Conclusions
Supplementary Materials
Author Contributions
Funding
Institutional Review Board Statement
Data Availability Statement
Acknowledgments
Conflicts of Interest
References
- Saltalamacchia, F.; Berg, F.; Casini, M.; Davies, J.C.; Bartolino, V. Population Structure of European Sprat (Sprattus sprattus) in the Greater North Sea Ecoregion Revealed by Otolith Shape Analysis. Fish. Res. 2022, 245, 106131. [Google Scholar] [CrossRef]
- Cadrin, S.X.; Karr, L.A.; Mariani, S. (Eds.) Stock Identification Methods: Applications in Fishery Science, 2nd ed.; Academic Press: London, UK; Waltham, MA, USA; San Diego, CA, USA, 2014. [Google Scholar]
- Begg, G.A.; Friedland, K.D.; Pearce, J.B. Stock Identification and Its Role in Stock Assessment and Fisheries Management: An Overview. Fish. Res. 1999, 43, 1–8. [Google Scholar] [CrossRef]
- Begg, G.A.; Waldman, J.R. An Holistic Approach to Fish Stock Identification. Fish. Res. 1999, 43, 35–44. [Google Scholar] [CrossRef]
- Goethel, D.R.; Quinn, T.J.; Cadrin, S.X. Incorporating Spatial Structure in Stock Assessment: Movement Modeling in Marine Fish Population Dynamics. Rev. Fish. Sci. 2011, 19, 119–136. [Google Scholar] [CrossRef]
- Utter, F.; Ryman, N. Genetic Markers and Mixed Stock Fisheries. Fisheries 1993, 18, 11–21. [Google Scholar] [CrossRef]
- Reiss, H.; Hoarau, G.; Dickey-Collas, M.; Wolff, W.J. Genetic Population Structure of Marine Fish: Mismatch between Biological and Fisheries Management Units. Fish Fish. 2009, 10, 361–395. [Google Scholar] [CrossRef]
- Laikre, L.; Palm, S.; Ryman, N. Genetic Population Structure of Fishes: Implications for Coastal Zone Management. Ambio J. Hum. Environ. 2005, 34, 111–119. [Google Scholar] [CrossRef]
- Begg, G.A.; Hare, J.A.; Sheehan, D.D. The Role of Life History Parameters as Indicators of Stock Structure. Fish. Res. 1999, 43, 141–163. [Google Scholar] [CrossRef]
- Lester, R.J.G. Reappraisal of the Use of Parasites for Fish Stock Identification. Mar. Freshw. Res. 1990, 41, 855–864. [Google Scholar] [CrossRef]
- Timi, J.T. Parasites as Biological Tags for Stock Discrimination in Marine Fish from South American Atlantic Waters. J. Helminthol. 2007, 81, 107–111. [Google Scholar] [CrossRef]
- Dickhut, R.M.; Deshpande, A.D.; Cincinelli, A.; Cochran, M.A.; Corsolini, S.; Brill, R.W.; Secor, D.H.; Graves, J.E. Atlantic Bluefin Tuna (Thunnus thynnus) Population Dynamics Delineated by Organochlorine Tracers. Environ. Sci. Technol. 2009, 43, 8522–8527. [Google Scholar] [CrossRef] [PubMed]
- Begg, G.A.; Campana, S.E.; Fowler, A.J.; Suthers, I.M. Otolith Research and Application: Current Directions in Innovation and Implementation. Mar. Freshw. Res. 2005, 56, 477–483. [Google Scholar] [CrossRef]
- Kalish, J.M. Otolith Microchemistry: Validation of the Effects of Physiology, Age and Environment on Otolith Composition. J. Exp. Mar. Biol. Ecol. 1989, 132, 151–178. [Google Scholar] [CrossRef]
- Campana, S.E.; Neilson, J.D. Microstructure of Fish Otoliths. Can. J. Fish. Aquat. Sci. 1985, 42, 1014–1032. [Google Scholar] [CrossRef]
- Campana, S.E. Otolith Science Entering the 21st Century. Mar. Freshw. Res. 2005, 56, 485–495. [Google Scholar] [CrossRef]
- Campana, S.E.; Casselman, J.M. Stock Discrimination Using Otolith Shape Analysis. Can. J. Fish. Aquat. Sci. 1993, 50, 1062–1083. [Google Scholar] [CrossRef]
- D’Iglio, C.; Natale, S.; Albano, M.; Savoca, S.; Famulari, S.; Gervasi, C.; Lanteri, G.; Panarello, G.; Spanò, N.; Capillo, G. Otolith Analyses Highlight Morpho-Functional Differences of Three Species of Mullet (Mugilidae) from Transitional Water. Sustainability 2021, 14, 398. [Google Scholar] [CrossRef]
- Campana, S.E. Long-Term Shifts in Otolith Age Interpretations. Fish. Res. 2023, 263, 106681. [Google Scholar] [CrossRef]
- Korostelev, N.B.; Frey, P.H.; Orlov, A.M. Using Different Hard Structures to Estimate the Age of Deep-Sea Fishes: A Case Study of the Pacific Flatnose, Antimora microlepis (Moridae, Gadiformes, Teleostei). Fish. Res. 2020, 232, 105731. [Google Scholar] [CrossRef]
- Ibáñez, C.M.; Riera, R.; Leite, T.; Díaz-Santana-Iturrios, M.; Rosa, R.; Pardo-Gandarillas, M.C. Stomach Content Analysis in Cephalopods: Past Research, Current Challenges, and Future Directions. Rev. Fish Biol. Fish. 2021, 31, 505–522. [Google Scholar] [CrossRef]
- Mahé, K.; Ider, D.; Massaro, A.; Hamed, O.; Jurado-Ruzafa, A.; Gonçalves, P.; Anastasopoulou, A.; Jadaud, A.; Mytilineou, C.; Elleboode, R.; et al. Directional Bilateral Asymmetry in Otolith Morphology May Affect Fish Stock Discrimination Based on Otolith Shape Analysis. ICES J. Mar. Sci. 2019, 76, 232–243. [Google Scholar] [CrossRef]
- Hüssy, K.; Mosegaard, H.; Albertsen, C.M.; Nielsen, E.E.; Hemmer-Hansen, J.; Eero, M. Evaluation of Otolith Shape as a Tool for Stock Discrimination in Marine Fishes Using Baltic Sea Cod as a Case Study. Fish. Res. 2016, 174, 210–218. [Google Scholar] [CrossRef]
- Cardinale, M.; Doering-Arjes, P.; Kastowsky, M.; Mosegaard, H. Effects of Sex, Stock, and Environment on the Shape of Known-Age Atlantic Cod (Gadus morhua) Otoliths. Can. J. Fish. Aquat. Sci. 2004, 61, 158–167. [Google Scholar] [CrossRef]
- Hüssy, K. Otolith Shape in Juvenile Cod (Gadus morhua): Ontogenetic and Environmental Effects. J. Exp. Mar. Biol. Ecol. 2008, 364, 35–41. [Google Scholar] [CrossRef]
- Vignon, M.; Morat, F. Environmental and Genetic Determinant of Otolith Shape Revealed by a Non-Indigenous Tropical Fish. Mar. Ecol. Prog. Ser. 2010, 411, 231–241. [Google Scholar] [CrossRef]
- Afanasyev, P.K.; Orlov, A.M.; Rolsky, A.Y. Otolith Shape Analysis as a Tool for Species Identification and Studying the Population Structure of Different Fish Species. Biol. Bull. 2017, 44, 952–959. [Google Scholar] [CrossRef]
- Ponton, D. Is Geometric Morphometrics Efficient for Comparing Otolith Shape of Different Fish Species? J. Morphol. 2006, 267, 750–757. [Google Scholar] [CrossRef]
- Brophy, D.; Haynes, P.; Arrizabalaga, H.; Fraile, I.; Fromentin, J.M.; Garibaldi, F.; Katavic, I.; Tinti, F.; Karakulak, F.S.; Macías, D. Otolith Shape Variation Provides a Marker of Stock Origin for North Atlantic Bluefin Tuna (Thunnus thynnus). Mar. Freshw. Res. 2015, 67, 1023–1036. [Google Scholar] [CrossRef]
- Duncan, R.; Brophy, D.; Arrizabalaga, H. Otolith Shape Analysis as a Tool for Stock Separation of Albacore Tuna Feeding in the Northeast Atlantic. Fish. Res. 2018, 200, 68–74. [Google Scholar] [CrossRef]
- de Souza Corrêa, G.M.; Coletto, J.L.; Castello, J.P.; Miller, N.R.; de Almeida Tubino, R.; Neto, C.M.; da Costa, M.R. Identification of Fish Stock Based on Otolith as a Natural Marker: The Case of Katsuwonus pelamis (Linnaeus, 1758) in the Southwest Atlantic Ocean. Fish. Res. 2022, 255, 106436. [Google Scholar] [CrossRef]
- Pons, M.; Kell, L.; Rudd, M.B.; Cope, J.M.; Lucena Frédou, F. Performance of Length-Based Data-Limited Methods in a Multifleet Context: Application to Small Tunas, Mackerels, and Bonitos in the Atlantic Ocean. ICES J. Mar. Sci. 2019, 76, 960–973. [Google Scholar] [CrossRef]
- Collette, B.B.; Nauen, C.E. FAO Species Catalogue: Vol. 2 Scombrids of the World—An Annotated and Illustrated Catalogue of Tunas, Mackerels, Bonitos and Related Species Known to Date; FAO Fisheries Synopsis No. 125; FAO: Rome, Italy, 1983; 137p. [Google Scholar]
- Majkowski, J. Global Fishery Resources of Tuna and Tuna-like Species; FAO Fisheries Technical Paper 483; FAO: Rome, Italy, 2007. [Google Scholar]
- Lucena-Frédou, F.; Mourato, B.; Frédou, T.; Lino, P.G.; Muñoz-Lechuga, R.; Palma, C.; Soares, A.; Pons, M. Review of the Life History, Fisheries, and Stock Assessment for Small Tunas in the Atlantic Ocean. Rev. Fish Biol. Fish. 2021, 31, 709–736. [Google Scholar] [CrossRef]
- Levesque, J.C. International Fisheries Agreement: Review of the International Commission for the Conservation of Atlantic Tunas: Case Study—Shark Management. Mar. Policy 2008, 32, 528–533. [Google Scholar] [CrossRef]
- Anonymous. Report of the 2021 ICCAT Small Tunas Species Group Intersessional Meeting. Collect. Vol. Sci. Pap. ICCAT 2021, 78, 1–65. [Google Scholar]
- Cayré, P.; Diouf, T. Croissance de La Thonine Euthynnus alletteratus (Rafinesque, 1810) Etablie a Partir de Coupes Tranversales Du Premier Rayon de La Nageoire Dorsale; CRODT: Dakar, Senegal, 1980. [Google Scholar]
- El-Haweet, A.E.; Sabry, E.; Mohamed, H. Fishery and Population Characteristics of Euthynnus alletteratus (Rafinesque 1810) in the Eastern Coast of Alexandria, Egypt. Turk. J. Fish. Aquat. Sci. 2013, 13, 629–638. [Google Scholar] [CrossRef]
- Hajjej, G.; Hattour, A.; Hajjej, A.; Cherif, M.; Allaya, H.; Jarboui, O.; Bouain, A. Age and Growth of Little Tunny, Euthynnus alletteratus (Rafinesque, 1810), from the Tunisian Mediterranean Coasts. Cah. Biol. Mar. 2012, 53, 113–122. [Google Scholar] [CrossRef]
- Johnson, A.G. Comparison of Dorsal Spines and Vertebrae as Ageing Structures for Little Tunny, Euthynnus alletteratus, from the Northeast Gulf of Mexico. In Proceedings of the International Workshop on Age Determination of Oceanic Pelagic Fishes: Tunas, Billfishes and Sharks, Southeast Fisheries Center, Miami Laboratory, National Marine Fisheries Service, NOAA, Miami, FL, USA, 15–18 February 1982; NOAA Technical Report NMFS 8. U.S. Department of Commerce, National Oceanic and Atmospheric Administration, National Marine Fisheries Service: Silver Spring, MD, USA, 1983; pp. 111–115. [Google Scholar]
- Kahraman, A.E.; Oray, I.K. The Determination of Age and Growth Parameters of Atlantic Little Tunny Euthynnus alleteratus (Rafinesque, 1810) in Turkish Waters. Collect. Vol. Sci. Pap. ICCAT 2001, 52, 719–732. [Google Scholar]
- Valeiras, X.; Macías, D.; Gómez, M.J.; Lema, L.; Godoy, D.; Ortiz de Urbina, J.M.; de la Serna, J.M. Age and Growth of Atlantic Little Tuna (Euthynnus alletteratus) in the Western Mediterranean Sea. Collect. Vol. Sci. Pap. ICCAT 2008, 62, 1638–1648. [Google Scholar]
- Vieira, J.; Costa, P.A.S.; Braga, A.C.; São-Clemente, R.R.B.; Ferreira, C.E.L.; Silva, J.P. Age, Growth, and Maturity of Little Tunny, Euthynnus alletteratus (Rafinesque, 1810) in Southeastern Brazil. Lat. Am. J. Aquat. Res. 2021, 49, 773–787. [Google Scholar]
- Bahou, L.; d’Almeida, M.-A.; Koné, T.; Boua, C.A.; Séripka, G.D. Reproductive Biology and Histological Characteristics of Female Little Tunny Euthynnus alletteratus (Rafinesque, 1810) Caught on Continental Shelf of Côte d’Ivoire. Sci. J. Biol. Sci. 2016, 5, 88–102. [Google Scholar]
- Cruz-Castán, R.; Meiners-Mandujano, C.; Macías, D.; Jiménez-Badillo, L.; Curiel-Ramírez, S. Reproductive Biology of Little Tunny Euthynnus alletteratus (Rafinesque, 1810) in the Southwest Gulf of Mexico. PeerJ 2019, 7, e6558. [Google Scholar] [CrossRef] [PubMed]
- Gaykov, V.Z.; Bokhanov, D. V The Biological Characteristic of Atlantic Black Skipjack (Euthynnus alletteratus) of the Eastern Atlantic Ocean. Collect. Vol. Sci. Pap. ICCAT 2008, 62, 1610–1628. [Google Scholar]
- Hajjej, G.; Hattour, A.; Allaya, H.; Jarboui, O.; Bouain, A. Some Biological Parameters of the Little Tuna Euthynnus alletteratus (Rafinesque, 1810) in Tunisian Waters. Cah. Biol. Mar. 2011, 52, 33–40. [Google Scholar]
- Kahraman, A.E.; Alicli, T.Z.; Akayli, T.; Oray, I.K. Reproductive Biology of Little Tunny, Euthynnus alletteratus (Rafinesque), from the North-eastern Mediterranean Sea. J. Appl. Ichthyol. 2008, 24, 551–554. [Google Scholar] [CrossRef]
- Mohamed, H.; El-Haweet, A.E.; Sabry, E. Reproductive Biology of Little Tunny, Euthynnus alletteratus (Rafinesque 1810) in the Eastern Coast of Alexandria, Egypt. Egypt. J. Aquat. Biol. Fish. 2014, 18, 139–150. [Google Scholar]
- Saber, S.; De Urbina, J.O.; Lino, P.G.; Gómez-Vives, M.J.; Coelho, R.; Muñoz-Lechuga, R.; Macías, D. Biological Aspects of Little Tunny Euthynnus alletteratus from Spanish and Portuguese Waters. Collect. Vol. Sci. Pap. ICCAT 2018, 75, 95–110. [Google Scholar]
- Libungan, L.A.; Pálsson, S. ShapeR: An R Package to Study Otolith Shape Variation among Fish Populations. PLoS ONE 2015, 10, e0121102. [Google Scholar] [CrossRef]
- R Core Team. R: A Language and Environment for Statistical Computing: Version 4.2.2; R Foundation for Statistical Computing: Vienna, Austria, 2022. [Google Scholar]
- Libungan, L.; Pálsson, S. shapeR: Collection and Analysis of Otolith Shape Data; R Package Version 1.0-1; R Foundation for Statistical Computing: Vienna, Austria, 2022. [Google Scholar]
- Oksanen, J.; Blanchet, F.G.; Friendly, M.; Kindt, R.; Legendre, P.; McGlinn, D.; Minchin, P.R.; O’Hara, R.B.; Simpson, G.L.; Solymos, P.; et al. Vegan: Community Ecology Package; R Package Version 2.4-2; R Foundation for Statistical Computing: Vienna, Austria, 2017. [Google Scholar]
- Anderson, M.J.; Willis, T.J. Canonical Analysis of Principal Coordinates: A Useful Method of Constrained Ordination for Ecology. Ecology 2003, 84, 511–525. [Google Scholar] [CrossRef]
- Warnes, G.R.; Bolker, B.; Bonebakker, L.; Gentleman, R.; Huber, W.; Liaw, W.H.A.; Lumley, T.; Maechler, M.; Magnusson, A.; Moeller, S.; et al. gplots: Various R Programming Tools for Plotting Data; R Package Version 3.1.3; R Foundation for Statistical Computing: Vienna, Austria, 2022. [Google Scholar]
- Libungan, L.; Slotte, A.; Otis, E.; Pálsson, S. Otolith Variation in Pacific Herring (Clupea pallasii) Reflects Mitogenomic Variation Rather than the Subspecies Classification. Polar Biol. 2016, 39, 1571–1579. [Google Scholar] [CrossRef]
- Palumbi, S.R. Genetic Divergence, Reproductive Isolation, and Marine Speciation. Annu. Rev. Ecol. Syst. 1994, 25, 547–572. [Google Scholar] [CrossRef]
- Ferguson, J.W.H. On the Use of Genetic Divergence for Identifying Species. Biol. J. Linn. Soc. 2002, 75, 509–516. [Google Scholar] [CrossRef]
- Patarnello, T.; Volckaert, F.A.M.J.; Castilho, R. Pillars of Hercules: Is the Atlantic–Mediterranean Transition a Phylogeographical Break? Mol. Ecol. 2007, 16, 4426–4444. [Google Scholar] [CrossRef]
- Kikuchi, E.; Cardoso, L.G.; Canel, D.; Timi, J.T.; Haimovici, M. Using Growth Rates and Otolith Shape to Identify the Population Structure of Umbrina canosai (Sciaenidae) from the Southwestern Atlantic. Mar. Biol. Res. 2021, 17, 272–285. [Google Scholar] [CrossRef]
- Tedesco, P.A.; Paradis, E.; Lévêque, C.; Hugueny, B. Explaining Global-scale Diversification Patterns in Actinopterygian Fishes. J. Biogeogr. 2017, 44, 773–783. [Google Scholar] [CrossRef]
- Turner, G.F. What Is a Fish Species? Rev. Fish Biol. Fish. 1999, 9, 281–297. [Google Scholar] [CrossRef]
- Ollé, J.; Vilà-Valls, L.; Alvarado-Bremer, J.; Cerdenares, G.; Duong, T.Y.; Hajjej, G.; Lino, P.G.; Muñoz-Lechuga, R.; Sow, F.N.; Diaha, N.C.; et al. Population Genetics Meets Phylogenetics: New Insights into the Relationships among Members of the Genus Euthynnus (Family Scombridae). Hydrobiologia 2022, 849, 47–62. [Google Scholar] [CrossRef]
- Alvarado Bremer, J.R.; Ely, B. Pronounced Levels of Genetic Differentiation among Two Trans-Atlantic Samples of Little Tunny (Euthynus alletteratus). Collect. Vol. Sci. Pap. ICCAT 1999, 49, 236–242. [Google Scholar]
- Cayré, P.M.; Diouf, T. Estimating Age and Growth of Little Tunny, Euthynnus alletteratus, off the Coast of Senegal Using Dorsal Fin Spine Sections. In Proceedings of the International Workshop on Age Determination of Oceanic Pelagic Fishes: Tunas, Billfishes and Sharks, Southeast Fisheries Center, Miami Laboratory, National Marine Fisheries Service, NOAA, Miami, FL, USA, 15–18 February 1982; NOAA Technical Report NMFS 8. U.S. Department of Commerce, National Oceanic and Atmospheric Administration, National Marine Fisheries Service: Silver Spring, MD, USA, 1983; pp. 105–110. [Google Scholar]
- Adams, J.L.; Kerstetter, D.W. Age and Growth of Three Coastal-Pelagic Tunas (Actinopterygii: Perciformes: Scombridae) in the Florida Straits, USA: Blackfin Tuna, Thunnus atlanticus, Little Tunny, Euthynnus alletteratus, and Skipjack Tuna, Katsuwonus pelamis. Acta Ichthyol. Piscat. 2014, 44, 201–211. [Google Scholar] [CrossRef]
- Hajjej, G.; Hattour, A.; Allaya, H.; Jarboui, O.; Bouain, A. Biology of Little Tunny Euthynnus alletteratus in the Gulf of Gabes, Southern Tunisia (Central Mediterranean Sea). Rev. Biol. Mar. Oceanogr. 2010, 45, 399–406. [Google Scholar] [CrossRef]
- Hajjej, G.; Hattour, A.; Hajjej, A.; Allaya, H.; Jarboui, O.; Bouain, A. Morphological Variation of Little Tuna Euthynnus alletteratus in Tunisian Waters and Eastern Atlantic. Panam. J. Aquat. Sci. 2013, 8, 1–9. [Google Scholar]
- Orsi Relini, L.; Palandri, G.; Garibaldi, F.; Lanteri, L.; Cilli, G.; Ferrara, G.; Tinti, F. Towards a New Taxonomical Approach to Mediterranean Small Tuna of Genus Auxis. Biol. Mar. Mediterr. 2008, 15, 207–210. [Google Scholar]
- Ollé, J.; Macías, D.; Saber, S.; José Gómez-Vives, M.; Pérez-Bielsa, N.; Viñas, J. Genetic Analysis Reveals the Presence of Frigate Tuna (Auxis thazard) in the Bullet Tuna (Auxis rochei) Fishery of the Iberian Peninsula and the Western-Central Mediterranean Sea. Bull. Mar. Sci. 2019, 95, 317–325. [Google Scholar] [CrossRef]
- Kumar, G.; Kocour, M. Population Genetic Structure of Tunas Inferred from Molecular Markers: A Review. Rev. Fish. Sci. Aquac. 2015, 23, 72–89. [Google Scholar] [CrossRef]
- Catanese, G.; Manchado, M.; Infante, C. Evolutionary Relatedness of Mackerels of the Genus Scomber Based on Complete Mitochondrial Genomes: Strong Support to the Recognition of Atlantic Scomber colias and Pacific Scomber japonicus as Distinct Species. Gene 2010, 452, 35–43. [Google Scholar] [CrossRef]
- Infante, C.; Blanco, E.; Zuasti, E.; Crespo, A.; Manchado, M. Phylogenetic Differentiation between Atlantic Scomber colias and Pacific Scomber japonicus Based on Nuclear DNA Sequences. Genetica 2007, 130, 1–8. [Google Scholar] [CrossRef] [PubMed]
- Karaiskou, N.; Triantafyllidis, A.; Triantaphyllidis, C. Shallow Genetic Structure of Three Species of the Genus Trachurus in European Waters. Mar. Ecol. Prog. Ser. 2004, 281, 193–205. [Google Scholar] [CrossRef]
- Ward, R.D.; Costa, F.O.; Holmes, B.H.; Steinke, D. DNA Barcoding of Shared Fish Species from the North Atlantic and Australasia: Minimal Divergence for Most Taxa, but Zeus faber and Lepidopus caudatus Each Probably Constitute Two Species. Aquat. Biol. 2008, 3, 71–78. [Google Scholar] [CrossRef]
- Bargelloni, L.; Alarcon, J.A.; Alvarez, M.C.; Penzo, E.; Magoulas, A.; Palma, J.; Patarnello, T. The Atlantic–Mediterranean Transition: Discordant Genetic Patterns in Two Seabream Species, Diplodus puntazzo (Cetti) and Diplodus sargus (L.). Mol. Phylogenet. Evol. 2005, 36, 523–535. [Google Scholar] [CrossRef]
- Bacha, M.; Jemaa, S.; Hamitouche, A.; Rabhi, K.; Amara, R. Population Structure of the European Anchovy, Engraulis encrasicolus, in the SW Mediterranean Sea, and the Atlantic Ocean: Evidence from Otolith Shape Analysis. ICES J. Mar. Sci. 2014, 71, 2429–2435. [Google Scholar] [CrossRef]
- Vieira, A.R.; Neves, A.; Sequeira, V.; Paiva, R.B.; Gordo, L.S. Otolith Shape Analysis as a Tool for Stock Discrimination of Forkbeard (Phycis phycis) in the Northeast Atlantic. Hydrobiologia 2014, 728, 103–110. [Google Scholar] [CrossRef]
- Moreira, C.; Froufe, E.; Vaz-Pires, P.; Correia, A.T. Otolith Shape Analysis as a Tool to Infer the Population Structure of the Blue Jack Mackerel, Trachurus picturatus, in the NE Atlantic. Fish. Res. 2019, 209, 40–48. [Google Scholar] [CrossRef]
- Mahe, K.; Oudard, C.; Mille, T.; Keating, J.; Gonçalves, P.; Clausen, L.W.; Petursdottir, G.; Rasmussen, H.; Meland, E.; Mullins, E.; et al. Identifying Blue Whiting (Micromesistius poutassou) Stock Structure in the Northeast Atlantic by Otolith Shape Analysis. Can. J. Fish. Aquat. Sci. 2016, 73, 1363–1371. [Google Scholar] [CrossRef]
- Stransky, C.; Murta, A.G.; Schlickeisen, J.; Zimmermann, C. Otolith Shape Analysis as a Tool for Stock Separation of Horse Mackerel (Trachurus trachurus) in the Northeast Atlantic and Mediterranean. Fish. Res. 2008, 89, 159–166. [Google Scholar] [CrossRef]
- Agüera, A.; Brophy, D. Use of Saggital Otolith Shape Analysis to Discriminate Northeast Atlantic and Western Mediterranean Stocks of Atlantic Saury, Scomberesox saurus saurus (Walbaum). Fish. Res. 2011, 110, 465–471. [Google Scholar] [CrossRef]
- Yu, X.; Cao, L.; Liu, J.; Zhao, B.; Shan, X.; Dou, S. Application of Otolith Shape Analysis for Stock Discrimination and Species Identification of Five Goby Species (Perciformes: Gobiidae) in the Northern Chinese Coastal Waters. Chin. J. Oceanol. Limnol. 2014, 32, 1060–1073. [Google Scholar] [CrossRef]
- He, T.; Cheng, J.; Qin, J.; Li, Y.; Gao, T. Comparative Analysis of Otolith Morphology in Three Species of Scomber. Ichthyol. Res. 2018, 65, 192–201. [Google Scholar] [CrossRef]
- Tuset, V.M.; Parisi-Baradad, V.; Lombarte, A. Application of Otolith Mass and Shape for Discriminating Scabbardfishes Aphanopus spp. in the North-eastern Atlantic Ocean. J. Fish. Biol. 2013, 82, 1746–1752. [Google Scholar] [CrossRef]
- Zhuang, L.; Ye, Z.; Zhang, C. Application of Otolith Shape Analysis to Species Separation in Sebastes spp. from the Bohai Sea and the Yellow Sea, Northwest Pacific. Environ. Biol. Fishes 2015, 98, 547–558. [Google Scholar] [CrossRef]
- Pavlov, D.A. Differentiation of Three Species of the Genus Upeneus (Mullidae) Based on Otolith Shape Analysis. J. Ichthyol. 2016, 56, 37–51. [Google Scholar] [CrossRef]
- L’Abée-Lund, J.H. Otolith Shape Discriminates between Juvenile Atlantic Salmon, Salmo salar L., and Brown Trout, Salmo trutta L. J. Fish Biol. 1988, 33, 899–903. [Google Scholar] [CrossRef]
- Morales, C.J.C.; Barnuevo, K.D.E.; Delloro, E.S., Jr.; Cabebe-Barnuevo, R.A.; Calizo, J.K.S.; Lumayno, S.D.P.; Babaran, R.P. Otolith Morphometric and Shape Distinction of Three Redfin Species under the Genus Decapterus (Teleostei: Carangidae) from Sulu Sea, Philippines. Fishes 2023, 8, 95. [Google Scholar] [CrossRef]
- Morawicki, S.; Solimano, P.J.; Volpedo, A.V. Unravelling Stock Spatial Structure of Silverside Odontesthes argentinensis (Valenciennes, 1835) from the North Argentinian Coast by Otoliths Shape Analysis. Fishes 2022, 7, 155. [Google Scholar] [CrossRef]
- Selkoe, K.A.; Henzler, C.M.; Gaines, S.D. Seascape Genetics and the Spatial Ecology of Marine Populations. Fish Fish. 2008, 9, 363–377. [Google Scholar] [CrossRef]
- Ely, B.; Viñas, J.; Alvarado Bremer, J.R.; Black, D.; Lucas, L.; Covello, K.; Labrie, A.V.; Thelen, E. Consequences of the Historical Demography on the Global Population Structure of Two Highly Migratory Cosmopolitan Marine Fishes: The Yellowfin Tuna (Thunnus albacares) and the Skipjack Tuna (Katsuwonus pelamis). BMC Evol. Biol. 2005, 5, 19. [Google Scholar] [CrossRef] [PubMed]
- Fromentin, J.; Powers, J.E. Atlantic Bluefin Tuna: Population Dynamics, Ecology, Fisheries and Management. Fish Fish. 2005, 6, 281–306. [Google Scholar] [CrossRef]
- Gonzalez, E.G.; Beerli, P.; Zardoya, R. Genetic Structuring and Migration Patterns of Atlantic Bigeye Tuna, Thunnus obesus (Lowe, 1839). BMC Evol. Biol. 2008, 8, 252. [Google Scholar] [CrossRef]
- Vinas, J.; Bremer, J.A.; Pla, C. Phylogeography of the Atlantic Bonito (Sarda sarda) in the Northern Mediterranean: The Combined Effects of Historical Vicariance, Population Expansion, Secondary Invasion, and Isolation by Distance. Mol. Phylogenet. Evol. 2004, 33, 32–42. [Google Scholar] [CrossRef]
- Saillant, E.A.; Luque, P.L.; Short, E.; Antoni, L.; Reynal, L.; Pau, C.; Arocha, F.; Roque, P.; Hazin, F. Population Structure of Blackfin Tuna (Thunnus atlanticus) in the Western Atlantic Ocean Inferred from Microsatellite Loci. Sci. Rep. 2022, 12, 9830. [Google Scholar] [CrossRef]
- Vu, Q.T.; Kartavtsev, Y. Otolith Shape Analysis and Its Utilily for Identification of Two Smelt Species, Hypomesus japonicus and H. nipponensis (Osteichthyes, Osmeridae) from the Northwestern Sea of Japan with Inferences in Stock Discrimination of H. japonicus. Russ. J. Mar. Biol. 2020, 46, 431–440. [Google Scholar] [CrossRef]
- Tuset, V.M.; Rosin, P.L.; Lombarte, A. Sagittal Otolith Shape Used in the Identification of Fishes of the Genus Serranus. Fish. Res. 2006, 81, 316–325. [Google Scholar] [CrossRef]
- Torres, G.J.; Lombarte, A.; Morales-Nin, B. Sagittal Otolith Size and Shape Variability to Identify Geographical Intraspecific Differences in Three Species of the Genus Merluccius. J. Mar. Biol. Assoc. UK 2000, 80, 333–342. [Google Scholar] [CrossRef]
- Moore, B.R.; Parker, S.J.; Pinkerton, M.H. Otolith Shape as a Tool for Species Identification of the Grenadiers Macrourus caml and M. whitsoni. Fish. Res. 2022, 253, 106370. [Google Scholar] [CrossRef]
- Murua, H.; Rodriguez-Marin, E.; Neilson, J.D.; Farley, J.H.; Juan-Jordá, M.J. Fast versus Slow Growing Tuna Species: Age, Growth, and Implications for Population Dynamics and Fisheries Management. Rev. Fish Biol. Fish. 2017, 27, 733–773. [Google Scholar] [CrossRef]
- Farley, J.H.; Williams, A.J.; Hoyle, S.D.; Davies, C.R.; Nicol, S.J. Reproductive Dynamics and Potential Annual Fecundity of South Pacific Albacore Tuna (Thunnus alalunga). PLoS ONE 2013, 8, e60577. [Google Scholar] [CrossRef] [PubMed]


| Area/Country | N | Mean | Mín | Máx | Fishery |
|---|---|---|---|---|---|
| NETAM Area | 164 | 50.0 | 21.9 | 103.0 | |
| Malta | 4 | 94.5 | 91.0 | 103.0 | Handline |
| Portugal | 143 | 45.4 | 21.9 | 69.6 | Trap; Gillnet |
| Spain | 17 | 82.3 | 22.0 | 98.7 | Trawler; Handline; Purse seine |
| ETA Area | 340 | 40.7 | 27.0 | 87.2 | |
| Côte d’Ivoire | 91 | 45.0 | 30.5 | 87.2 | Gillnet |
| Gabon | 62 | 32.8 | 27.0 | 38.0 | Gillnet; Purse seine |
| Senegal | 187 | 41.8 | 30.4 | 61.0 | Handline; Purse seine |
| Morphological Index | Formula |
|---|---|
| Aspect ratio | |
| Circularity | |
| Ellipticity | |
| Form-Factor | |
| Rectangularity | |
| Roundness |
| Morphological Index | Mean ± NETAM | Mean ± ETA | F-Value | p-Value |
|---|---|---|---|---|
| Aspect ratio | 0.39 ± 0.04 | 0.39 ± 0.03 | 0.9 | 0.349 |
| Circularity | 30.86 ± 2.75 | 27.65 ± 2.28 | 190.9 | <0.001 |
| Ellipticity | 0.44 ± 0.04 | 0.44 ± 0.03 | 0.6 | 0.425 |
| Form-Factor | 0.41 ± 0.04 | 0.46 ± 0.04 | 187.2 | <0.001 |
| Rectangularity | 0.76 ± 0.03 | 0.80 ± 0.02 | 336.3 | <0.001 |
| Roundness | 2.50 ± 0.29 | 2.65 ± 0.20 | 44.6 | <0.001 |
Disclaimer/Publisher’s Note: The statements, opinions and data contained in all publications are solely those of the individual author(s) and contributor(s) and not of MDPI and/or the editor(s). MDPI and/or the editor(s) disclaim responsibility for any injury to people or property resulting from any ideas, methods, instructions or products referred to in the content. |
© 2023 by the authors. Licensee MDPI, Basel, Switzerland. This article is an open access article distributed under the terms and conditions of the Creative Commons Attribution (CC BY) license (https://creativecommons.org/licenses/by/4.0/).
Share and Cite
Muñoz-Lechuga, R.; Sow, F.N.; Constance, D.N.; Angueko, D.; Macías, D.; Massa-Gallucci, A.; da Silva, G.B.; Gonçalves, J.M.S.; Lino, P.G. Differentiation of Spatial Units of Genus Euthynnus from the Eastern Atlantic and the Mediterranean Using Otolith Shape Analysis. Fishes 2023, 8, 317. https://doi.org/10.3390/fishes8060317
Muñoz-Lechuga R, Sow FN, Constance DN, Angueko D, Macías D, Massa-Gallucci A, da Silva GB, Gonçalves JMS, Lino PG. Differentiation of Spatial Units of Genus Euthynnus from the Eastern Atlantic and the Mediterranean Using Otolith Shape Analysis. Fishes. 2023; 8(6):317. https://doi.org/10.3390/fishes8060317
Chicago/Turabian StyleMuñoz-Lechuga, Rubén, Fambaye Ngom Sow, Diaha N’Guessan Constance, Davy Angueko, David Macías, Alexia Massa-Gallucci, Guelson Batista da Silva, Jorge M. S. Gonçalves, and Pedro G. Lino. 2023. "Differentiation of Spatial Units of Genus Euthynnus from the Eastern Atlantic and the Mediterranean Using Otolith Shape Analysis" Fishes 8, no. 6: 317. https://doi.org/10.3390/fishes8060317
APA StyleMuñoz-Lechuga, R., Sow, F. N., Constance, D. N., Angueko, D., Macías, D., Massa-Gallucci, A., da Silva, G. B., Gonçalves, J. M. S., & Lino, P. G. (2023). Differentiation of Spatial Units of Genus Euthynnus from the Eastern Atlantic and the Mediterranean Using Otolith Shape Analysis. Fishes, 8(6), 317. https://doi.org/10.3390/fishes8060317