Article

Potential Efficiency of Earth Observation for Optimum Fishing Zone Detection of the Pelagic Sardinella aurita Species along the Mediterranean Coast of Egypt

Department of Environmental Studies, The National Authority for Remote Sensing and Space Sciences, Cairo 1564, Egypt
*
Authors to whom correspondence should be addressed.
Fishes 2022, 7(3), 97; https://doi.org/10.3390/fishes7030097
Submission received: 1 February 2022 / Revised: 6 April 2022 / Accepted: 8 April 2022 / Published: 22 April 2022

Abstract

:
This research utilizes the efficiency of remotely sensed data and advanced digital image processing techniques to assist in monitoring for the management of marine fisheries in Egypt (south Mediterranean Sea region). A newly developed model is applied to the Sardinella aurita fisheries to determine optimal fishing zones, and is then applied to monitor and detect the potentially optimal fishing zones for other locally important and economic fish species. This approach depends on chlorophyll-a (Chl-a) and sea-surface temperature (SST) characteristics that are that known to control this species communities. The ranges and distribution of SST and Chl-a were obtained from Moderate Resolution Imaging Spectroradiometer (MODIS) aqua as well as Sentinel-3 satellites during the period from 2018 to 2020. The results revealed that there is a strong link between Sardinella abundance and both the SST and the Chl-a concentration. The suitable months for the abundance of this pelagic fish species were defined to be from May to November, producing 75% of the catch (nearly 42 K tons). Low abundances were recorded during the months from December to April, below the suitable harvest levels for this species. This research highlighted the importance of using satellite data as a tool to help scientists to develop appropriate management strategies for the sustainable management of fisheries resources worldwide.

1. Introduction

The development of commercial fisheries and the fish industry needs to be intensified to increase the local fish production, promote exports, improve welfare and contribute to the national food security. There is great demand for increases in fishery products in Egypt and the exploitation of marine resources using simple and cost-effective methods and modern techniques. In this regard, determining potential fishing zones (PFZ) would be of a great value to the fishing community by improving the overall fishing effectiveness.
Fishing grounds are still determined based on repeated experiences for fishermen. However, the spatial distribution and fish community structure, especially for pelagic species [1], is constantly changing and vulnerable to dynamic environmental factors and global change. This complexity makes it difficult for fishermen to determine the optimal fishing grounds using traditional experiential techniques.
Small pelagic fish are fundamental elements of the coastal marine ecosystem due to their role in energy transfer from primary and secondary producers to top predators of the food web [2,3,4]. Pelagic fishes, such as round sardinella (Figure 1), with its scientific name “Sardinella aurita” (family: Clupeidae), are widely distributed throughout tropical and subtropical seas, including the entire Mediterranean and Black Seas [5]. The round sardinella is also commercially exploited in several southern Mediterranean countries [6], including Egypt (86% of total catch) [7] Algeria, and Tunisia. Sardinella aurita is considered one of the most important fishes in the Egyptian Mediterranean waters, contributing to about 30% of the total fish production in this region. In 2019, sardine represented 13.66% of the commercial fish species in the Mediterranean Sea. The total sardine harvest from the Egyptian natural fish resources was 14612 Ton, an equivalent of 356.387 EGP (22,672.62 USD). The Mediterranean Sea produced 6557 Ton of this total amount; the Red Sea catch was 7969 Ton, and the catch for the lakes was 86 Ton [8].
S. Aurita is an important commercial resource along the coast of Alexandria and Port Said, and represents about 85% of the total fish production in El-Arish waters [5]. The fishing grounds along the Egyptian Mediterranean coast are divided into four regions; the Western region (Alexandria and El-Mex, Abu-Qir, Rasheed, El-Maadiya and Mersa Matruh), the Eastern region (Port Said and El-Arish), Damietta region and Nile Delta region. The El-Arish fishing ground constitutes 6% of the total fish production in the Egyptian Mediterranean [5].
The physical and biological processes in marine ecosystems vary depending on both space and time scales, mainly represented by sea-surface temperature (SST) and Chlorophyll-a (Chl-a), and serve as controlling attributes to fisheries [9]. Chl-a is the universal oceanographic parameter that significantly determines ocean productivity and is a convenient index of phytoplankton biomass [9], which is also related to fish production. SST is assumed to be an index of the ocean physical environment that greatly influences the physiology of living organisms and specifically affects phytoplankton growth [10]. Integrated chlorophyll concentration with SST was found to be useful to explore fishery resources and fish grouping and, hence, detect the potential fishing zones (PFZs), considering both the biological (primary production) and physical (temperature) parameters responsible for fish distribution [9].
Oceanographic processes play an important role in shaping the spatial distribution of the planktonic fish stages, controlling the conveyance from the spawning areas to more or less suitable retention zones [11,12,13]. In particular, “food” concentration and availability are often modulated by mesoscale oceanographic structures that have a crucial effect on the fate of several fish species during their larval and juvenile stages [14,15]. Therefore, understanding the link among ocean currents, the spatial distribution of early life stages, and other environmental parameters is crucial for the sustainable management of fishery resources [16,17].
An adaptation of modern technology is needed to economize the ongoing marine fishing. Satellite remote sensing has a unique ability to carry out regular, repeated observations of the entire globe or specific regions at different spatial scales, and has been used to provide a wide range of observations to support fisheries and aquaculture management, when validated against in situ observations. Satellite remote sensing has been used to support marine fisheries by locating potential fishing zones (PFZs) using temperature and productivity data to identify the areas in which fish tend to aggregate for feeding [10]. Satellite data were widely used to detect the presence of different fish types by determining the important oceanographic parameters influencing fish accumulations, such as SST and Chl-a. These parameters are significant for studying the physical and biological conditions of water, and are commonly used to detect potential fishing zones [18,19,20,21,22].
Other processes also influence the locations of potential fishing zones and timing, including water upwelling, whereby nutrient-rich upwelled water stimulates phytoplankton growth and productivity. Due to the increased biomass of phytoplankton and the presence of cool water in these regions, upwelling zones can be defined as regions of low sea-surface temperatures (SST) and high concentrations of chlorophyll-a. In addition, wind processes (i.e., speed and direction) can influence SST through surface water migration, which increases the mixing of cold and warm water and can also influence the water upwelling and currents.
Different approaches have been developed to determine PFZs using different satellite data sources. The sea-surface temperature can be obtained from satellite sensors such as the Advanced Very High-Resolution Radiometer (AVHRR) or the Moderate Resolution Imaging Spectroradiometer (MODIS), while chlorophyll-a concentration can be obtained from the IRS P4 OCM (ocean color monitor) data and MODIS [6,9,19,22,23,24]. Solanki, et al. [10] used the NOAA-AVHRR-derived SST and Indian Remote Sensing Satellite (IRS-P4) Ocean Color Monitor (OCM) chlorophyll data from October 2000 to February 2001 to validate the fishery forecast in PFZs. Feedback analysis indicated that approximately 68–80% observations in PFZs were found to be positive during experimental fishing. Banaru et al. [5] studied the dynamics of S. aurita populations in El-Arish, Southeastern Mediterranean water based on monthly samples collected between January 2008 and December 2009. Cury et al. [4] analyzed the distribution of eggs and larvae, as well as the biological features of the two species of pelagic fish, namely, Engraulis encrasicolus and S. aurita in the north-eastern sector of the Sicily Channel (Mediterranean Sea) during summer 2010–2011 cruises. They used satellite data (i.e., sea-surface temperature, wind, and chlorophyll-a concentration) to recognize the main oceanographic patterns that mark egg and larvae transport processes. Baali et al. [25] assessed the effects of environmental variations on the abundance of the S. aurita in Moroccan waters using generalized additive models based on satellite data for the period 2009–2016. They used the environmental parameters (SST, Chl-a, and upwelling index) and found that these parameters played a major role in explaining differences in monthly landings for S. aurita. The high abundance of S. aurita was observed in autumn due to the favorable environmental conditions in the south of Morocco, contributing to the migration of this species from Mauritanian to Moroccan waters.
This utilizes remote sensing to develop PFZ maps to improve the efficiency of the S. aurita fisheries on the north coast of Egypt (South Mediterranean Sea region). It is anticipated that the outcomes of this research will help to define the areas of distribution of a specific fish type. It will also fill the gaps in the limited research studies that have been carried out in Mediterranean Sea region based on remote sensing; few of these were applied to mapping the potential fishing zones. This study aims to produce integrated satellite data with Geographic Information System (GIS) modeling techniques, and the model could be robustly applied to the coastal areas richest in this (and other) pelagic fish species (i.e., Sarinella spp.) along the northern African coast of the Mediterranean (Tunisia, Morocco). Furthermore, the model could be implemented in the coastal areas of the western boarders of Africa that were shown to be among the richest zones for this species, increasing the fisheries’ economic share to Africa GDP.

2. Dataset and Methods
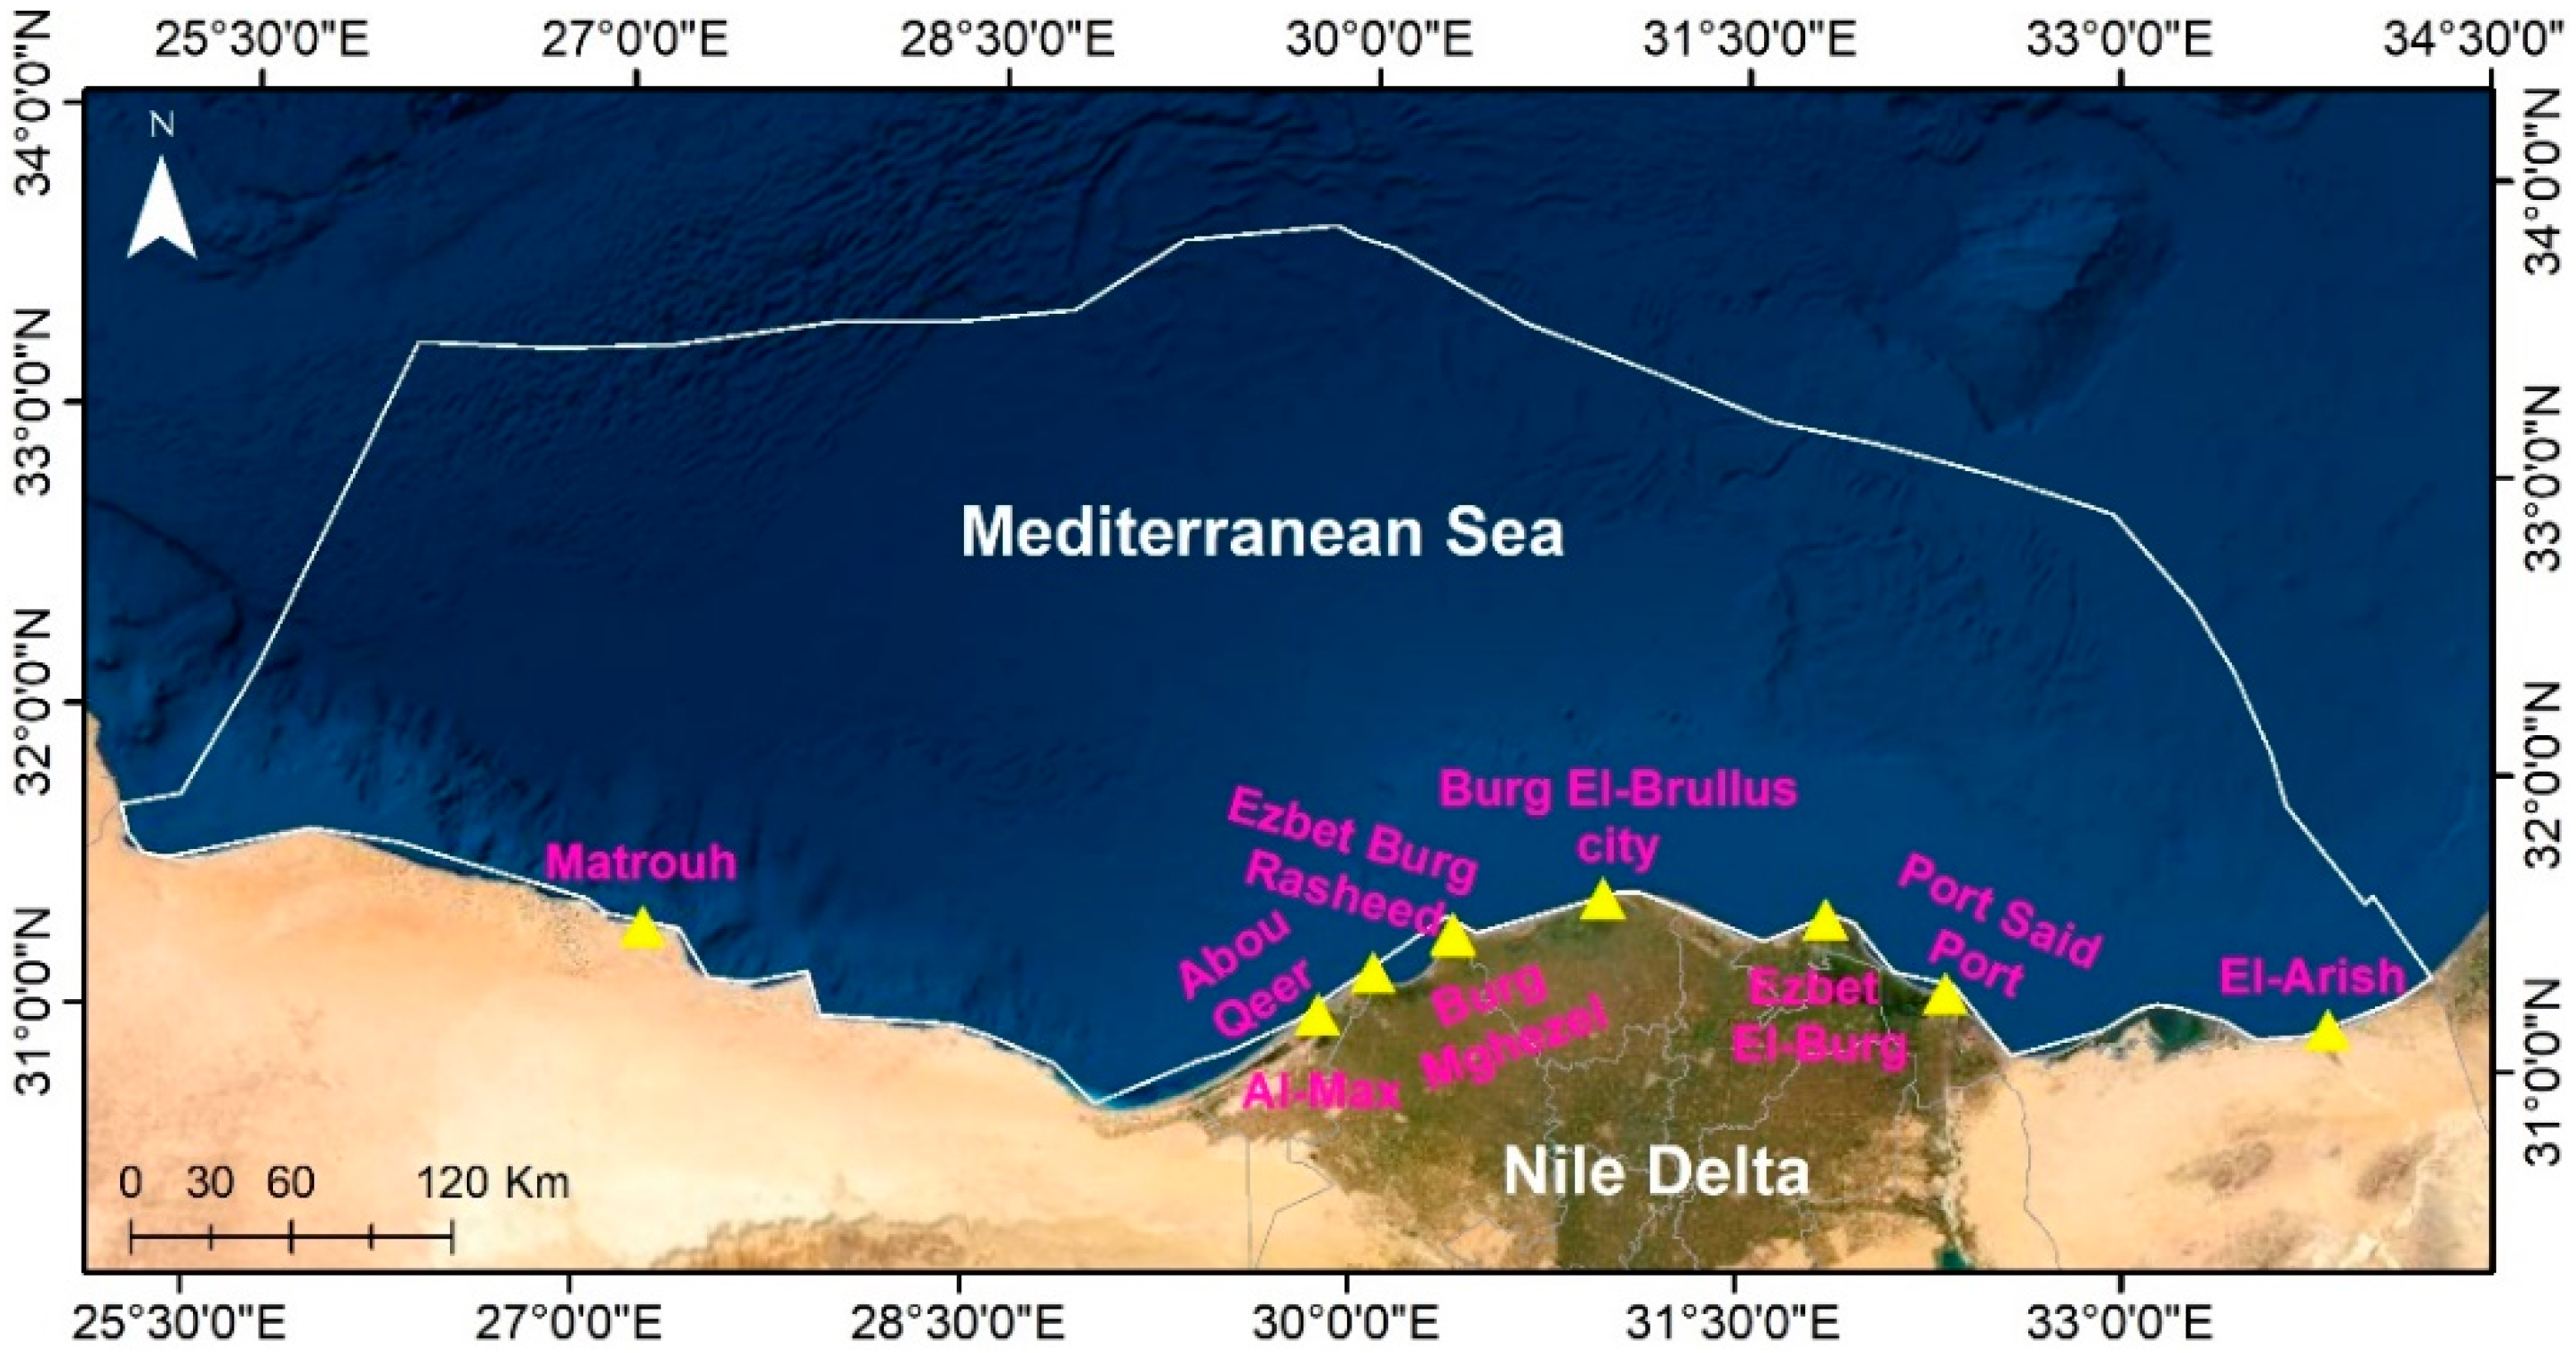
2.1. Study Area

Egypt has a long coastline of nearly 1000 km along the Mediterranean Sea and nearly 2500 along the Red Sea, Gulf of Suez and Gulf of Aqaba, as well as several coastal lakes with high potentiality for the exploration of their natural resources. The selected area of study covers the economic zone of the marine Mediterranean coastal zone of Egypt. It extends nearly 1050 km from the eastern side of the Sinai Peninsula at the Egypt–Gaza border to the western side of Sallum at Egypt’s border with Libya (Figure 2). Geographically, the area of study is located between 25° west to 34° East and 32° north to 30° south. The fishing ground zones along the Egyptian Mediterranean coast are divided into four fishing regions: (1) Western region (including Matrouh, Alexandria and El-Max, Abu Quir, El-Maadiya and Rasheed), (2) Middle Delta (including Borg El-Burullus), (3) Damietta (including Izbet El-Borg), and (4) Eastern region (including Port Said and El-Arish).
Sardinellas sp. represents 24% of the total catch from the Mediterranean Sea, with nearly 13472 Tons per year. A total of 31.5% are from the eastern region, 32% from the eastern region, and the remaining 25% are from the other two regions, with nearly 18% for both the Damietta and Middle Delta regions.

2.2. Data Sets

2.2.1. Satellite Data

Level-3 daily satellite data from the Moderate Resolution Imaging Spectroradiometer (MODIS-Aqua), launched by NASA (USA), were used to derive the main products of Sea Surface Temperature (SST), and Chlorophyll-a (Chl-a) concentration. These data were acquired for nearly 3 years, from 2018 to 2020, on a daily basis. The MODIS data were downloaded from the ocean color portal (http://oceancolor.gsfc.nasa.gov/) (accessed on 15 March 2018). MODIS data have a coarse resolution of about 4 km; therefore, the European Earth Observation satellite mission Sentinel-3, with its medium resolution of 250 m, was used for comparison and enable more precise information gathering. SST and Chl-a were downloaded from Sentinel 3 satellite using a sentinel data hub (at https://scihub.copernicus.eu/dhus/#/home) (accessed on 20 July 2018) on the same dates as MODIS to assess its accuracy.
The MODIS-Aqua satellite data were cropped to the actual study area; the daily average SST data were derived from thermal infrared (IR) bands, and Chlorophyll-a concentration was derived from the shortwave infrared (SWIR). The MODIS images were geometrically corrected, and the orbit overlaps and swath distortion (the bow-tie effect) were rectified using the “Georeferenced MODIS” function in ENVI (L3 Hareris Geospatial). Pre-processing of the MODIS images was carried out by masking the land and cloud to avoid interference from the reflectance caused by cloud and land with the actual reflectance of the ocean parameters of the model (SST, and Chl-a). Then, the images were normalized with the corresponding range, using the empirical line calibration method for to remove the illumination and atmospheric effects [26,27]. On the other hand, a mosaic process was applied to different scenes of Sentinel 3 data to obtain an image of both SST and Chl-a, covering the North coast of Egypt. Sentinel 3 data pre-processing techniques were performed using Snap toolbox, while further processing and modelling were implemented based on GIS techniques.

2.2.2. Field Survey

For PFZ validation, a field survey was carried out in October 2020 along the four fishing harbors, from Damietta to Matrouh. A questionnaire was designed to collect as much information as possible from fishermen about their daily fish production activities and the different types of boats.

2.2.3. Ancillary Data

A historical record of statistical data on fish production in Egypt from the Mediterranean Sea was obtained from the Fish statistics Yearbook, published by the General Authority for Fish Resources Development (GAFRD) in Egypt. This report enabled the creation of a database of fish types and quantity in the region. These fish statistics was integrated with the information obtained from the questionnaire and correlated with the mapping of potential fishing zones.
As reported by GAFRD, the annual fish production was raised by 6.14% (111,942 Ton) in 2018; compared with fish production in 2017, this percent is estimated by about 48.25 billion pounds. The seas contributed to this increase in fish production by about 5.41%, while lakes contributed by 10.07% and the Nile River by 3.81%; the major contribution in the raised fish production in Egypt was from the aquaculture (about 80.71%). Moreover, in the same year (2018), the fish production in the Mediterranean Sea decreased by 3.73% (about 2196 Ton), and by 5.65% (about 2873 Ton) in the Red Sea compared with 2017; this caused the fishing activities in some regions to cease due to policy processes. On the other hand, the production from lakes increased by 6.21% (11,388 Ton). The total amount of sardine produced from natural sources was estimated to be 18,420 Ton in 2018: the Mediterranean Sea contributed 8902 Ton, the Red Sea 9499 Ton and lakes contributed 19 Ton. This amount is estimated to be 386820 thousand pounds [8]. In 2019, fish production from the Mediterranean Sea decreased by 15.36% (8712), due to the cessation of fishing activities due to policy issues, and production from the Red Sea increased by 6.19% (2970 Ton) compared with 2018 [8]. Table 1 lists some examples of the monthly catch of the Sardinella fish type in the fishing regions in 2018, and the quantity collected per landing site. This was used for the model simulation and mapping.

2.3. Methods and Models

2.3.1. Sea-Surface Temperature (SST)

SST was obtained from two satellite data sources: MODIS and Sentinel 3 data. Equation (1) was used to estimate the SST value using the ATBD-MOD25 Walton algorithm-based method for MODIS data.
SST = c 1 + c 2   *   T 11 + c 3 T 11 T 12   *   T s f c + c 4   *   ( sec θ 1 ) * T 11 T 12
This equation is based on the non-linear algorithm for SST estimation, where Tn is the brightness temperature (measured at the n ≠ m wavelength in the channels); Tsfc is a climatological estimate of SST in the site; θ is the satellite zenith angle; and c1, c2, c3, and c4 are coefficients estimated in a linear correlation and given at (c1 = 1.228552 and c2 = 0.9576555 and c3 = 0.1182196 and c4 = 1.774631).
However, Equation (2) was used to estimate the SST from Sentinel 3 data after [28].
T s = 1.06   T 4 T 5 + 0.46 T 4 T 5 2
TS is the estimated temperature of the sea surface, while T4 and T5 are the Sentinel 3 thermal channels.

2.3.2. Chl-a

Phytoplankton is the basic food for fish, from which chlorophyll-a is detected to reflects the ocean and water color. A ready-made MODIS product of Chl-a was used; however, the raw data have an empirical function using the same Chl-a algorithm, developed by [29,30]. An empirical Chl-a algorithm (Chl-a OC3 O’Reilly) that connects the log-transformed remote-sensing reflectance ratio to the chlorophyll concentration is presented in [28], and it is simplified in Equations (3) and (4). This algorithm relies on the three basic visible light channels (Blue, Green, Red).
R = log 10 R G > R B R R  
C h l a = 10 0.28 2.753   R + 1.457   R 2 + 0.659   R 4
where:
  • R G = G r e e n   r e f l e c t a n c e
  • R B = B l u e   r e f l e c t a n c e
  • R R = R e d   r e f l e c t a n c e
  • C h l a = C o n c e n t r a t i o n   p e r   c u b i c   m e t e r ,   mg · m 3

2.3.3. Suitability Index (SI)

The suitability index for both SST values and Chl-a concentration were determined for S. aurita species at SST 22–28.5 °C and Chl-a at more than 0.2 mg/m3. The suitability values were selected according to the histogram analysis, as well as different approaches, which define the suitable conditions for the SST and Chl-a for Sardinella autria abundance [21,31,32].
The upwelling of sea water is another factor that influences the potential fishing zones. Upwelling is an oceanographic phenomenon that involves the wind-driven motion of dense, cooler, and usually nutrient-rich water towards the ocean surface, replacing the warmer, usually nutrient-depleted surface water. The nutrient-rich upwelled water stimulates the growth and reproduction of primary producers such as phytoplankton. Due to the biomass of phytoplankton and presence of cool water in these regions, upwelling zones can be identified by cool sea-surface temperatures (SST) and high concentrations of chlorophyll-a.

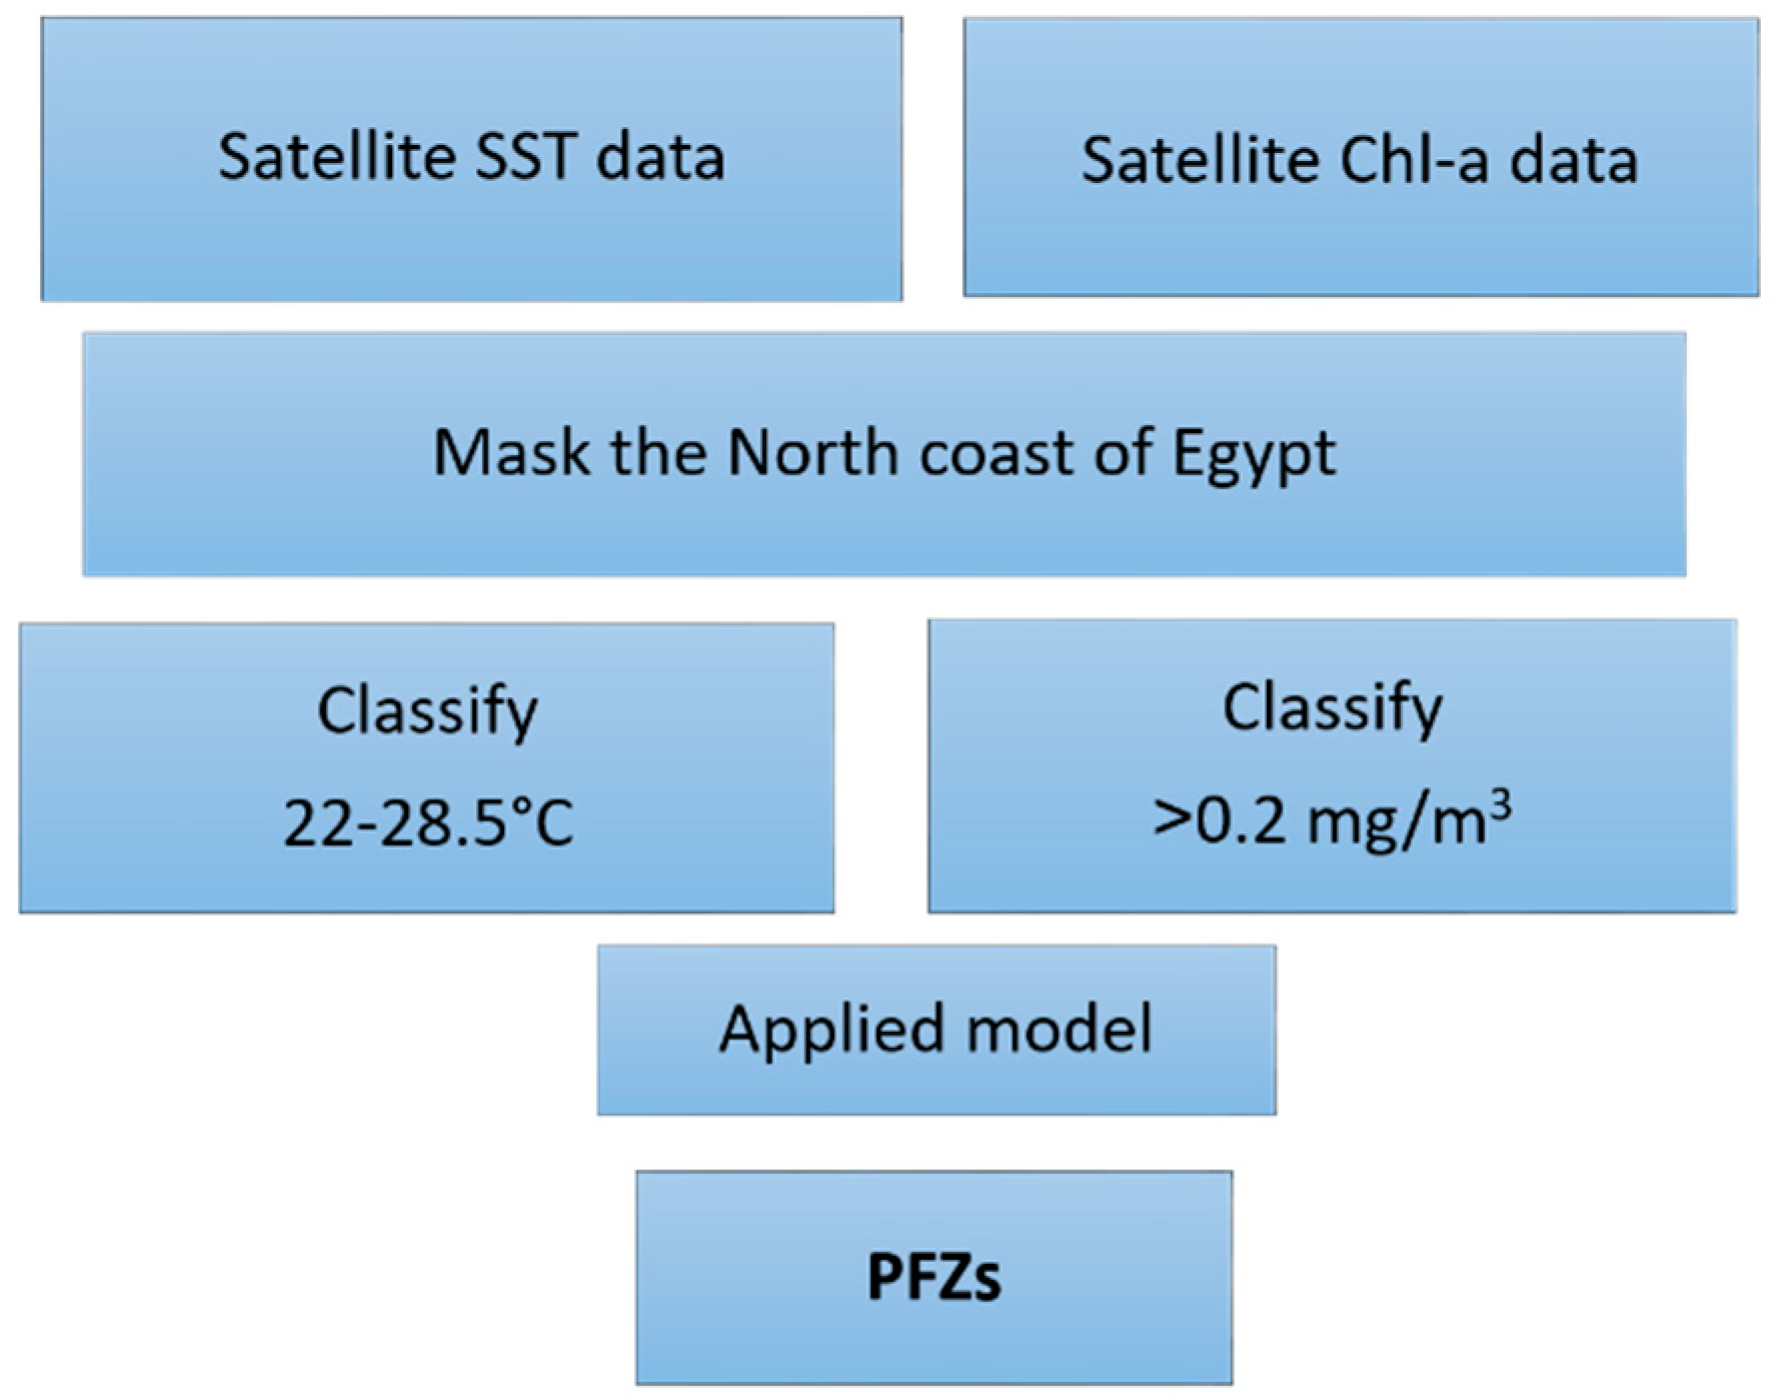
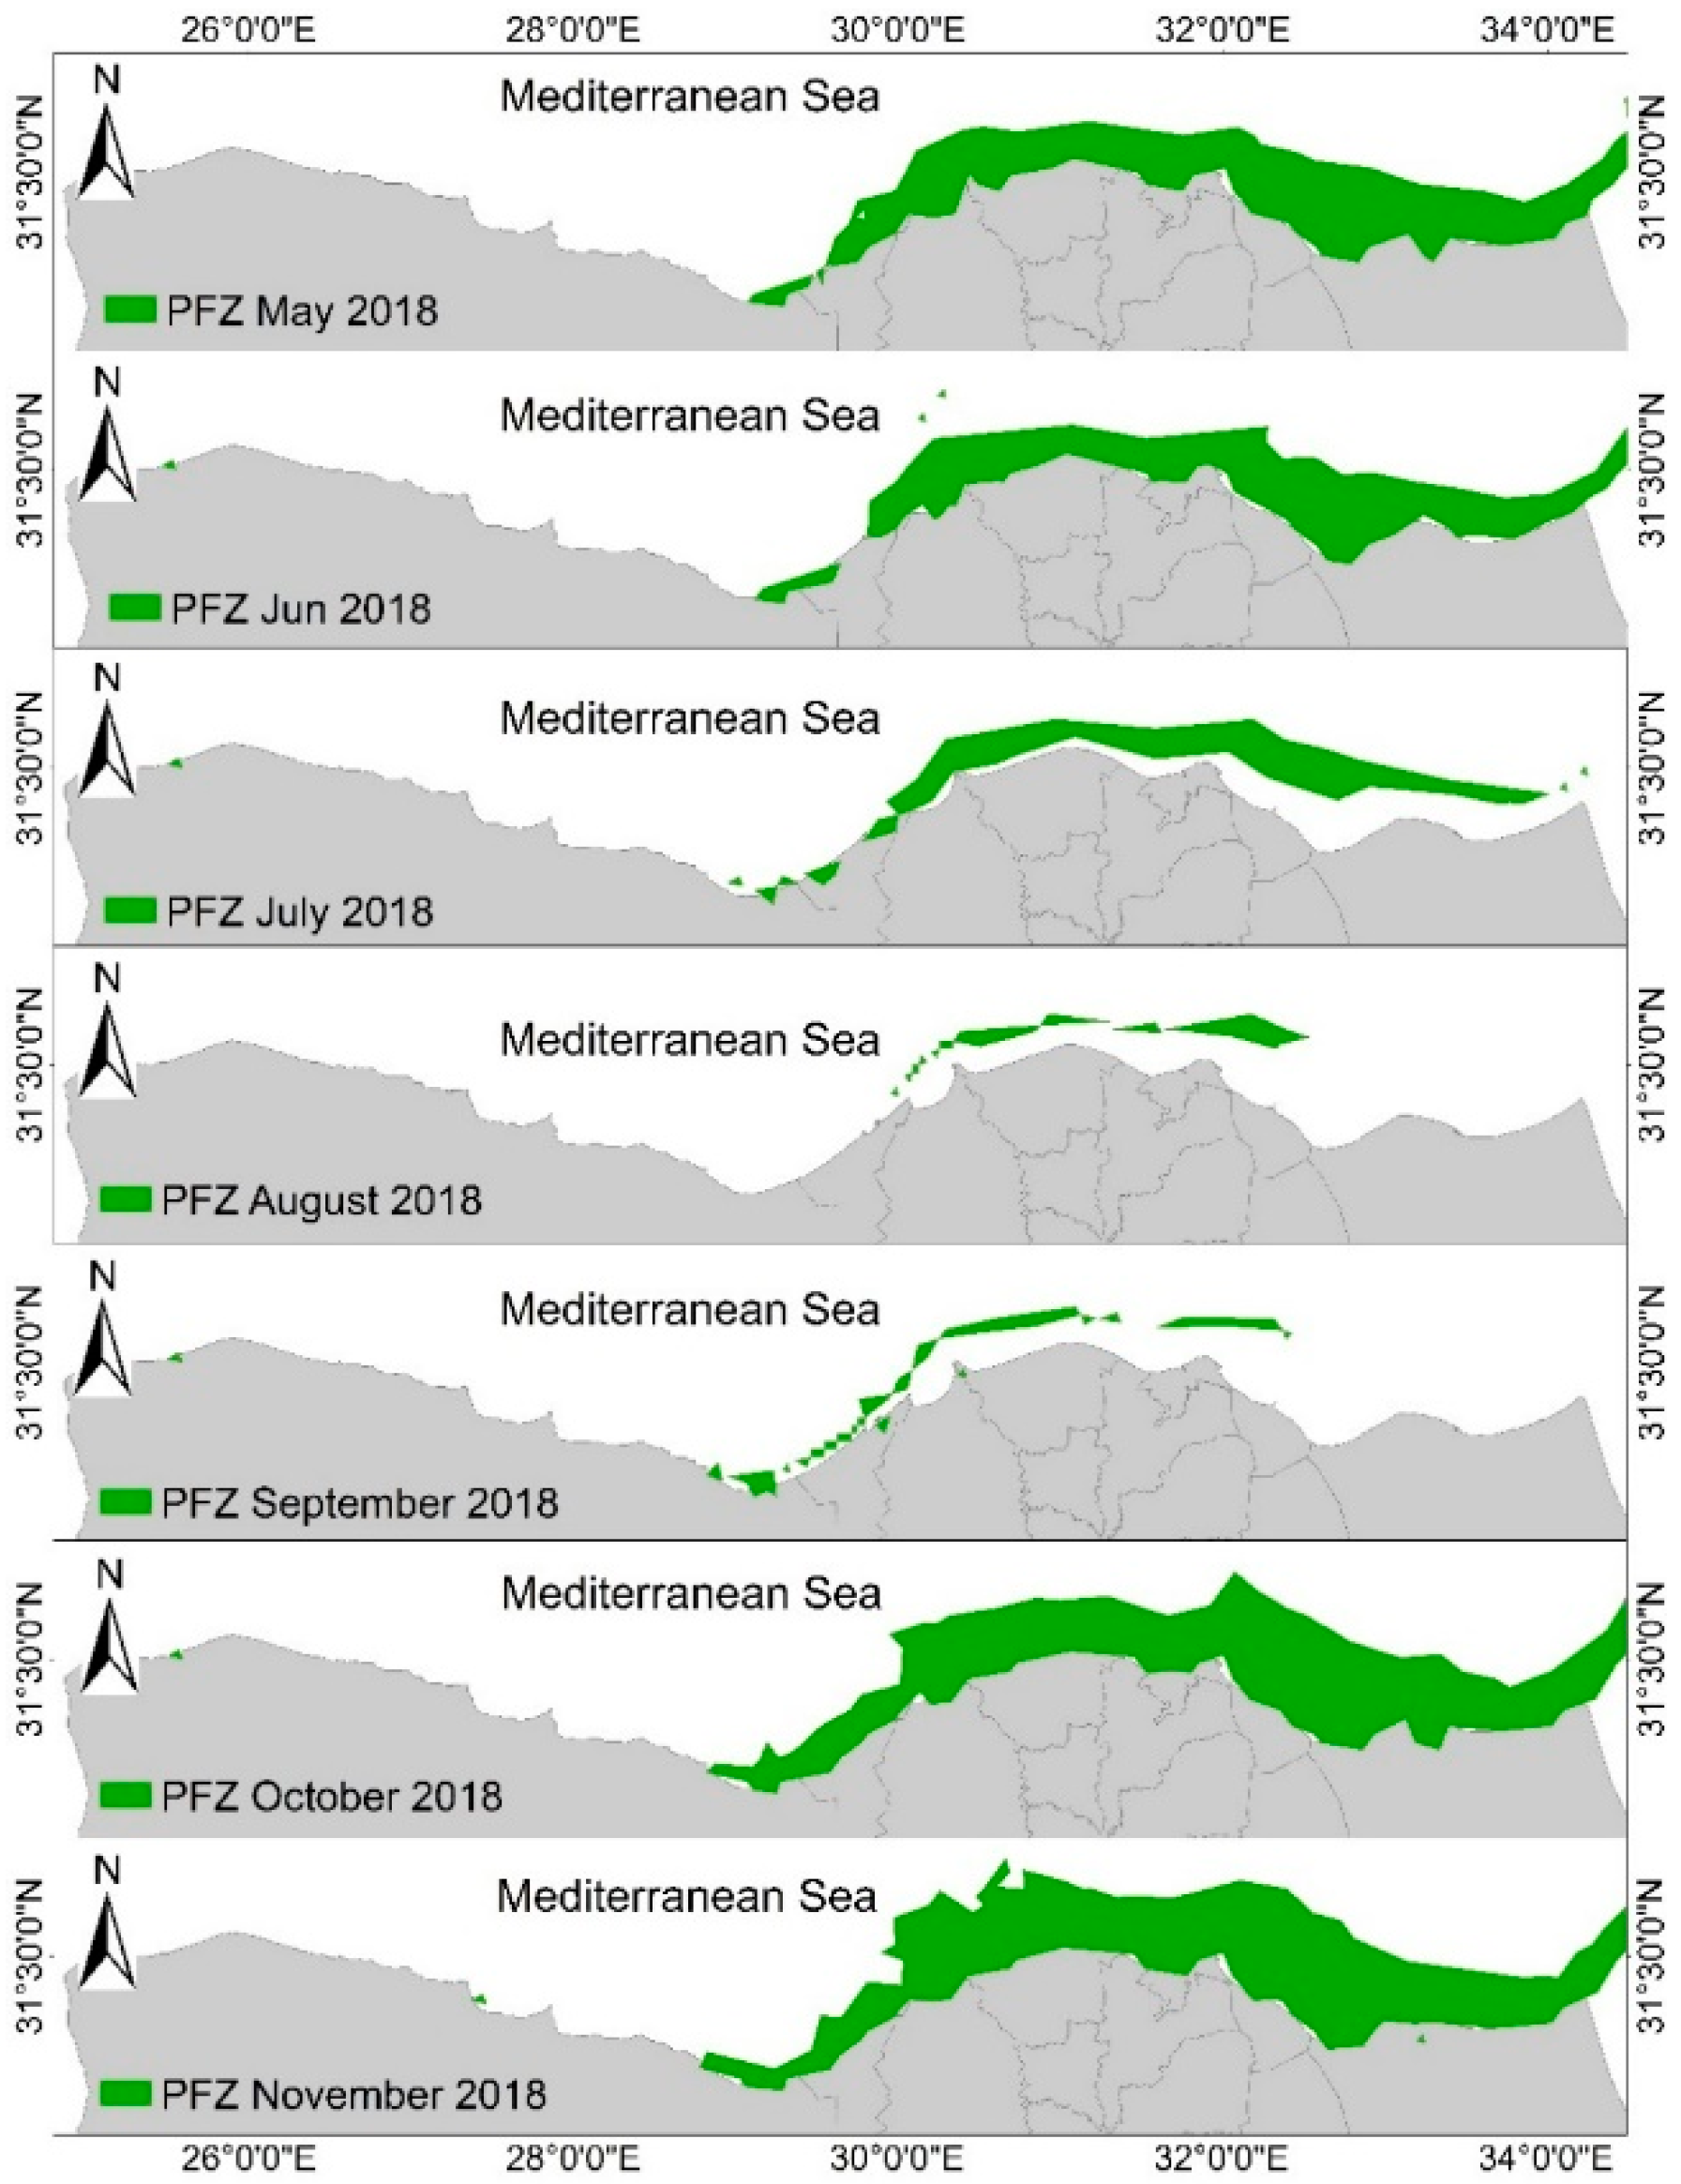
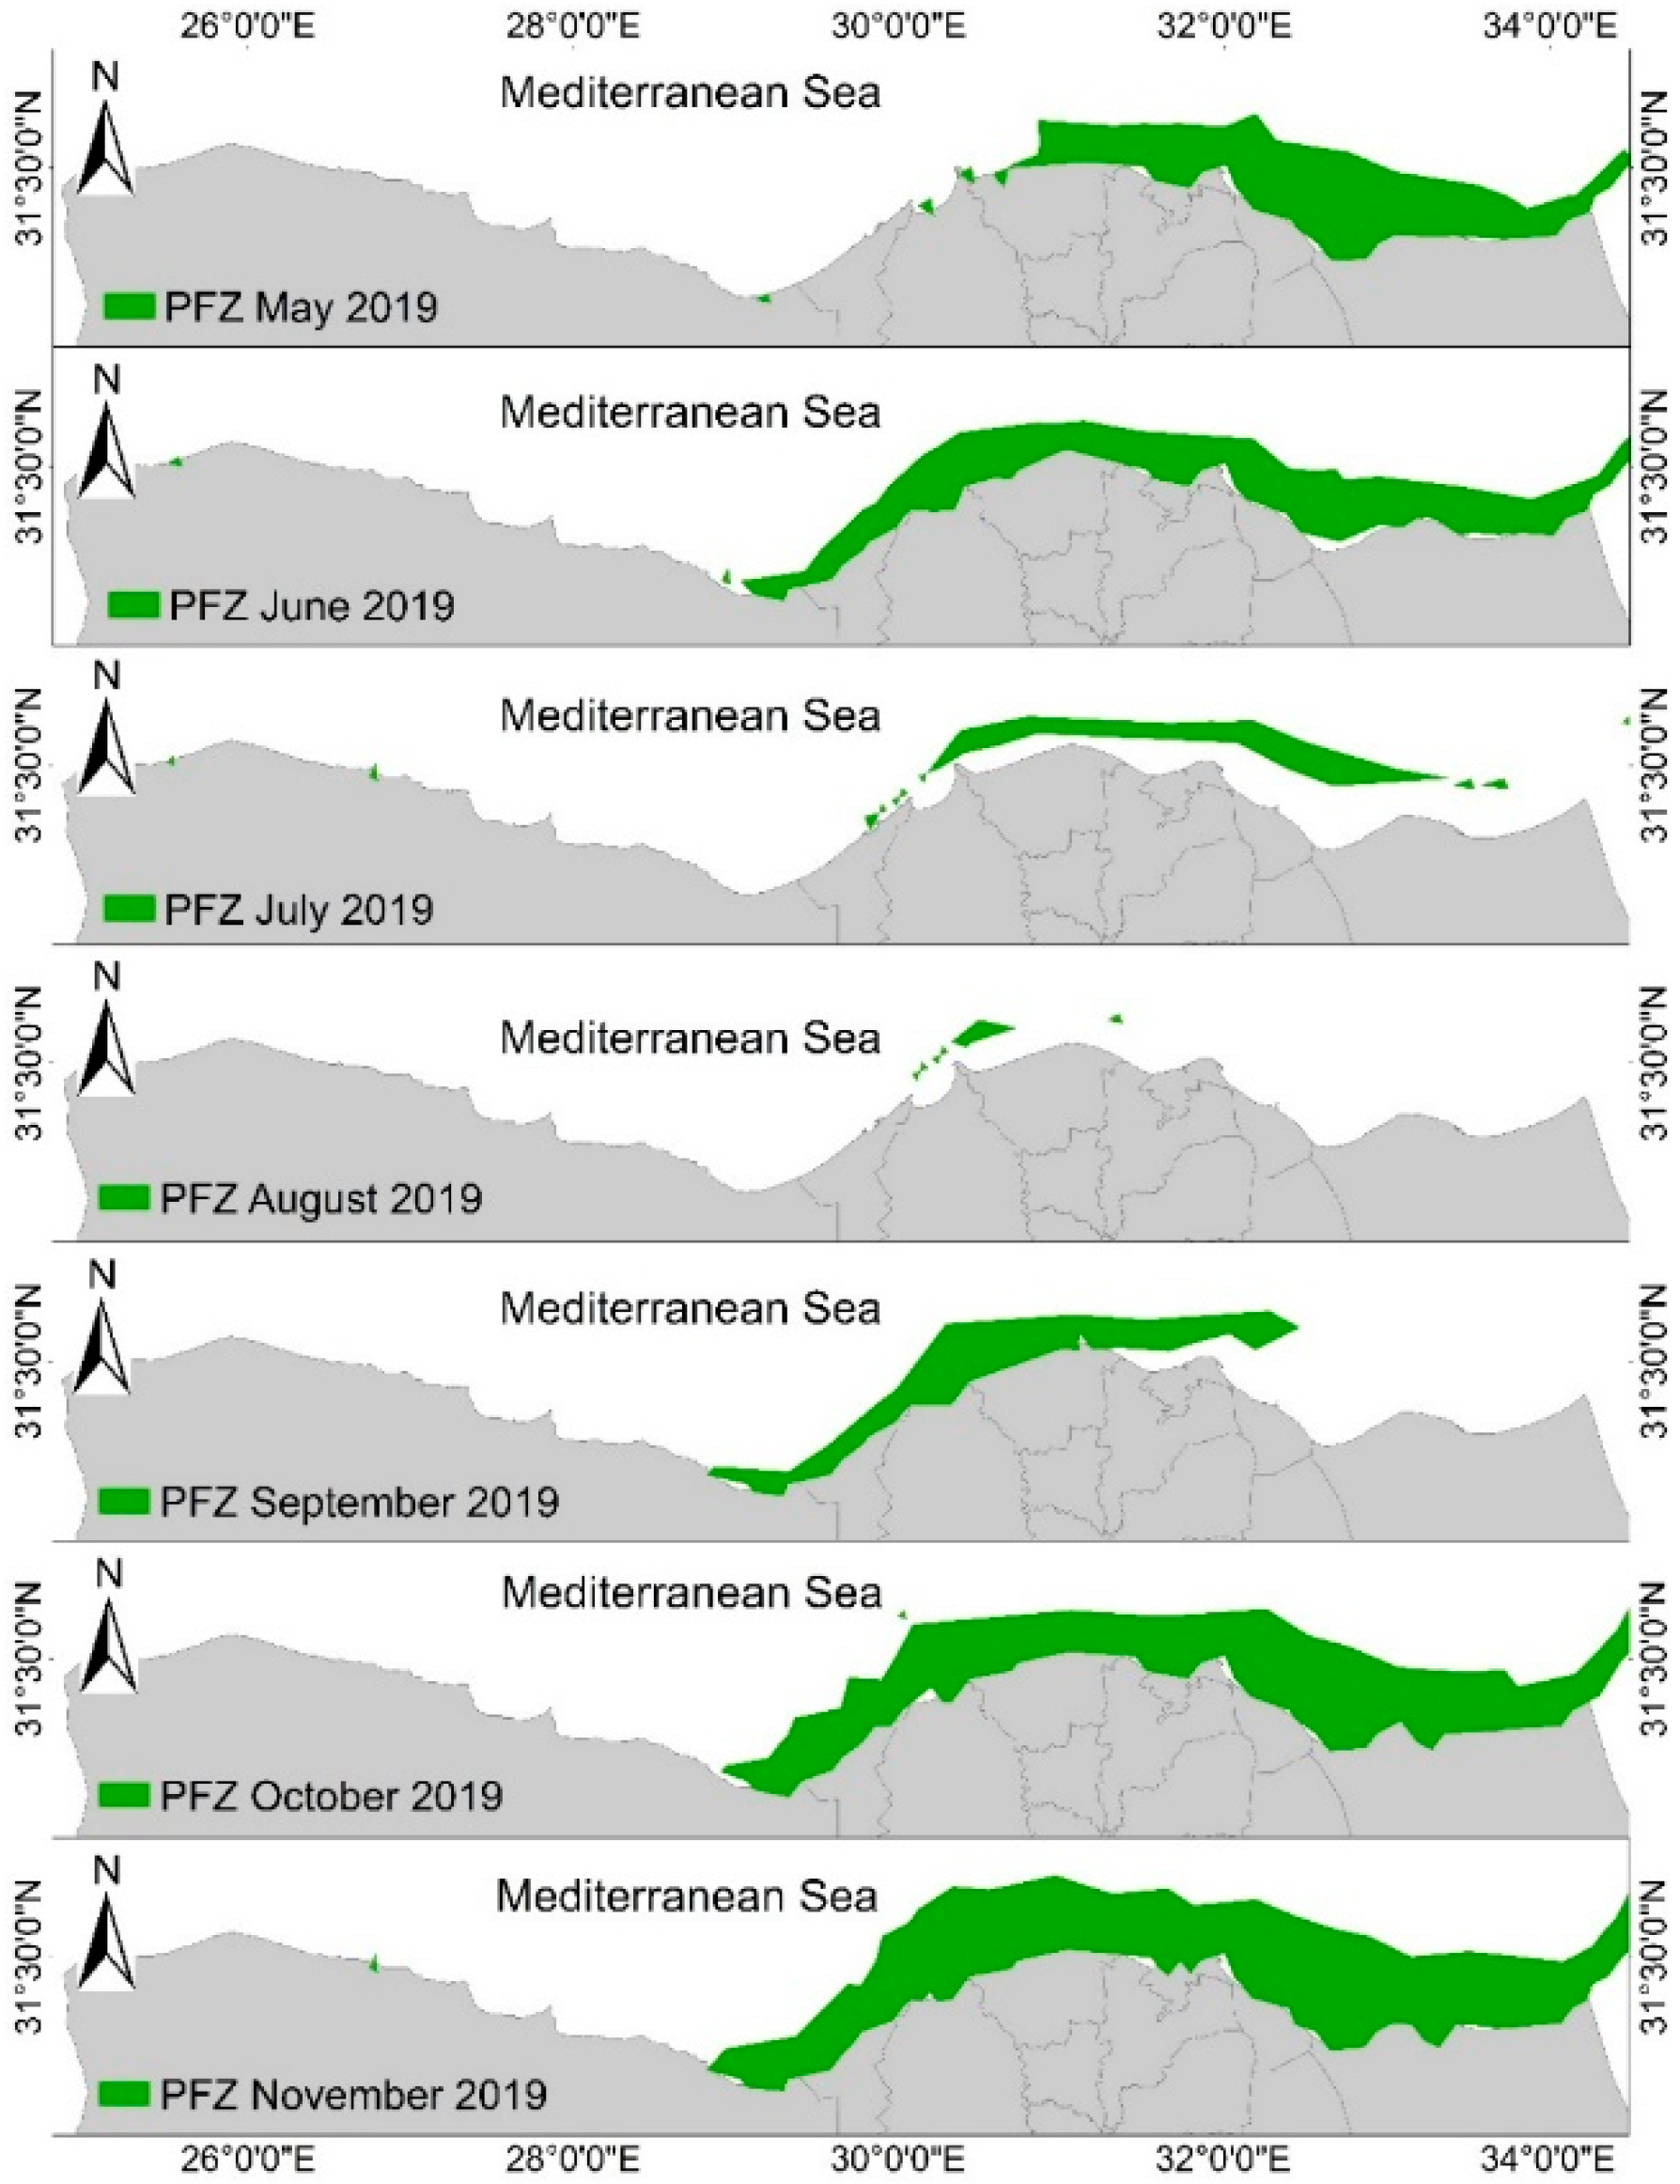
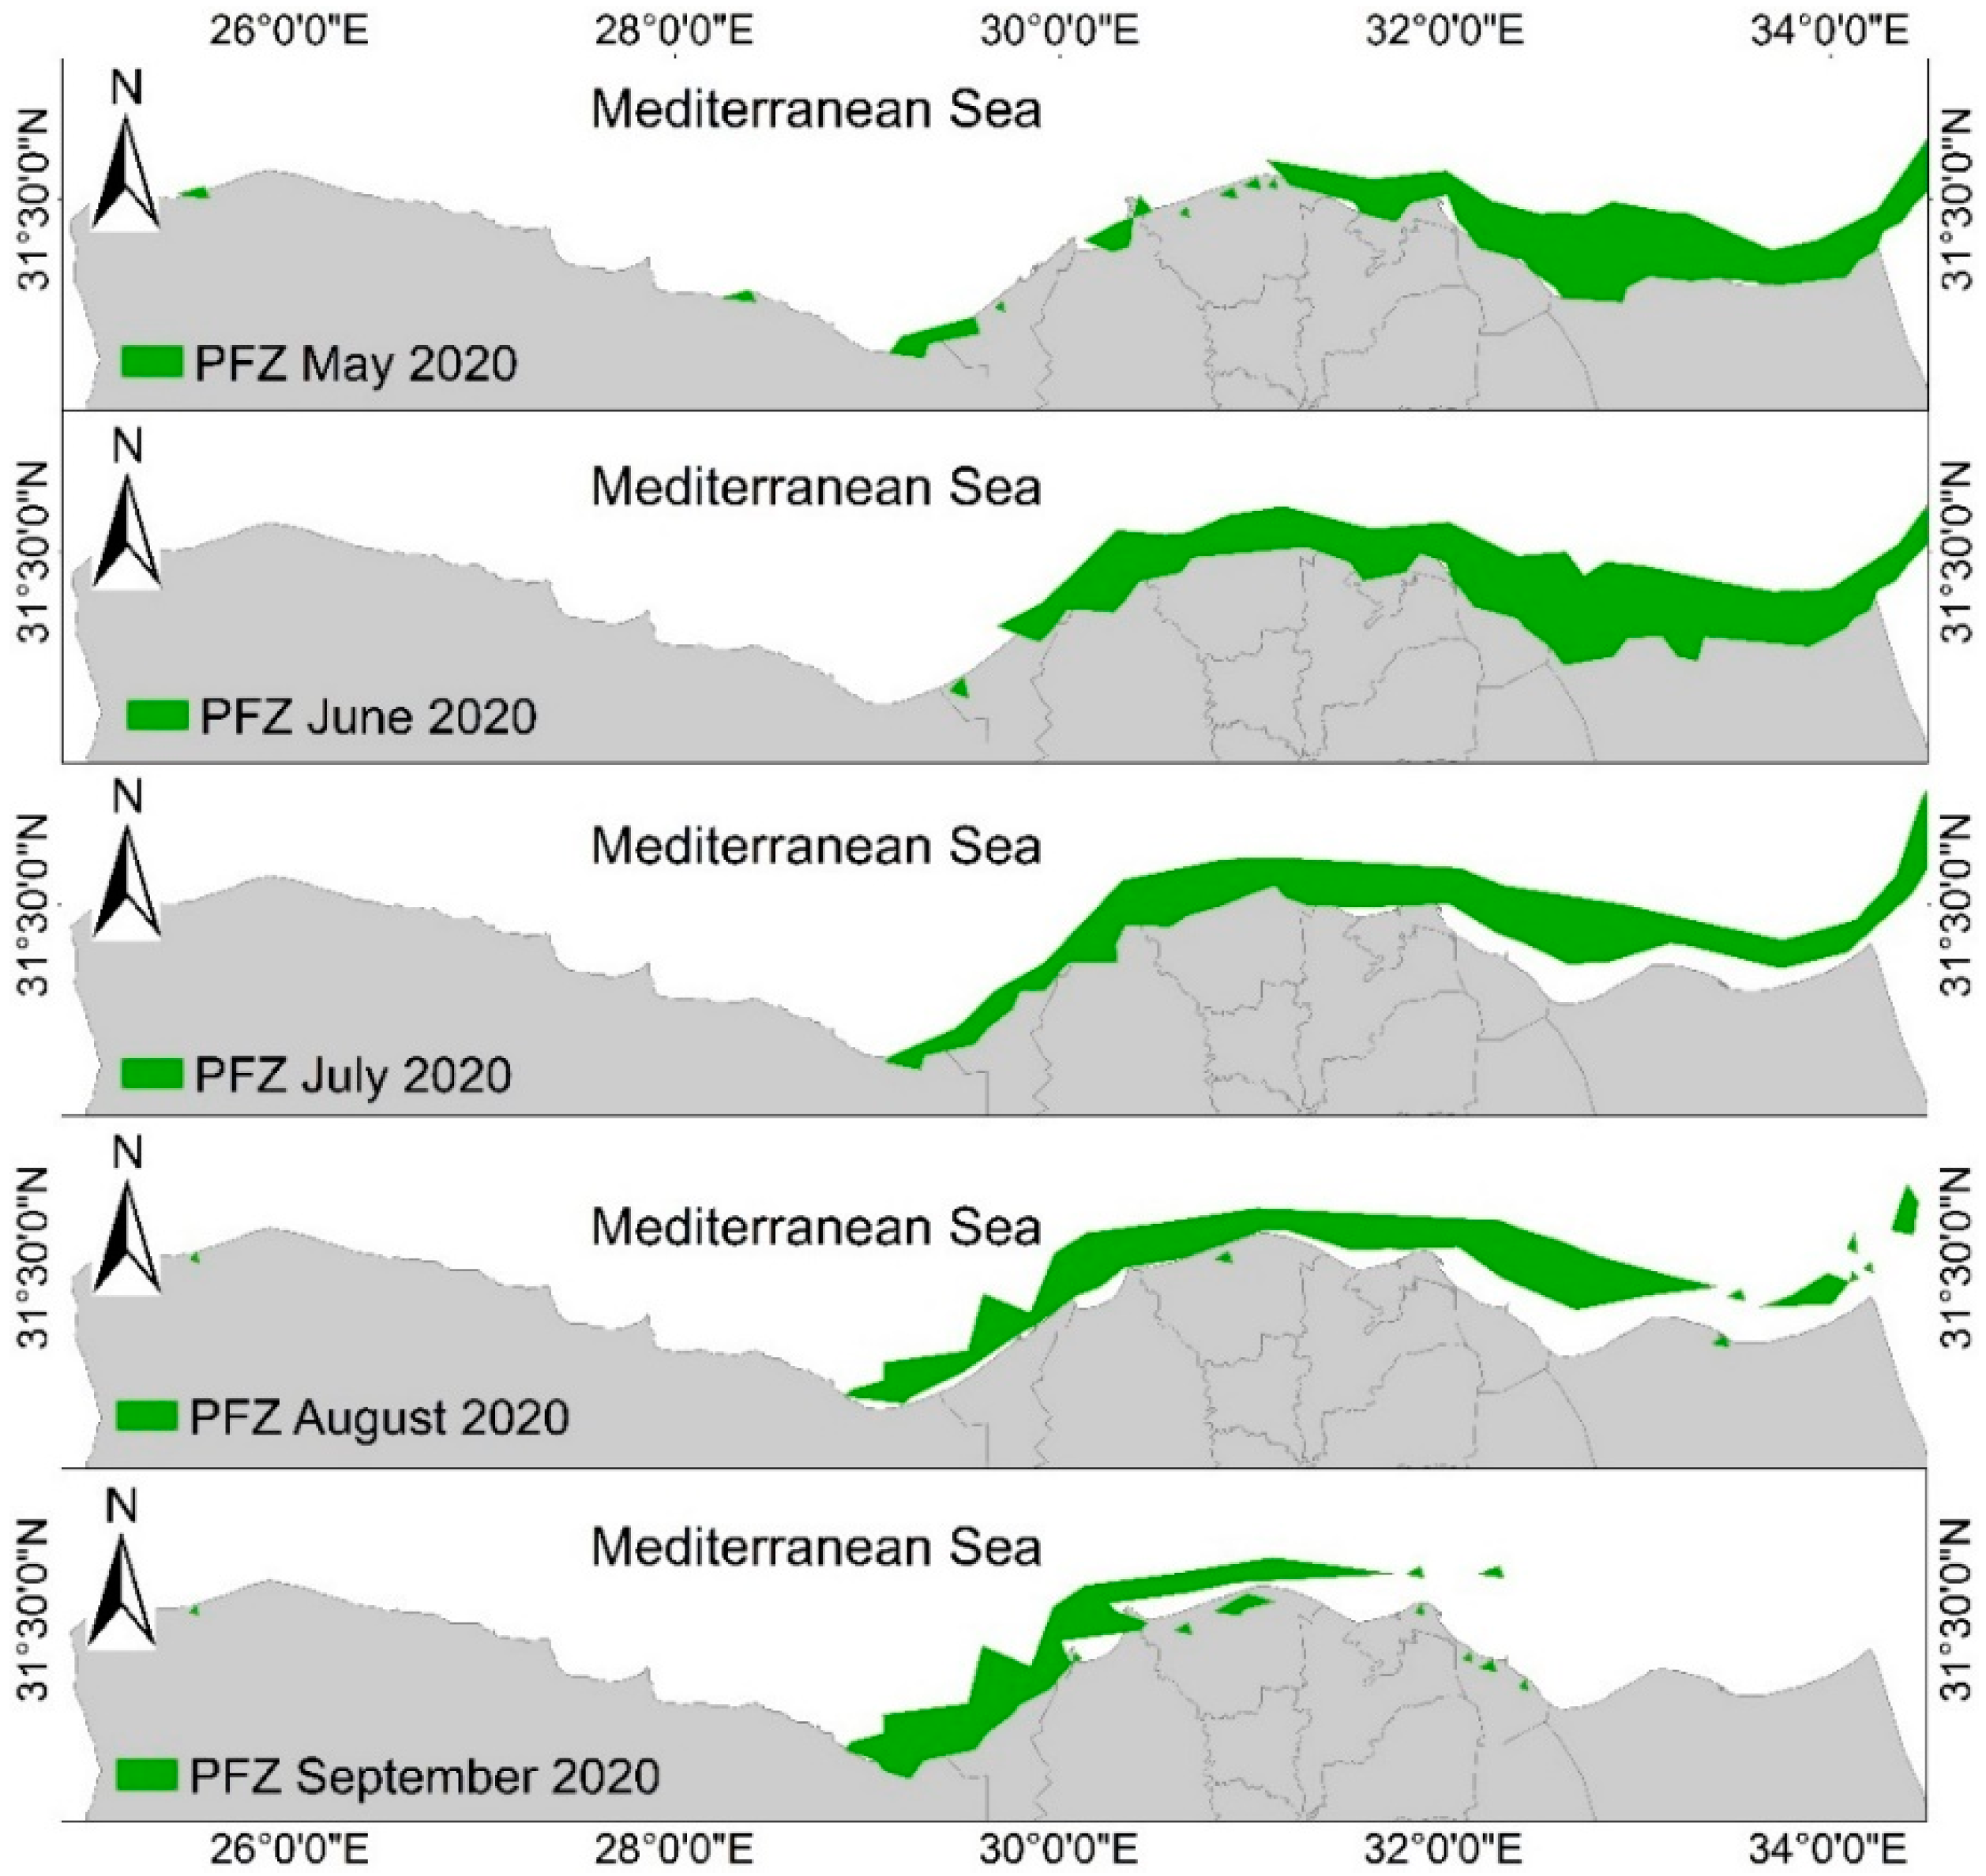
2.3.4. Mapping Potential Fishing Zone (PFZ)

Regression analysis was applied to measure the statistical correlation with the main environmental variables (SST and Chl-a), controlling the availability and dominance of Sardinella fish species. It is also correlated with the actual catch from the main location according to the record in Table 1, obtained from the fish resources’ authority. The regression model that was adopted to map the PFZ involved an estimation of the conditional expectation of the dependent variable, based on the independent variables (X1, X, …, Xn) according to Equation (5). A linear relationship is expected according to this equation [28].
PFZ = α0 + α1X1i + α2X2i + α3X3i + α4X4i + …
where 1 < i < n is the cases in the sample size (n); 0, 1, 2, 3, …, and n are the unknown regression equation coefficients; PFZ is a potential fish zone.
Finally, the generated zones are converted into a spatial geographical layer for further analysis and operability. The ArcGIS model was developed to find regions that match the suitable environmental conditions of Sardinella aurita species of both SST and Chl-a. and seawater salinity. Figure 3 shows the steps that were applied to achieve this methodology.

3. Results and Discussion

Landings of commercial fisheries can provide indications of the variations in their composition and abundance [33]. However, fishery landings have some limitations including environmental factors, fishing techniques, fishing equipment, fishermen behavior, changing markets, discarding, management and economic factors [34]. This research highlights the influence of environmental factors on fish distribution.

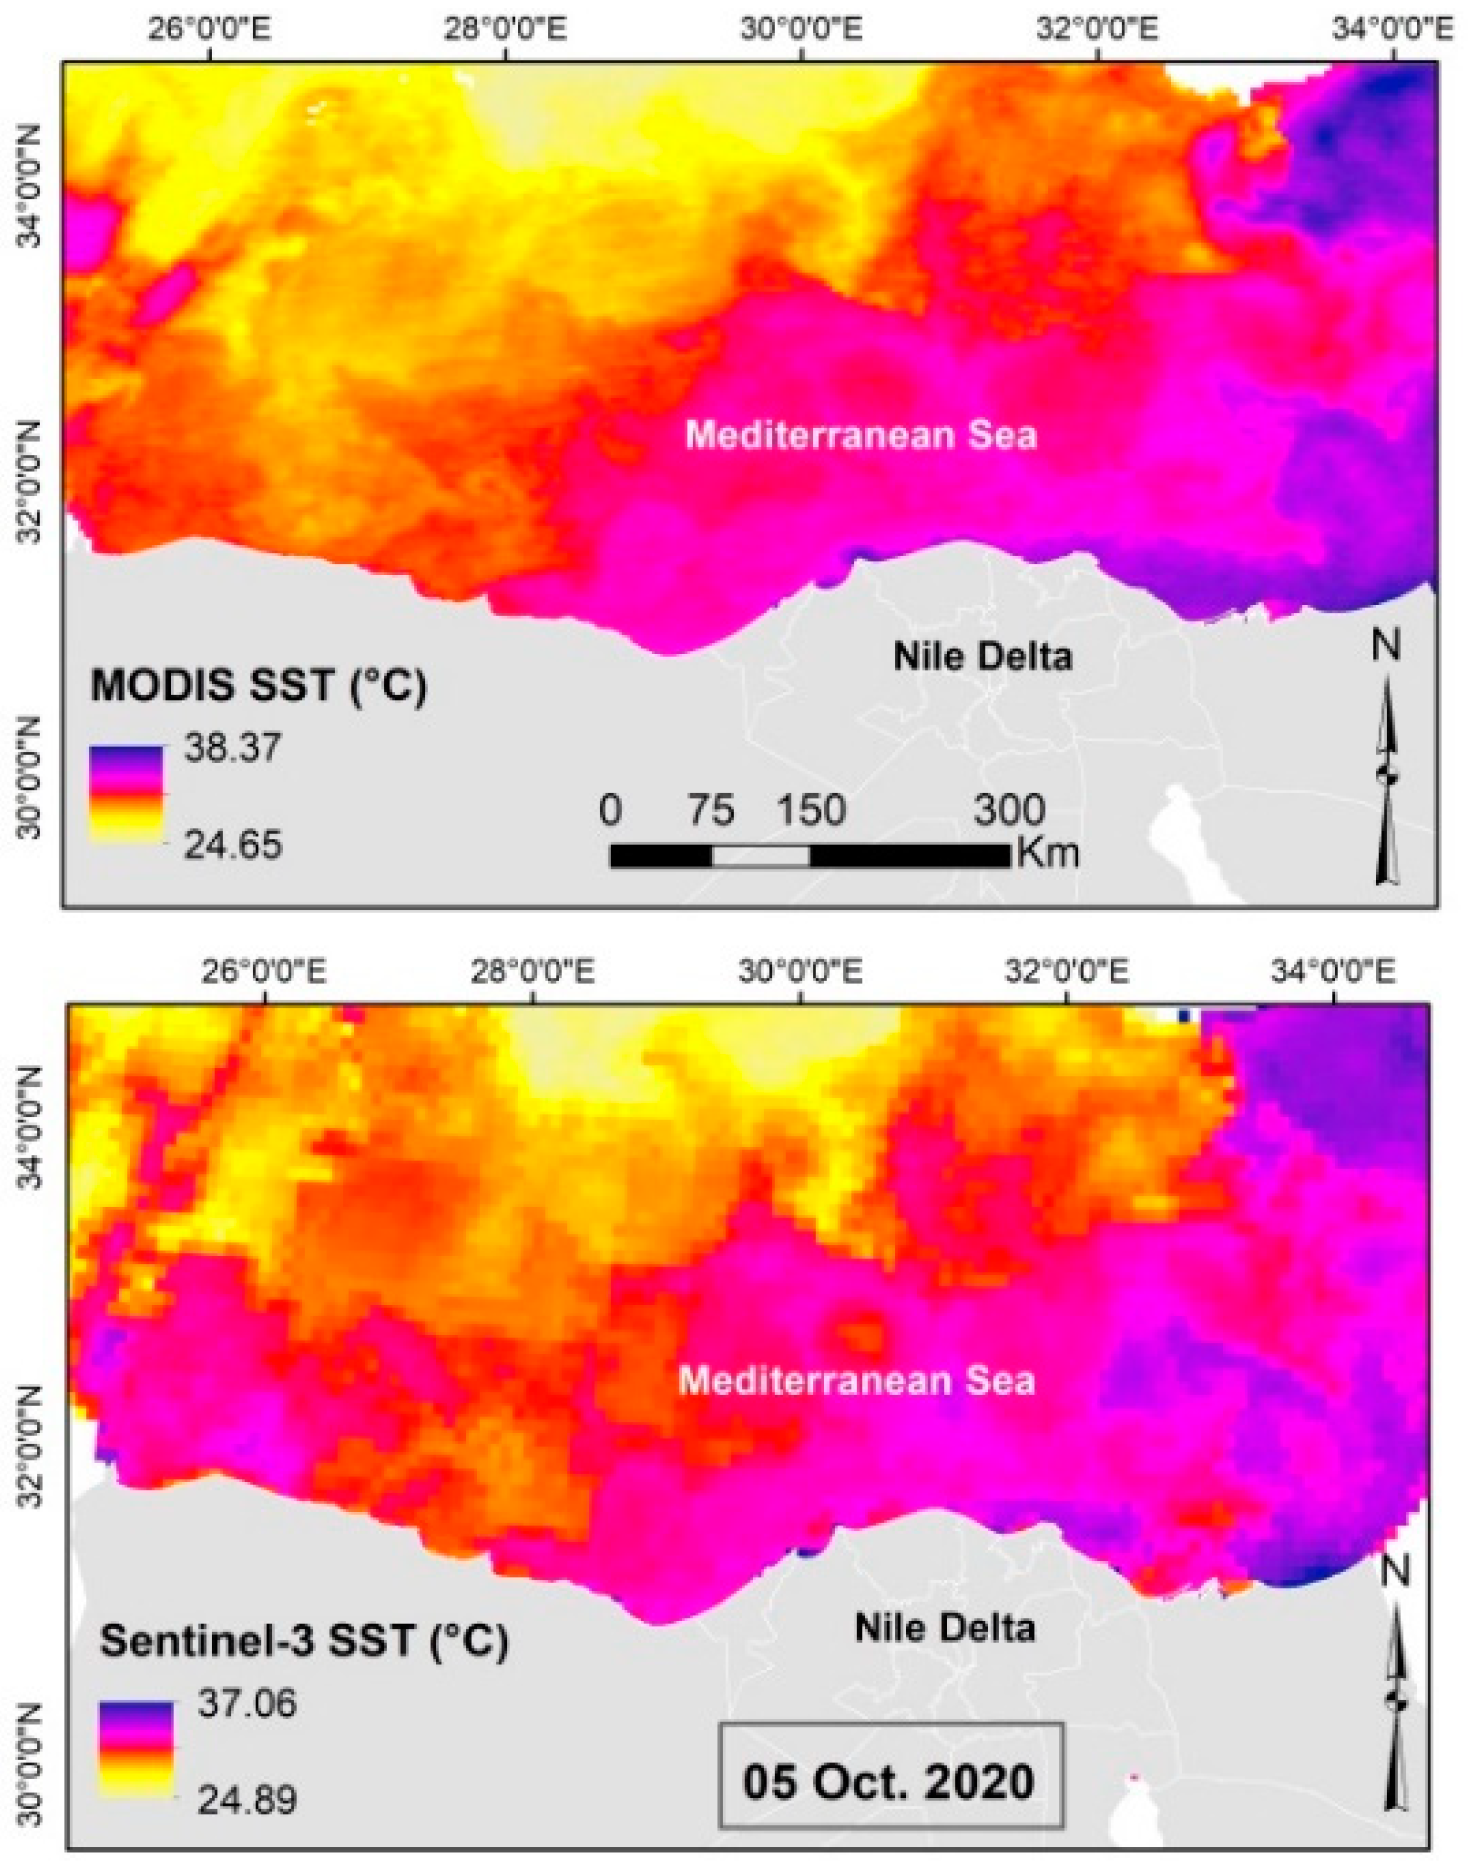
3.1. Variations in Sea Surface Temperature

Satellite data showed monthly variations in SST for two years, from 2018 to 2020, with clear seasonal differences of 7 and 10 °C between summer and winter months. Higher SST values (25° to 30 °C) were recorded during the summer months (June to September), with a maximum of (28–30 °C) in August and September. A slight decrease in SST was observed (23–25 °C) along the coast during October and November. During the winter months (December to March), SST showed relatively lower values (12 to 15 °C). During the spring months, the temperature started to rise again, to 17.5–19.5 °C.
The data showed that sea-surface temperature along the coastal region is slightly higher than that in the open sea. The differences between near-shore SST and the SST of the open-sea ranged from 2 to 3 °C. Figure 4 presents a comparison of SST between both Sentinel-3 and MODIS on 5 October 2020, along the coastal zone of Egypt. This SST map shows higher values near to the coast compared to the open sea, and higher values are also observed in the western region than the eastern Mediterranean. There is a similarity in SST distribution from the two sources of data. The maximum SST was 38.37 °C and 37.06 °C, while the minimum SST was 24.65 °C and 24.89 °C, from MODIS and sentinel-3, respectively. A slight difference was noticed in the values, which may return to the different resolutions between the two sources of data. These variations in water temperature enhance the water’s upwelling movements and fish migration from cool to warm regions. This upwelling is important in the determination of fishing areas on the coasts [18].
It was observed that the SST values of the coastal zones from Alexandria to El-Arish are greater compared to other zones of the west Mediterranean coast. This returns to the effect of the hot north-east winds that originate during the summer months over the eastern regions of the Mediterranean, more than the west direction of the coast. While the eastern areas are warmer during winter months due to the effect of cold winds coming from the north-west affecting the western side of the Mediterranean. This proves the control of SST variations from west to east on the fish catch, which was confirmed by the landing areas of fish catch, which showed that the sardinella production was very low in Matrouh in the west direction, as highlighted earlier, in Table 1.

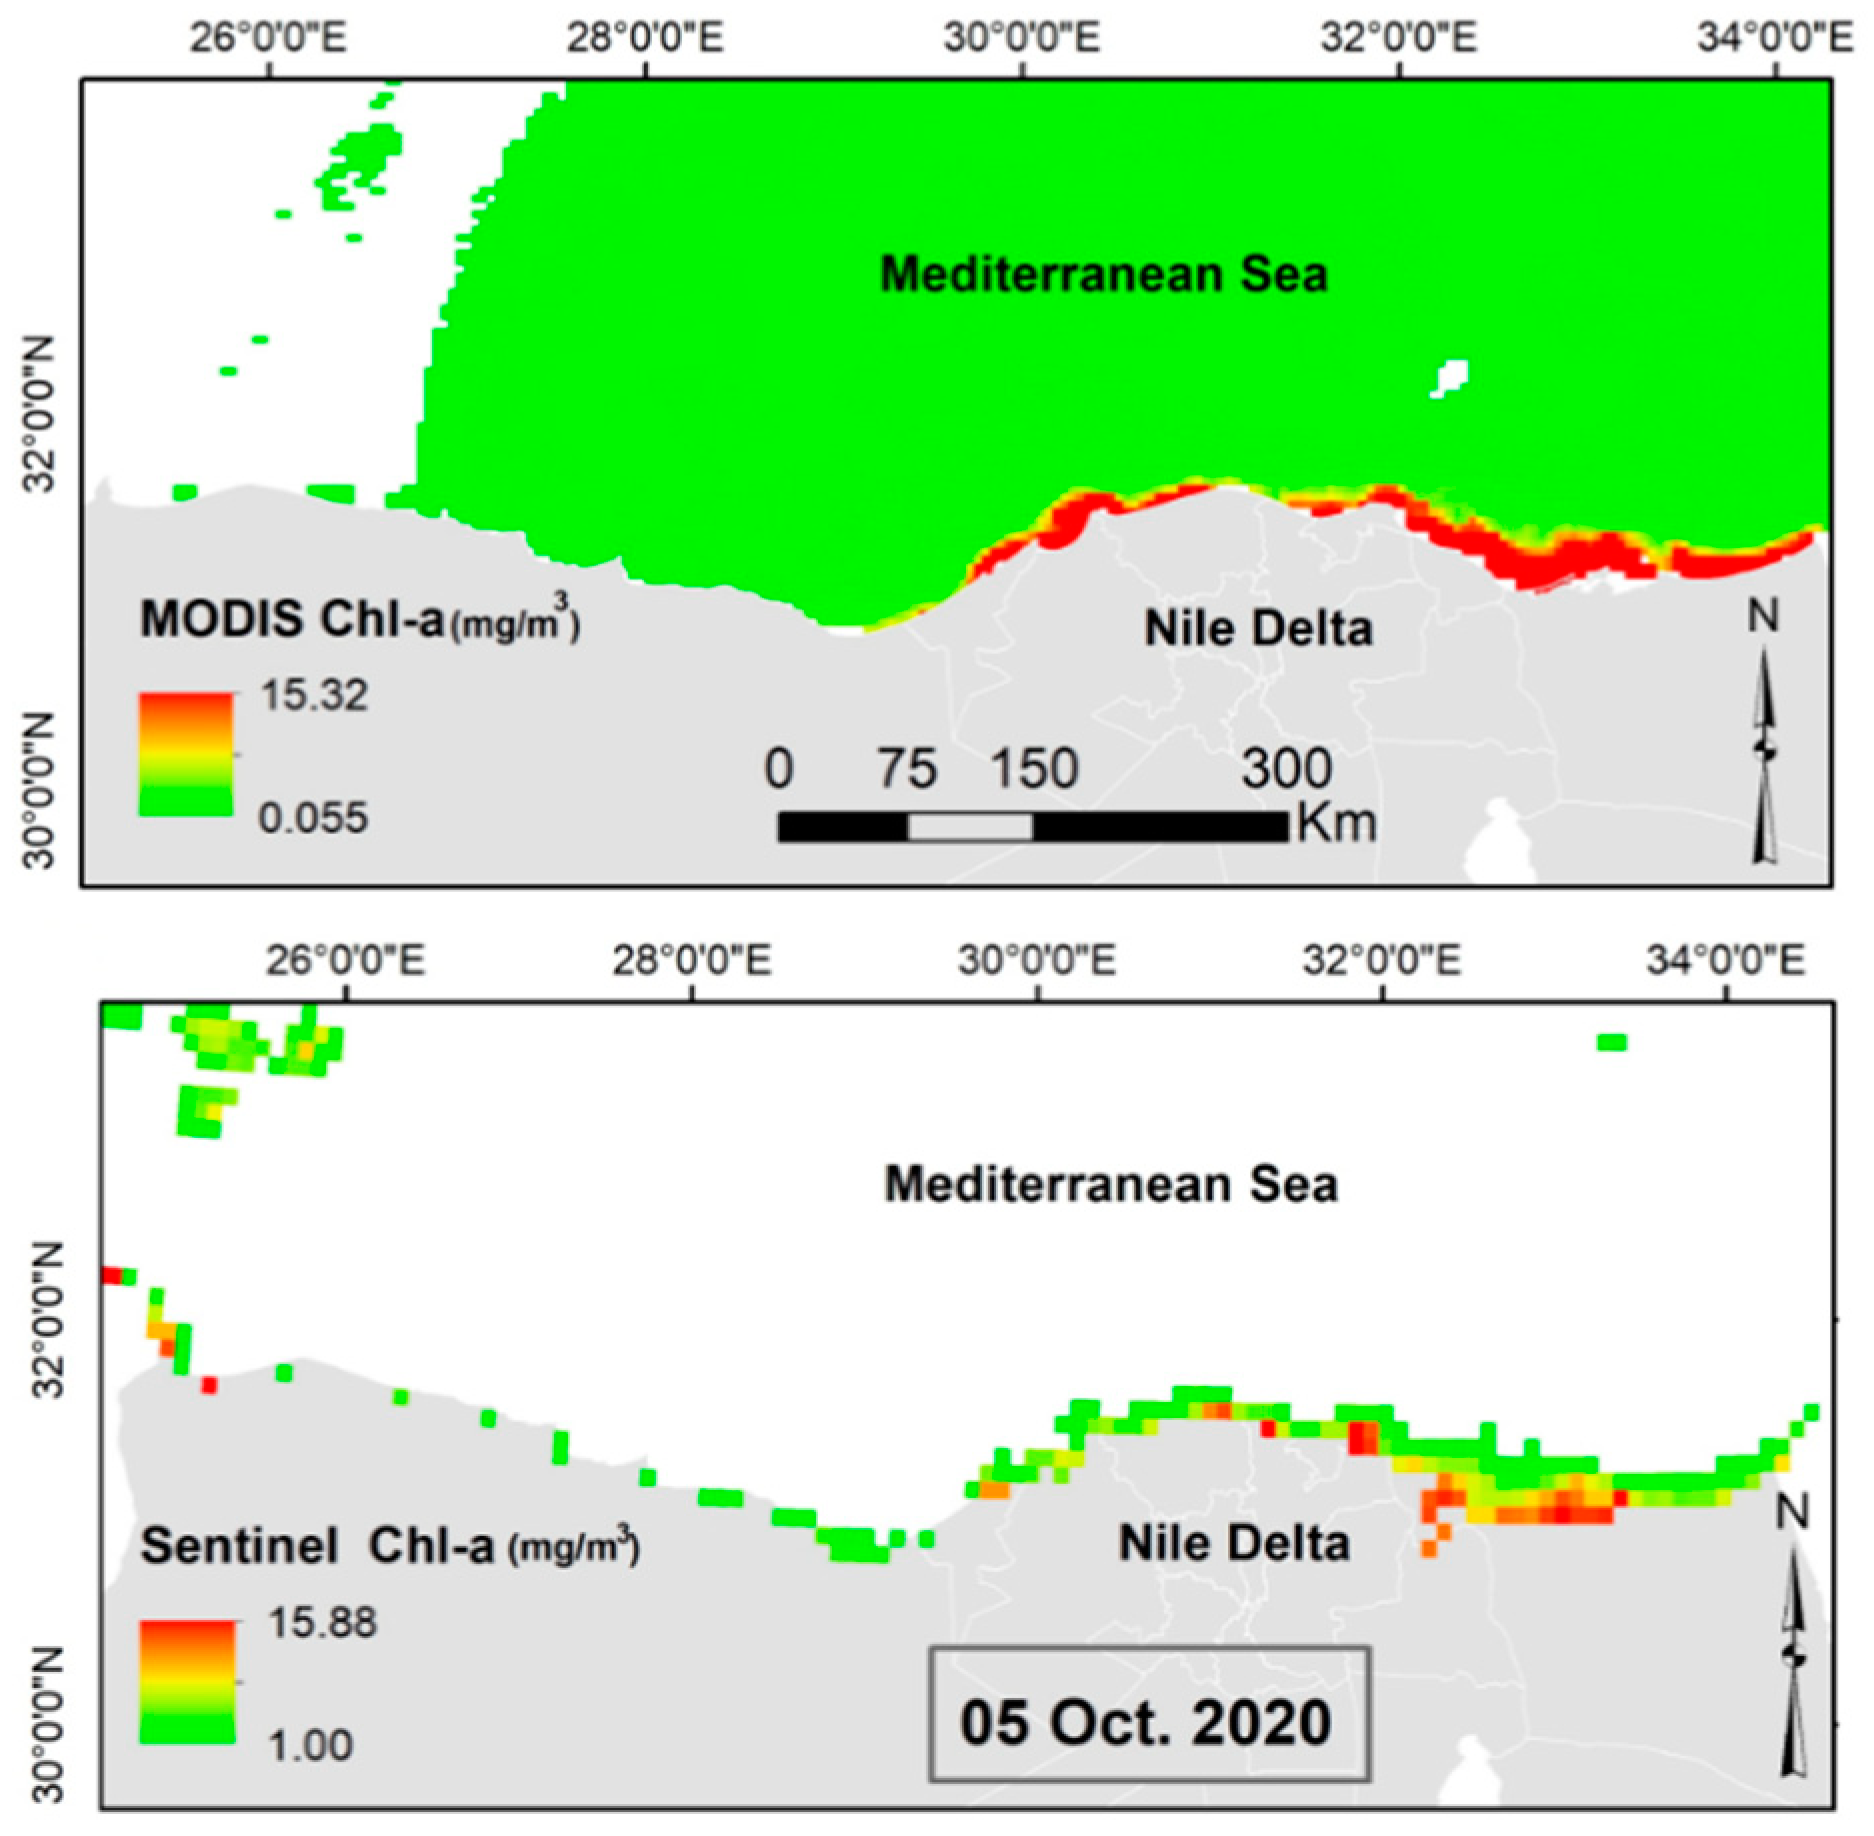
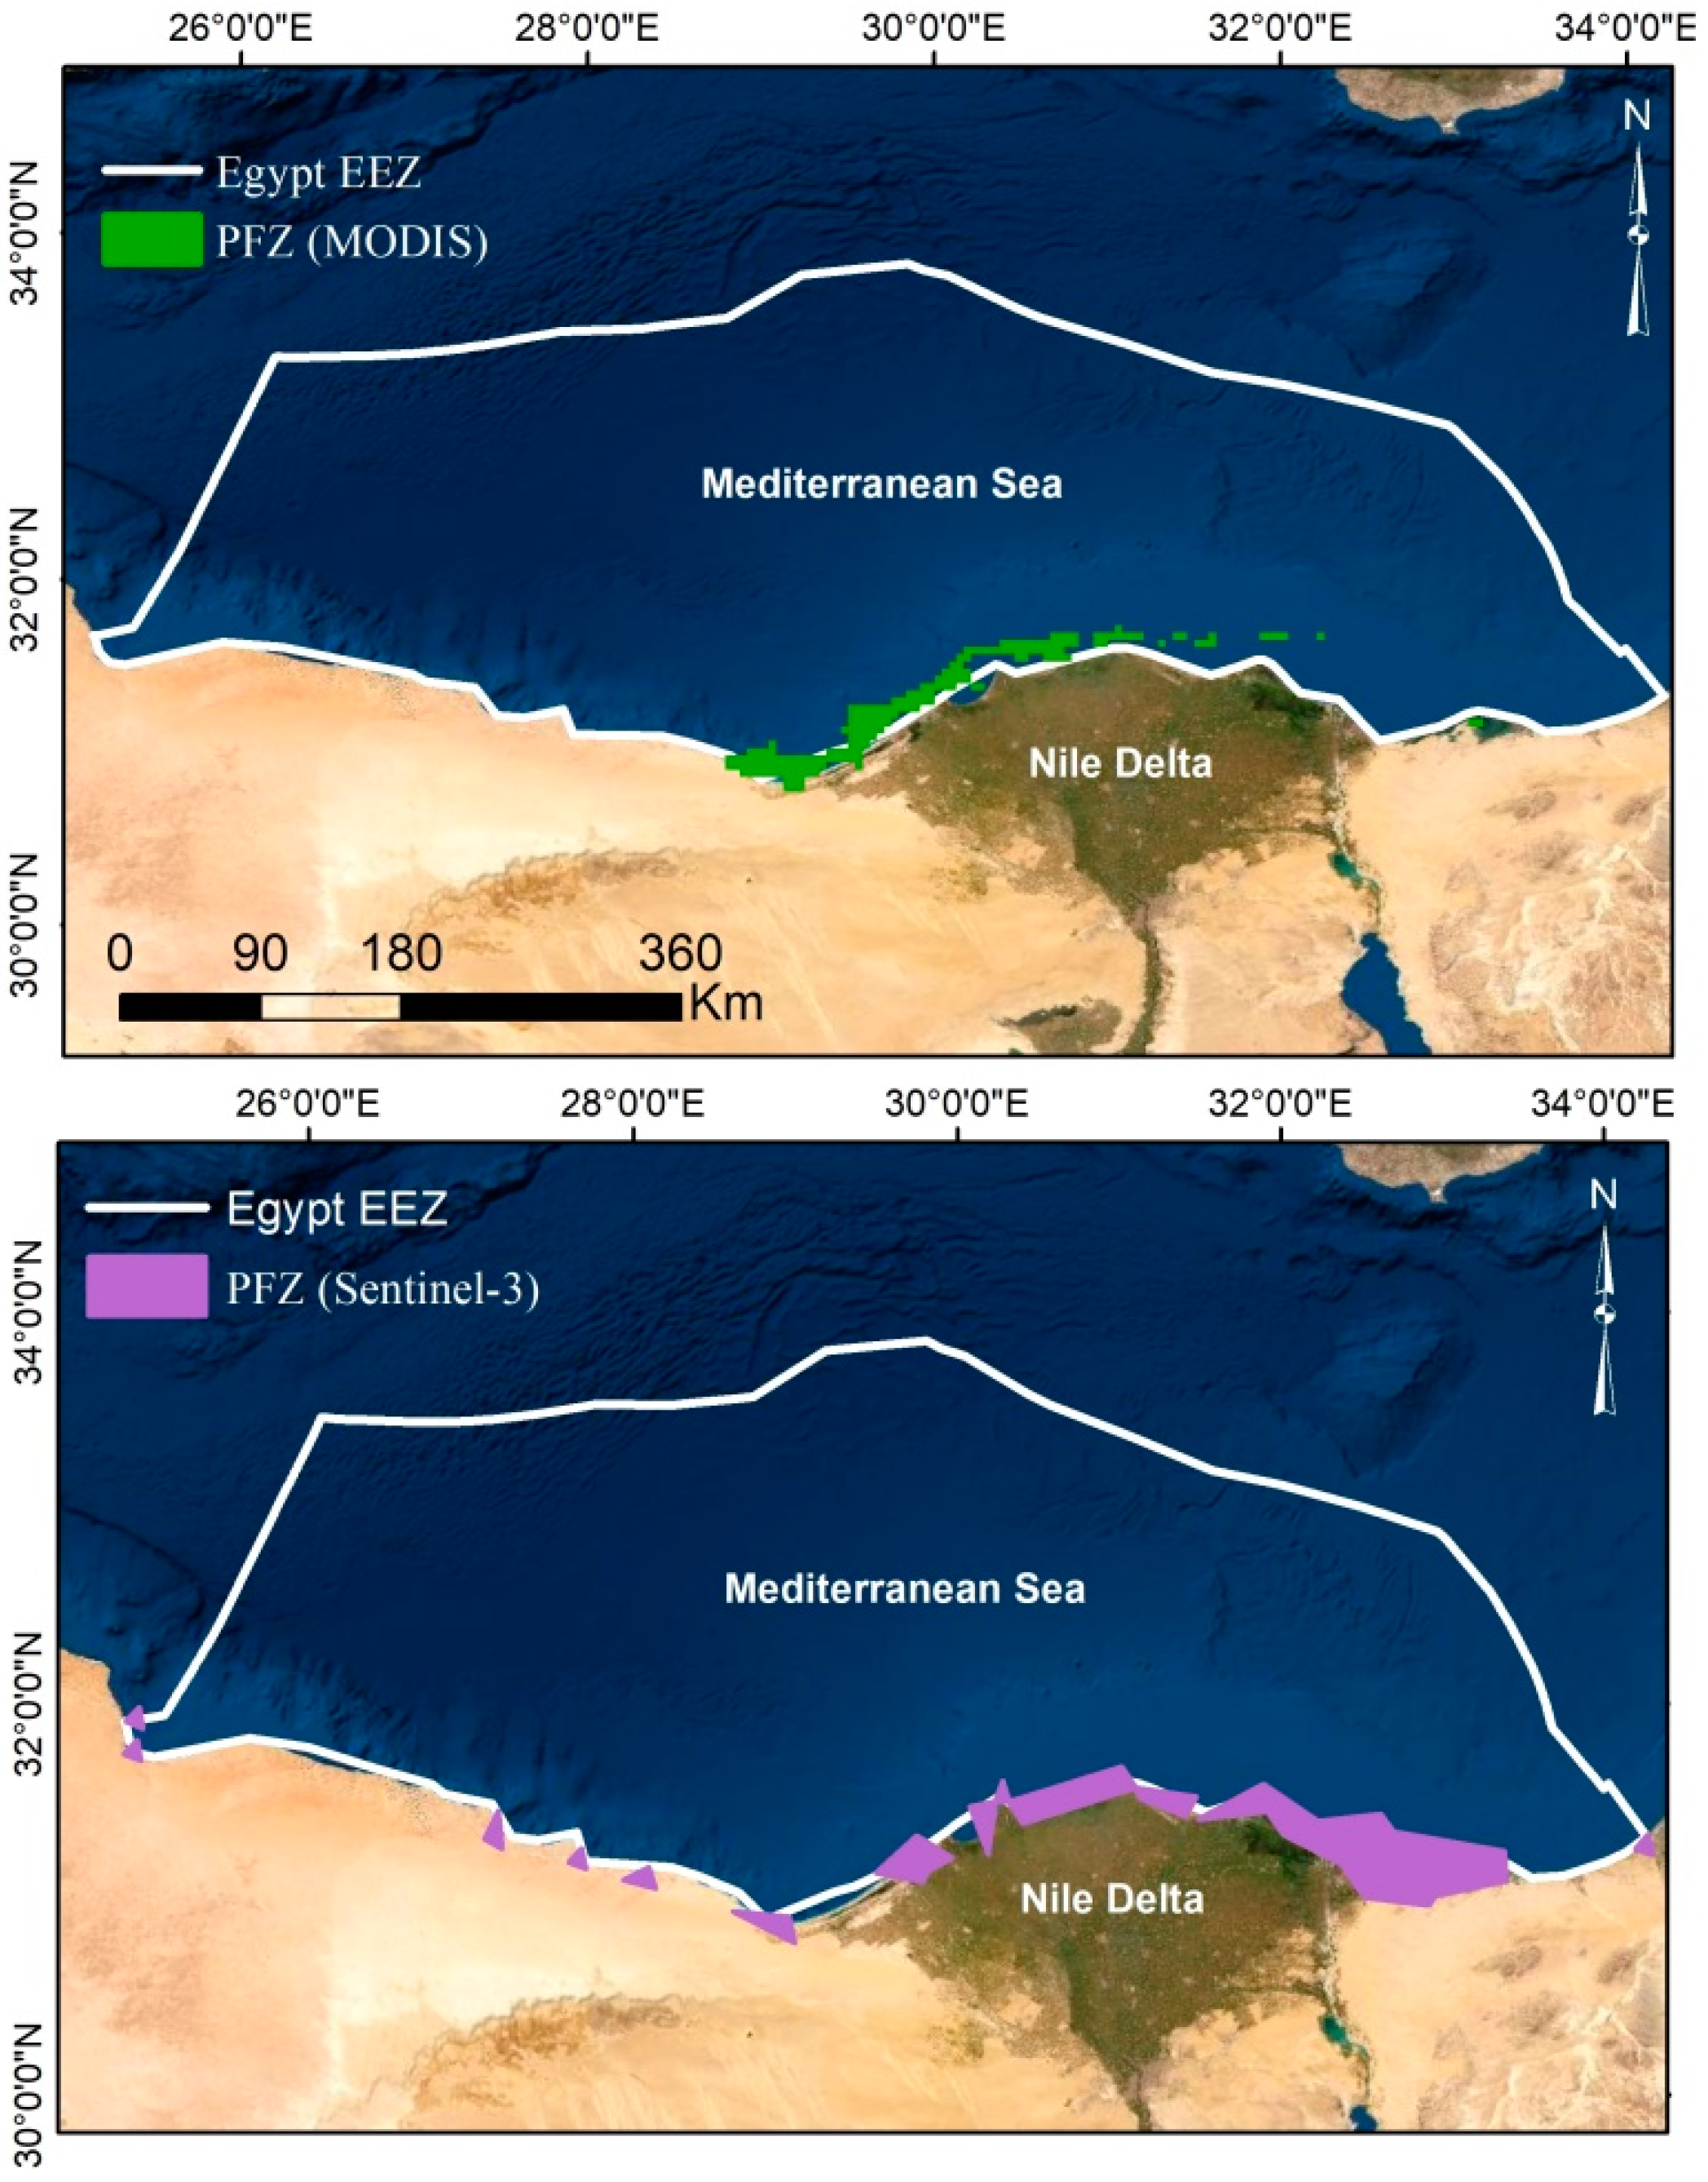
3.2. Variations in Chlorophyll-a Concentrations

The monthly MODIS Chl-a data during the period of study (2018–2020) showed that most variations occurred and were distributed near the coast with high values, while they remained relatively stable in the open-sea region. The data also showed a higher Chl-a concentration during the period from December to March compared with those determined during the period from October to November of the same year. Figure 5 presents the changes in Chl-a on 5 October 2020 from both MODIS and Sentinel-3 data. The higher values were distributed near the coast, with near 15 mg/m3 from both sensors, which shows the similarity in the data. The chlorophyll-a values were greatly affected by water upwelling, which leads to the migration of water carried with nutrients and food.

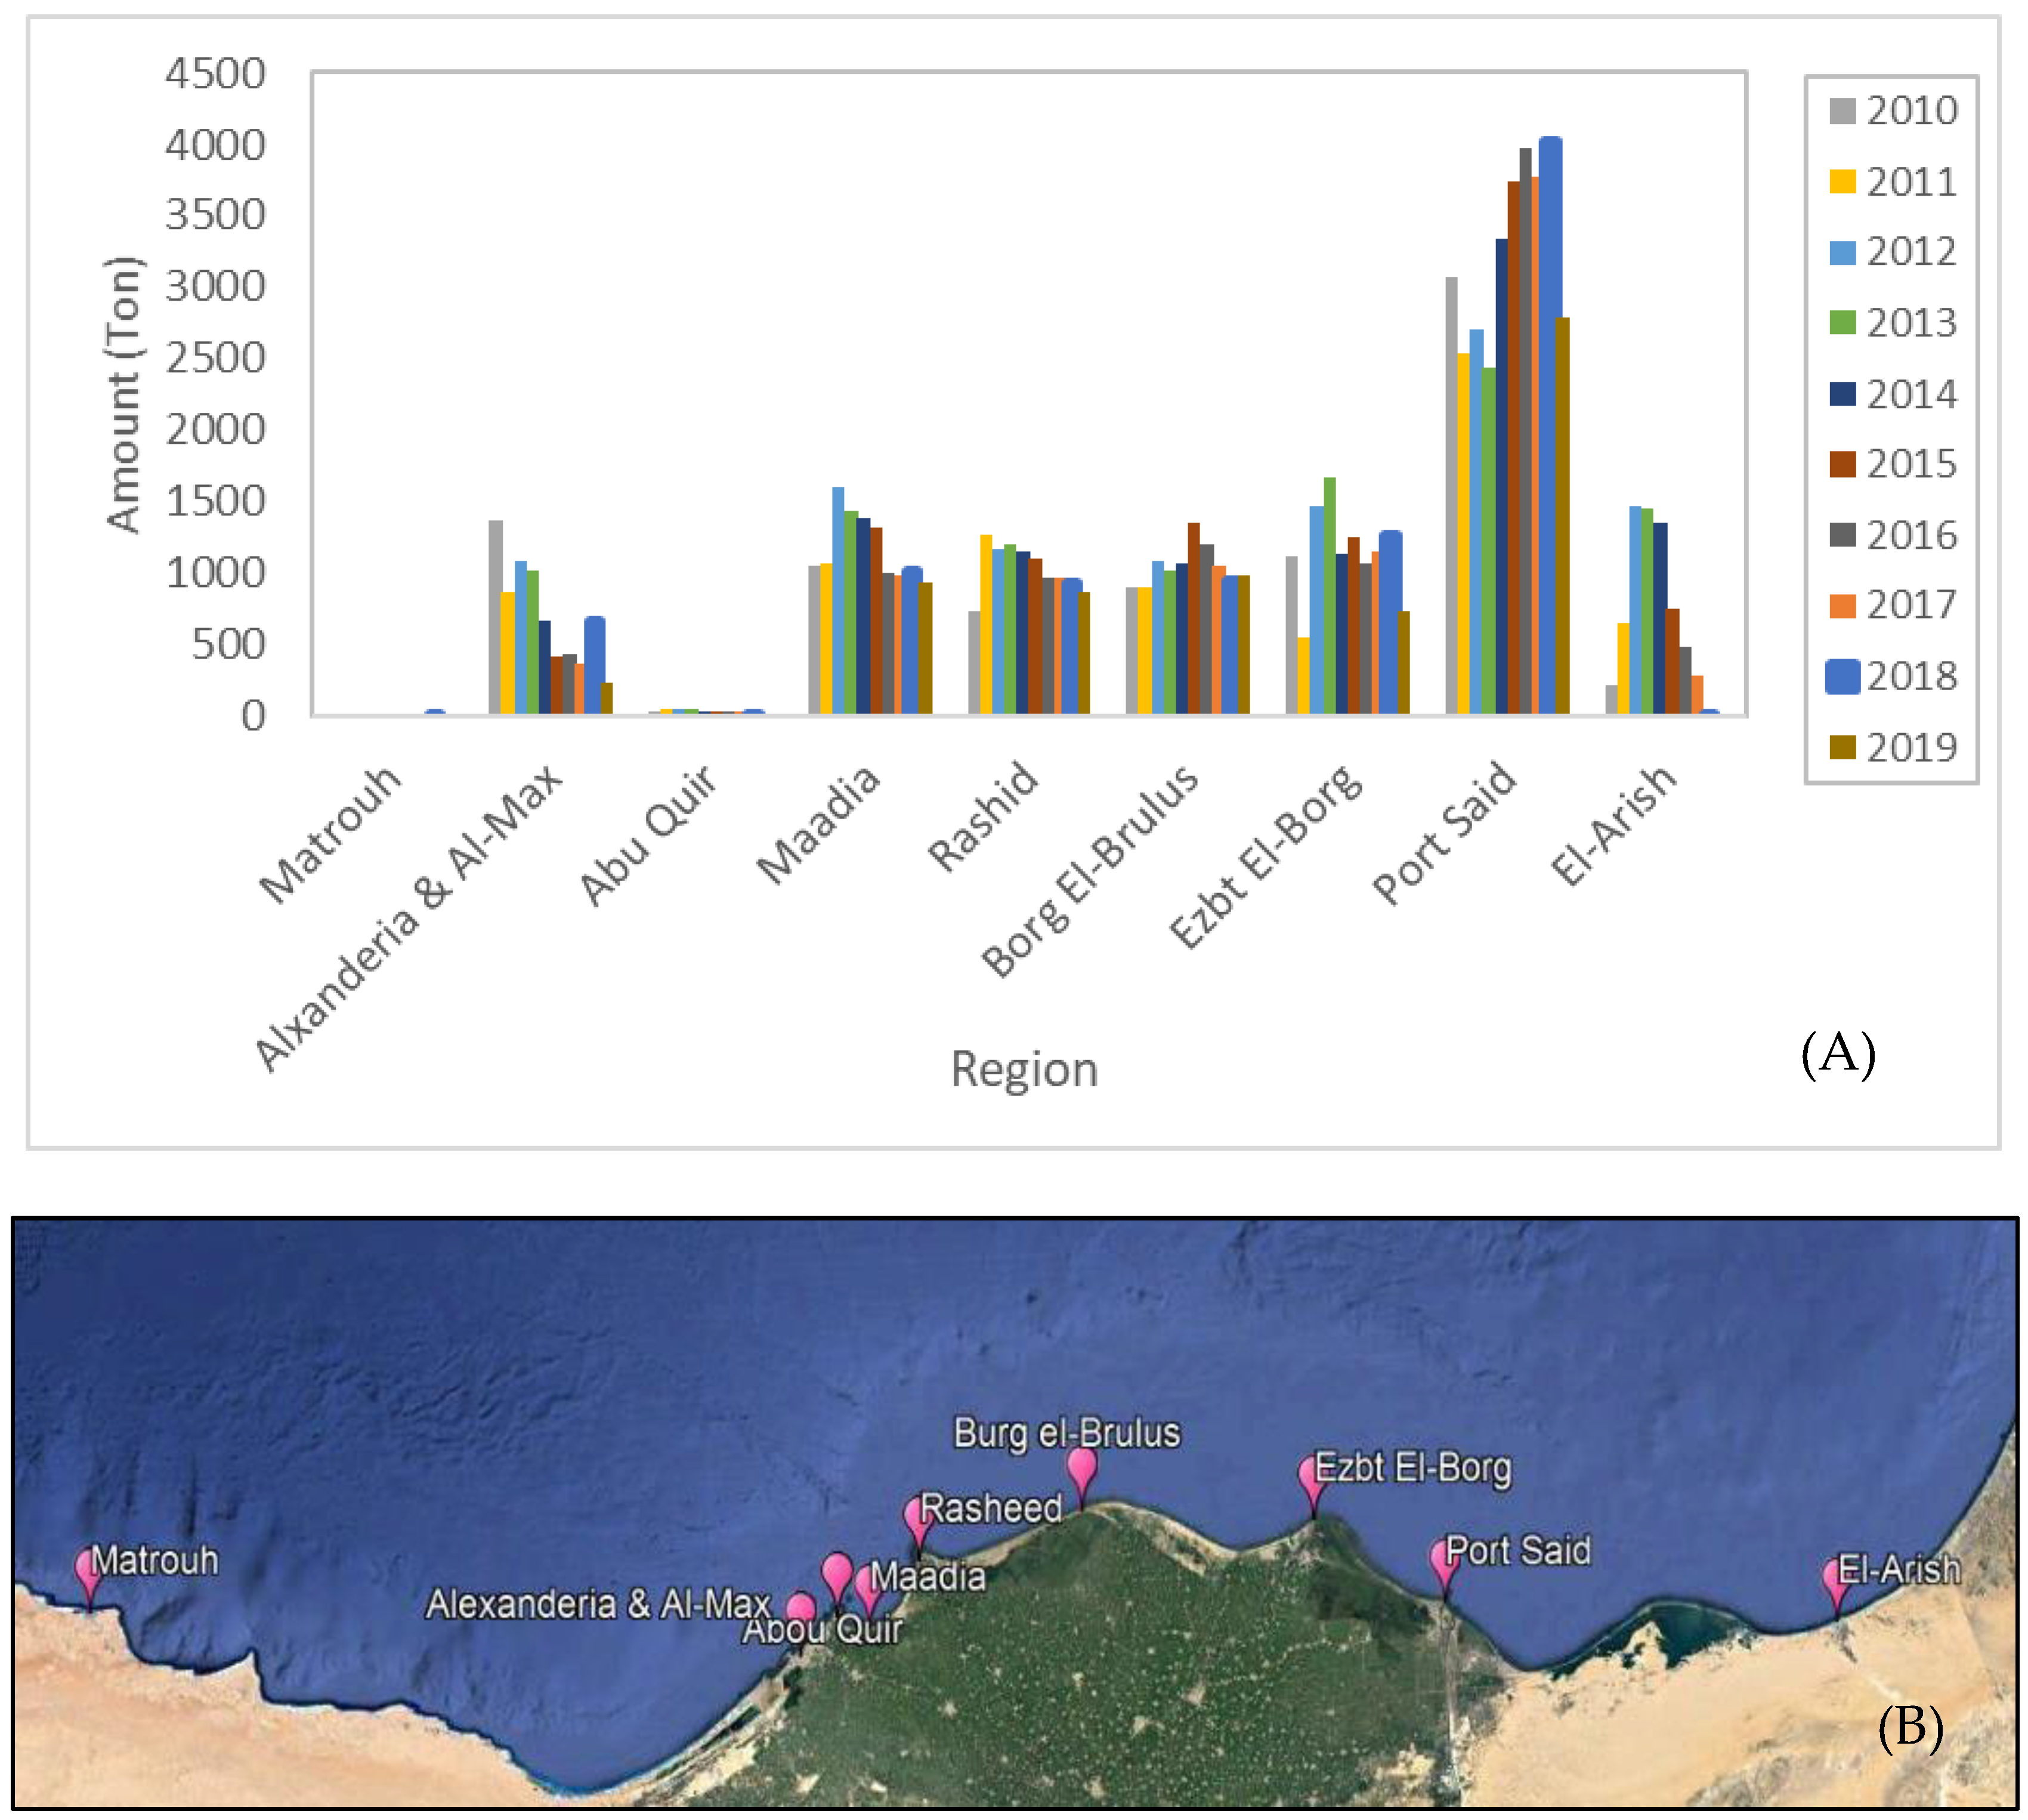
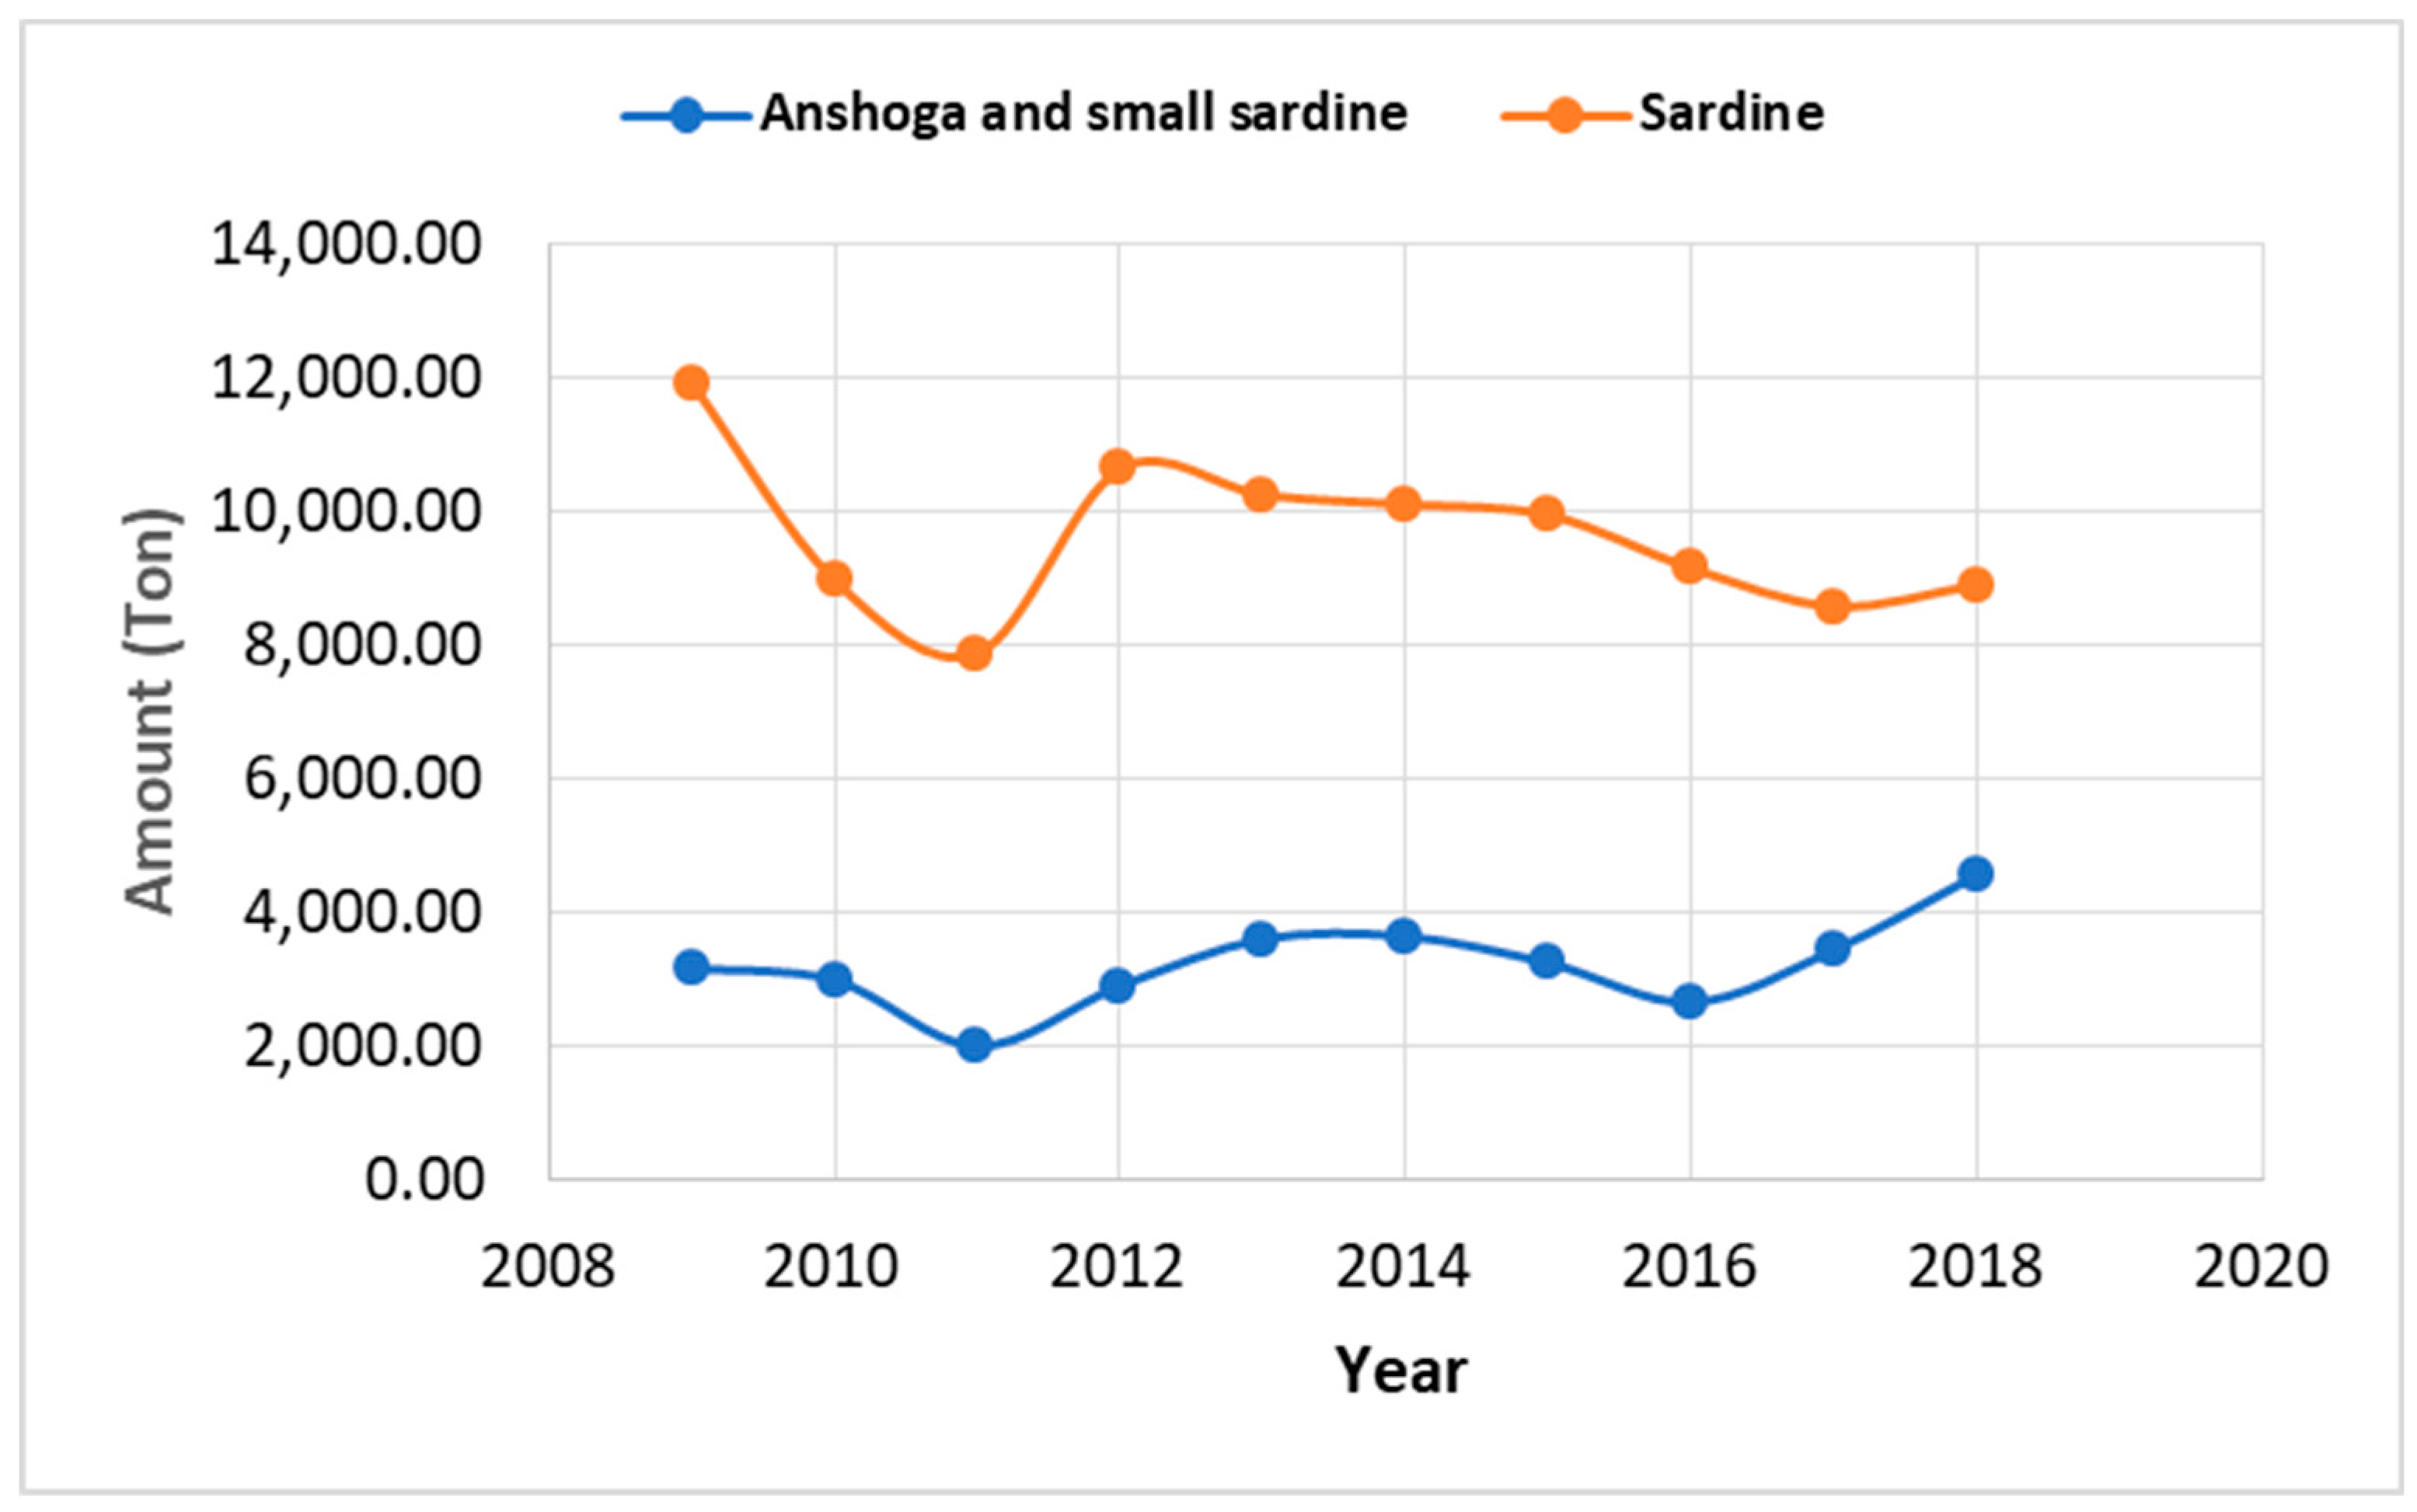
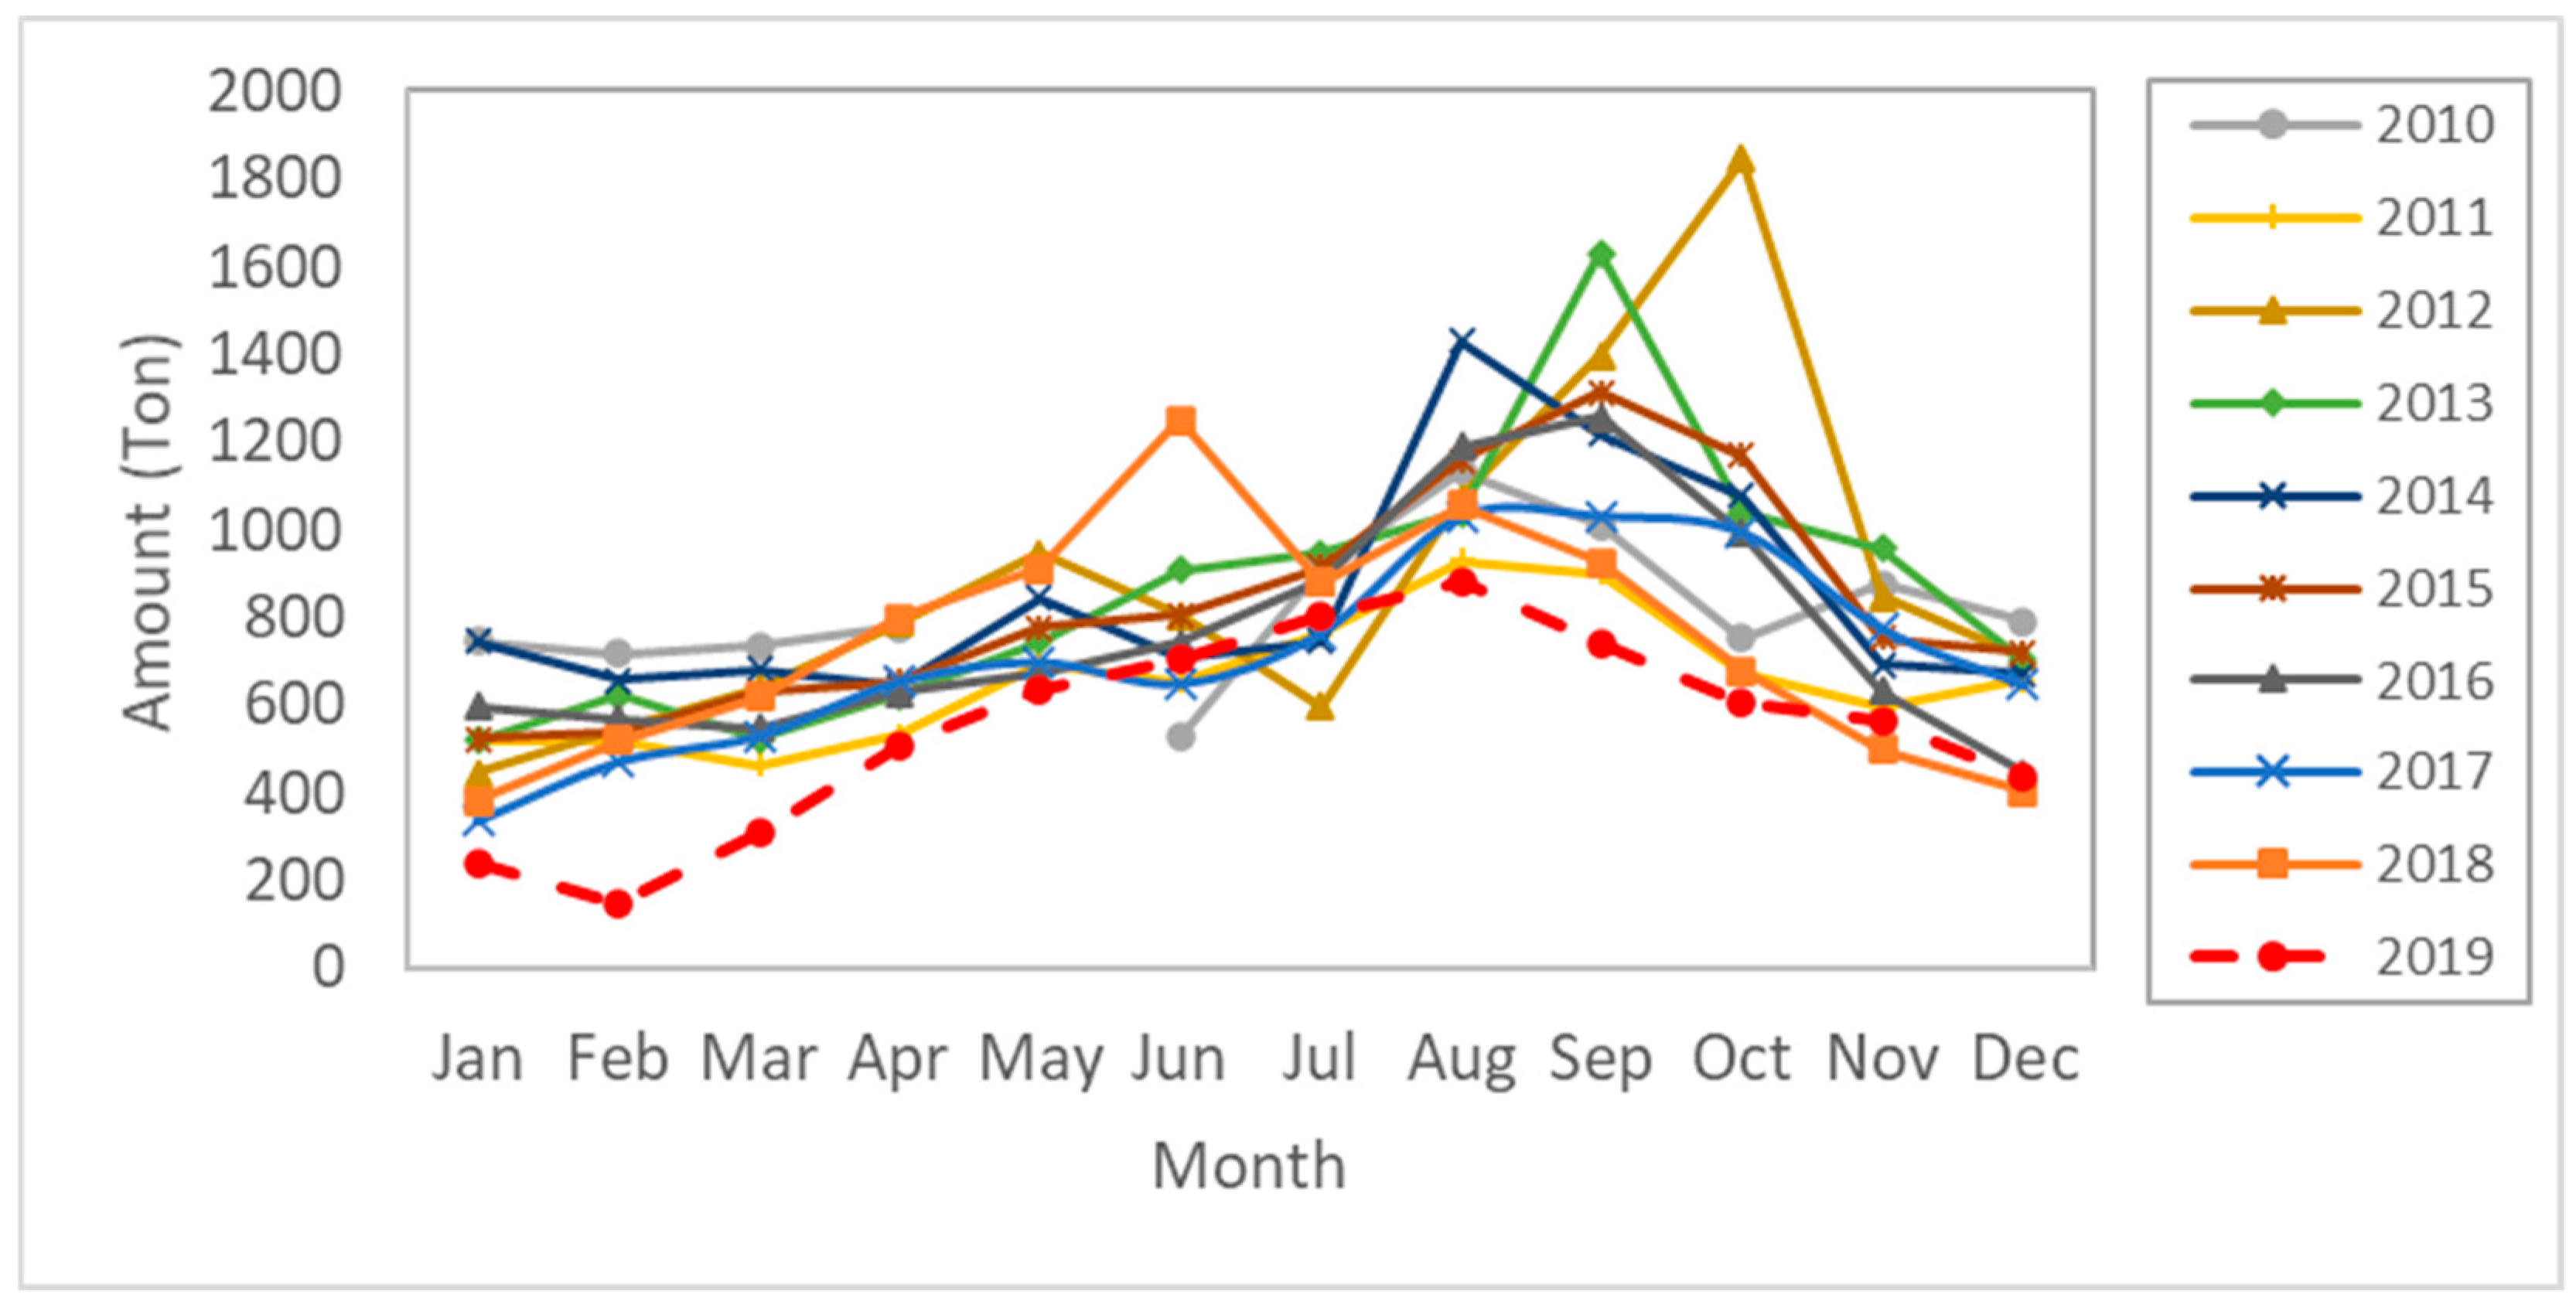
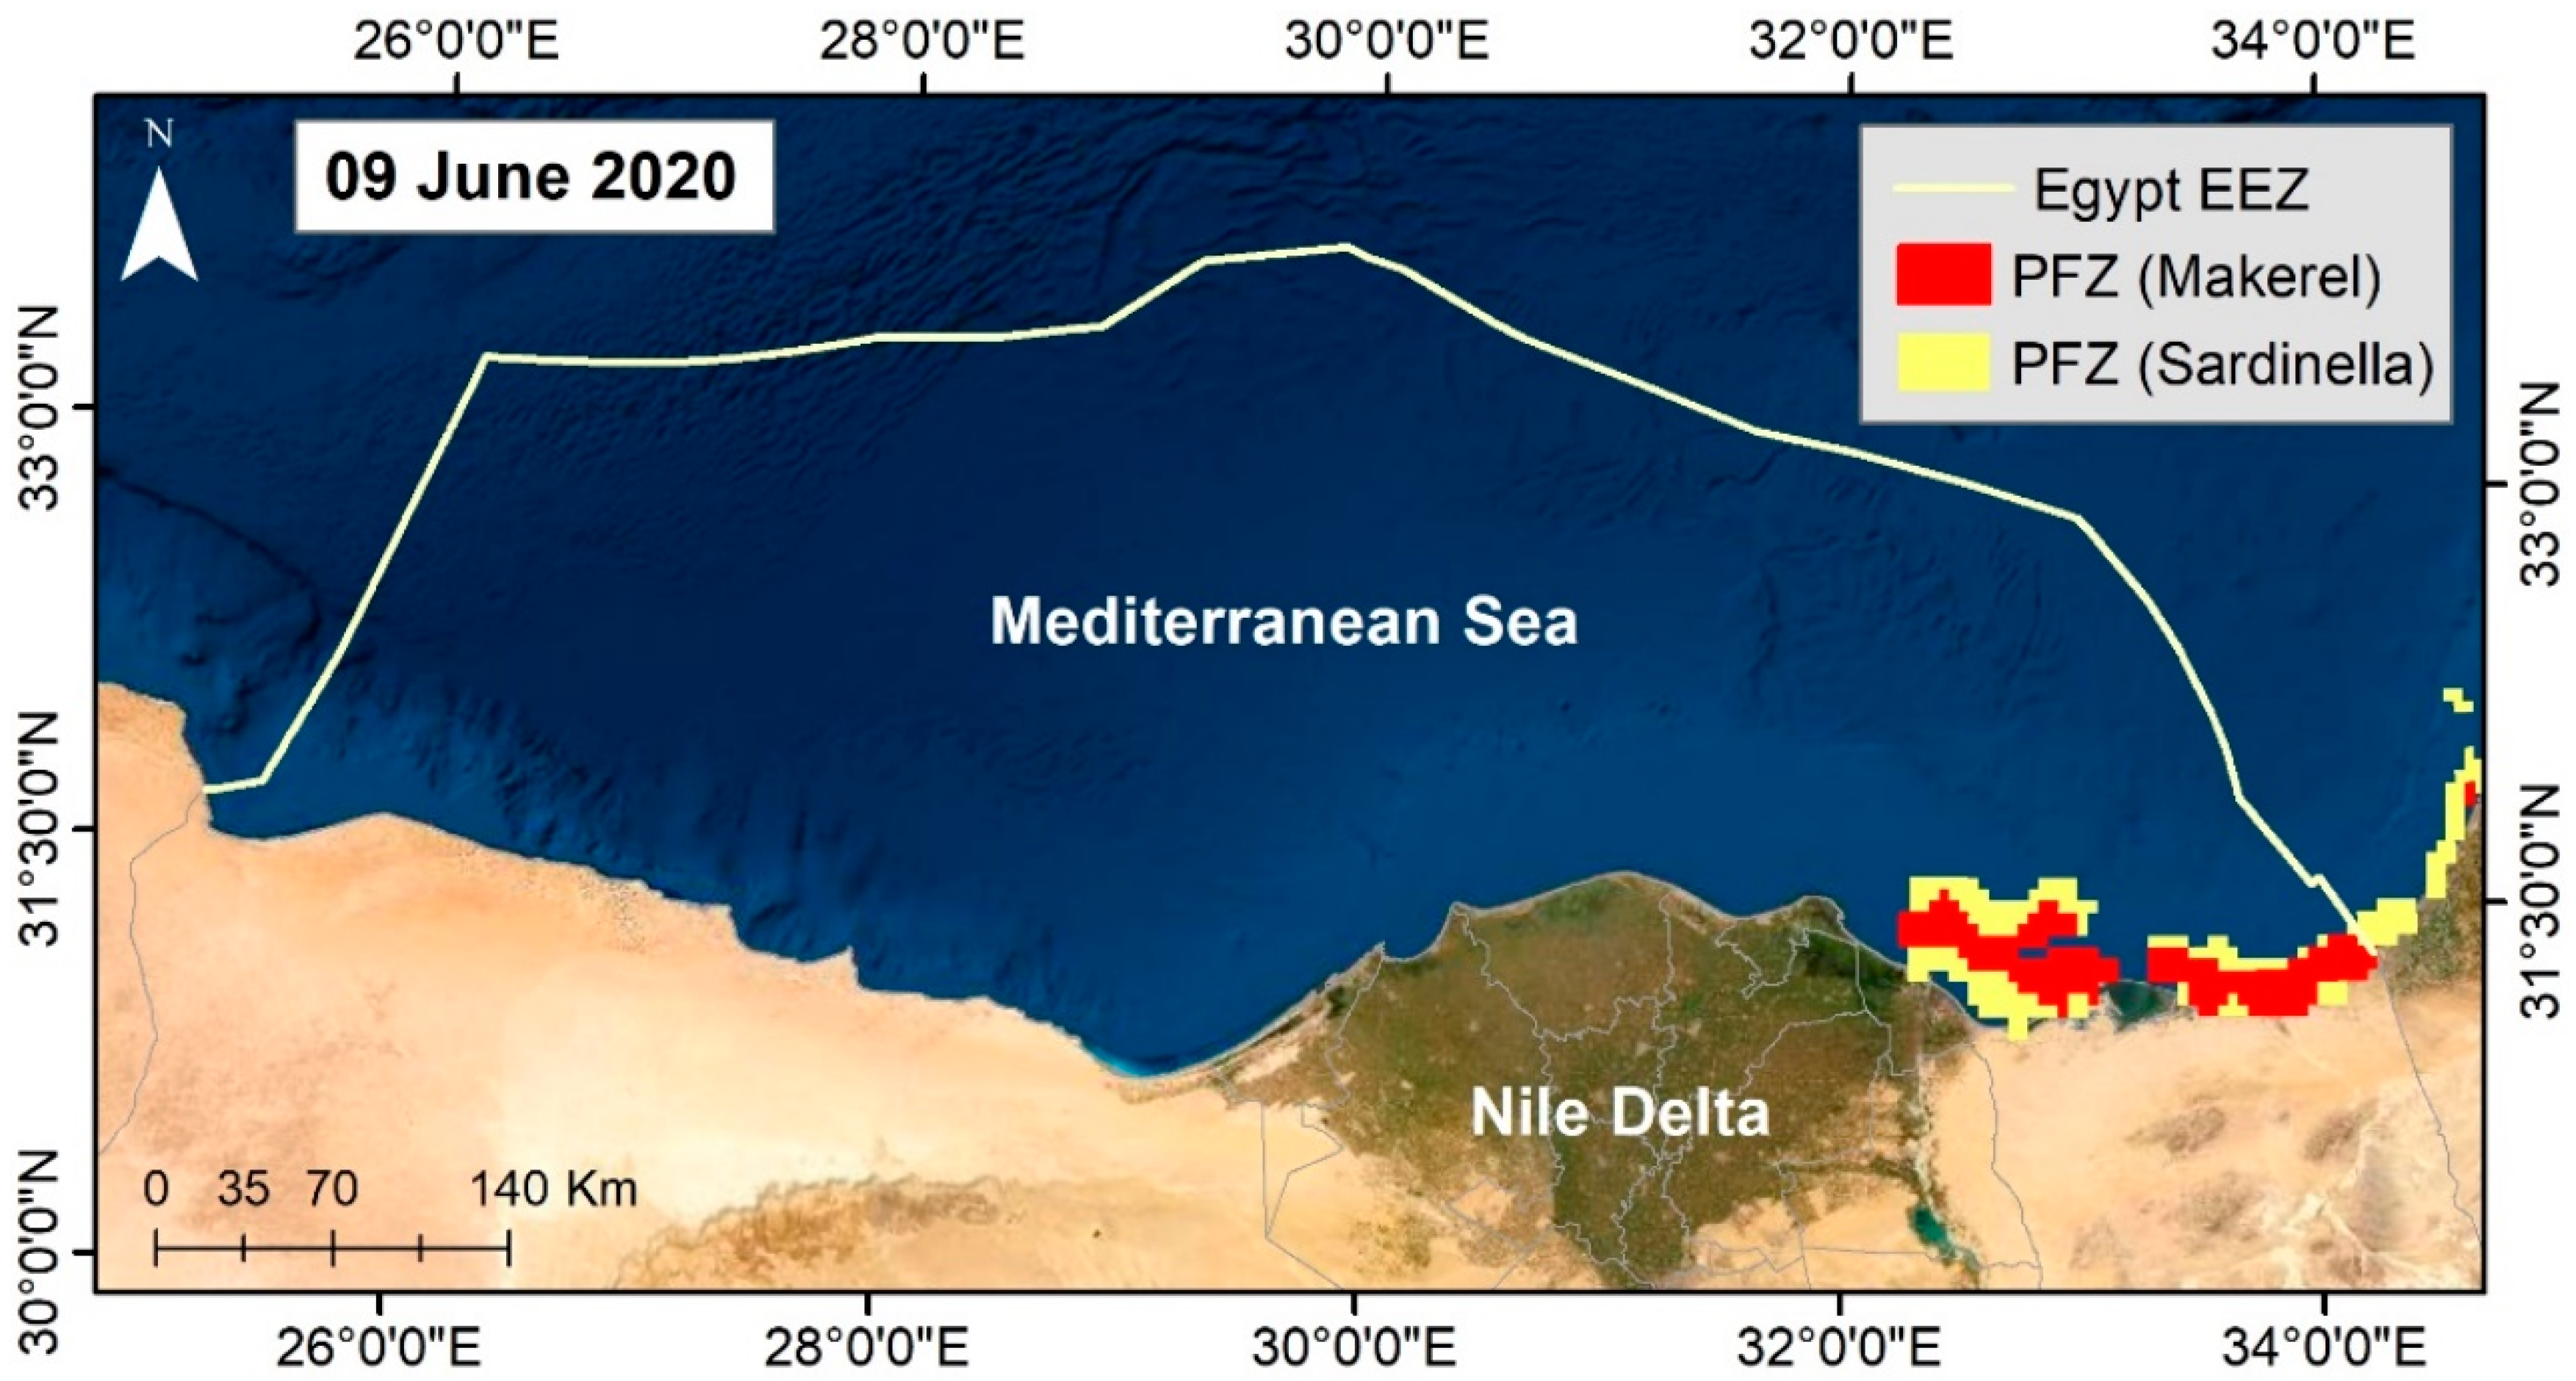
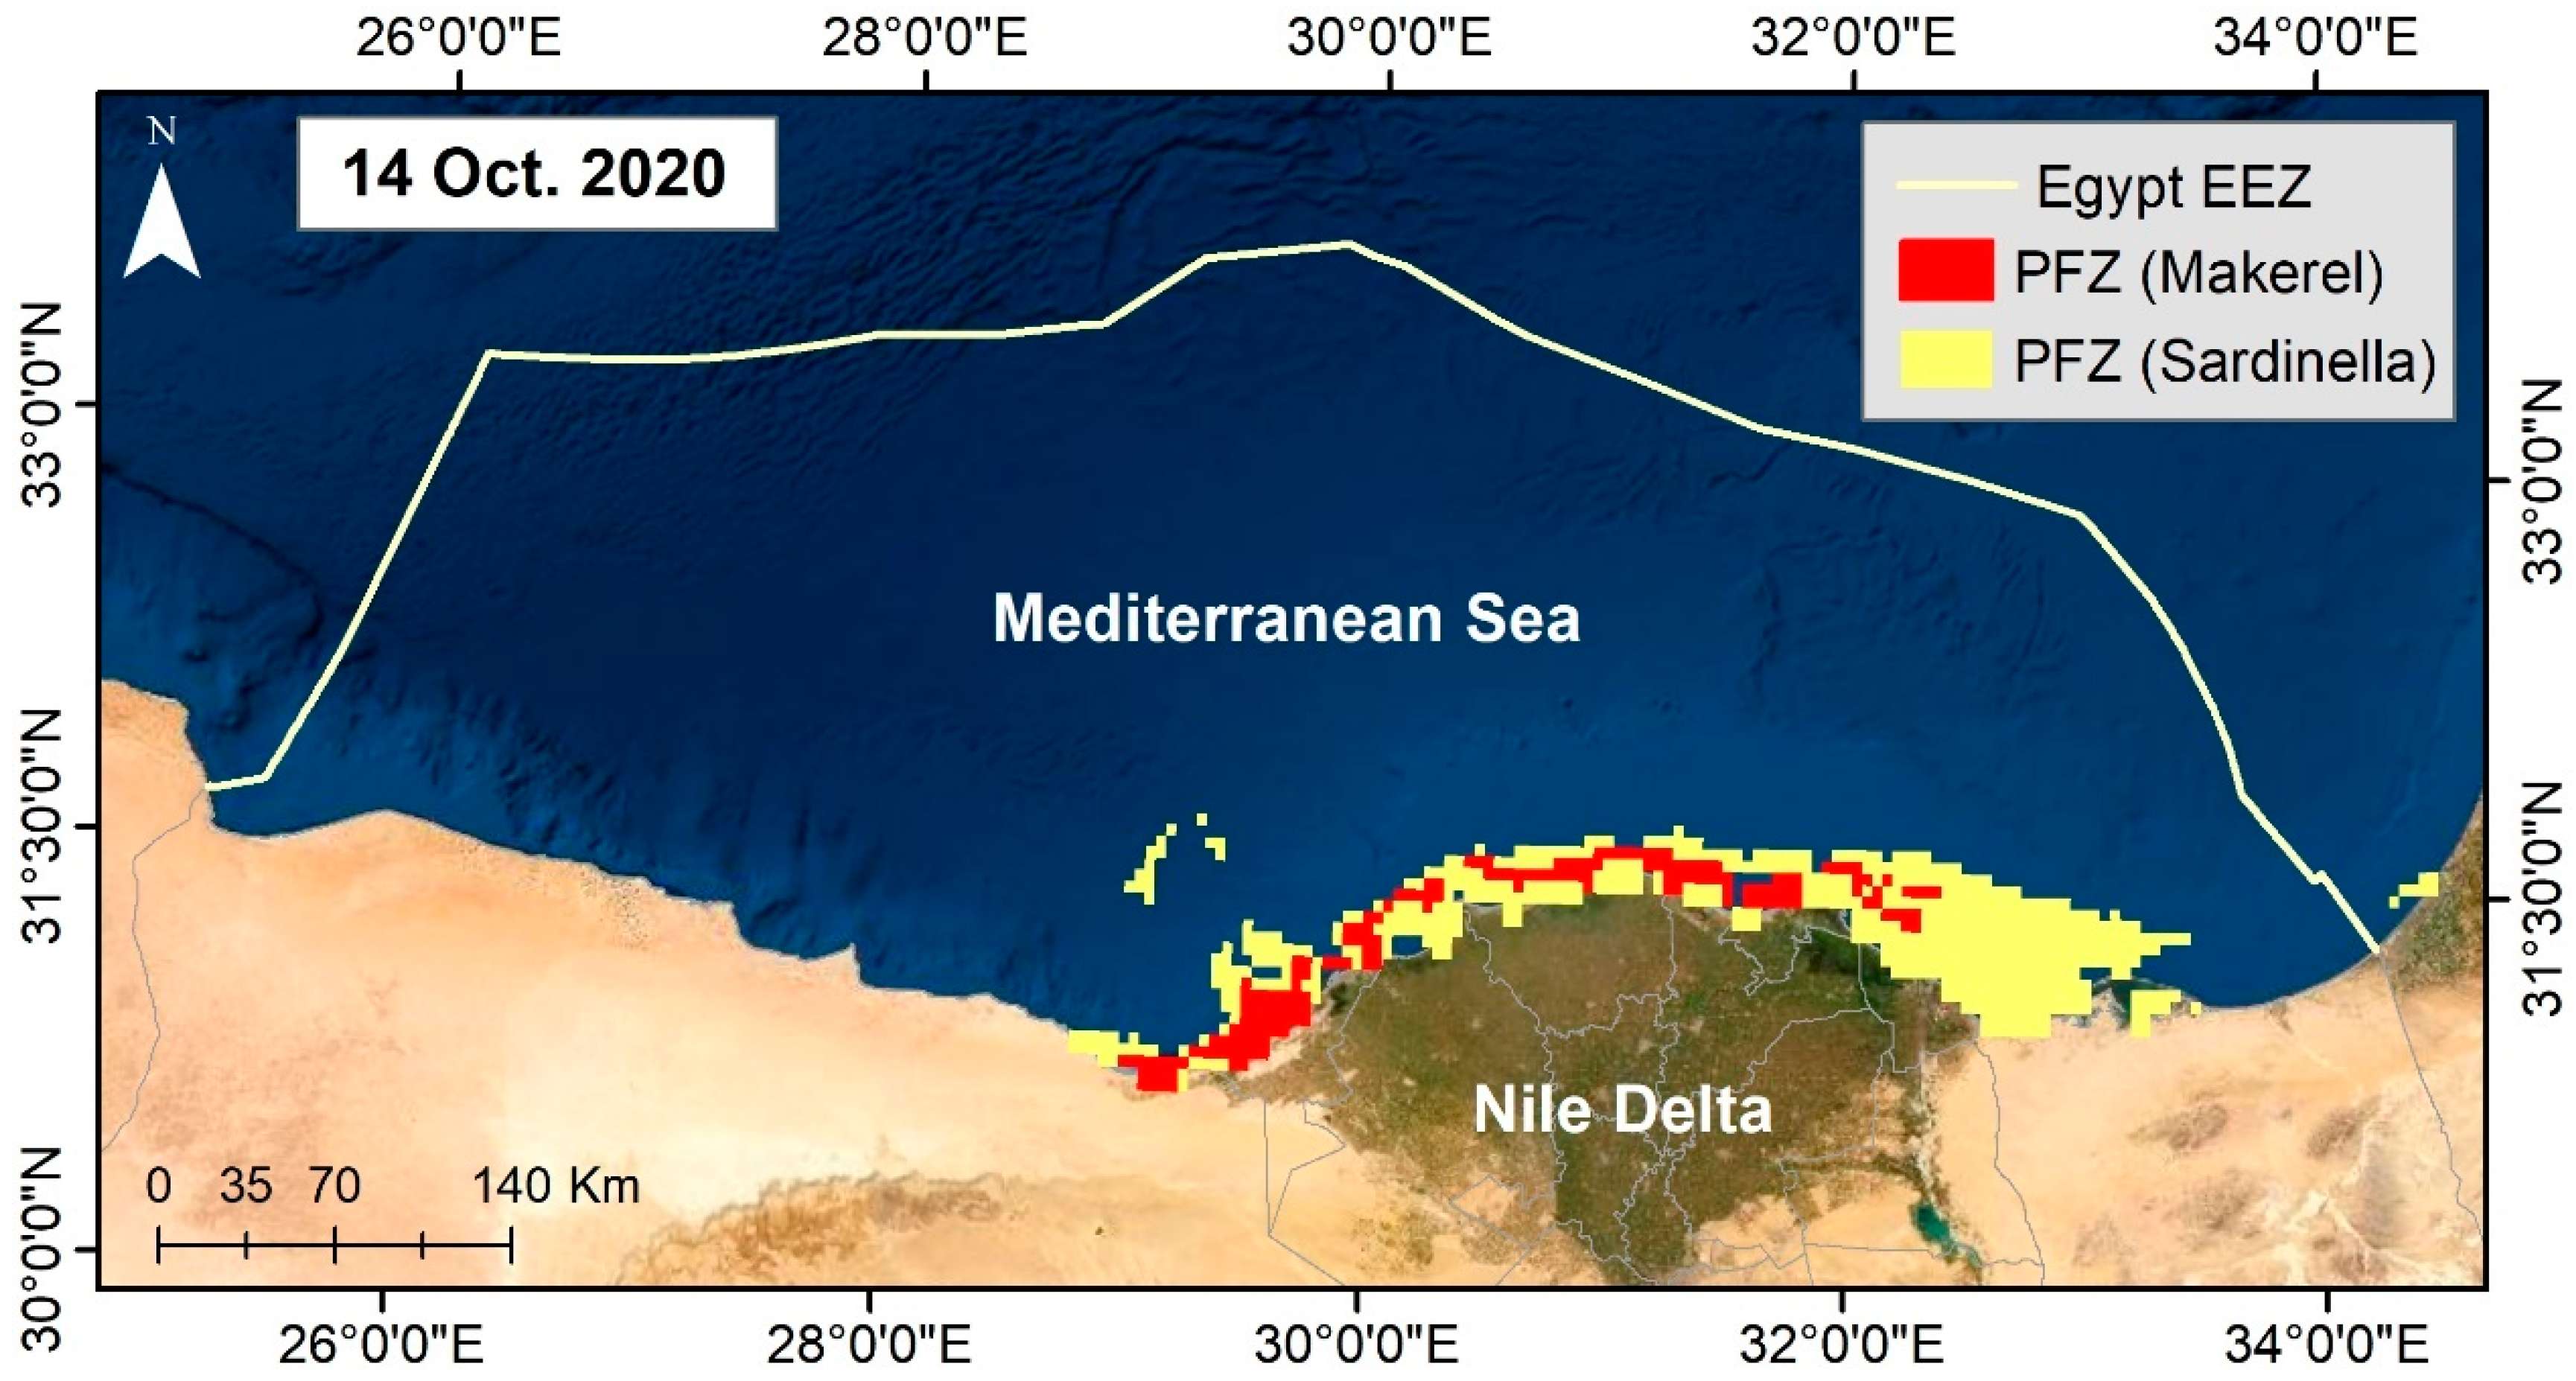
3.3. Spatial Distribution of Sardinella aurita Landings (PFZ)

The potential fishing ground maps produced for S. aurita were estimated based on the SST and Chl-a products derived from the MODIS satellite along the Mediterranean coast of Egypt using the Arc GIS model. The defined regions were characterized by their high chlorophyll concentration, related to the suitable sea-surface temperature. PFZs are highly affected by their high SST and Chl-a with the assumed stable salinity. The monthly PFZs were produced from May to November 2018–2020. Cury et al. [4] showed that SST and Chl-a influence the distribution of S. aurita at different life stages, and also made it possible to identify the main spawning areas in the Mediterranean Sea. The correlation between the environmental factors (SST and Chl-a) was proved by Baali et al. [25], who showed a significant positive correlation between S. aurita landings and these environmental parameters. This study supports the current research findings, as they revealed that SST and Chl-a are good indices that govern the dynamics of S. aurita in Morocco; in addition, the monthly abundance of this fish is strongly governed by their effect.
The results showed that the suitable months for the abundance of the S. aurita were from May to November, as the SST values recorded from the satellite data were high; however, from December to April, the values were unsuitable for the abundance and catch of S. aurita, as the surface temperatures values were lower than the suitability values. Chl-a concentrations were high and remained constant throughout the year.
The PFZ was detected at both inter-annual and monthly time scales for a 3-year period: 2018–2020 (Figure 6, Figure 7 and Figure 8). The results showed a larger area of PFZ during the warm months (mainly summer), e.g., from May to July, while they declined during August and September, before increasing once again in October and November. August showed the lowest area compared to the other months (see Figure 9). Moreover, a temporal variation was observed in PFZs during the same months in different years; for example, the PFZs for May 2018 were wider than those for May 2019, which may return to SST fluctuations effect. In which the maximum SST values in May 2018 ranged between 21 and 24 °C, while in May 2019 it ranged between 20 and 22 °C.
Furthermore, PFZs showed a major spatial distribution near the coast of the Nile delta and/or north coast of Sinai Peninsula, from Alexandria to El Arish. These eastern areas have a high potentiality for fishing activity and are considered an important commercial fishery resource in the Egyptian Mediterranean coast. Figure 6, for example, shows the monthly variations in PFZs over 2018. The variations in water temperature and Chlorophyll-a content influences the distribution and abundance of S. aurita. As a consequence, the fish aggregations were concentrated along the coastal zone from Alexandria to El-Arish, compared to other regions of the Mediterranean. This may return to the high levels of the nutrients in this region, which discharged from the Nile Delta into the coastal zone of the Sea due to agricultural and human activities. The nutrient content, besides the suitable physical conditions of water, attracts high amounts of fish to accumulate in this region. This is proved by the data reported by GAFRD during the period 2010–2019 regarding the sardine catches along the north coast of Egypt, as shown in Figure 10. The amount of sardine catches increased moving towards the eastern direction towards Port Said, which showed the highest amount of fish production over the ten years. The largest sardine catches in Port Said (4020 Ton) was recorded in 2018. Matrouh and AbouQuir, in the west, have the lowest rate of sardine production.
It is anticipated that this research would help the fishery’ authorities and local fishermen to easily identify the areas of sardine aggregation, and increase their catch per unit effort. There was a noted reduction in the amount of sardine catches produced from 2009 to 2019, as reported by GARFD and shown in Figure 11. Baali et al. [25] study showed an increase in S. aurita landings from the year 2010; the maximum values were observed during the period ranging from 2011 to 2013, with high concentrations of Chl-a (2.28 mg m–3) and SST (18.74 °C). Then, the S. aurita landings began to decrease, reaching their minimum values in 2016. This decrease was also observed for the concentration of Chl-a (1.90 mg m–3) and SST (18.58 °C) in recent years.
The amount of sardines changed monthly from 2010 to 2019, as shown in Figure 12, with a high amount (about 1844 Ton) on October 2012, and the lowest amount (about 145 Ton) in February 2019. The year 2019 showed a low trend in terms of sardine catch compared with the historical record. This matches the previous results of PFZs of S. Aurita, showing that the area increases during months of SST ranges from 22 to 28.5 °C. The low temperature in February (winter) led to a reduction in the fish production while, in October, the temperature was moderate and suitable for fish aggregations. Baali et al.’s [25] results showed a maximum of S. aurita landings in October (6698 Ton), with a minimum in June (2493 Ton). From June, the SST began to increase and reached its maximum value in summer, then decreased, reaching its minimum values in winter. The monthly average Chl-a showed two patterns: (1) a period of high Chl-a content from May to November, with a peak in September, and (2) a period of low Chl-a content from December to April.
A comparison of the produced PFZ was performed between MODIS and Sentinel-3 on different days. Figure 13 shows an example of PFZ from both sensors on 5 October 2020. The produced PFZ covers the coastal region of the Nile Delta.
This model was applied to another fish species, namely, “Makerel Tuna” (Euthynnus sp.), which is a pelagic fish. The production and distribution of Mackerel tuna is believed to be strongly influenced by the oceanographic conditions of waters, such as sea-surface chlorophyll-a and sea-surface temperature [35,36]. SST is closely related to the suitability of the physiological conditions and the morphological adaptation of fish. In addition, SST is an indirect indicator of biological productivity or the presence of fish food [37]. Meanwhile, chlorophyll can provide a direct indication of the existence of fish food content and the pathways of fish migration areas [38]. The PFZ of Makerel Tuna was detected based on environmental values the match with a high catch of the fish with an SST value of 26–28 °C, and a chlorophyll value of 0.47–2.6 mg/m3 [39]. Figure 14 and Figure 15 show the variation in the spatial distribution of PFZ for both Sardinella aurita and Makerel Tune on 9 June and 14 October 2020.

4. Conclusions

With the great role marine fisheries play in increasing the economy of Egypt, it is crucial to implement efficient methodologies and technologies to secure the maximum benefit. In conclusion, satellite remote sensing proved its ability to generate and classify marine ecological regions by using products such as SST and chlorophyll-a. This research highlighted the potential role of earth observations in detecting the potential zones of fish aggregation, which can somehow benefit the fishing community, and reduce the time and effort spent searching the schools of fish, improving the profitability and, hence, the socio-economic status. In addition, this leads toa good yield of fish and boost the economic status of fishermen, especially small-scale fishers. This study indicated that SST values during the summer months were higher than those in the winter months by about 7–10 °C. Chl-a concentrations were relatively high and available throughout the year. The PFZ model was applied based on satellite data (SST and Chl-a) to robustly produce the PFZs maps for Sardinella aurita. The majority of the potential fishing zones were located near the coast and near the mouths of the discharge from the land, increasing the nutrients and food web. The produced maps suggest that the abundant months for Sardinella aurita were from May to November, due to the effect of SST distribution. The model enabled the mapping of other fish species of Makerel Tuna for large-scale fishermen.
Finally, this research shows how the remotely sensed data are helpful in providing near-real-time data and robust information to help fishermen save time during their search for fish, reduce fuel consumption, benefit the modelers who produce fishery forecasts, and also help the scientists who develop strategies for sustainable fisheries’ management. In conclusion, implementing a simple and easy method for determining the PFZ of this species along the southern part of the Mediterranean coast (North Africa) can asset for improving the fishing of this economically common species in Africa. Then, same technique can be similarly applied along other coasts of the African countries.

Author Contributions

Conceptualization, E.M.A., N.Z. and I.A.E.-M.; methodology, E.M.A., N.Z. and I.A.E.-M.; software, N.Z.; validation, E.M.A., N.Z. and I.A.E.-M.; formal analysis, E.M.A., N.Z. and I.A.E.-M.; investigation, E.M.A., N.Z. and I.A.E.-M.; resources, E.M.A., N.Z. and I.A.E.-M.; data curation, E.M.A., N.Z. and I.A.E.-M.; writing—original draft preparation, E.M.A., N.Z. and I.A.E.-M.; writing—review and editing, E.M.A., N.Z. and I.A.E.-M.; visualization, E.M.A., N.Z. and I.A.E.-M.; supervision, E.M.A. and I.A.E.-M.; project administration, I.A.E.-M.; funding acquisition, I.A.E.-M. All authors have read and agreed to the published version of the manuscript.

Funding

This research was funded by the African Union Commission and European Union Commission through the GMES and Africa Program—Project NAfCOAST. The APC is funded by the National Authority for Remote Sensing and Space Sciences (NARSS) as part of the contribution to NAfCOAST Project.

Acknowledgments

The authors would like to thank the GMES and Africa programme, The African Union and the European Union and the national authority for Remote Sensing and Space Sciences for their financial and technical support for this study as a part of a NAfCOAST-funded project. Thanks to the General Authority for Fish Resources Development (GAFRD) for fish statistics’ reporting. The authors would also like to thank Eng. Nesreen Khairy for her technical support in earlier analyses.

Conflicts of Interest

The authors declare no conflict of interest.

References

  1. Benjamin, P.; Loots, C.; Petitgas, P.; Lindstrøm, U.; Vaz, S. Understanding what controls the spatial distribution of fish populations using a multi-model approach. Fish. Oceanogr. 2011, 20, 1–17. [Google Scholar] [CrossRef] [Green Version]
  2. Cury, P.; Bakun, A.; Crawford, R.; Jarre, A.; Quiñ, R.; Shannon, L.; Verheye, H.; Quinones, R. Small pelagics in upwelling systems: Patterns of interaction and structural changes in “wasp-waist” ecosystems. ICES J. Mar. Sci. 2000, 57, 603–618. [Google Scholar] [CrossRef]
  3. Banaru, D.; Mellon-Duval, C.; ROOS, D.; Bigot, J.-L.; Souplet, A.; Jadaud, A.; Beaubrun, P.; Fromentin, J.-M. Trophic structure in the Gulf of Lions marine ecosystem (north-western Mediterranean Sea) and fishing impacts. J. Mar. Syst. 2013, 111–112, 45–68. [Google Scholar] [CrossRef] [Green Version]
  4. Torri, M.; Corrado, R.; Falcini, F.; Cuttitta, A.; Palatella, L.; Lacorata, G.; Patti, B.; Arculeo, M.; Mifsud, R.; Mazzola, S.; et al. Planktonic stages of small pelagic fishes (Sardinella aurita and Engraulis encrasicolus) in the Central Mediterranean Sea: The key role of physical forcings and implications for fisheries management. Prog. Oceanogr. 2018, 162, 25–39. [Google Scholar] [CrossRef]
  5. Mehanna, S.F.; Salem, M. Population dynamics of round sardine Sardinella aurita in El-Arish waters, southeastern Mediterranean, Egypt. Indian J. Fundam. Appl. Life Sci. 2011, 1, 286–294. [Google Scholar]
  6. Wassef, E.; Ezzat, A.; Hashem, T.; Faltas, S. Sardine fishery by purse-seine on the Egyptian Mediterranean coast. Mar. Ecol. Prog. Ser. 1985, 26, 11–18. [Google Scholar] [CrossRef]
  7. Hakim, N.F.A.E.; Omar, A.A.; Hussein, M.S.; Salah, M.K.; Desoukt, M.G.; Agouz, H.M. Stock Assessment and Potential management of Sardinella aurita Fisheries in the East Mediterranean sea (North Sinai coast). Egypt. J. Aquat. Biol. Fish. 2012, 16, 121–132. [Google Scholar] [CrossRef] [Green Version]
  8. GAFRD. Fish Statistics Year Book, 2010–2019 ed; GAFRD: Cairo, Egypt; Available online: https://www.gafrd.org/posts/450754 (accessed on 3 March 2022).
  9. Solanki, H.U.; Dwivedi, R.M.; Nayak, S.R.; Somvanshi, V.S.; Gulati, D.K.; Pattnayak, S.K. Fishery forecast using OCM chlorophyll concentration and AVHRR SST: Validation results off Gujarat coast, India. Int. J. Remote Sens. 2003, 24, 3691–3699. [Google Scholar] [CrossRef]
  10. Tang, D.L.; Kawamura, H.; Lee, M.A.; Van Dien, T. Seasonal and spatial distribution of chlorophyll-a concentrations and water conditions in the Gulf of Tonkin, South China Sea. Remote Sens. Environ. 2003, 85, 475–483. [Google Scholar] [CrossRef]
  11. Shelton, P.A.; Hutchings, L. Ocean stability and anchovy spawning in the southern Benguela Current region. Fish. Bull. 1990, 88, 323–338. [Google Scholar]
  12. Mandon-Pépin, B.; Oustry-Vaiman, A.; Vigier, B.; Piumi, F.; Cribiu, E.; Cotinot, C. Expression profiles and chromosomal localization of genes controlling meiosis and follicular development in the sheep ovary. Biol. Reprod. 2003, 68, 985–995. [Google Scholar] [CrossRef] [PubMed] [Green Version]
  13. Petitgas, P.; Masse, J.; Bourriau, P.; Beillois, P.; Bergeron, J.P.; Delmas, D.; Herbland, A.; Koueta, N.; Froidefond, J.M.; Santos, M. Hydro-plankton characteristics and their relationship with sardine and anchovy distributions on the French shelf of the Bay of Biscay. Sci. Mar. 2006, 70, 161–172. [Google Scholar] [CrossRef] [Green Version]
  14. McNamara, J.M.; Houston, A.I. Starvation and predation as factors limiting population size. Ecology 1987, 68, 1515–1519. [Google Scholar] [CrossRef]
  15. Cushing, D.H. Plankton production and year-class strength in fish populations: An update of the match/mismatch hypothesis. Adv. Mar. Biol. 1990, 26, 249–293. [Google Scholar] [CrossRef]
  16. Chavez, F.P.; Ryan, J.; Lluch-Cota, S.; Niquen, M. From anchovies to sardines and back: Multidecadal change in the Pacific Ocean. Science 2003, 299, 217–221. [Google Scholar] [CrossRef] [Green Version]
  17. Pörtner, H.O.; Knust, R. Climate change affects marine fishes through the oxygen limitation of thermal tolerance. Science 2007, 315, 95–97. [Google Scholar] [CrossRef] [Green Version]
  18. Kassi, J.B.; Racault, M.F.; Mobio, B.A.; Platt, T.; Sathyendranath, S.; Raitsos, D.E.; Affian, K. Remotely sensing the biophysical drivers of Sardinella aurita variability in Ivorian waters. Remote Sens. 2018, 10, 785. [Google Scholar] [CrossRef] [Green Version]
  19. Balaguru, B.; Ramakrishnan, S.S.; Vidhya, R.; Thanabalan, P. A comparative study on utilization of multi-sensor satellite data to detect Potential Fishing Zone (PFZ). Int. Arch. Photogramm. Remote Sens. Spat. Inf. Sci. ISPRS Arch. 2014, 40, 1017–1026. [Google Scholar] [CrossRef] [Green Version]
  20. Nurdin, S.; Mustapha, M.A.; Lihan, T.; Ghaffar, M.A. Determination of potential fishing grounds of Rastrelliger kanagurta using satellite remote sensing and GIS technique. Sains Malays. 2015, 44, 225–232. [Google Scholar] [CrossRef]
  21. Kripa, V.; Mohamed, K.S.; Prema, D.; Mohan, A.; Abhilash, K.S. On the persistent occurrence of potential fishing zones in the southeastern Arabian Sea. Indian J. Geo-Mar. Sci. 2014, 43, 737–745. [Google Scholar]
  22. Shattri, M.; Tan, C.K.; Ibrahim, H.M.; Abdul Rashid, M.S. Satellite Fish Forecasting in South China Sea. In Proceedings of the 22nd Asian Conference on Remote Sensing, Singapore, 5–9 November 2001; Volume 2, pp. 5–9. [Google Scholar]
  23. Rintaka, W.E.; Susilo, E. Validation of potential fishing zone forecast using experimental fishing method in Tolo Bay, Central Sulawesi Province. IOP Conf. Ser. Earth Environ. Sci. 2018, 137, 012041. [Google Scholar] [CrossRef]
  24. Rueda-Roa, D.; Mendoza, J.; Muller-Karger, F.; Cárdenas, J.J.; Achury, A.; Astor, Y. Spatial variability of Spanish sardine (Sardinella aurita) abundance as related to the upwelling cycle off the southeastern Caribbean Sea. PLoS ONE 2017, 12, e0179984. [Google Scholar] [CrossRef] [PubMed] [Green Version]
  25. Baali, A.; Charouki, N.; Manchih, K.; Bessa, I.; Elqoraychy, I.; Elqendouci, M.; Amenzoui, K.; Yahyaoui, A. The relationship between Sardinella aurita landings and the environmental factors in Moroccan waters (21°–26° N). Cybium 2019, 43, 51–59. [Google Scholar] [CrossRef]
  26. Solanki, H.U.; Mankodi, P.C.; Nayak, S.R.; Somvanshi, V.S. Evaluation of remote-sensing-based potential fishing zones (PFZs) forecast methodology. Cont. Shelf Res. 2005, 25, 2163–2173. [Google Scholar] [CrossRef]
  27. Khalil, I.; Mannaerts, C.; Ambarwulan, W. Distribution of chlorophyll-a and sea surface temperature (SST) using modis data in east Kalimantan waters, Indonesia. J. Sustain. Sci. Manag. 2009, 4, 113–124. [Google Scholar]
  28. Daqamseh, S.T.; Al-Fugara, A.; Pradhan, B.; Al-Oraiqat, A.; Habib, M. MODIS Derived Sea Surface Salinity, Temperature, and Chlorophyll-a Data for Potential Fish Zone Mapping: West Red Sea Coastal Areas, Saudi Arabia. Sensors 2019, 19, 2069. [Google Scholar] [CrossRef] [Green Version]
  29. Carder, K.L.; Chen, F.R.; Cannizzaro, J.P.; Campbell, J.W.; Mitchell, B.G. Performance of the MODIS semi-analytical ocean color algorithm for chlorophyll-a. Adv. Sp. Res. 2004, 33, 1152–1159. [Google Scholar] [CrossRef]
  30. Loisel, H.; Lubac, B.; Dessailly, D.; Duforet-Gaurier, L.; Vantrepotte, V. Effect of inherent optical properties variability on the chlorophyll retrieval from ocean color remote sensing: An in situ approach. Opt. Express 2010, 18, 20949. [Google Scholar] [CrossRef]
  31. Solanki, H.U.; Dwivedi, R.M.; Nayak, S.R. Synergistic analysis of SeaWifs chlorophyll concentration and NOAA-AVHRR SST features for exploring marine living resources. Int. J. Remote Sens. 2001, 22, 3877–3882. [Google Scholar] [CrossRef]
  32. Agenbag, J.J.; Richardson, A.J.; Demarcq, H.; Fréon, P.; Weeks, S.; Shillington, F.A. Estimating environmental preferences of South African pelagic fish species using catch size- and remote sensing data. Prog. Oceanogr. 2003, 59, 275–300. [Google Scholar] [CrossRef]
  33. Teixeira, C.M.; Gamito, R.; Leitão, F.; Cabral, H.N.; Erzini, K.; Costa, M.J. Trends in landings of fish species potentially affected by climate change in Portuguese fisheries. Reg. Environ. Chang. 2014, 14, 657–669. [Google Scholar] [CrossRef]
  34. Marchal, P.; Ulrich, C.; Korsbrekke, K.; Pastoors, M.; Rackham, B. A comparison of three indices of fishing power on some demersal fisheries of the North Sea. ICES J. Mar. Sci. 2002, 59, 604–623. [Google Scholar] [CrossRef]
  35. Mujib, Z.; Boesono, H.; Purnamafitri, A.D. Pemetaan sebaran ikan tongkol (Euthynnus sp.) dengan data klorofil-α citra modis pada alat tangkap payang (Danish-seine) Penelitian-penelitian. J. Fish. Resour. Util. Manag. Technol. 2013, 2, 150–160. [Google Scholar]
  36. Sastra, I.G.A.B.W.; Karang, I.W.G.A.; As-syakur, A.R.; Suteja, Y. Variasi Musiman Hubungan Antara Parameter Oceanografi Dengan Hasil Tangkapan Ikan Tongkol Berdasarkan Data Harian Di Selat Bali. J. Mar. Aquat. Sci. 2017, 4, 109. [Google Scholar] [CrossRef] [Green Version]
  37. Santos, A.M.P. Fisheries oceanography using satellite and airborne remote sensing methods: A review. Fish. Res. 2000, 49, 1–20. [Google Scholar] [CrossRef]
  38. Polovina, J.J.; Howell, E.; Kobayashi, D.R.; Seki, M.P. The transition zone chlorophyll front, a dynamic global feature defining migration and forage habitat for marine resources. Prog. Oceanogr. 2001, 49, 469–483. [Google Scholar] [CrossRef]
  39. Syah, A.F.; Ramdani, L.W.; Suniada, K.I. Prediction of potential fishing zones for mackerel tuna (Euthynnus sp.) in Bali Strait using remotely sensed data. IOP Conf. Ser. Earth Environ. Sci. 2020, 500, 012070. [Google Scholar] [CrossRef]
Figure 1. The global distribution of Sardinella aurita; red zones represent locations of high occurrence and yellow zones represent locations of low occurrence. (A) Image for a school of Sardines. (B) The species: Sardinella aurita. (C) The global distribution of Sardinella aurita.
Fishes 07 00097 g001
Figure 2. Location map of the area of study; the major fishing regions visited during the field survey and the landing ports are highlighted.
Fishes 07 00097 g002
Figure 3. The method applied to detect the PFZs.
Fishes 07 00097 g003
Figure 4. Example of changes in Sea-Surface Temperature on 5 October 2020 from both MODIS-Aqua and Sentinel-3 (an example of the data sources used).
Fishes 07 00097 g004
Figure 5. Example of changes in Chlorophyll-A (mg/m3) on 5 October 2020 both from MODIS-Aqua and Sentinel-3 data (as an example of the data sources used).
Fishes 07 00097 g005
Figure 6. The monthly detected Potential Fishing Zones for Sardinella aurita over 2018 (May–November).
Fishes 07 00097 g006
Figure 7. The monthly detected Potential Fishing Zones for Sardinella aurita over 2019 (May–November).
Fishes 07 00097 g007
Figure 8. The monthly detected Potential Fishing Zones for Sardinella aurita over 2020 (May–September).
Fishes 07 00097 g008
Figure 9. Monthly variations in PFZ area for Sardinella aurita during 2018–2020.
Fishes 07 00097 g009
Figure 10. (A) The annual sardine catches along the north coast according to (B) the landing site from Matrouh to El-Arish from 2010 to 2019.
Fishes 07 00097 g010
Figure 11. The annual amount of sardine catches (Ton) in Egypt Mediterranean water from 2009 to 2019 (Source: GAFRD 2019).
Fishes 07 00097 g011
Figure 12. The monthly amount of sardine catches (Ton) in Egypt Mediterranean water for the period 2010–2019 (Source: [8]).
Fishes 07 00097 g012
Figure 13. Spatial distribution of S. aurita PFZs on 5 October 2020, both from MODIS-Aqua and Sentinel-3 sensors.
Fishes 07 00097 g013
Figure 14. PFZ for Sardinella aurita and Makerel Tuna on 9 June 2020.
Fishes 07 00097 g014
Figure 15. PFZ for Sardinella aurita and Makerel Tuna on 14 October 2020.
Fishes 07 00097 g015
Table 1. Examples of monthly catch results of Sardinella during 2018 and the quantity per landing site (Ton), (-) no data available.
RegionLanding SitesJanuaryFebruaryMarchAprilMayJuneJulyAugustSeptemberOctoberNovemberDecemberTotal
Western AreaMatrouh36303026333212732-4042320
Alexandria/Max2712552963162266751131091132252191152933
Abu Quir363041434134342428413526413
Maadia5954264525716347414413995786375274896490
Rashid5153713444654974613694475055784154375404
Middle DeltaBorg El Burollus5476927689961055106310601096101284681064310,588
DamiettaIzbet ElBorg169141197480767125518612748272726382277138916,649
Eastern AreaPort Said96511001318188715471181117511481098110090882013,747
ElArish3753----4111253124186
Gross total31713098344642844800544250695979610460905262398556,730
Publisher’s Note: MDPI stays neutral with regard to jurisdictional claims in published maps and institutional affiliations.

