Abstract
Understanding life history parameters is key to assessing demography, biological productivity, and extinction risk of fishes. Age and growth analyses in chondrichthyan fishes (sharks, rays, and ghost sharks) is primarily undertaken through counting vertebral band pairs. For rare, threatened, and protected species such as river sharks (Carcharhinidae; Glyphis), obtaining sufficient vertebrae samples may not be possible. Here we use a very small sample size, selective size-class sampling, back-calculation techniques, and a Bayesian hierarchical model that accounts for repeated measures to provide age and growth information for the Speartooth Shark Glyphis glyphis from which comprehensive sampling is not possible. Ten individuals were selectively sampled from the Adelaide River, Northern Territory, Australia. Bayesian length-at-age models using a combination of informative and uninformative priors in a multi-model framework were applied to the observed and back-calculated data with the sexes combined. Band pair counts produced age estimates of 0–11 years and suggest that age at maturity is possibly >12 years. Most model parameter estimates for length-at-birth (L0) and asymptotic length (L∞) were biologically plausible. The Gompertz growth function, applied through a Bayesian hierarchical approach to back-calculated data, provided the best fitting and most biologically appropriate length-at-age parameters: L∞ = 229.5 cm TL ± (14.6 SE), gGom = 0.16 yr−1 ± (0.01 SE), and L0 = 58.2 cm TL ± (1.4 SE). The results presented here are the first study to apply Bayesian methods to back-calculated length-at-age data while accounting for repeated measures.
Keywords:
back-calculation; Bayesian hierarchical models; euryhaline species; Glyphis glyphis; life history; Speartooth Shark Key Contribution:
This study applied selective targeted sampling and advanced statistical approaches to provide biologically plausible age and growth parameters for a rare and threatened shark using the smallest sample size of any shark ageing study.
1. Introduction
Understanding species life history parameters is key to assessing biological productivity and extinction risk and informing the management of exploited populations. Biologically productive species are able to withstand higher exploitation levels and recover more quickly if populations are over-exploited or depleted [1]. The collection of life history data most often requires lethal sampling to understand key aspects such as age and growth and reproductive biology [2]. Age, fecundity, reproductive periodicity, and mortality estimates (the latter of which can be calculated from growth data) are required to calculate demographic parameters [3]. This includes productivity measures such as intrinsic rates of population increase (e.g., [4]). Age data are also required to calculate close-kin population abundance estimates (e.g., [5]) and generation length, a key demographic parameter when assessing species extinction risk within the framework of the IUCN Red List of Threatened Species [6].
Unsustainable exploitation and trade are driving a heightened level of extinction risk among the world’s chondrichthyan fishes (sharks, rays, and ghost sharks; hereafter ‘sharks’). Approximately one third of all sharks are estimated to be threatened with extinction [7]. Amongst non-marine sharks, euryhaline species are a highly specialised group that are particularly at risk [8]. These species occupy restricted habitats within riverine and estuarine environments, where they are capable of tolerating a range of salinities from marine to freshwater [8]. Of the ten euryhaline sharks globally [8], seven are threatened, including two Critically Endangered species [7].
The river sharks (family Carcharhinidae; genus Glyphis) comprise three threatened euryhaline species of the Indo-West Pacific. Two species (Northern River Shark G. garricki and Speartooth Shark G. glyphis) have patchy restricted geographic ranges in northern Australia and southern Papua New Guinea [9,10]. They display a high degree of population structuring [9,10,11] but their basic life history (e.g., age and growth and reproductive biology) is poorly known [12,13]. These species reach sizes of at least 251 cm total length (TL) for G. garricki and ∼260 cm TL for G. glyphis [13,14]. Juvenile life stages occupy large tidal rivers where they undertake daily and seasonal movements influenced by tidal cycles and salinity, while the habitat occupancy of adults is poorly known but includes coastal and marine waters [12,13]. Both species are protected in Australia due to their threatened listings under national environmental legislation [15]. However, they continue to face threats from incidental catch, primarily in commercial fisheries (e.g., [16]), as well as water resource development [17].
A protected status can limit the assessment of life history parameters required for demographic analyses and management purposes. Ideally, shark ageing studies utilise a large sample size to obtain accurate age and growth parameters and to be able to assess these parameters separately for each sex. Large sample sizes (∼200 individuals; [18]) are not always feasible for fish species with low encounter rates with fisheries (e.g., due to rarity or catchability) or for species of conservation concern [19]. A variety of approaches can overcome small sample sizes in shark age and growth studies, including selective size-class sampling and back-calculation techniques. Size-class selective sampling is important as a representative spread of individuals across the size range can provide improved growth model results, even when sample sizes are small [19]. Back-calculation techniques are also valuable as these provide interpolated length-at-age estimates for each individual [20]. Therefore, large individuals in the sample can account for the under sampling of smaller individuals [19]. Here we apply both of these techniques as well as a Bayesian hierarchical approach to account for repeated measures from back-calculations. We use this combination of approaches to provide age and growth data on the rare, threatened, and protected G. glyphis, from which comprehensive sampling is not viable. Subsequently, we provide plausible age and growth parameters using the smallest sample size of any shark study.
2. Materials and Methods
2.1. Sample Collection
Samples were collected from the middle to lower reaches of the Adelaide River, Northern Territory, Australia. Sharks were caught between 8 December 2015 and 23 November 2016 from a boat using rod and line on fresh teleost fish bait set on the bottom of the river. To obtain a wide size range of specimens for vertebral ageing, sharks were targeted at ∼20 cm intervals between size at birth (50–65 cm TL; [13]) and the maximum recorded size in the Northern Territory of ∼190 cm TL (PM Kyne et al. unpubl. data). Upon capture, sharks were lifted into a sampling tub, and if the individual G. glyphis met the desired size class for vertebral sampling, the shark was immediately euthanized using a saturation bath of MS-222. The specimen was then sexed, measured, weighed, and photographed. The jaws of all processed sharks were deposited in the Museum and Art Gallery of the Northern Territory in Darwin (S.18962-001, S.18962-002, S.18963-001, S.18963-002, S.18964-001, S.18965-001, S.18966-001, S.18967-001, S.18968-001, and S.18969-001). All other sharks, including additional G. glyphis outside the desired size classes, were processed for tagging and tissue sampling as part of a larger project and released at the site of capture.
Maturity was assessed in each individual shark by examining the state of external clasper calcification in males and the state of internal reproductive tract development in females, following [21]. Immature males: uncalcified claspers; sub-adult males: partially calcified claspers; adult males: fully calcified claspers. Immature females: undeveloped internal reproductive tracts (small ovaries, thin uteri, and translucent oviducal gland); sub-adult females: developing internal reproductive tracts (enlarging ovaries, thin uteri, and oviducal gland diameter ≥ 12 mm); adult females: fully developed internal reproductive tracts (ovary with mature follicles, extended uteri with eggs or embryos if gravid, and large developed oviducal gland).
2.2. Vertebrae Sectioning
Vertebrae were processed following protocols described in [22]. Six of the largest anterior (thoracic) vertebrae were removed from the anterior of the first dorsal fin in each shark. Once transported to the laboratory, the vertebrae were stored frozen until processing when they were defrosted, and remaining muscle tissue was removed using a scalpel. Individual vertebral centra were then separated and soaked in a 4% sodium hypochlorite solution for 30 min to remove any remaining tissue. Centra were then dried in an oven at 60 °C for 24 h. For each shark, a single centra in good condition after processing was selected for ageing. A low-speed circular saw with two diamond-tipped blades (Beuhler, IL, USA) was used to section individual centra. These longitudinal sections were made through the centrum focus at a thickness of 400 µm. Sections were mounted onto microscope slides using Crystal Bond adhesive (SPI supplies, West Chester, PA, USA).
2.3. Age Determination
Ages of individual centra were estimated by counting the translucent and opaque band pairs in the corpus calcareum under a microscope using transmitted light [22]. A change in angle of the corpus calcareum was interpreted as a transition from pre- to post-natal growth and marked as an age of zero (Figure 1). Each subsequent growth band pair was assumed to be one year of growth. Annual growth band deposition could not be validated in this study due to the sampling limitations.

Figure 1.
Photograph of a sectioned vertebral centrum from a 181.5 cm total length female Glyphis glyphis with 11 visible growth band pairs (solid black circles with white numbers). Age zero (birth mark) is denoted by the grey circle with a black outline.
Growth band pairs were counted by two independent readers to reduce age estimation bias ([22,23]). When counts differed between readers, the samples were re-examined until a consensus age was reached. If no consensus age was reached, that centrum would be removed from analysis. Percent agreement (PA) and percent agreement ± 1 year (PA ± 1 year) were calculated between growth band reads [22]. However, standard inter-reader precision statistics such as Bowker’s test of symmetry [24,25], average percent error (APE), and Chang’s coefficient of variation (CV) [26] were precluded by the small sample size [19].
2.4. Back-Calculation
Back-calculation techniques were used to supplement the low sample size with interpolated data [27]. Centra were photographed using a compound video microscope and the distances between growth band pairs were measured using image analysis software (Image Pro Plus version 6.2 for Windows, Media Cybernetics, Rockville, MD, USA, 2002). The centrum radius (CR) was measured as a straight line from the focus to the centrum edge. The birth mark and each growth band pair were measured along this line as the distance from the focus to the nearest 1 µm. A Dahl Lea direct proportions back-calculation technique was applied [28]:
where Li = length at growth band pair ‘i’, Lc = length at capture, CRc = centrum radius at capture, and CRi = centrum radius at growth band pair ‘i’. An assumption of the Dahl Lea direct proportions method is that there is a linear relationship between Lc and CRc. This was tested by performing a linear regression between these two measurements.
2.5. Growth Modelling
Length-at-age models were applied to the observed and back-calculated data with the sexes combined due to the small sample size [19]. Growth was estimated using a multi-model framework [29] that included three candidate growth functions a priori: von Bertalanffy growth function (VBGF) [30], Gompertz function [31], and logistic function [32] (Table 1). Parameterisations that included length-at-birth (L0) and asymptotic length (L∞) parameters were used for all three candidate models (Table 1). These parameterisations are recommended for sharks as they provide more biologically relevant information and can be compared directly between candidate models [29,33].

Table 1.
Model equations of the three a priori growth functions used to estimate length-at-age.
A Bayesian approach outlined by [34] using Markov Chain Monte Carlo was used to estimate growth for the observed data using a combination of informative and non-informative priors. This was applied using the ‘BayesGrowth’ R package version 0.3.0 [35]. This approach uses informative priors for L∞ and L0 based on known maximum size and length-at-birth for the species and can be highly effective at improving biological realism in data-poor situations [34]. The priors used for the parameters (defined in Table 1) of all three candidate models were as follows:
L∞ ∼ N(250, 50)
k ∼ U(0.001, 1)
gGom ∼ U(0.001, 1)
glog ∼ U(0.001, 1)
L0 ∼ N(65, 6.5)
σ ∼ U(0.001, 50)
The prior for L∞ was informed by the best available estimate of maximum size for G. glyphis of 260 cm TL based on sampling in Papua New Guinea [14] and two recently recorded adult individuals from Queensland, Australia, measuring 260 and 250 cm TL (R. Dwyer, pers. comm., 23 June 2025). As maximum size is defined as larger than L∞, the prior was set slightly lower than the maximum size and a large standard deviation was used to represent the greater uncertainty in this parameter, as recommended by [34]. The L0 prior was informed by empirical length-at-birth estimates and was constructed to match this length range (50–65 cm TL; [13,14]), with a smaller standard deviation to represent that this value is better understood. A range of lengths that matched uniform priors were applied to the growth completion parameters (k, gGom, and glog) and the residual standard error (σ) to allow the model to freely estimate these parameters based on the available data and the informative priors for L∞ and L0.
This same framework could not be applied to the back-calculated data owing to the repeated measures introduced by each individual. Therefore, the ‘BayesGrowth’ methodology was extended to a hierarchical Bayesian framework incorporating individual-level random effects for each model parameter. This hierarchical structure allows for sharing information across individuals and improving the estimation of individual-level parameters as well as population-level parameters. The individual-level random effect parameters were specified as follows:
where L∞i, ki, and L0i were individual-level parameters estimated for each individual i, and σL∞, σk, σgLog, σgGom, and σL0 were the standard deviations for each random effect parameter. Each of these standard deviations were given a uniform, non-informative prior with a lower bound at zero and an upper bound equivalent to their parameter value.
L∞i ∼ N(L∞, σL∞)
ki ∼ N(k, σk)
gGomi ∼ N(gGom, σgGom)
gLogi ∼ N(gLog, σgLog)
L0i ∼ N(L0, σL0)
All models were estimated using the Stan software through the ‘rstan’ R package version 2.21.2 [36]. This includes the observed data models estimated using BayesGrowth as this package is a wrapper around rstan models [35]. Each model was run on 3 chains for 10,000 Markov Chain Monte Carlo iterations with a burn-in period of 2000 iterations. The Gelman–Rubin statistic and trace plots were used to determine whether the chains had mixed, indicating model convergence was achieved. Posterior density plots were examined to ensure that all parameters were unimodal. An autocorrelation function was used to determine if autocorrelation was present. Each of these diagnostics was performed using the ‘bayesplot’ R package [37]. Each model passed every diagnostic test, indicating that the number of iterations and burn-in period were sufficient and that samples did not need to be thinned (Figures S1–S4). Sensitivity analyses were conducted on the informative priors (L∞ and L0) by increasing and decreasing their standard errors by 50% and re-running the model. This was performed for the best fitting growth model to assess the influence of the priors [34].
Model selection was performed using the leave-one-out cross-validation information criterion statistic (LOOIC), which was estimated using the ‘loo’ R package [38,39]. The candidate model with the lowest LOOIC value (LOOICmin) and the highest LOOIC weight (w) value was selected as the best fitting model. The LOOICi differences (∆i) for each candidate model (i = 1–3) were calculated as
where LOOICi was the LOOIC of each candidate model i and LOOICmin was the lowest LOOICi.
LOOIC weights (wi) were calculated as follows:
3. Results
Retained sharks were collected at river depths of 4.3–10.5 m, water temperatures of 30.9–31.9 °C, surface salinities of 4.04–19.06, and turbidity of 25–279 NTU and consisted of three males (101.5–153.2 cm TL) and seven females (59.8–189.0 cm TL) (Table S1). All individuals were immature, although the largest three females (161–189 cm TL) were classed as sub-adults (Table S1). The weight–length relationship for both sexes combined was as follows:
where Wt is weight in kg and TL is total length in cm (Figure S5).
Male ages were 4, 5, and 8 years, while females ages ranged from 0 to 11 years (Table S1). The growth band pairs were visible in all centra and easy to identify for most individuals (Figure 1). This led to high reader agreement as PA was 46% and the PA ± 1 year was 82%. Final ages were agreed upon through consensus reads so no individuals were removed from the analysis. A linear relationship was determined between Lc and CRc (Figure S6). Therefore, the Dahl Lea direct proportions technique was appropriate for G. glyphis.
While reasonable model fits were achieved by the von Bertalanffy and logistic growth functions for both the observed and back-calculated data (Figures S7 and S8), the LOOIC demonstrated that the Gompertz growth function was consistently the best fitting model across the observed and back-calculated analyses (Table 2). The length-at-age estimates of the candidate growth models were most similar for the observed data (Figure S7), while the back-calculated data produced a much-improved fit with the Gompertz growth function over the other candidate models (Figure S8; Table 2). In both applications, the von Bertalanffy growth function consistently estimated the largest L∞, while the logistic estimated the lowest (Table 2), which is consistent with the known performance of these models [29]. For the back-calculated data, both the von Bertalanffy and logistic estimates of L∞ did not match empirical estimates of maximum size (∼260 cm TL; [14]; Table 2). However, estimates of L0 were within the range of known length-at-birth for G. glyphis (50–65 cm TL; [13,14]).
Table 2.
Summary of candidate growth model parameters and LOOIC results for the observed length-at-age and back-calculated data for Glyphis glyphis with sexes combined.
The Gompertz model provided the most biologically plausible results, as well as the best statistical fit for both the observed and back-calculated data (Figure 2; Table 2). The back-calculated growth model provided a more precise fit due to the increased sample size and estimated a more biologically appropriate L∞ of 229.5 cm (Figure 2; Table 2). This value is more appropriate as it is lower than the maximum size, which is consistent with how L∞ should be interpreted [34,40]. In the back-calculated Gompertz model, the individual-level growth parameters were similar to the population-level parameters, with most individual parameter means falling within the 95% credibility intervals of the population-level parameter estimates (Figure 3). Similarly, the individual-level length-at-age estimates deviated only slightly from the population-level length-at-age estimates and remained within the 95% credibility intervals of the population-level estimates (Figure 2).
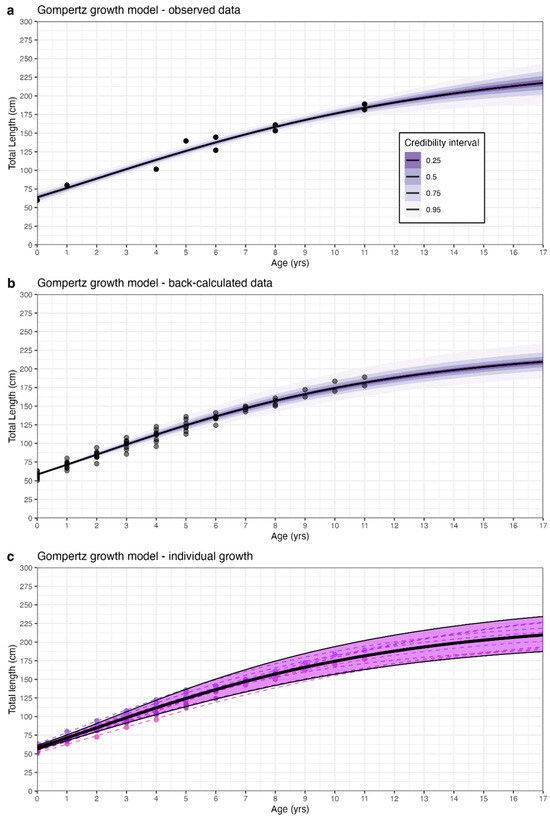
Figure 2.
Length-at-age estimates for the best fitting model for Glyphis glyphis with sexes combined for (a) observed data, (b) back-calculated data, and (c) individual-level and population-level estimates from the back-calculated hierarchical model. The Gompertz model was the best fitting candidate model for both the observed and back-calculated data. Black points in (a,b) represent the length-at-age samples (a) and back-calculated samples (b). Purple shading in (a,b) represent the Bayesian credibility intervals and the black lines are the length-at-age estimates. Coloured points in (c) represent the back-calculated data that distinguish each individual. Coloured and dashed lines in (c) represent the individual-level growth curves from the random effect model, while the black dashed line and purple shaded area are the population-level growth curve and 95% credibility interval from (b).
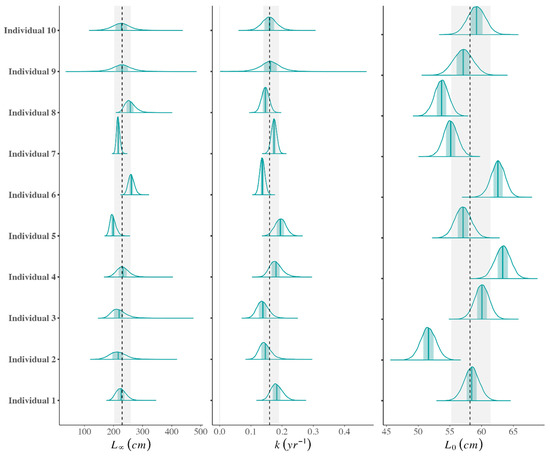
Figure 3.
The probability densities for individual growth parameters (L∞, k, and L0) estimated as random effects for the ten sharks (y axis) included in the back-calculated Bayesian Gompertz growth model. The teal vertical line inside the probability densities shows the mean parameter estimate and the light teal shading is the 50% interval. The black dashed line and grey shading show the population-level mean and 95% credibility interval for each parameter.
While there is a lack of mature individuals included in the analysis, the biological information incorporated into the growth models as informative priors provides some confidence that these growth estimates are likely to resemble those of the complete age range. The length-at-age parameter estimates for G. glyphis for both sexes combined were L∞ = 229.5 cm TL ± (14.6 SE), gGom = 0.16 yr−1 ± (0.01 SE), and L0 = 58.2 cm TL ± (1.4 SE) based on the results of the Gompertz Bayesian hierarchical growth model applied to back-calculated data (Table 2; Figure 2). Length-at-age estimates from the Gompertz model applied to back-calculated data across an age range of 0–25 years are provided in Table S2. The sensitivity analyses that used different informative priors demonstrated that using narrower or wider priors did not substantially change the resulting length-at-age estimates (Figure S9). This demonstrates consistency between the back-calculated data and the priors used in the Gompertz Bayesian growth model with random effects.
4. Discussion
We used the smallest known sample size to generate provisional growth curves and age estimates for a shark species in an exceptional instance where a larger and more suitable sample size is unlikely to ever be achieved. This extremely low sample size was accounted for through a structured process that included (1) targeted size-selective sampling; (2) back-calculation to increase the sample size; (3) the use of multiple growth models to ensure optimal fit; and (4) Bayesian hierarchical methods to incorporate valuable biological information. This allowed the assessment of age and growth in a rare and threatened species.
Both river shark species (Glyphis glyphis and G. garricki) occurring in northern Australian riverine and estuarine waters are rare, threatened, and protected species, limiting opportunities to acquire a large or even moderate sample size to undertake ageing through examination of vertebral band pairs. Very small sample sizes have been used to produce age-at-length estimates for only a handful of rare and threatened species, namely the Winghead Shark Eusphyra blochii (n = 14; [19]), Fossil Shark Hemipristis elongata (n = 14; [19]), and Maugean Skate Dipturus maugeanus (n = 13; [41]). These studies have produced biologically plausible age and growth parameters for these species. Our use of structured sampling directly targeting selected size classes and statistical techniques to handle this extremely small sample size has permitted valuable growth estimates and biological information to be produced from only ten individuals. The success of this approach does not dismiss the fact that these estimates must still be considered provisional, given they come from a very limited sample.
While the length-at-age estimates presented here will be valuable in species conservation and management, some caution must be highlighted given the limited samples used. All samples examined in this study were from juveniles or sub-adults. Adults have not yet been recorded in the Northern Territory, with only a few records from small-scale fishers in Papua New Guinea [14] and recent encounters in Queensland (R. Dwyer, pers. comm., 23 June 2025). In the Northern Territory, adults likely occur in coastal and marine waters outside of surveyed rivers. The lack of mature individuals in the sample has been somewhat counteracted through the use of a Bayesian prior on L∞, allowing a biologically plausible growth curve to be estimated across the length range of G. glyphis. These results would be improved with greater certainty in estimates if this sample could be supplemented with adult individuals in the future. We also caution that due to the limitations of the approach undertaken here, we were unable to validate annual growth band deposition and assumed that band pair deposition was annual. It is noted that band pair deposition can be linked to somatic growth and that counting vertebral band pairs has resulted in the underestimation of age in sharks [42,43]. Despite these limitations, the growth curves and parameters are biologically plausible as they correspond with minimum and maximum lengths for G. glyphis [13,14], and the growth completion parameters are consistent with other similarly sized species of whaler sharks (Carcharhinidae) in Australia (e.g., [29,44,45]). This is particularly the case for length-at-birth (L0), where observed data model estimates ranged 62.3–65.2 cm TL and back-calculated estimates ranged 57.3–58.9 cm TL. These values overlap with the reported size at birth in the literature of 50–65 cm TL [13]. The asymptotic length (L∞) parameters produced here are more variable (observed: 233.2–268.0 cm TL; back-calculated: 197.5–326.6 cm TL) given our sample did not include adults. However, the estimate of 229.5 cm TL determined by the most appropriate and best fitting model (the Gompertz growth function) is biologically realistic given the maximum size of G. glyphis (∼260 cm TL). The L∞ represents the average length of fully grown individuals and therefore should be less than (but often close to) the known maximum size ([34,40]).
Applying back-calculation techniques increased the number of length-at-age points in the growth models from 10 to 72 through interpolation. This increased the precision of all three candidate models, estimating narrower confidence intervals for each growth parameter and a lower model residual standard error (σ). However, back-calculated data points can introduce two issues to length-at-age modelling. Firstly, Rosa Lee’s phenomenon can occur, where the back-calculated individuals provide lengths that are smaller than observed length-at-ages [46]. This occurs as length-selective mortality removes faster growing individuals from the population, so individuals that survive to larger sizes tend be slower-growing [47]. Rosa Lee’s phenomenon is less likely to have impacted this study given that no adult individuals were sampled, which would have the greatest influence on this phenomenon. It is also possible that the hierarchical model structure used here could account for this phenomenon by accounting for repeated measures. However, this requires further investigation using a dataset where this phenomenon would be expected to occur. Secondly, back-calculation techniques introduce repeated measures to growth analyses, which many past studies have failed to address (such as [19]). Therefore, the use of back-calculated data was beneficial in this study, as biases are unlikely to have been introduced, while the benefits of this technique were capitalised on through the application of hierarchical models.
Bayesian methods are becoming increasingly common in shark growth studies due to the improvements they offer over frequentist methods [40,48,49,50]. This is, however, the first study to apply Bayesian methods to back-calculated data while accounting for repeated measures. Previous applications of growth models to back-calculated data (often with frequentist methods) have failed to account for repeated measures and therefore have violated statistical assumptions (e.g., [19]). Instead, growth models applied to back-calculated data should treat each individual as a random effect and estimate individual- and population-level parameter estimates [51,52]. Back-calculated methods provide demonstrable benefits in data-poor situations, as shown here and by [19]. This study therefore provides an important update to [19] by using best practice methods that incorporate Bayesian statistics accounting for repeated measures. This effectively provides meaningful and important biological information when estimating the growth of rare or difficult-to-sample species and maximises the information that can be obtained from limited sample sizes.
Since adult G. glyphis have never been recorded in the Northern Territory, there is not likely to be an opportunity to incorporate samples from larger size classes into age and growth analysis. The highest age produced from this study was 11 years for female sub-adult sharks that were assessed to be close to sexual maturity based on examination of the reproductive system. We therefore suggest that age at maturity may be in the order of 12 years or more and that G. glyphis is a relatively long-lived shark, although this remains uncertain based on our data. Ageing studies on other carcharhinid species with a similar age at maturity have produced maximum ages of 19–30 years, e.g., the Grey Reef Shark Carcharhinus amblyrhynchos (age at maturity, 11 years; maximum age, 19 years; [53]) and Pigeye Shark C. amboinensis (age at maturity, 13 years; maximum age, >30 years; [54]).
Aquarium-housed Glyphis glyphis can provide further insights into age, with this species being housed at the Melbourne Aquarium, Australia, since 2007. Three G. glyphis collected from the wild at 65–70 cm TL (0+ years old at collection) lived to 14+ years (one male and one female) and 15+ years (female) of age (L. Simmons, pers. comm., 30 April 2024). Both females were ∼200 cm TL and were mature adults based on the ovarian state observed during necroscopies (L. Simmons, pers. comm., 30 April 2024). It should be noted that variability in biological parameters between wild and aquarium-housed sharks and rays is well documented, including growth rates and ages [55]. These individuals are also well below the estimated maximum size of ∼260 cm TL [14] so most certainly fall short of the maximum age in the wild.
The conservative life history pattern of many large sharks limits their ability to recover from population depletion [1,4]. The growth of G glyphis is slow relative to many other threatened and/or depleted aquatic taxa [1], and the late age at maturity and suspected longevity of G. glyphis suggests the species exhibits a ‘slow’ life history pattern. Reproductive data such as litter size and reproductive periodicity are unavailable for G. glyphis [12], limiting a full assessment of biological productivity. In the absence of other data, the age and growth results presented here are critical to better understand the species’ demography. A conserved biology, combined with persistent threats, particularly bycatch in commercial net fisheries [10,16] and large-scale water extraction in key rivers [17], small population sizes [5], and high genetic population structuring [11,56], place the species at heightened risk of population depletion and local extinctions.
5. Conclusions
We used a structured multi-element approach combining targeted size-selective sampling, back-calculation, multiple growth models, and Bayesian hierarchical methods to assess age and growth in a rare and threatened species. This provided valuable new biological information for the conservation and management of G. glyphis. Dynamic population assessments are unfeasible for rare or difficult-to-sample species, meaning that static population assessment techniques such as demographic models or other productivity and susceptibility analyses are relied upon. These require reliable information on species biology such as growth, maturity, and natural mortality (M), which have partially been provided in the present study. Length-at-age estimates are particularly useful as they allow a timeline of life history events to be constructed and allow further biological information such as M or generation length to be determined. Therefore, while the estimates presented in this study must be considered provisional, they are still undeniably valuable as they facilitate further assessments. The results of this study would become increasingly valuable if future sampling opportunities allow the analyses to be updated with an increased sample size or with adult specimens. Given the rarity of G. glyphis and its protected status, this may be unfeasible, making these provisional life history estimates all the more important. Furthermore, we have demonstrated the successful application of our approach using the smallest known sample size to examine age and growth in a shark, a methodology which is transferable to other species where comprehensive sampling is not possible.
Supplementary Materials
The following supporting information can be downloaded at https://www.mdpi.com/article/10.3390/fishes11010007/s1, Table S1: Biological parameters of sampled Glyphis glyphis used in this study, including age estimation based on band pair counts; Table S2: Length-at-age estimates for Glyphis glyphis from the Gompertz model applied to back-calculated data. Values in parentheses are the lower and upper Bayesian credibility intervals for each age; Figure S1: Posterior density plots (left panels) and trace plots (right panels) for the parameters of the Gompertz model applied to the observed data. Unimodal distributions and overlapping chain traces (that resemble fuzzy caterpillars) indicate that the Markov Chain Monte Carlo (MCMC) chains are well mixed and that parameters have been estimated successfully; Figure S2: Autocorrelation function plot for the parameters of the Gompertz model applied to the observed data. Each row represents a different Markov Chain Monte Carlo (MCMC) chain. A result of 0 (y axis) by the time the lag (x axis) reaches 20 indicates that no autocorrelation was present for that parameter and chain; Figure S3: Posterior density plots (left panels) and trace plots (right panels) for the population-level parameters of the Gompertz model applied to the back-calculated data. Unimodal distributions and overlapping chain traces (that resemble fuzzy caterpillars) indicate that the Markov Chain Monte Carlo (MCMC) chains are well mixed and that parameters have been estimated successfully. Individual-level random effect parameters yield the same results but are too numerous to display; Figure S4: Autocorrelation function plot for the population-level parameters of the Gompertz model applied to the back-calculated data. Each row represents a different Markov Chain Monte Carlo (MCMC) chain. A result of 0 (y axis) by the time the lag (x axis) reaches 20 indicates that no autocorrelation was present for that parameter and chain. Individual-level random effect parameters yield the same results but are too numerous to display; Figure S5: Weight–length relationship for Glyphis glyphis. Blue line is the estimated weight at length and blue shading represents the 95% confidence intervals; Figure S6: Relationship between centrum radius (CRc) and length at capture (Lc) for Glyphis glyphis (Lc = 13.49 CRc + 15.195, R2 = 0.99, F1,8, p < 0.001); Figure S7: Comparison of candidate growth model fits for the observed data. In (a), (b), and (c), black lines represent the mean length-at-age estimates for each model and coloured shading represents the Bayesian credibility internals. (d) shows all three candidate models and their corresponding 95% credibility intervals. The Gompertz model was the best fitting model according to LOOIC (leave-one-out cross-validation information criterion statistic); Figure S8: Comparison of candidate growth model fits for the back-calculated data. In (a), (b), and (c), black lines represent the mean population-level length-at-age estimates for each model and coloured shading represents the Bayesian credibility internals. (d) shows all three candidate models and their corresponding 95% credibility intervals. The Gompertz model was the best fitting model according to LOOIC (leave-one-out cross-validation information criterion statistic); Figure S9: Comparison of Gompertz growth model fits using different informative priors for L∞ and L0 for the back-calculated data. The ‘Narrow priors’ model used L∞∼N(250, 25) and L0∼N(65, 2.5), and the ‘Wide priors’ model used L∞∼N(250, 75) and L0∼N(65, 13). The Base Case model is the model presented in the results which used L∞∼N(250, 50) and L0∼N(65, 6.5). The Gompertz model was the best fitting model according to LOOIC (leave-one-out cross-validation information criterion statistic).
Author Contributions
Conceptualization, P.M.K., J.J.S. and G.J.J.; Methodology, P.M.K., J.J.S. and G.J.J.; Software, J.J.S.; Validation, P.M.K., J.J.S. and G.J.J.; Formal Analysis, P.M.K., J.J.S. and G.J.J.; Investigation, P.M.K., J.J.S. and G.J.J.; Resources, P.M.K., J.J.S. and G.J.J.; Data Curation, P.M.K., J.J.S. and G.J.J.; Writing—Original Draft Preparation, P.M.K., J.J.S. and G.J.J.; Writing—Review and Editing, P.M.K., J.J.S. and G.J.J.; Visualisation, J.J.S.; Supervision, P.M.K.; Project Administration, P.M.K.; Funding Acquisition, P.M.K. All authors have read and agreed to the published version of the manuscript.
Funding
This work was supported by the Marine Biodiversity Hub (MBH), a collaborative partnership supported through funding from the Australian Government’s National Environmental Science Program (NESP). The work was undertaken under NESP MBH Project A1. An earlier version of this work with different analyses appeared as a preprint [57].
Institutional Review Board Statement
All sampling adhered to permitting and ethical requirements and was undertaken under Northern Territory of Australia Fisheries Act Special Permit No. 2014-2015/S17/3364 (Approval date: 1 July 2015) and Charles Darwin University Animal Ethics Committee Project Application and Permit Approval A11041.
Data Availability Statement
The raw data supporting the conclusions of this article will be made available by the authors on request.
Acknowledgments
The authors thank Nic Bax, Ross Dwyer, Paul Hedge, Annabel Ozimec, Roanne Ramsey, and Thor Saunders for project support; Laura Simmons (Merlin Entertainments) for information on sharks housed at the Melbourne Aquarium; Michael Hammer (Museum and Art Gallery of the Northern Territory) for curatorial assistance; and all assistants who contributed to field work.
Conflicts of Interest
Author Jonathan J. Smart was employed by the company Smarter Fisheries Scientific Consulting, Townsville. The remaining authors declare that the research was conducted in the absence of any commercial or financial relationships that could be construed as a potential conflict of interest.
References
- Musick, J.A. Ecology and conservation of long-lived marine animals. Am. Fish. Soc. Symp. 1999, 23, 1–10. [Google Scholar] [CrossRef]
- Heupel, M.R.; Simpfendorfer, C.A. Science or slaughter: Need for lethal sampling of sharks. Conserv. Biol. 2010, 24, 1212–1218. [Google Scholar] [CrossRef] [PubMed]
- Smart, J.J.; White, W.T.; Baje, L.; Chin, A.; D’Alberto, B.M.; Grant, M.I.; Mukherji, S.; Simpfendorfer, C.A. Can multi-species shark longline fisheries be managed sustainably using size limits? Theoretically, yes. Realistically, no. J. Appl. Ecol. 2020, 57, 1847–1860. [Google Scholar] [CrossRef]
- Smith, S.E.; Au, D.W.; Show, C. Intrinsic rebound potential of 26 species of Pacific sharks. Mar. Freshw. Res. 1998, 49, 663–678. [Google Scholar] [CrossRef]
- Patterson, T.A.; Hillary, R.M.; Kyne, P.M.; Pillans, R.D.; Gunasekera, R.M.; Marthick, J.R.; Johnson, G.J.; Feutry, P. Rapid assessment of adult abundance and demographic connectivity from juvenile kin pairs in a critically endangered species. Sci. Adv. 2022, 8, eadd1679. [Google Scholar] [CrossRef]
- International Union for the Conservation of Nature (IUCN) Standards and Petitions Committee. Guidelines for Using the IUCN Red List Categories and Criteria; Version 14. Prepared by the Standards and Petitions Committee; IUCN: Gland, Switzerland; Cambridge, UK, 2019. [Google Scholar]
- International Union for the Conservation of Nature (IUCN). The IUCN Red List of Threatened Species; Version 2025-2; International Union for the Conservation of Nature (IUCN): Gland, Switzerland, 2025; Available online: https://www.iucnredlist.org (accessed on 10 December 2025).
- Grant, M.I.; Kyne, P.M.; Simpfendorfer, C.A.; White, W.T.; Chin, A. Categorising use patterns of non-marine environments by elasmobranchs and a review of their extinction risk. Rev. Fish Biol. Fish. 2019, 29, 689–710. [Google Scholar] [CrossRef]
- Feutry, P.; Devloo-Delva, F.; Y, A.T.L.; Mona, S.; Gunasekera, R.M.; Johnson, G.; Pillans, R.D.; Jaccoud, D.; Kilian, A.; Morgan, D.L.; et al. One panel to rule them all: DArTcap genotyping for population structure, historical demography, and kinship analyses, and its application to a threatened shark. Mol. Ecol. Resour. 2020, 20, 1470–1485. [Google Scholar] [CrossRef]
- Field, I.C.; Tillet, B.J.; Charters, R.; Johnson, G.J.; Bukworth, R.C.; Meekan, M.G.; Bradshaw, C.J.A. Distribution, relative abundance and risks from fisheries to threatened Glyphis sharks and sawfishes in northern Australia. Endanger. Species Res. 2013, 21, 171–180. [Google Scholar] [CrossRef]
- Feutry, P.; Berry, O.; Kyne, P.M.; Pillans, R.D.; Hillary, R.M.; Grewe, P.M.; Marthick, J.R.; Johnson, G.; Gunasekera, R.M.; Bax, N.J.; et al. Inferring contemporary and historical genetic connectivity from juveniles. Mol. Ecol. 2017, 26, 444–456. [Google Scholar] [CrossRef]
- Constance, J.M.; Garcia, E.A.; Pillans, R.D.; Udyawer, V.; Kyne, P.M. A review of the life history and ecology of euryhaline and estuarine sharks and rays. Rev. Fish Biol. Fish. 2024, 34, 65–89. [Google Scholar] [CrossRef]
- Pillans, R.D.; Stevens, J.D.; Kyne, P.M.; Salini, J. Observations on the distribution, biology, short-term movements and habitat requirements of river sharks Glyphis spp. in northern Australia. Endanger. Species Res. 2009, 10, 321–332. [Google Scholar] [CrossRef]
- White, W.T.; A Appleyard, S.; Sabub, B.; Kyne, P.M.; Harris, M.; Lis, R.; Baje, L.; Usu, T.; Smart, J.J.; Corrigan, S.; et al. Rediscovery of the threatened river sharks, Glyphis garricki and, G. glyphis, in Papua New Guinea. PLoS ONE 2015, 10, e0140075. [Google Scholar] [CrossRef] [PubMed]
- Department of Climate Change, Energy, the Environment and Water (DCCEEW). Species Profile and Threats Database: EPBC Act List of Threatened Fauna; Department of Climate Change, Energy, the Environment and Water (DCCEEW): Canberra, ACT, Australia, 2024. Available online: https://www.environment.gov.au/cgi-bin/sprat/public/publicthreatenedlist.pl?wanted=fauna (accessed on 18 November 2024).
- Department of Climate Change, Energy, the Environment and Water (DCCEEW). Application for a Wildlife Trade Operation (WTO): Barramundi (Lates calcarifer) and Associated By-Product Species, Northern Territory Barramundi Fishery; Department of Climate Change, Energy, the Environment and Water (DCCEEW): Canberra, ACT, Australia, 2023. Available online: https://www.dcceew.gov.au/sites/default/files/documents/nt-barramundi-wto-application-supporting-documentation.pdf (accessed on 19 November 2024).
- Petheram, C.; Chilcott, C.; Watson, I.; Bruce, C. (Eds.) Water Resource Assessment for the Darwin Catchments; A Report to the Australian Government from the CSIRO Northern Australia Water Resource Assessment, part of the National Water Infrastructure Development Fund: Water Resource Assessments; CSIRO: Clayton, VIC, Australia, 2018.
- Thorson, J.T.; Simpfendorfer, C.A. Gear selectivity and sample size effects on growth curve selection in shark age and growth studies. Fish. Res. 2009, 98, 75–84. [Google Scholar] [CrossRef]
- Smart, J.J.; Harry, A.V.; Tobin, A.J.; Simpfendorfer, C.A. Overcoming the constraints of low sample sizes to produce age and growth data for rare or threatened sharks. Aquat. Conserv. Mar. Freshw. Ecosyst. 2013, 23, 124–134. [Google Scholar] [CrossRef]
- Ricker, W.E. Back calculation of fish lengths based on proportionality between scale and length increments. Can. J. Fish. Aquat. Sci. 1992, 49, 1018–1026. [Google Scholar] [CrossRef]
- Awruch, C.A.; Frusher, S.D.; Pankhurst, N.W.; Stevens, J.D. Non-lethal assessment of reproductive characteristics for management and conservation of sharks. Mar. Ecol. Prog. Ser. 2008, 355, 277–285. [Google Scholar] [CrossRef]
- Cailliet, G.M.; Goldman, K.J. Age determination and validation in chondrichthyan fishes. In Biology of Sharks and their Relatives; Musick, J., Carrier, J.C., Heithaus, M.R., Eds.; CRC Press: Boca Raton, FL, USA, 2004; pp. 399–447. [Google Scholar]
- Campana, S.E.; Annand, M.C.; McMillan, J.I. Graphical and statistical methods for determining the consistency of age determinations. Trans. Am. Fish. Soc. 1995, 124, 131–138. [Google Scholar] [CrossRef]
- Bowker, A.H. A test for symmetry in contingency tables. J. Am. Stat. Assoc. 1948, 43, 572–574. [Google Scholar] [CrossRef]
- Evans, G.T.; Hoenig, J.M. Testing and viewing symmetry in contingency tables, with application to readers of fish ages. Biometrics 1998, 54, 620–629. [Google Scholar] [CrossRef]
- Chang, W.Y.B. A statistical method for evaluating the reproducibility of age determination. Can. J. Fish. Aquat. Sci. 1982, 39, 1208–1210. [Google Scholar] [CrossRef]
- Francis, R.I.C.C. Back calculation of fish length—A critical review. J. Fish Biol. 1990, 36, 883–902. [Google Scholar] [CrossRef]
- Carlander, K.D. Handbook of Freshwater Fishery Biology; Iowa University Press: Ames, IA, USA, 1969. [Google Scholar]
- Smart, J.J.; Chin, A.; Tobin, A.J.; Simpfendorfer, C.A. Multimodel approaches in shark and ray growth studies: Strengths, weaknesses and the future. Fish Fish. 2016, 17, 955–971. [Google Scholar] [CrossRef]
- Von Bertalanffy, L. A quantitative theory of organic growth (inquires on growth laws. II). Hum. Biol. 1938, 10, 181–213. [Google Scholar]
- Ricker, W.E. Computation and interpretation of biological statistics of fish populations. Bull. Fish. Res. Board Can. 1975, 191, 1–382. [Google Scholar]
- Ricker, W.E. Growth rates and models. In Fish Physiology, III, Bioenergetics and Growth; Hoar, W.S., Randall, D.J., Brett, J.R., Eds.; Academic Press: New York, NY, USA, 1979; pp. 677–743. [Google Scholar]
- Cailliet, G.M.; Smith, W.D.; Mollet, H.F.; Goldman, K.J. Age and growth studies of chondrichthyan fishes: The need for consistency in terminology, verification, validation, and growth function fitting. Environ. Biol. Fishes 2006, 77, 211–228. [Google Scholar] [CrossRef]
- Smart, J.J.; Grammer, G.L. Modernising fish and shark growth curves with Bayesian length-at-age models. PLoS ONE 2021, 16, e0246734. [Google Scholar] [CrossRef] [PubMed]
- Smart, J. BayesGrowth: Estimate Fish Growth Using MCMC Analysis, R package version 0.3.0; R Foundation for Statistical Computing: Vienna, Austria, 2020. Available online: https://github.com/jonathansmart/BayesGrowth (accessed on 1 December 2024).
- Stan Development Team. RStan: The R Interface to Stan, R package version 2.21.2; R Foundation for Statistical Computing: Vienna, Austria, 2024. Available online: http://mc-stan.org/ (accessed on 1 December 2024).
- Gabry, J.; Mahr, T. Bayesplot: Plotting for Bayesian Models, R package version 1.7.2; R Foundation for Statistical Computing: Vienna, Austria, 2024. Available online: https://mc-stan.org/bayesplot (accessed on 1 December 2024).
- Vehtari, A.; Gabry, J.; Magnusson, M.; Yao, Y.; Bürkner, P.-C.; Paananen, T.; Gelman, A. Loo: Efficient Leave-One-Out Cross-Validation and WAIC for Bayesian Models, R package version 2.3.1; R Foundation for Statistical Computing: Vienna, Austria, 2024. Available online: https://mc-stan.org/loo (accessed on 1 December 2024).
- Vehtari, A.; Gelman, A.; Gabry, J. Practical Bayesian model evaluation using leave-one-out cross-validation and WAIC. Stat. Comput. 2017, 27, 1413–1432. [Google Scholar] [CrossRef]
- Harry, A.V.; Smart, J.J.; Pardo, S.A. Understanding the age and growth of chondrichthyan fishes. In Biology of Sharks and Their Relatives, 3rd ed.; Carrier, J.C., Simpfendorfer, C.A., Heithaus, M.R., Yopak, K.E., Eds.; CRC Press: Boca Raton, FL, USA, 2022; pp. 177–202. [Google Scholar]
- Awruch, C.A.; Bell, J.D.; Semmens, J.M.; Lyle, J.M. Life history traits and conservation actions for the Maugean skate (Zearaja maugeana), an endangered species occupying an anthropogenically impacted estuary. Aquat. Conserv. Mar. Freshw. Ecosyst. 2021, 31, 2178–2192. [Google Scholar] [CrossRef]
- Harry, A.V. Evidence for systematic age underestimation in shark and ray ageing studies. Fish Fish. 2018, 19, 185–200. [Google Scholar] [CrossRef]
- Natanson, L.J.; Skomal, G.B.; Hoffman, S.L.; Porter, M.E.; Goldman, K.J.; Serra, D. Age and growth of sharks: Do vertebral band pairs record age? Mar. Freshw. Res. 2018, 69, 1440–1452. [Google Scholar] [CrossRef]
- Geraghty, P.T.; Macbeth, W.G.; Harry, A.V.; Bell, J.E.; Yerman, M.N.; Williamson, J.E. Age and growth parameters for three heavily exploited shark species off temperate eastern Australia. ICES J. Mar. Sci. 2014, 71, 559–573. [Google Scholar] [CrossRef]
- Harry, A.V.; Tobin, A.J.; Simpfendorfer, C.A. Age, growth and reproductive biology of the spot-tail shark, Carcharhinus sorrah, and the Australian blacktip shark, C. tilstoni, from the Great Barrier Reef World Heritage Area, north-eastern Australia. Mar. Freshwater Res. 2013, 64, 277–293. [Google Scholar] [CrossRef]
- Lee, R.M. An investigation into the methods of growth determination in fishes by means of scales. J. Du Conseil. 1992, 1, 3–34. [Google Scholar]
- Kraak, S.B.M.; Haase, S.; Minto, C.; Santos, J. The Rosa Lee phenomenon and its consequences for fisheries advice on changes in fishing mortality or gear selectivity. ICES J. Mar. Sci. 2019, 76, 2179–2192. [Google Scholar] [CrossRef]
- Campbell, M.J.; Rigby, C.L. A re-examination of the growth of the gummy shark (Mustelus antarcticus) from Queensland, Australia. Mar. Freshw. Res. 2022, 73, 1399–1403. [Google Scholar] [CrossRef]
- Emmons, S.M.; D’Alberto, B.M.; Smart, J.J.; Simpfendorfer, C.A. Age and growth of tiger shark (Galeocerdo cuvier) from Western Australia. Mar. Freshw. Res. 2021, 72, 950–963. [Google Scholar] [CrossRef]
- Wong, D.; Smart, J.J.; Barrow, J.; Cleeland, J.; Yates, P.; Ziegler, P.; Rizzari, J.R. Age, growth and maturity of Southern Ocean skates (Bathyraja spp.) from the Kerguelen Plateau. Polar Biol. 2022, 45, 1119–1130. [Google Scholar] [CrossRef]
- Jones, C.M. Fitting growth curves to retrospective size-at-age data. Fish. Res. 2000, 46, 123–129. [Google Scholar] [CrossRef]
- Vigliola, L.; Meekan, M.G. The back-calculation of fish growth from otoliths. In Tropical Fish Otoliths: Information for Assessment, Management and Ecology; Reviews: Methods and Technologies in Fish Biology and Fisheries; Green, B.S., Mapstone, B.D., Carlos, G., Begg, G.A., Eds.; Springer: Dordrecht, The Netherlands, 2009; Volume 11, pp. 174–211. [Google Scholar]
- Robbins, W.D. Abundance, Demography and Population Structure of the Grey Reef Shark (Carcharhinus amblyrhynchos) and the Whitetip Reef Shark (Triaenodon obesus) (fam. Carcharhinidae). Ph.D. Thesis, James Cook University, Townsville, QLD, Australia, 2006. [Google Scholar]
- Tillett, B.J.; Meekan, M.G.; Field, I.C.; Hua, Q.; Bradshaw, C.J.A. Similar life history traits in bull (Carcharhinus leucas) and pig-eye (C. amboinensis) sharks. Mar. Freshw. Res. 2011, 62, 850–860. [Google Scholar] [CrossRef]
- Boggio-Pasqua, A.; Bassos-Hull, K.; Aeberhard, W.H.; Hoopes, L.A.; Swider, D.A.; Wilkinson, K.A.; Dureuil, M. Whitespotted eagle ray (Aetobatus narinari) age and growth in wild (in situ) versus aquarium-housed (ex situ) individuals: Implications for conservation and management. Front. Mar. Sci. 2022, 9, 960822. [Google Scholar] [CrossRef]
- Kyne, P.M.; Davies, C.-L.; Devloo-Delva, F.; Johnson, G.; Amepou, Y.; Grant, M.I.; Green, A.; Gunasekara, R.M.; Harry, A.V.; Lemon, T.; et al. Molecular Analysis of Newly-Discovered Geographic Range of The Threatened River Shark Glyphis Glyphis Reveals Distinct Populations; Report to the National Environmental Science Program Marine Biodiversity Hub: Hobart, TAS, Australia; Charles Darwin University: Casuarina, NT, Australia, 2021. [Google Scholar]
- Kyne, P.M.; Smart, J.J.; Johnson, G. Extremely low sample size allows age and growth estimation in a rare and threatened shark. bioRxiv 2022. [Google Scholar] [CrossRef]
Disclaimer/Publisher’s Note: The statements, opinions and data contained in all publications are solely those of the individual author(s) and contributor(s) and not of MDPI and/or the editor(s). MDPI and/or the editor(s) disclaim responsibility for any injury to people or property resulting from any ideas, methods, instructions or products referred to in the content. |
© 2025 by the authors. Licensee MDPI, Basel, Switzerland. This article is an open access article distributed under the terms and conditions of the Creative Commons Attribution (CC BY) license.