Abstract
The global aquaculture sector faces mounting pressure to transition towards sustainable production, with innovation being a critical lever for change, especially among smallholder farmers who dominate the industry. This study examines the drivers of innovation in China’s freshwater aquaculture sector by constructing a multi-dimensional innovation index—encompassing infrastructure, machinery, inputs, environmental management, and production models—and analyzing survey data from 336 farmers. Our findings reveal that direct government funding is significantly associated with innovation, but its effect is narrow, primarily linked to machinery upgrades, and effective only in the developed eastern region. In contrast, indirect support through technical training shows a broader, stronger, and more consistent association with innovation across all types, with effects lagging by 1–2 years and yielding the highest returns in less-developed western China. Notably, farmers’ ex post evaluations of training are a stronger predictor of innovation than training frequency itself, underscoring the importance of quality and relevance. We further find that production scale and industrial organization are positively associated with innovation, with no evidence of an inverted U-shaped relationship, reflecting the sector’s small-scale structure. These results highlight the need for a differentiated policy approach: prioritizing high-quality, demand-driven training nationwide; targeting direct funding to where complementary capacities exist; and fostering cooperatives and scale-enhancing institutions to systematically strengthen the sector’s innovative capacity.
Keywords:
freshwater aquaculture; government support; innovation level; scale management; industrial organization Key Contribution:
(1) Constructing a multi-dimensional innovation indicator system for scattered farmers, moving beyond singular patent metrics. (2) Empirically comparing the distinct impacts and temporal effects of direct funding versus indirect support. (3) Revealing that farmers’ post-training evaluation outweighs the training itself, and finding no inverted U-shaped scale-innovation relationship. (4) Highlighting significant regional heterogeneity in policy effectiveness, offering targeted insights for China’s aquaculture transition.
1. Introduction
Global aquaculture, a critical source of animal protein and livelihoods, faces the pervasive challenge of transitioning from intensive production models towards greater sustainability and resilience [1,2]. This challenge is acute in Asia, which dominates global production, with countries like India, Vietnam, and Indonesia grappling with similar issues of environmental impact, disease management, and the need for smallholder innovation [3,4,5]. Within this context, China’s freshwater aquaculture sector, the world’s largest by output, exemplifies both the scale of opportunity and the urgency of this transition. Its long-standing, high-density practices have yielded significant economic benefits but are increasingly associated with severe environmental and food safety challenges [6,7,8]. Innovation is therefore widely recognized as the linchpin for achieving sustainable, high-quality development within the sector [9].
Governments are pivotal actors in facilitating such innovation transitions. Typically, they deploy two primary policy instruments: direct financial support (e.g., subsidies) and indirect capacity-building support (e.g., technical training and extension) [10,11]. The comparative effectiveness of these instruments, however, is a subject of ongoing debate in the international literature. Studies from various contexts show outcomes are highly contingent on local institutions, value chain structures, and the nature of the innovation itself [12,13,14]. For instance, while direct funding can alleviate financial constraints for asset acquisition [15], its impact on complex management or systemic innovations may be limited. Conversely, indirect support through training builds human capital, a factor consistently linked to technology adoption, yet its effectiveness can be hampered by issues of relevance and delivery quality [16,17]. The inherent characteristics of aquaculture—long production cycles, high biological risks, and its role in food security—further underscore why innovation cannot rely solely on market forces, necessitating strategic public intervention [18,19].
Despite a growing body of literature on agricultural innovation, significant gaps persist when examining smallholder aquaculture systems. First, research often prioritizes macro-level policy or the innovation activities of large firms and formal research institutions, inadvertently marginalizing the intrinsic innovative agency of decentralized smallholders [20,21]. Although valuable studies on smallholder adaptation exist in other Asian contexts (e.g., [22,23]), a systematic, multi-dimensional analysis of innovation behaviors among aquaculture smallholders remains underdeveloped. Second, the conceptualization and measurement of innovation are frequently narrow, equating it with formal R&D outputs like patents or singular technology adoptions [24]. This approach fails to capture the holistic, incremental, and often non-technological innovations—in input combinations, processes, environmental management, and business models—that are central to on-farm transformation [25]. This gap is evident across global smallholder studies, where composite indicators reflecting practical innovation are needed [26]. Finally, there is a notable lack of empirical studies that systematically dissect and compare the distinct mechanisms and conditional effects of direct funding versus indirect support in driving smallholder innovation, particularly within a single, robust analytical framework.
Positioned within this international discourse, the present study focuses on China to address these interconnected gaps. Based on the aforementioned challenges, this study aims to make three core contributions: First, it explicitly centers smallholder farmers as primary innovation agents and constructs a novel, multi-dimensional indicator system to assess their innovation levels, moving beyond restrictive patent-based metrics. Second, it empirically tests and compares the mechanisms and heterogeneous effects of direct government funding and indirect government support on these multi-faceted innovation outcomes. In doing so, it provides evidence from the world’s largest producer that can be directly contrasted with findings from other institutional settings. Finally, by integrating analysis of scale and industrial organization as key contextual drivers, the study offers nuanced, evidence-based insights for refining innovation policy mixes, contributing to both national policy debates and broader theoretical discussions on innovation systems in transitional economies. To achieve these aims, this study is guided by the following research questions:
- (1)
- How do direct government funding and indirect technical support differentially influence the multi-dimensional innovation behavior of smallholder aquaculture farmers in China?
- (2)
- What is the nature of the relationship between production scale and innovation, and is it moderated by government support?
- (3)
- How does the level of industrial organization relate to farmer innovation capacity?
The remainder of this paper is structured as follows: Section 2 develops the theoretical framework and research hypotheses. Section 3 describes the data, variable measurement, and empirical methodology. Section 4 presents the empirical results, including robustness checks and heterogeneity analysis. Section 5 contextualizes the findings against the existing literature and outlines policy implications and limitations. Section 6 concludes.
2. Theoretical Framework and Research Hypotheses
2.1. Conceptualizing and Measuring Innovation in Smallholder Aquaculture
Innovation within small-scale agricultural and aquaculture systems must be conceptualized broadly, moving beyond the narrow focus on patents and formal R&D that characterizes innovation in industrial contexts. Drawing on the “Agricultural Innovation Systems” (AISs) perspective, which emphasizes the interactions between diverse actors (farmers, researchers, extension services, policymakers) and institutions, innovation is understood as a process of creating, accessing, and applying knowledge to achieve new or improved products, processes, and forms of organization [12,27]. This view aligns with an expanded Schumpeterian understanding of innovation as new combinations implemented at the farm level [28]. For smallholder farmers, innovation is often incremental, practical, and embodied in the adoption and adaptation of practices that enhance productivity, sustainability, and resilience [26].
Based on this theoretical understanding and a synthesis of key challenges identified in the sustainable aquaculture transition literature [2], we conceptualize and measure farmer-level innovation through five complementary dimensions that capture its multifaceted nature:
- (1)
- Infrastructure Upgrading: Represented by the implementation of standard pond renovation. This reflects foundational, capital-intensive investments that enable higher-level innovations, linking to theories of physical capital accumulation as a precursor to technological change.
- (2)
- Machinery and Equipment Upgrading: Captured by the frequency of upgrades to automated equipment (e.g., feeders, aerators). This dimension captures process innovation aimed at saving labor and improving efficiency, a core focus of technology adoption literature [29].
- (3)
- Use of Innovative Inputs: Measured by the frequency of using non-traditional inputs like probiotics and Chinese herbal medicines. This represents product/input innovation aimed at reducing environmental and health risks, addressing a critical sustainability challenge.
- (4)
- Tailwater Treatment Technology Innovation: Indicated by the number of adopted treatment technologies (e.g., constructed wetlands). This reflects environmental innovation driven by regulatory pressures and sustainability norms, a growing area of focus in aquaculture research [30].
- (5)
- Aquaculture Model Innovation: Represented by the adoption of innovative systems (e.g., recirculating aquaculture systems (RASs); integrated rice-fish farming). This signifies a transformative shift in the production paradigm, embodying systemic innovation.
A comprehensive innovation index is constructed from these five dimensions using the entropy method, providing a holistic measure of a farmer’s innovation level that aligns with the broad conceptual framework outlined above.
2.2. Production Scale, Innovation, and the Moderating Role of Government Support
The relationship between production scale and innovation capability is a foundational element in the study of agricultural and industrial economics. Larger operations typically possess greater financial resources, risk-bearing capacity, and incentives to invest in new technologies and practices [31,32]. This suggests a positive relationship. However, theoretical and empirical evidence also suggests that beyond an optimal point, further scale expansion may lead to bureaucratic inefficiencies and diminishing returns to innovation efforts, resulting in an inverted U-shaped relationship [33], as illustrated by curve a in Figure 1. Based on this discussion, we propose the following hypotheses:
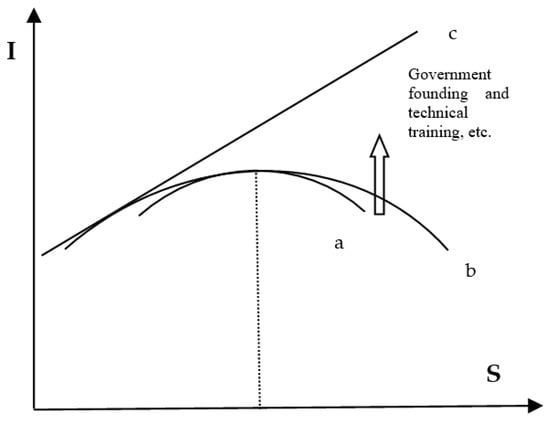
Figure 1.
Hypothesized Moderating Effects of Government Support on the Scale-Innovation Relationship (Note: Curve a illustrates an inverted U-shaped relationship between scale and innovation level. Curve b depicts an attenuated form of this inverted U-shaped relationship under conditions of government support, whereas Curve c demonstrates that with stronger government intervention, the inverted U-shaped relationship disappears entirely, transforming into a linear association between scale and innovation. This visual remains crucial for illustrating the theoretical moderation effects proposed in H5 and H6).
H1. Expanding the aquaculture scale is positively associated with the innovation level of farmers.
H2. The relationship between aquaculture scale and innovation level follows an inverted U-shape (i.e., innovation increases with scale at a diminishing rate and eventually declines).
Government intervention is theorized to be crucial for mitigating market failures and fostering innovation in sectors like aquaculture [8,18]. Building on the AIS perspective, government can act as a facilitator and regulator within the innovation system. We focus on two primary policy instruments and theorize their direct effects on innovation, as well as their potential moderating effects on the scale-innovation relationship depicted in Figure 1.
Direct Government Funding: Fiscal subsidies can relax financial constraints, enabling farmers to overcome the high fixed costs and perceived risks associated with innovation investments (e.g., new equipment, pond renovation) [10]. This aligns with theories of financial capital access as a key driver of technology adoption.
H3. Direct government funding is positively associated with farmer innovation.
Indirect Government Support (Technical Training): Support through training and extension builds human capital and improves farmers’ absorptive capacity—their ability to identify, understand, and apply new knowledge [13,14]. This is central to diffusion of innovations and knowledge-based theories of agricultural development.
H4. Indirect government support (technical training) is positively associated with farmer innovation.
Furthermore, both forms of support could theoretically alter the scale-innovation trajectory. For instance, direct funding could flatten the downward slope of an inverted U-curve (shifting path a to b) by alleviating financial inefficiencies at larger scales. Indirect support could achieve a similar effect by improving managerial efficiency (shifting path a to c). This leads to our moderation hypotheses:
H5. Direct government funding positively moderates the relationship between scale and innovation, such that it attenuates any potential negative effect of very large scales on innovation.
H6. Indirect government support positively moderates the relationship between scale and innovation, which is analogous to the effect of direct funding.
2.3. The Role of Industrial Organization as an Innovation Catalyst
Agricultural industrial organizations (e.g., cooperatives, “company + farmer” models) serve as vital intermediaries and key nodes within the innovation system [34]. Participation in such networks can reduce transaction costs, facilitate access to specialized information, premium markets, credit, and technical resources—elements which are often scarce for isolated smallholders [35]. From a theoretical standpoint, this aligns with social network and resource dependence theories, which posit that embeddedness in collaborative networks enhances an actor’s capacity to access and leverage external resources for innovation [36].
H7. A higher level of industrial organization (i.e., stronger linkages with cooperatives, leading enterprises) is positively associated with farmer innovation.
3. Data and Methodology
3.1. Data Source, Sample Characteristics, and Survey Instrument
The data for this study were derived from a questionnaire survey conducted in July 2023 under the auspices of the “National Technology System for Specialized Freshwater Fish”. This system, comprising leading research institutes and extension stations across China, provided an authoritative platform for accessing and surveying active aquaculture farmers [37]. The survey instrument was developed through a multi-stage process: first, a review of the literature on agricultural innovation and aquaculture practices; second, consultations with aquaculture economists and senior extension experts within the system; third, a pre-test with local extension agents to refine question clarity and relevance. This process was aimed at ensuring the content validity of the questionnaire for the Chinese aquaculture context.
The survey was administered to freshwater aquaculture farmers via local aquaculture technology extension stations across 16 provinces in China. A total of 500 questionnaires were distributed, with 337 returned. After removing one invalid sample due to severe data omissions, 336 valid samples were retained for analysis, yielding a valid response rate of 67.2%. The sample covers major production regions: 7 provinces in the eastern region, 5 in the central region, and 3 in the western region (see Table 1).

Table 1.
Regional Distribution of Survey Samples.
It is crucial to note that the sampling strategy was purposive, aiming to capture a diverse range of farming operations across major production zones rather than to construct a statistically representative sample of the national farmer population. Consequently, the sample size varies across provinces, and the data were not regionally weighted based on provincial farm populations. This design is suitable for investigating relationships between variables but limits the generalizability of descriptive statistics to the broader population. The primary analytical goal remains testing the hypothesized relationships within this varied sample [38].
3.2. Variable Definition and Measurement
3.2.1. Dependent Variable: Multidimensional Innovation
The dependent variable is farmers’ innovation level, measured through a Comprehensive Innovation Index derived from five specific practices, as detailed in the theoretical framework (Section 2.1). To construct this index, we first processed the raw data for each dimension. The data for all five indicators were standardized to eliminate unit differences. Subsequently, the entropy method was employed to objectively assign weights based on the informational content of each indicator. The steps are as follows:
- (1)
- Standardization: Positive indicators are standardized as: .
- (2)
- Calculation of Proportion: The proportion of farmer i for indicator j is: .
- (3)
- Calculation of Information Entropy: Entropy for indicator j is: , where .
- (4)
- Calculation of Differentiation Coefficient and Weight: The differentiation coefficient is . The weight for indicator j is: .
- (5)
- Composite Score: The comprehensive innovation index for farmer i is: .
3.2.2. Core Independent Variables
The core explanatory variables are categorized into four groups, measured as follows:
- (1)
- Production Scale: Primarily measured by the total aquaculture area (in mu). For robustness checks, aquaculture output (in 10,000 jin) and sales revenue (in CNY 10,000) are used as alternative scale proxies.
- (2)
- Direct Government Support: Represented by the total amount of government funding (in CNY 10,000) received by the farmer in the past three years. A binary variable indicating whether any funding was received is used in specific model specifications.
- (3)
- Indirect Government Support: Captured by multiple variables. Long-term Support is the total number of technical training sessions attended in the past two years. We also disaggregate Short-term Support into training from research institutes and from extension stations within the past year.
- (4)
- Industrial Organization Level: A count variable indicating the breadth of a farmer’s linkages with various entities, including family farms, cooperatives, leading enterprises, processing enterprises, and e-commerce platforms.
3.2.3. Control Variables
We include a set of control variables to account for farmer and operation characteristics that may influence innovation: the farmer’s education level (ordinal), years of aquaculture experience, and the number of staff with a college degree or above. Descriptive statistics are presented in Table 2.
Table 2.
Descriptive statistics of variables.
3.3. Empirical Strategy
3.3.1. OLS Regression for the Comprehensive Innovation Index
For the continuous “Comprehensive Innovation Index”, we use Ordinary Least Squares (OLSs). The baseline specification is:
where
- denotes the comprehensive innovation index for farmer
- is measured by the aquaculture area (in mu). For robustness, we also utilize aquaculture output and sales revenue as alternative scale proxies;
- represents the amount of government funding received;
- is captured by the frequency of long-term technical training;
- indicates the level of industrial organization;
- is a vector of control variables, including education level, years of experience, and the number of highly educated staff;
- is the idiosyncratic error term.
To test H2 (inverted U-shape), we add a quadratic scale term (). Moderation effects (H5, H6) are tested via interaction terms between support variables and the quadratic scale term ().
3.3.2. Count Data Models for Individual Innovation Indicators
For the four innovation indicators that are count data (Use of Innovative Inputs, Model Innovation, Machinery Upgrading, Tailwater Innovation), we utilize Poisson or Negative Binomial regression models. The choice between them depends on the distribution of the data [39]. The Poisson model is suitable when the conditional variance equals the conditional mean. Its basic form is:
where is both the mean and variance of the count for farmer .
- The Negative Binomial (Nbreg) model is preferred when over-dispersion (variance > mean) is present, which is tested via the significance of the over-dispersion parameter α;
- For variables with excess zeros (e.g., Aquaculture Model Innovation), we compared the Akaike (AIC) and Bayesian (BIC) information criteria of the Poisson and Zero-Inflated Poisson (ZIP) models to select the best fit, following the recommendation of Wilson, who demonstrates the limitations of the Vuong test for this purpose [40].
3.3.3. Logit Model for Binary Innovation Indicator
For the binary dependent variable, Infrastructure Upgrading, a Logistic regression model is employed. The model takes the form:
where is the probability that a farmer has undertaken infrastructure upgrading, β0 is the constant, and , , … are the coefficients for the explanatory variables , , ….
All models are estimated using Stata 15.0, with robust standard errors to account for potential heteroskedasticity.
4. Results
4.1. Determinants of the Comprehensive Innovation Level
We begin our analysis by examining the determinants of the comprehensive innovation index using OLS regression. The models were tested for multicollinearity (VIF scores were well below 10) and heteroskedasticity (robust standard errors are employed), confirming the validity of the estimates. The results are presented in Table 3.
Table 3.
OLS regression results: determinants of comprehensive innovation level.
Consistent with H1, production scale (aquaculture area) exhibits a statistically significant and positive effect on the innovation index across all specifications (p < 0.01). This confirms that larger-scale operations are associated with higher levels of innovation. The level of industrial organization also demonstrates a strong positive impact (p < 0.01), providing clear support for H7. This suggests that integration into networks with cooperatives and enterprises significantly enhances innovative capacity.
The impact of direct government funding reveals nuance. When included as a continuous variable, its coefficient is statistically insignificant. However, when using a binary indicator for whether any funding was received, it becomes positive and significant (β = 0.070, p < 0.05). This indicates that access to government funds, rather than the precise amount available, is the factor most strongly linked to stimulating innovation among farmers, offering conditional support for H3.
Regarding indirect support, long-term technical training (sessions attended in the past two years) shows a robust positive and significant effect (p < 0.01), leading us to accept H4. In contrast, short-term training frequencies from the past year show no significant impact, regardless of whether the training is provided by scientific research institutions or delivered by technology extension stations. This suggests that the knowledge and skills acquired require a gestation period of 1–2 years to be translated into innovative practices, a finding with important implications for policy evaluation cycles. Among control variables, the farmer’s formal education level is a consistently significant positive predictor.
4.2. Testing the Scale-Innovation Relationship and Moderating Effects
We now turn to H2, which postulated an inverted U-shaped relationship between scale and innovation. As shown in columns (1) to (3) of Table 4, the inclusion of quadratic terms for three scale proxies (area, output, revenue) yields insignificant coefficients. This pattern indicates that a non-linear, inverted U-shaped relationship is not statistically discernible within our sample, leading us to not find support for H2. The linear positive association (H1) appears to be the dominant pattern.
Table 4.
Testing for non-linear scale effects and government moderation.
4.3. Robustness Checks: Heterogeneous Effects Across Innovation Types
To verify the robustness of our findings and explore potential heterogeneity, we estimated separate models for each of the five innovation indicators. The full set of results is presented in Appendix A (Table A1). A synthesis of the key patterns follows.
The analysis reveals distinct effect patterns. Long-term indirect support demonstrates consistent, positive, and statistically significant associations across all five innovation types, reinforcing its role as a broad-based driver. In contrast, the association of direct government funding is highly specific, showing a significant positive link only with machinery upgrading. Its significant negative association with the use of innovative inputs could be consistent with a substitution effect, where funds allocated to equipment may crowd out investment in alternative inputs, though this interpretation warrants further investigation. Production scale is significantly associated with infrastructure upgrading and model innovation. Industrial organization level shows significant positive associations with infrastructure, model innovation, and tailwater treatment.
4.4. Heterogeneity Analysis: Regional Disparities
Given regional disparities in development, we estimated our main model separately for eastern, central, and western China (Table 5). The positive association of direct government funding with innovation is significant only in the eastern region. Its coefficient is insignificant in the central region and negative (though insignificant) in the west. Conversely, long-term indirect support has a significant positive association in both the east and west, with the coefficient magnitude being at its largest in the west.
Table 5.
Differences in the Impact on freshwater aquaculture innovation across eastern, central, and western regions.
4.5. The Critical Role of Training Perception and Feedback
To optimize the effectiveness of technical training, it is essential to understand not only its provision but also its reception by farmers. We extend our analysis to compare the effects of the actual frequency of training, farmers’ willingness to participate, and their ex post evaluations of the training’s usefulness (Table 6).
Table 6.
The role of training perception: frequency, willingness, and evaluation.
A striking pattern emerges. While actual training frequency remains a significant predictor, the farmer’s ex post evaluation of the training’s usefulness emerges as the strongest and most significant driver of innovation, with a larger coefficient magnitude. In contrast, the mere willingness to participate in more training has no significant effect.
This finding underscores a crucial principle: the perceived quality and relevance of knowledge transfer are more important than the quantity of training sessions or even initial interest. A high post-training evaluation likely indicates that the acquired knowledge was applicable and successfully integrated into practice. The insignificance of participation willingness could reflect skepticism based on past experiences with low-quality programs. This evidence suggests that the policy challenge may be less about increasing training opportunities and more about enhancing their quality and practical relevance.
5. Discussion
5.1. Interpretation of Key Findings and Comparative Perspectives
This study provides a nuanced, empirically grounded understanding of how government policies and contextual factors are associated with innovation among smallholder aquaculture farmers in China. Our analysis yields several key insights that extend the existing literature, both within China and internationally.
First, our finding that the access to direct government funding, rather than the precise amount, shows a stronger association with innovation offers an important nuance to the literature on fiscal subsidies in developing agriculture. This resonates with studies suggesting that for risk-averse smallholders, subsidies often serve as a crucial risk-mitigation signal or a means to overcome fixed cost thresholds, rather than a purely marginal investment incentive [41,42]. However, the highly circumscribed impact of this funding—largely confined to machinery upgrades and only significant in the developed eastern region—contrasts with studies from other contexts where subsidies have spurred broader technological adoption [14]. This suggests that the effectiveness of direct grants is heavily contingent on complementary factors such as market infrastructure, technical support, and farmer capacity, which may be underdeveloped in central and western regions [13].
Second, the robust, broad-based, and lagged association of long-term technical training with innovation underscores the fundamental role of human capital. This strongly aligns with the core tenets of agricultural extension and technology adoption literature, which emphasize knowledge and skills as critical for sustainable change [43,44]. The pronounced effectiveness of training in the western region, where direct funding fails, invites a comparative perspective with research on building resilience in vulnerable aquaculture communities, such as those recovering from climate shocks or disease outbreaks in Southeast Asia [45,46]. In such contexts, knowledge transfer and capacity building are frequently identified as more sustainable levers for improvement than one-time financial injections. Furthermore, our novel finding that farmers’ ex post evaluations of training are a stronger predictor than mere participation frequency underscores a principle echoed in studies on effective extension: perceived relevance and utility are paramount for learning and behavioral change [47].
Third, the confirmed positive yet linear relationship between scale and innovation, with no evidence of an inverted U-shape, presents a noteworthy divergence from patterns often observed in industrial sectors and some mature agricultural industries [33]. This likely reflects the distinctive structure of China’s freshwater aquaculture, which remains dominated by small- and medium-scale operations far from the scale where diseconomies might set in. Our finding thus corroborates and provides empirical grounds for the argument within development economics that in fragmented smallholder sectors, consolidation and scaling up can still yield significant innovation dividends [48].
Finally, the significant role of industrial organization level aligns with a growing body of literature on innovation systems and collaborative networks in agriculture [12,27]. It confirms that for smallholders, integration into cooperatives or value chains with leading enterprises is not merely a market strategy but a vital mechanism for accessing bundled resources—information, technology, credit, and market access—that fuel innovative capabilities. This finding from China’s aquaculture sector reinforces similar observations from studies on smallholder innovation in other commodity chains and countries [49].
5.2. Policy Implications
Derived from the above interpretation, our study yields targeted policy implications that blend instrumental guidance with systemic considerations:
- Implement Differentiated and Sequenced Funding Strategies. Direct subsidies should be strategically focused and regionally tailored. They can effectively catalyze basic asset upgrading (e.g., machinery) but should be gradually coupled with or transitioned towards mechanisms that incentivize more complex innovations (e.g., performance-based grants for model transformation or tailwater treatment), particularly in the eastern region. In central and western regions, where the efficacy of pure cash transfers is low, policies should prioritize building the preconditions (e.g., through training and organizational development) for future financial interventions to be effective.
- Prioritize High-Quality, Demand-Driven Capacity Building. Policy must treat technical training as a long-term strategic investment in human capital. Programs must be co-designed with farmers, incorporate their feedback loops, and focus demonstrably on relevance and practical utility to generate high perceived value and, consequently, greater impact. The western region, showing the highest potential marginal returns, should be a priority for such intensive, high-quality training initiatives.
- Foster Scale and Organization through Institutional Innovation. Policies should facilitate responsible land transfer and the development of diverse, farmer-centric cooperative models to enable economies of scale. Concurrently, creating an enabling environment for the growth of and participation in robust industrial organizations is crucial. These organizations act as indispensable intermediaries for disseminating innovation and integrating smallholders into modern value chains.
5.3. Limitations and Future Research
This study has limitations that chart clear paths for future inquiry. First, the cross-sectional design limits causal inference. Future research employing longitudinal or panel data could more robustly establish temporal precedence and causal relationships, tracking how innovation evolves with policy interventions over time. Second, while our multi-dimensional index is a step forward, innovation metrics based on self-reported adoption have inherent limitations. Complementary qualitative research or studies incorporating more objective biophysical or economic outcome measures (e.g., actual pollution reduction, profit margins from new models) would deepen understanding of innovation impact. Third, our purposive sample, while diverse, is not nationally representative. Large-scale, stratified random surveys would allow for more precise estimation of population parameters and sub-group analyses. Finally, the international comparative perspective suggested by our findings remains to be fully explored. A promising avenue for future research is a deliberate comparative study applying a similar analytical framework across different institutional contexts (e.g., contrasting China’s state-led system with private-extension models in Vietnam or community-based co-management in Bangladesh) to systematically unpack how governance structures shape the efficacy of different innovation policy tools.
6. Conclusions
This study investigated the drivers of innovation among smallholder freshwater aquaculture farmers in China. By constructing a multi-dimensional innovation index, we move beyond a narrow view of technological adoption to capture the holistic nature of on-farm change.
Our findings offer both theoretical nuance and practical guidance. They demonstrate that government support instruments are not interchangeable: direct funding primarily facilitates asset upgrading, showing effectiveness only in developed regions, whereas indirect technical training builds human capital with broader applicability and high returns in less-developed areas. Furthermore, the linear relationship between scale and innovation suggests untapped potential for growth in this fragmented sector, and strong linkages with industrial organizations consistently emerge as a key catalyst for innovation.
These insights advocate for a sophisticated policy mix: prioritizing high-quality, demand-driven training nationwide; deploying targeted direct funding with attention to regional readiness; and fostering institutions that enable scale and collaboration. This research also provides a framework for future comparative studies across different governance models, advancing the global understanding of innovation in smallholder systems. Ultimately, fostering a sustainable transition in aquaculture requires recognizing and strategically supporting these diverse pathways to on-farm innovation.
Author Contributions
Conceptualization, Z.X.; methodology, Z.X. and P.Z.; software, P.Z.; validation, Z.X.; formal analysis, Z.X. and P.Z.; investigation, Z.X.; resources, Z.X.; data curation, Z.X.; writing—original draft preparation, Z.X.; writing—review and editing, Z.X.; visualization, Z.X.; supervision, Z.X.; project administration, Z.X.; funding acquisition, Z.X. All authors have read and agreed to the published version of the manuscript.
Funding
This research was funded by the special project of National Characteristic Freshwater Fish Industrial Technology System for construction of modern agricultural industrial technology system (CARS-46).
Institutional Review Board Statement
Not applicable.
Data Availability Statement
The data analyzed in this study are available from the corresponding author upon reasonable request.
Conflicts of Interest
The authors declare no conflicts of interest.
Appendix A
Table A1.
Robustness checks: regression results for disaggregated innovation indicators.
Table A1.
Robustness checks: regression results for disaggregated innovation indicators.
| Variable | Infrastructure Upgrading | Use of Innov. Drugs | Aquac. Model Innov. | Mach. and Equip. Upgrading | Tailwater Treat. Innov. |
|---|---|---|---|---|---|
| (Logit) | (Nbreg) | (Possion) | (Possion) | (Possion) | |
| Aquaculture Area | 0.252 *** | 0.0534 | 0.101 ** | 0.0294 | 0.0207 |
| (0.0842) | (0.0535) | (0.0418) | (0.0225) | (0.0324) | |
| Long-term Indirect Support | 0.0988 * | 0.134 *** | 0.0655 ** | 0.0580 *** | 0.0609 *** |
| (0.0586) | (0.0396) | (0.0294) | (0.0155) | (0.0226) | |
| Direct Government Funding | 0.707 (0.504) | −0.557 * (0.301) | 0.297 (0.205) | 0.297 *** (0.111) | 0.159 (0.169) |
| Level of Industrial Organization | 0.256 * (0.137) | −0.00166 (0.0890) | 0.172 *** (0.0553) | 0.0267 (0.0330) | 0.107 ** (0.0461) |
| Over-dispersion Parameter | 0.680 *** (0.0813) | ||||
| Control Variables | Yes | Yes | Yes | Yes | Yes |
| Constant | −2.418 *** | 1.971 *** | −2.300 *** | 0.246 | −0.477 ** |
| (0.589) | (0.402) | (0.335) | (0.165) | (0.241) | |
| Observations | 336 | 336 | 336 | 336 | 336 |
Note: * p < 0.1, ** p < 0.05, *** p < 0.01.
References
- FAO. The State of World Fisheries and Aquaculture 2022; FAO: Rome, Italy, 2022. [Google Scholar]
- Naylor, R.L.; Hardy, R.W.; Buschmann, A.H.; Bush, S.R.; Cao, L.; Klinger, D.H.; Little, D.C.; Lubchenco, J.; Shumway, S.E.; Troell, M. A 20-year retrospective review of global aquaculture. Nature 2021, 591, 551–563. [Google Scholar] [CrossRef] [PubMed]
- Joffre, O.M.; Joffre, F.M.; Kura, K.L.; Sinh, P.S. Characteristics and Performance of Fisheries Co-Management in Asia; WorldFish: Penang, Malaysia, 2019. [Google Scholar]
- Kumar, G.; Engle, C.R. Technological advances that led to growth of shrimp, salmon, and tilapia farming. Rev. Fish. Sci. Aquac. 2016, 24, 136–152. [Google Scholar] [CrossRef]
- Suri, S.; Sharma, S. Institutional drivers of sustainable aquaculture innovations in India. Aquac. Econ. Manag. 2021, 26, 123–145. [Google Scholar]
- Zhang, W.B.; Ma, X.Z. China’s aquaculture development trends since 2000 and future directions. J. Shanghai Ocean. Univ. 2020, 29, 661–674. [Google Scholar]
- Liu, Y.F.; Zhang, H.; Kong, C.; Gu, R.; Xi, Y.; Yang, G.; Zhang, K.; Sheng, X. Pollution characteristics and risk assessment of pesticides and veterinary drugs in aquaculture environment. J. Agro-Environ. Sci. 2022, 41, 2055–2063. [Google Scholar]
- Jin, Y.; Zhou, J.H. Government Inspections, Supply Chain Traceability and Source Supervision of Aquatic Food Safety. Issues Agric. Econ. 2025, 09, 87–104. [Google Scholar]
- Zhang, H.P.; Qu, T.T. Innovation of agricultural modernization and agricultural family management mode. Economist 2014, 8, 83–89. [Google Scholar]
- Montoro-Sánchez, Á.; Úbeda-García, M. Public funding for product, process and organizational innovation. Serv. Ind. J. 2010, 30, 133–147. [Google Scholar]
- Fu, Z.Q.; Li, J.B.; Meng, Q.G. Thoughts on the new model of agricultural technology extension. Guangdong Agric. Sci. 2011, 22, 185–188. [Google Scholar]
- Spielman, D.J.; Ekboir, J.; Davis, K. The art and science of innovation systems inquiry. Technol. Soc. 2009, 31, 399–405. [Google Scholar] [CrossRef]
- Anderson, J.R.; Feder, G. Agricultural Extension: Good Intentions and Hard Realities. World Bank Res. Obs. 2004, 19, 41–60. [Google Scholar] [CrossRef]
- Ragasa, C.; Gina, C.; Madhur, G.; Paul, D. Effectiveness of agricultural extension delivery models. IFPRI Discuss. Pap. 2016, 01536. [Google Scholar] [CrossRef]
- Mankiw, N.G. Principles of Economics; Peking University Press: Beijing, China, 1999. [Google Scholar]
- Steven, J.; Venturelli, P.; Twardek, W.M.; Lennox, R.J.; Brownscombe, J.W.; Skov, C.; Hyder, K.; Suski, C.D.; Diggles, B.K.; Arlinghaus, R.; et al. Technological innovation in the recreational fishing sector. Rev. Fish Biol. Fish. 2021, 31, 253–288. [Google Scholar] [CrossRef]
- Zheng, Y.Y.; Luo, J.L. Research on factors influencing technological innovation in farmers’ cooperatives. Forum Sci. Technol. China 2020, 3, 148–156. [Google Scholar]
- Feng, W.L.; Cao, J.L. Pilot experience and suggestions of aquaculture insurance. Chin. Financ. 2025, 2, 54–55. [Google Scholar]
- Cheng, J.; Ye, W.; Luo, H.; Song, W.; Li, W. Current situation and SWOT analysis of the development of mussel industry in Shengsi. Chin. Fish. Econ. 2022, 40, 57–66. [Google Scholar]
- Li, Z. The Green Development of Agriculture in China: Innovation and Evolution. CABI Databases 2023, 2, 2–16. [Google Scholar]
- Liu, B.; Tang, C.; Zhou, G.; Yi, C. Evolution Characteristics of Rural Innovation Policy. Econ. Geogr. 2024, 44, 3. [Google Scholar]
- Belton, B.; Little, D.C.; Zhang, W.; Edwards, P. Farming fish in the sea: Not a cure for global poverty. Nature 2018, 560, 389–391. [Google Scholar]
- Dam Lam, R.; Danh, L.T.; Khiem, N.T.; Speelman, S. Adoption of integrated multi-trophic aquaculture in Vietnam. Aquac. Int. 2022, 30, 2031–2050. [Google Scholar]
- Bjerke, L.; Johansson, S. Innovation in agriculture: An analysis of Swedish firms. Food Policy 2022, 1, 22–69. [Google Scholar]
- Alston, J.M.; Pardey, P.G. The economics of agricultural innovation. In Handbook of Agricultural Economics; Elsevier: Amsterdam, The Netherlands, 2021; Volume 5, pp. 3895–3980. [Google Scholar]
- Barrett, C.B.; Benton, T.G.; Cooper, K.A.; Fanzo, J.; Gandhi, R.; Herrero, M.; James, S.; Kahn, M.; Mason-D’croz, D.; Mathys, A.; et al. Bundling innovations to transform agri-food systems. Nat. Sustain. 2022, 5, 974–976. [Google Scholar] [CrossRef]
- Klerkx, L.; van Mierlo, B.; Leeuwis, C. Evolution of systems approaches to agricultural innovation. In Farming Systems Research into the 21st Century; Springer: Dordrecht, The Netherlands, 2012; pp. 457–483. [Google Scholar]
- Schumpeter, J.A. The Theory of Economic Development; Harvard University Press: Cambridge, MA, USA, 1934. [Google Scholar]
- Feder, G.; Just, R.E.; Zilberman, D. Adoption of Agricultural Innovations in Developing Countries: A Survey. Econ. Dev. Cult. Change 1985, 33, 255–298. [Google Scholar] [CrossRef]
- Ahmed, N.; Thompson, S. The blue dimensions of aquaculture: A global synthesis. Sci. Total Environ. 2019, 652, 851–861. [Google Scholar] [CrossRef] [PubMed]
- Shrieves, R.E. Market structure and innovation: A new perspective. J. Ind. Econ. 1978, 26, 329–347. [Google Scholar] [CrossRef]
- Zhou, L.A.; Luo, K. Firm Size and Innovation: Evidence from China’s Province-level Data. China Econ. Q. 2005, 4, 623–638. [Google Scholar]
- Deconinck, K. New Evidence on Concentration in Seed Markets. Glob. Food Secur. 2019, 23, 135–138. [Google Scholar] [CrossRef]
- Wang, A.E.; Bao, Y.Z. Review of Agricultural Industrial Organization and Performance. J. Huazhong Agric. Univ. 2014, 4, 70–75. [Google Scholar]
- Ma, Y.H. The impact of farmers’ participation in agricultural industrial organizations. Feed Res. 2024, 47, 182–185. [Google Scholar]
- Granovetter, M. Economic Action and Social Structure: The Problem of Embeddedness. Am. J. Sociol. 1985, 91, 481–510. [Google Scholar] [CrossRef]
- Ministry of Agriculture and Rural Affairs, PRC. National Agricultural Technology System Construction Plan; China Agriculture Press: Beijing, China, 2007. [Google Scholar]
- Singleton, R.A.; Straits, B.C. Approaches to Social Research; Oxford University Press: New York, NY, USA, 2017. [Google Scholar]
- Zou, Z.-H.; Yun, Y.; Sun, J.-N. Entropy method for determination of weight of evaluating indicators. J. Environ. Sci. 2006, 18, 1020–1023. [Google Scholar] [CrossRef] [PubMed]
- Cameron, A.C.; Trivedi, P.K. Regression Analysis of Count Data; Cambridge University Press: Cambridge, UK, 2013. [Google Scholar]
- Pan, D.; Zhang, N. The role of agricultural training on fertilizer use knowledge. Ecol. Econ. 2018, 148, 77–91. [Google Scholar] [CrossRef]
- Duflo, E.; Kremer, M.; Robinson, J. Nudging Farmers to Use Fertilizer: Theory and Experimental Evidence from Kenya. Am. Econ. Rev. 2011, 101, 2350–2390. [Google Scholar] [CrossRef]
- Birkhaeuser, D.; Evenson, R.E.; Feder, G. The economic impact of agricultural extension: A review. Econ. Dev. Cult. Change 1991, 39, 607–650. [Google Scholar] [CrossRef]
- Rogers, E.M. Diffusion of Innovations; Free Press: New York, NY, USA, 2003. [Google Scholar]
- Joffre, O.M.; Klerkx, L.; Dickson, M.; Verdegem, M. How is innovation in aquaculture conceptualized and managed? Aquaculture 2017, 470, 129–148. [Google Scholar] [CrossRef]
- Béné, C.; Arthur, R.; Norbury, H.; Allison, E.H.; Beveridge, M.; Bush, S.; Campling, L.; Leschen, W.; Little, D.; Squires, D.; et al. Contribution of Fisheries and Aquaculture to Food Security and Poverty Reduction. World Dev. 2016, 79, 177–196. [Google Scholar] [CrossRef]
- Davis, K.E. Extension in sub-Saharan Africa: Overview and assessment. J. Int. Agric. Ext. Educ. 2008, 15, 15–28. [Google Scholar]
- Barrett, C.B.; Carter, M.R.; Timmer, C.P. A Century-Long Perspective on Agricultural Development. Am. J. Agric. Econ. 2010, 92, 447–468. [Google Scholar] [CrossRef]
- Bijman, J.; Hanisch, M. Support for Farmers’ Cooperatives; European Commission: Brussels, Belgium, 2012. [Google Scholar]
Disclaimer/Publisher’s Note: The statements, opinions and data contained in all publications are solely those of the individual author(s) and contributor(s) and not of MDPI and/or the editor(s). MDPI and/or the editor(s) disclaim responsibility for any injury to people or property resulting from any ideas, methods, instructions or products referred to in the content. |
© 2025 by the authors. Licensee MDPI, Basel, Switzerland. This article is an open access article distributed under the terms and conditions of the Creative Commons Attribution (CC BY) license.