
Effect of Stocking Density on Water Quality, Harmful Nitrogen Control, and Production Performance of Penaeus vannamei in Biofloc-Based Systems with Limited Water Exchange


Abstract
1. Introduction
2. Materials and Methods
2.1. Biofloc-Based Systems Preparation
2.2. Trial Design and Shrimp Stocking
2.3. Feeding and Aquaculture Management
2.4. Water Quality Monitoring and Analysis
2.5. Shrimp Production Performance Analysis
2.6. Statistical Analysis
3. Results
3.1. System Management Inputs and Water Quality
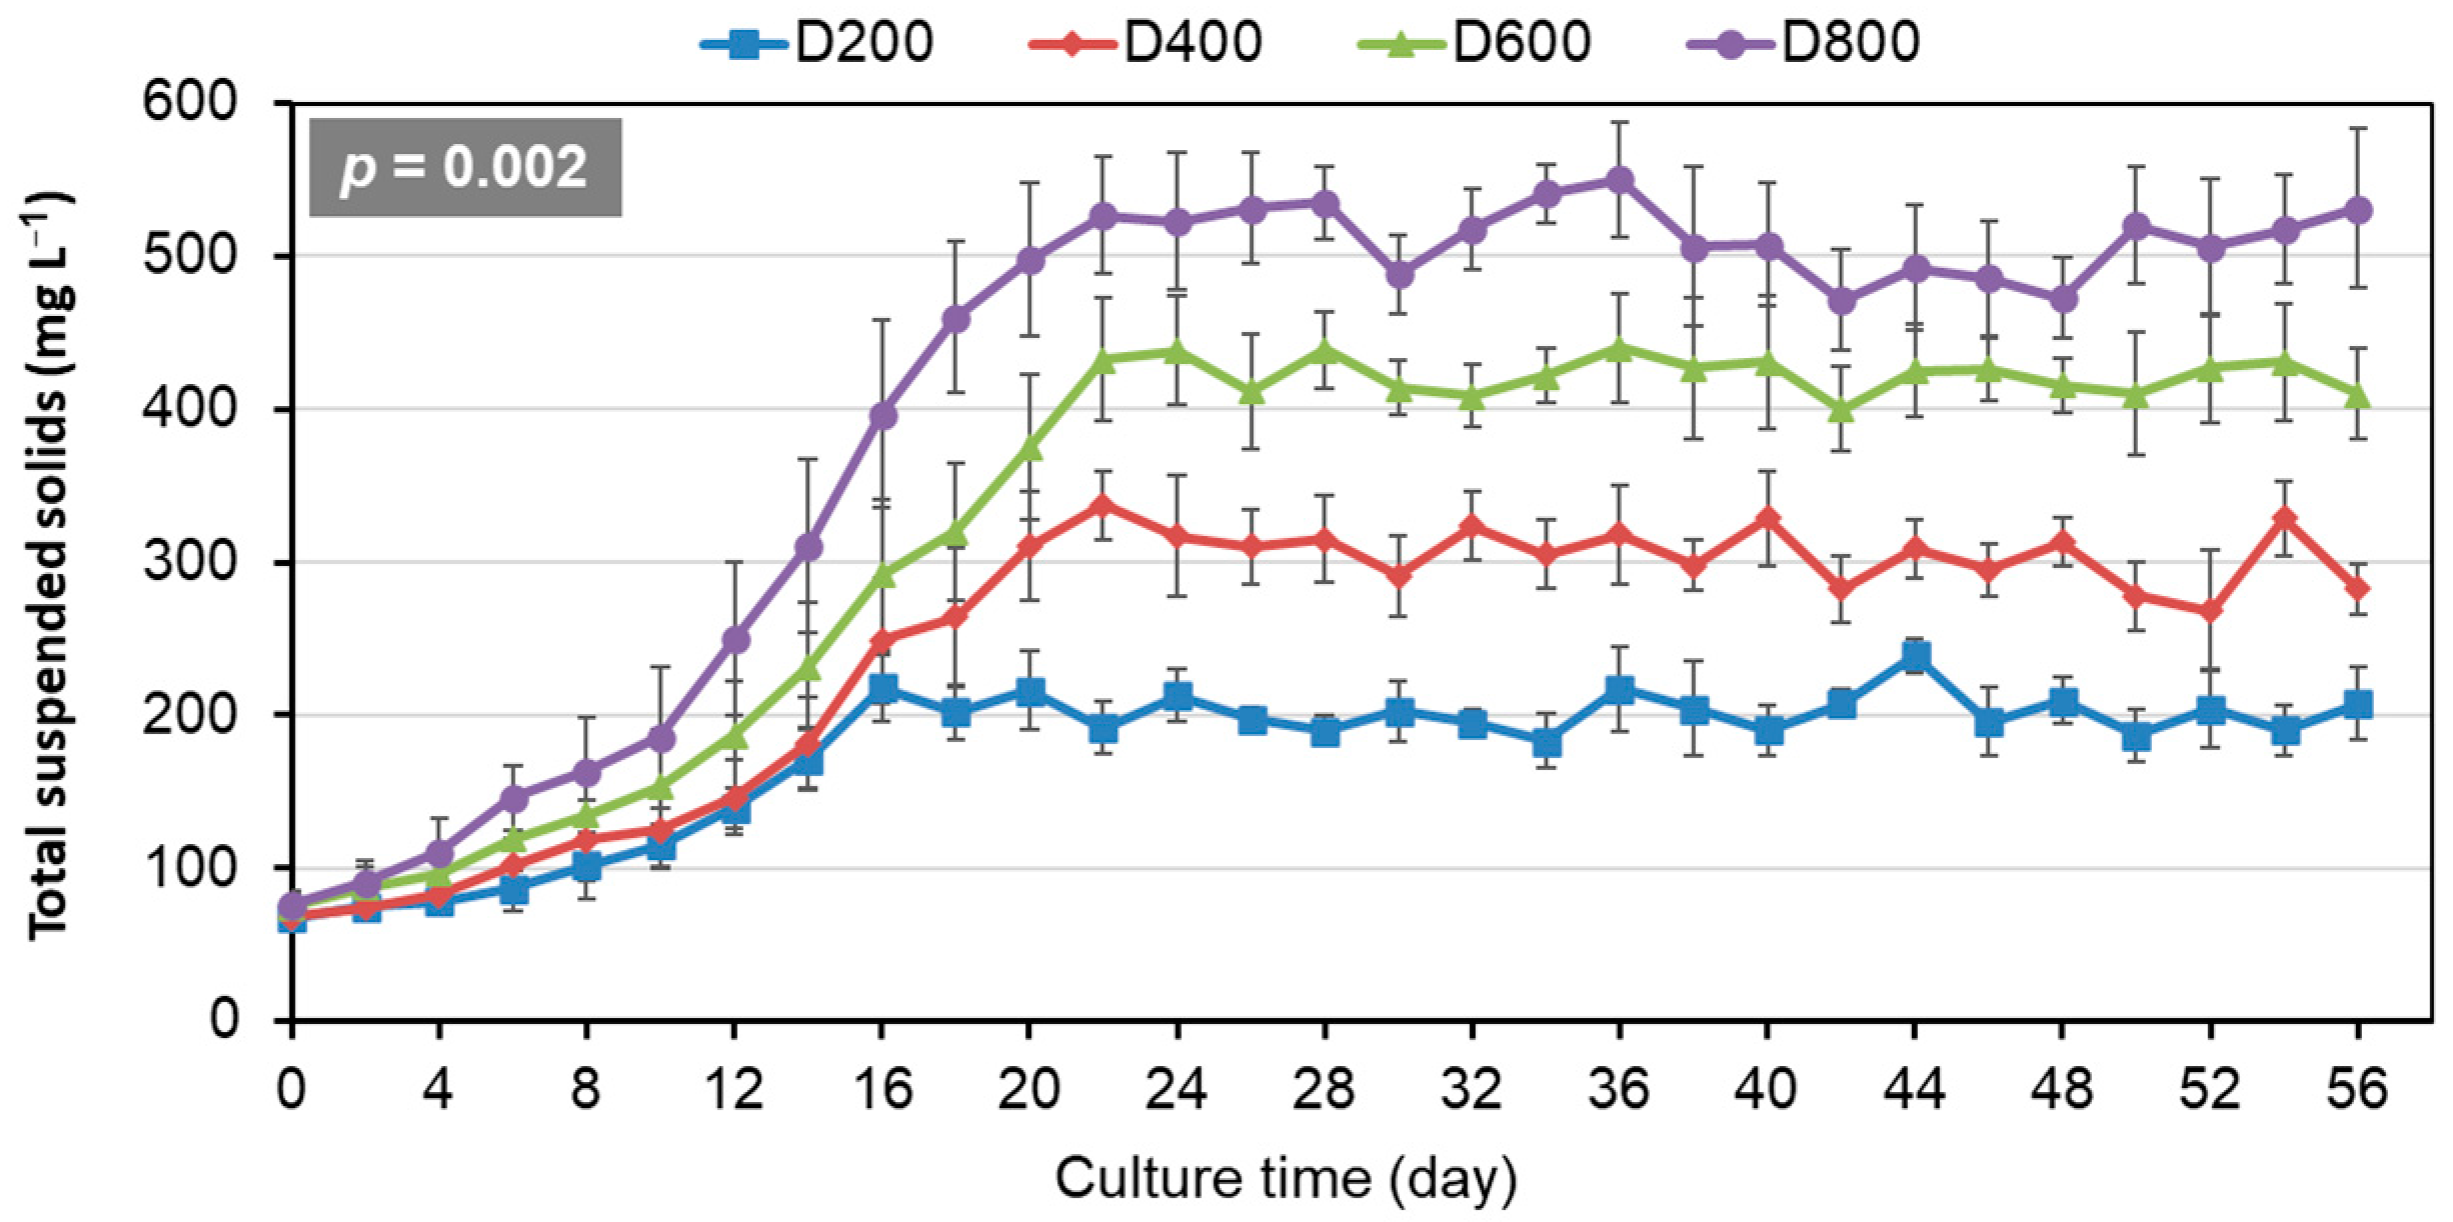
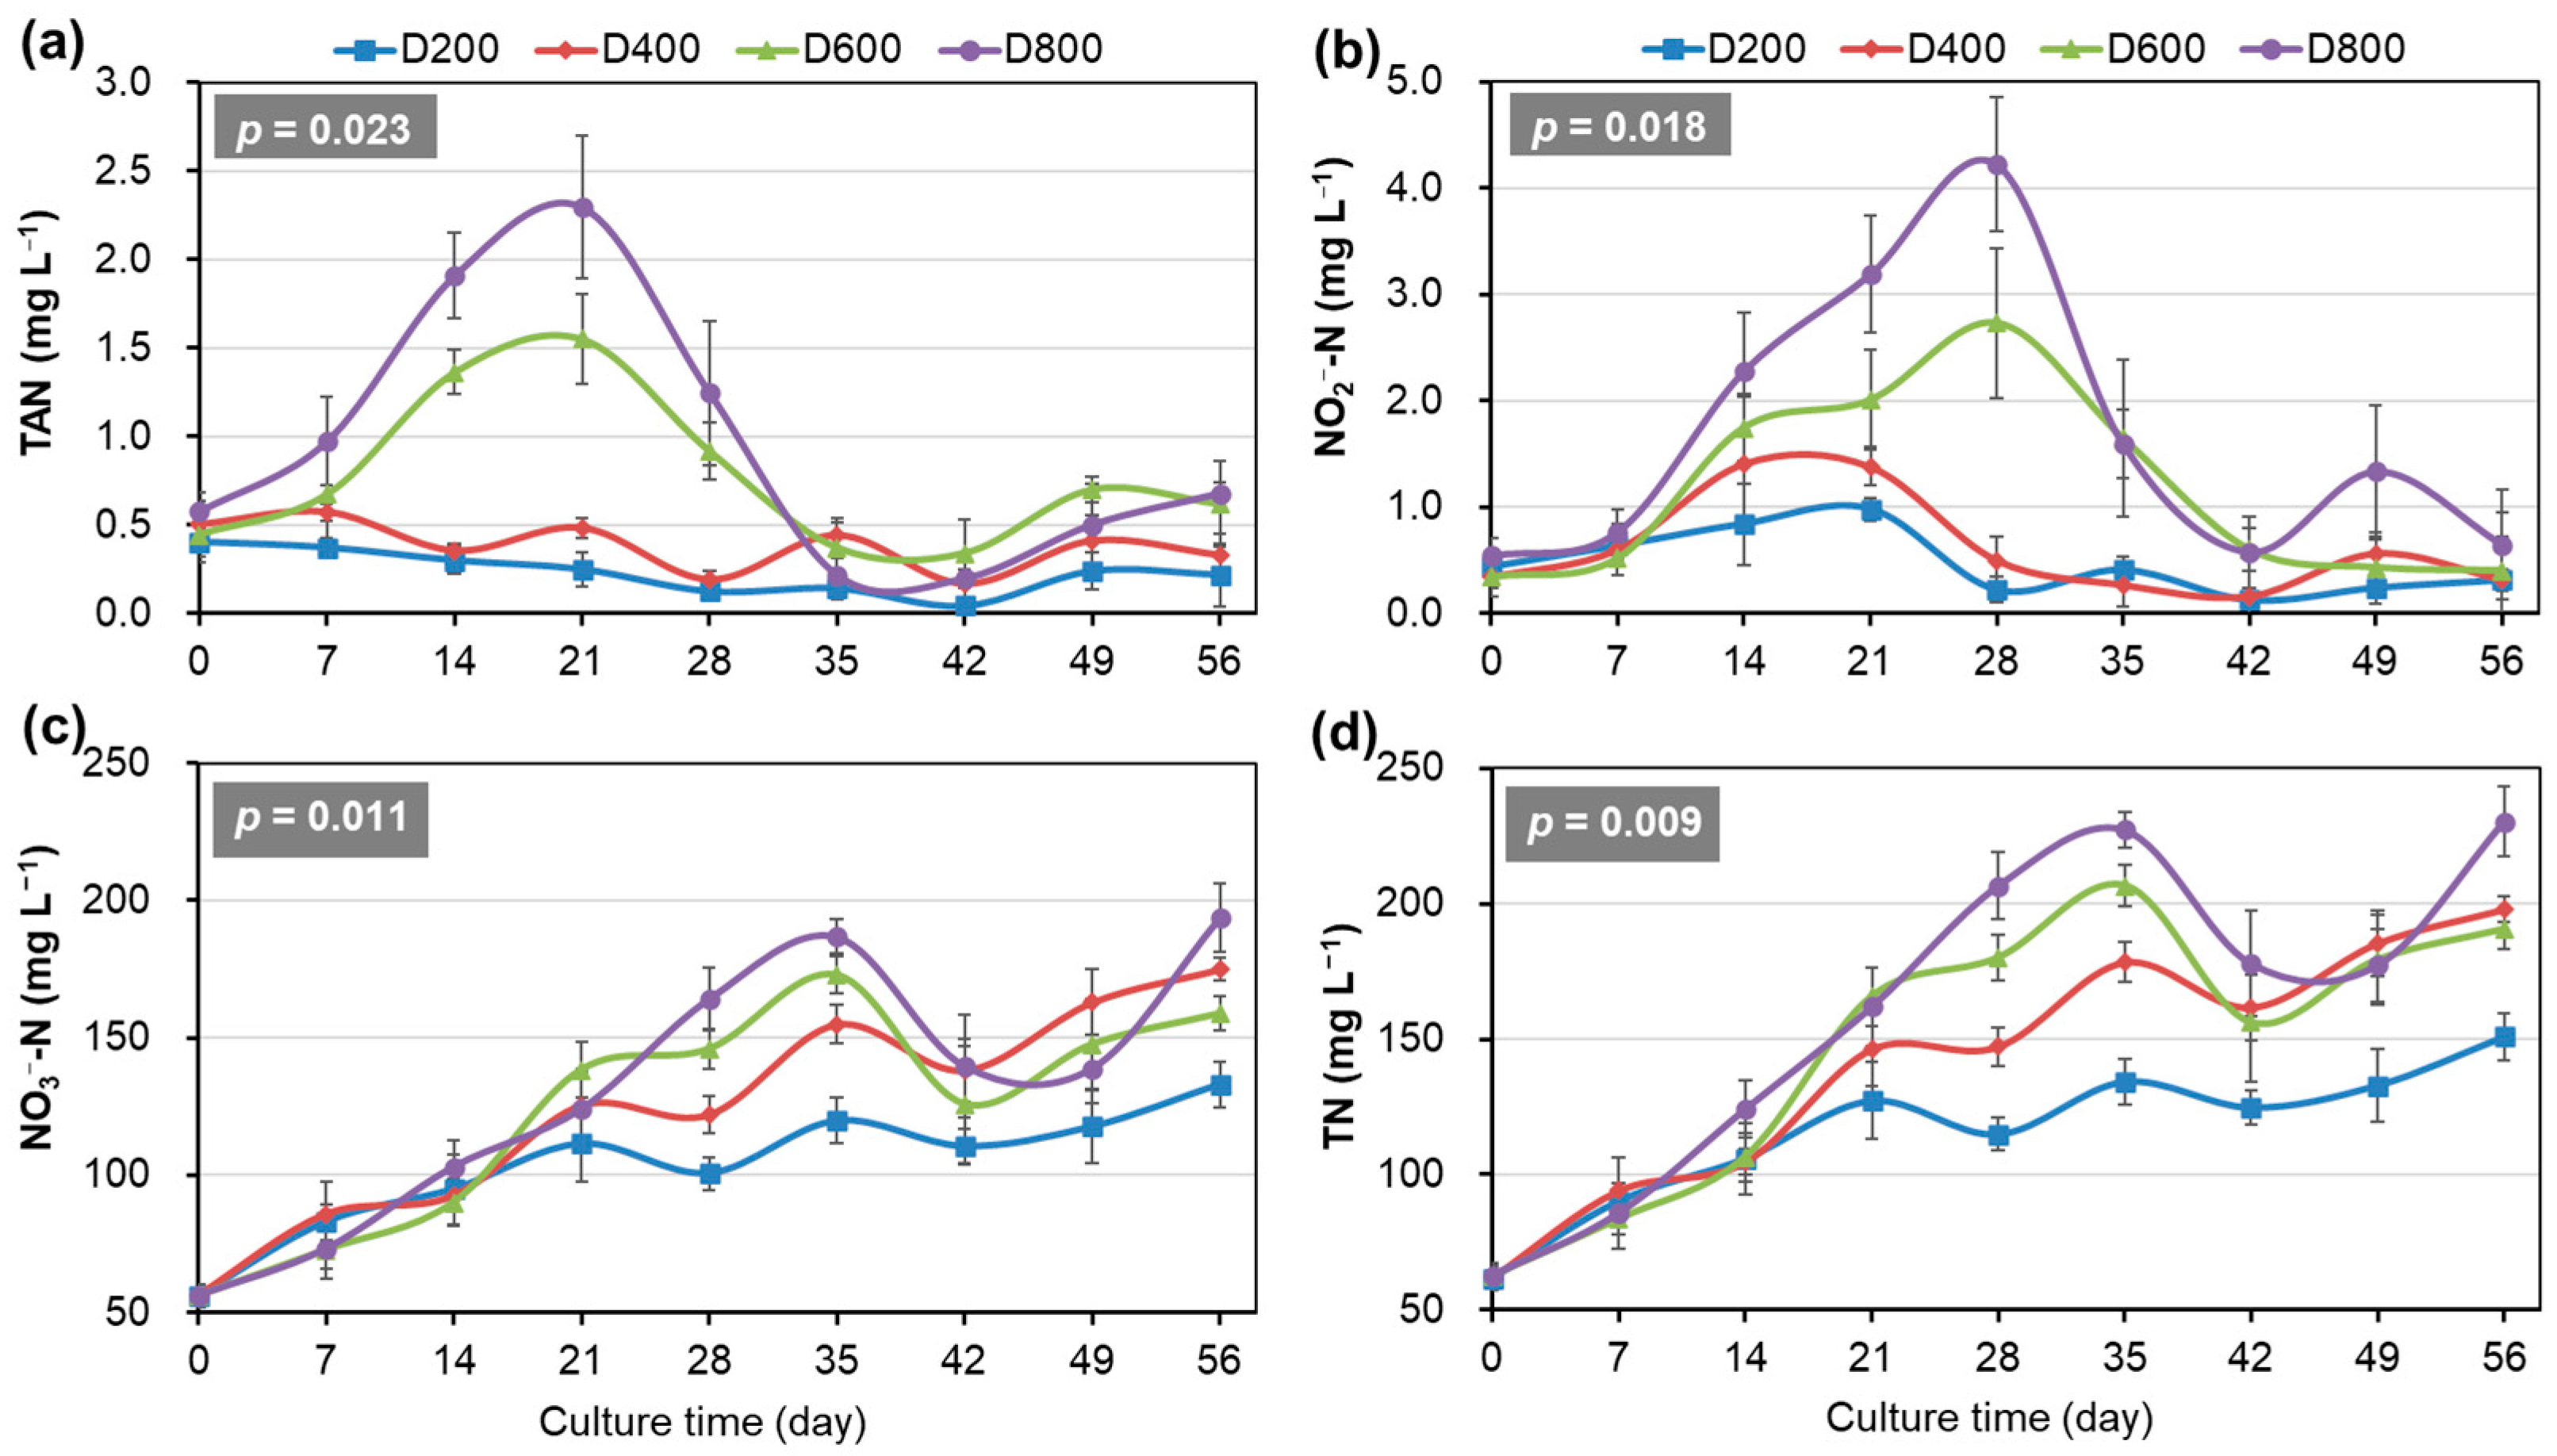
3.2. Biofloc Control and Nitrogen Dynamics
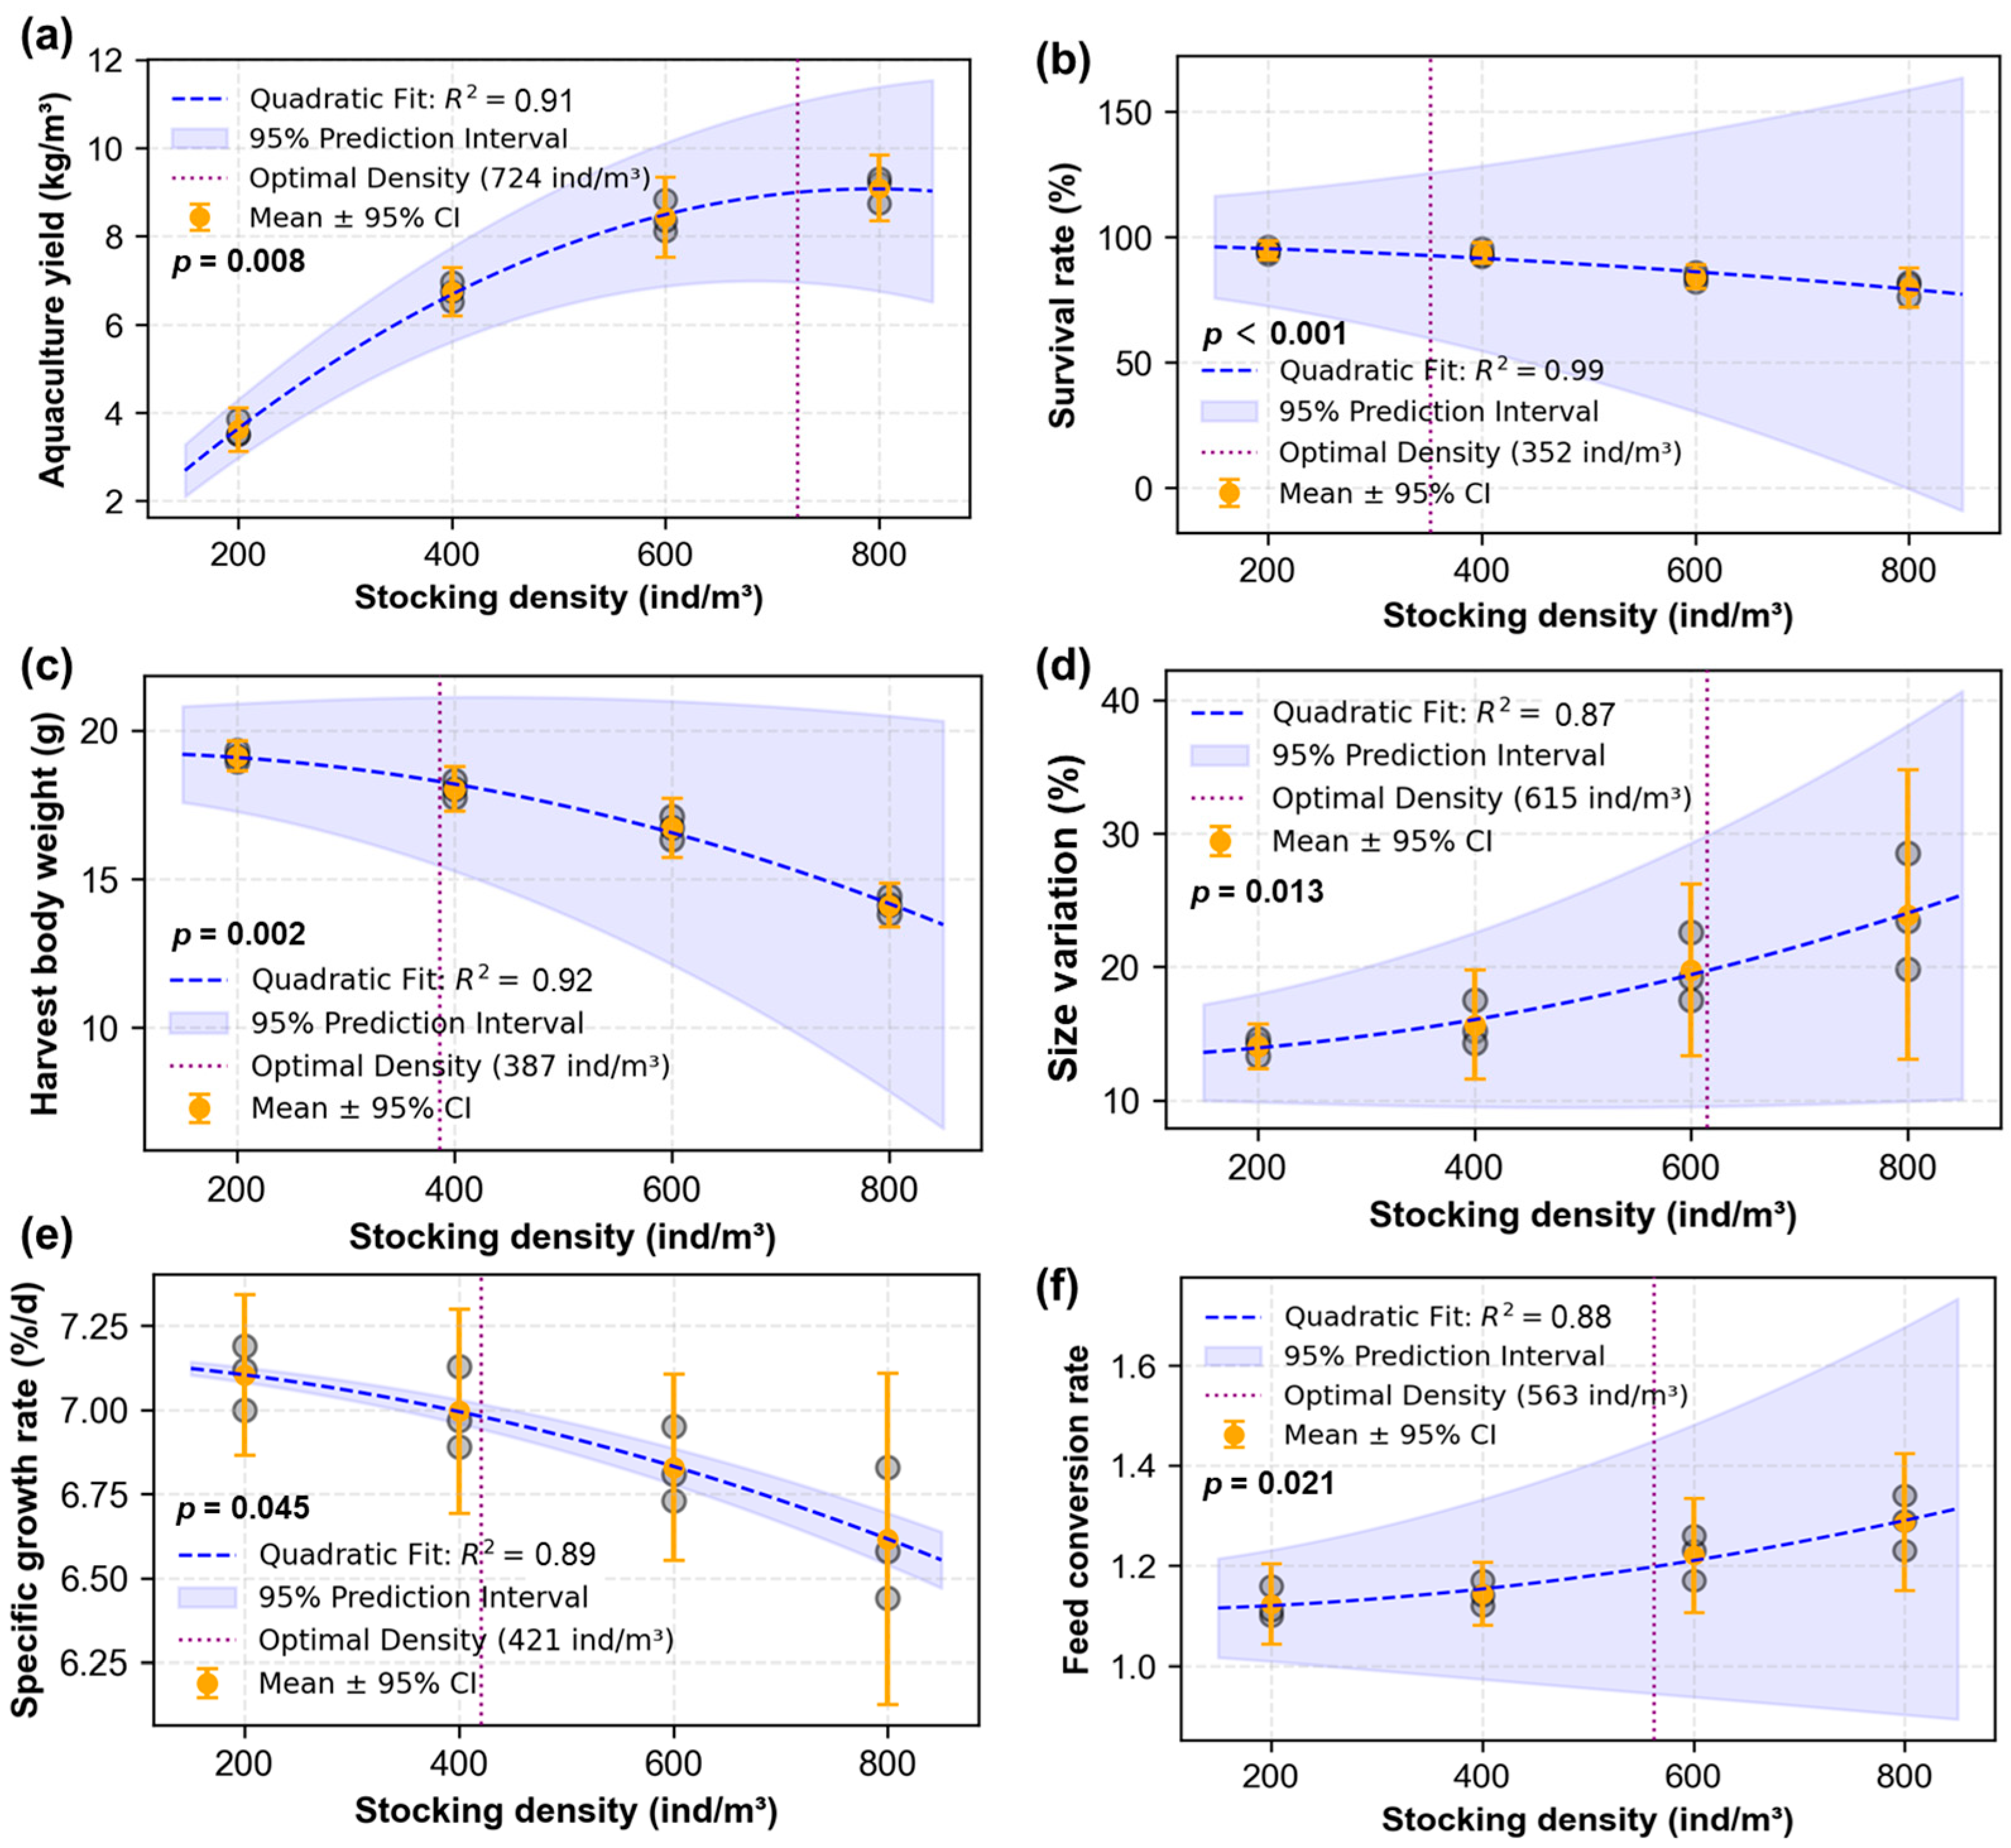
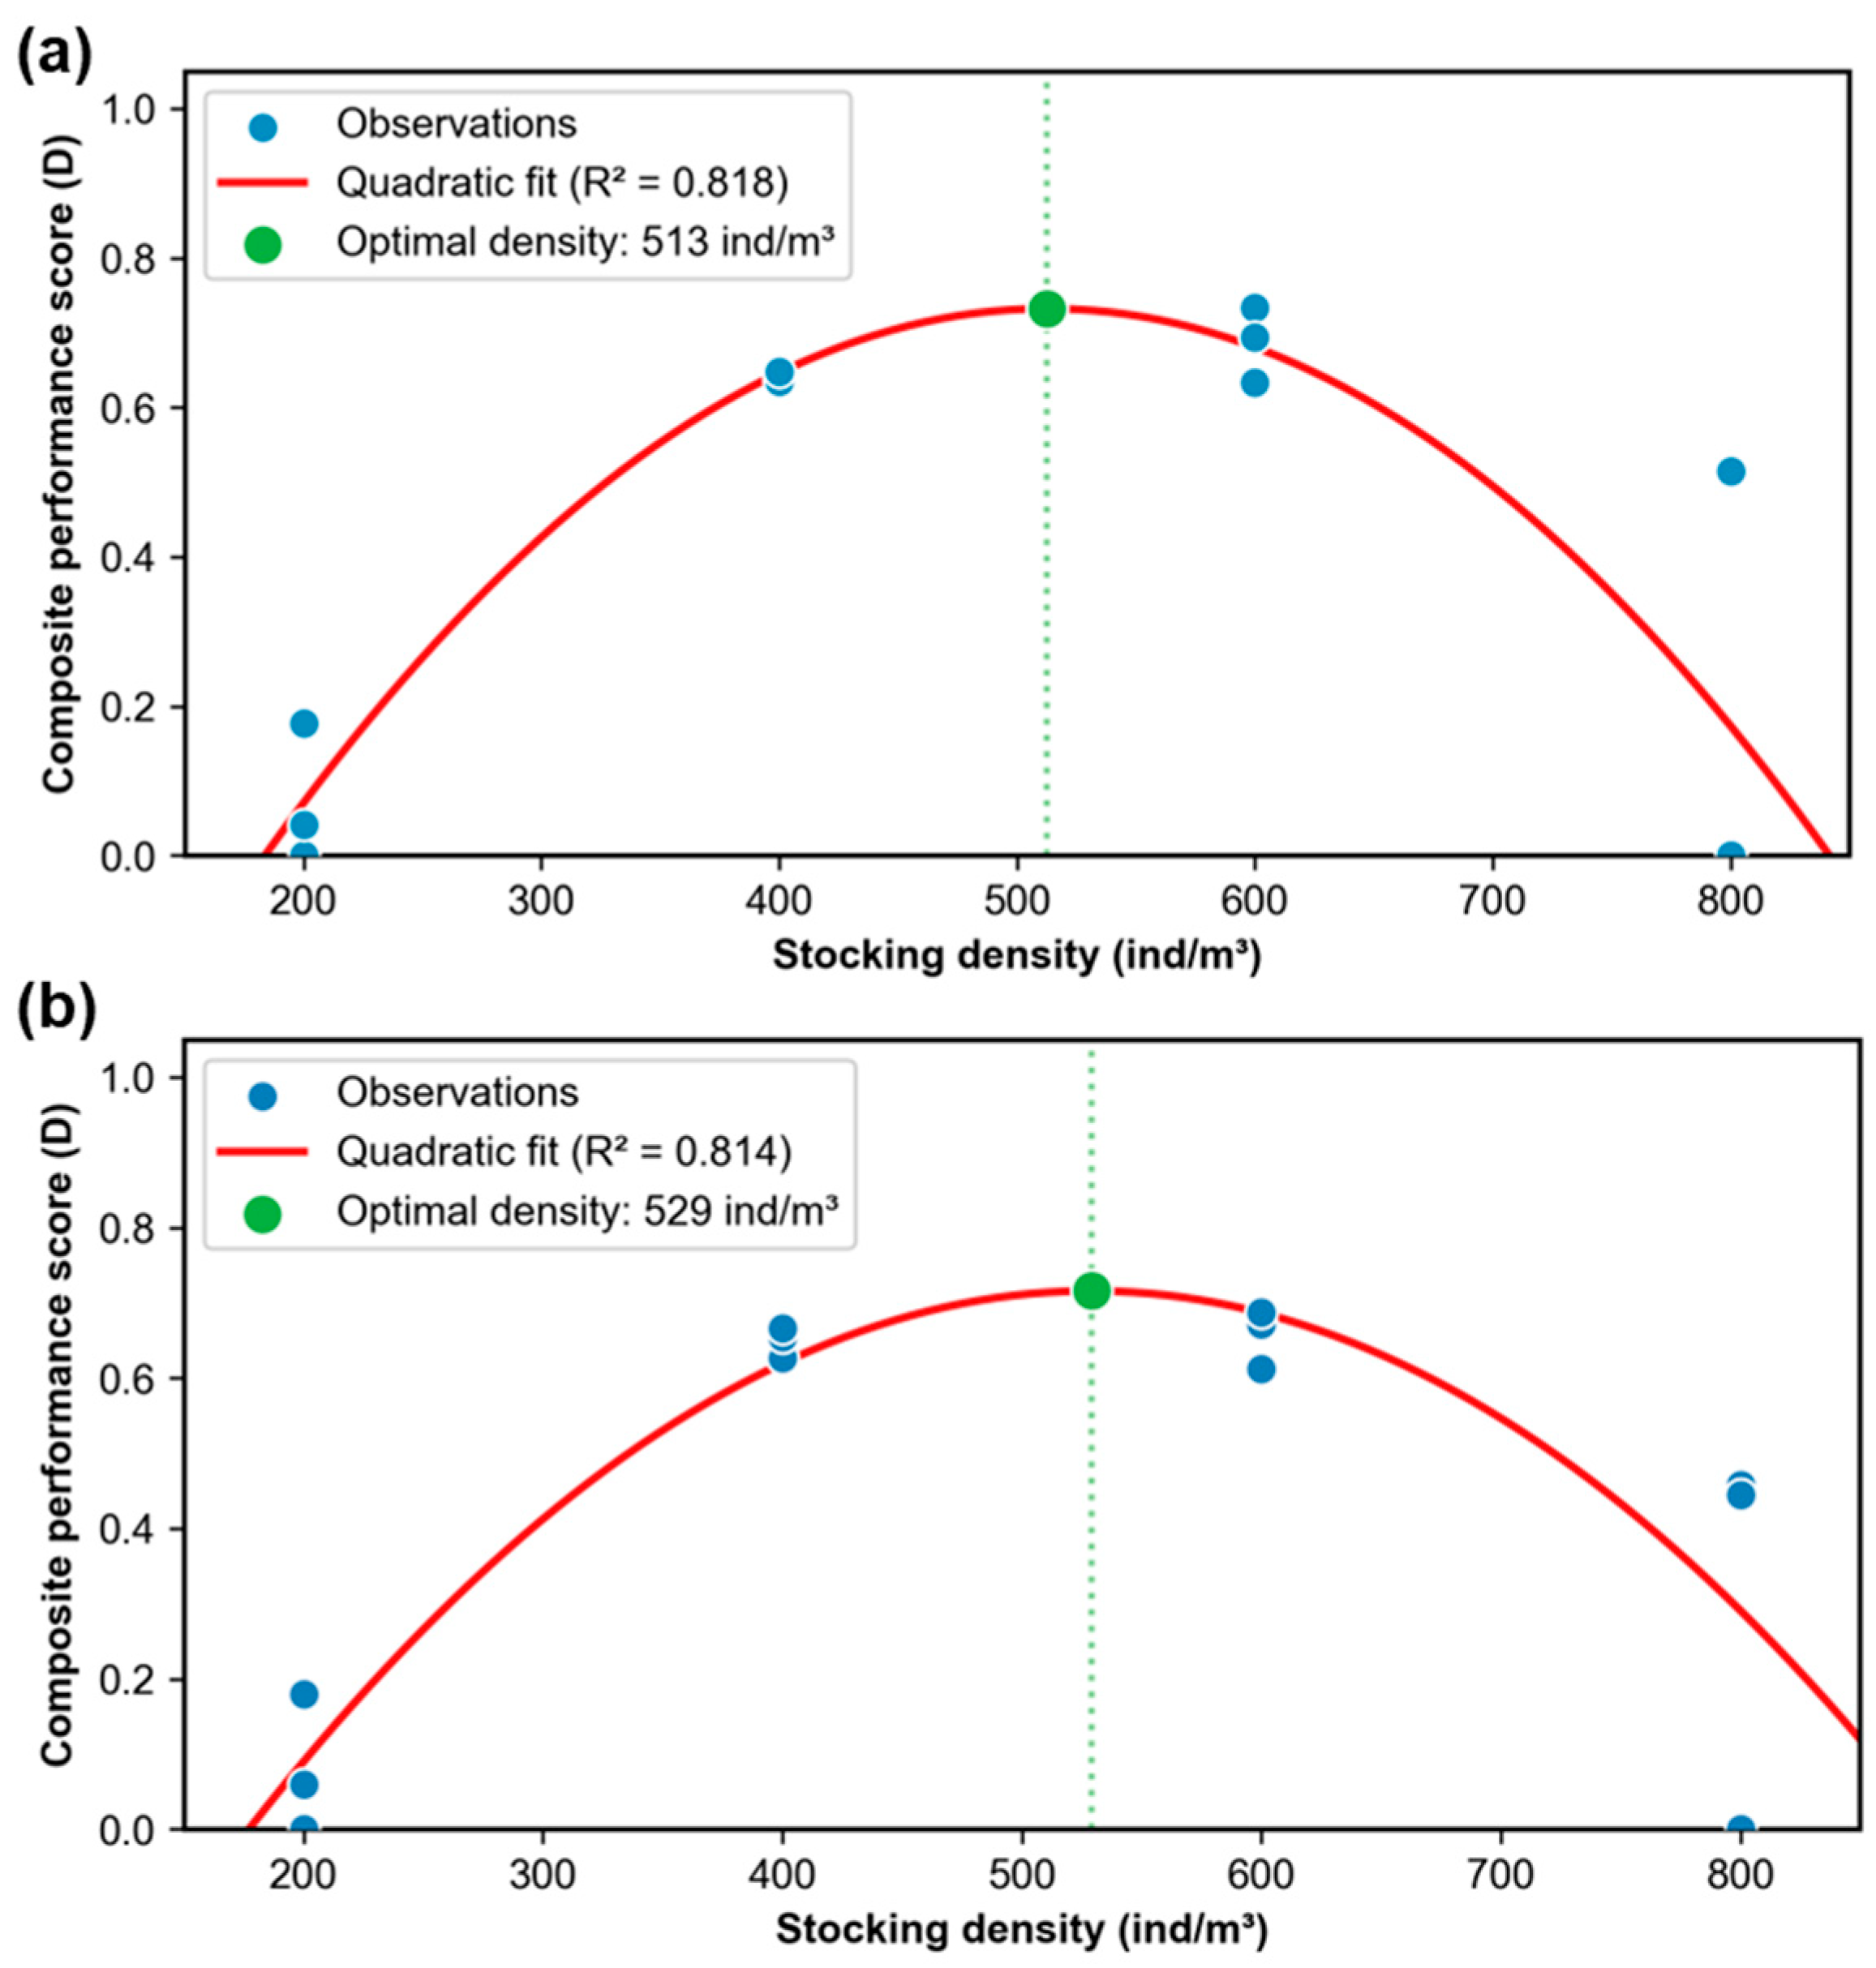
3.3. Shrimp Production Performance and Optimal Density Identification
4. Discussion
4.1. High Density Increases System Management Demands and Water Quality Challenges
4.2. High Density Exacerbates Harmful Nitrogen Fluctuations and Toxicity Risks
4.3. Density-Dependent Trade-Offs Between Production Yield and Shrimp Performance
5. Conclusions
Author Contributions
Funding
Institutional Review Board Statement
Data Availability Statement
Acknowledgments
Conflicts of Interest
References
- FAO (Food and Agriculture Organization of the United Nations). The State of World Fisheries and Aquaculture 2024; FAO: Rome, Italy, 2024. [Google Scholar]
- Hatje, V.; de Souza, M.M.; Ribeiro, L.F.; Eca, G.F.; Barros, F. Detection of environmental impacts of shrimp farming through multiple lines of evidence. Environ. Pollut. 2016, 219, 672–684. [Google Scholar] [CrossRef] [PubMed]
- El-Sayed, A.F.M. Use of biofloc technology in shrimp aquaculture: A comprehensive review, with emphasis on the last decade. Rev. Aquac. 2021, 13, 676–705. [Google Scholar] [CrossRef]
- Yang, P.; Lai, D.Y.F.; Jin, B.S.; Bastviken, D.; Tan, L.S.; Tong, C. Dynamics of dissolved nutrients in the aquaculture shrimp ponds of the Min River estuary, China: Concentrations, fluxes and environmental loads. Sci. Total Environ. 2017, 603, 256–267. [Google Scholar] [CrossRef] [PubMed]
- Thitamadee, S.; Prachumwat, A.; Srisala, J.; Jaroenlak, P.; Salachan, P.V.; Sritunyalucksana, K.; Itsathitphaisarn, O. Review of Current Disease Threats for Cultivated Penaeid Shrimp in Asia. Aquaculture 2016, 452, 69–87. [Google Scholar] [CrossRef]
- Nguyen, T.A.T.; Nguyen, K.A.T.; Jolly, C. Is super-intensification the solution to shrimp production and export sustainability? Sustainability 2019, 11, 5277. [Google Scholar] [CrossRef]
- Avnimelech, Y. Biofloc Technology: A Practical Guide Book, 3rd ed.; World Aquaculture Society: Baton Rouge, LA, USA, 2015. [Google Scholar]
- Martínez-Córdova, L.R.; Emerenciano, M.; Miranda-Baeza, A.; Martínez-Porchas, M. Microbial-Based Systems for Aquaculture of Fish and Shrimp: An Updated Review. Rev. Aquac. 2015, 7, 131–148. [Google Scholar] [CrossRef]
- Samocha, T.M.; Prangnell, D.I.; Hanson, T.R.; Treece, G.D.; Morris, T.C.; Castro, L.F.; Staresinic, N. Design and Operation of Super Intensive, Biofloc-Dominated Systems for Indoor Production of the Pacific White Shrimp, Litopenaeus vannamei—The Texas A&M AgriLife Research Experience; World Aquaculture Society: Baton Rouge, LA, USA, 2017. [Google Scholar]
- Emerenciano, M.G.; Miranda-Baeza, A.; Martínez-Porchas, M.; Poli, M.A.; Vieira, F.D. Biofloc Technology (BFT) in Shrimp Farming: Past, Present and Future. Front. Mar. Sci. 2021, 8, 813091. [Google Scholar] [CrossRef]
- Abakari, G.; Wu, X.; He, X.; Fan, L.P.; Luo, G.Z. Bacteria in biofloc technology aquaculture systems: Roles and mediating factors. Rev. Aquacult. 2022, 14, 1260–1284. [Google Scholar] [CrossRef]
- Xu, W.J.; Huang, F.; Zhao, Y.Z.; Su, H.C.; Hu, X.J.; Xu, Y.; Wen, G.L.; Cao, Y.C. Carbohydrate addition strategy affects nitrogen dynamics, budget and utilization, and its microbial mechanisms in biofloc-based Penaeus vannamei culture. Aquaculture 2024, 589, 740123. [Google Scholar] [CrossRef]
- Yu, Y.B.; Choi, J.H.; Lee, J.H.; Jo, A.H.; Lee, J.W.; Choi, H.J.; Kang, Y.J.; Choi, C.Y.; Kang, J.C.; Lee, K.M.; et al. The use, application and efficacy of biofloc technology (BFT) in shrimp aquaculture industry: A review. Environ. Technol. Innov. 2024, 33, 103345. [Google Scholar] [CrossRef]
- Liu, F.; Sun, J.; Long, J.; Sun, L.; Liu, C.; Wang, X.; Zhang, L.; Hao, P.; Wang, Z.; Cui, Y.; et al. Assessing the Interactive Effects of High Salinity and Stocking Density on the Growth and Stress Physiology of the Pacific White Shrimp Litopenaeus vannamei. Fishes 2024, 9, 62. [Google Scholar] [CrossRef]
- Krummenauer, D.; Peixoto, S.; Cavalli, R.O.; Poersch, L.H.; Wasielesky, W. Superintensive Culture of White Shrimp, Litopenaeus vannamei, in a Biofloc Technology System in Southern Brazil at Different Stocking Densities. J. World Aquac. Soc. 2011, 42, 726–733. [Google Scholar] [CrossRef]
- Da Silveira, L.G.P.; Krummenauer, D.; Poersch, L.H.; Rosas, V.T.; Wasielesky, W. Hyperintensive Stocking Densities for Litopenaeus vannamei Grow-out in Biofloc Technology Culture System. J. World Aquac. Soc. 2020, 51, 1290–1300. [Google Scholar] [CrossRef]
- Da Silveira, L.G.P.; Rosas, V.T.; Krummenauer, D.; Fróes, C.; Da Silva, A.; Poersch, L.H.; Fóes, G.; Wasielesky, W. Establishing the most productive stocking densities for each stage of a multi-phase shrimp culture in BFT system. Aquac. Int. 2022, 30, 1889–1903. [Google Scholar] [CrossRef]
- Irani, M.; Rajabi Islami, H.; Nafisi Bahabadi, M.; Hosseini Shekarabi, S.P. Production of Pacific white shrimp under different stocking density in a zero-water exchange biofloc system: Effects on water quality, zootechnical performance, and body composition. Aquac. Eng. 2023, 100, 102313. [Google Scholar] [CrossRef]
- Xu, W.J.; Xu, Y.; Su, H.C.; Hu, X.J.; Xu, Y.N.; Li, Z.J.; Wen, G.L.; Cao, Y.C. Production performance, inorganic nitrogen control and bacterial community characteristics in a controlled biofloc-based system for indoor and outdoor super-intensive culture of Litopenaeus vannamei. Aquaculture 2021, 531, 735876. [Google Scholar] [CrossRef]
- Said, M.M.; El-barbary, Y.A.; Ahmed, O.M. Assessment of Performance, Microbial Community, Bacterial Food Quality, and Gene Expression of Whiteleg Shrimp (Litopenaeus vannamei) Reared under Different Density Biofloc Systems. Aquac. Nutr. 2022, 2022, 3499061. [Google Scholar] [CrossRef]
- APHA (American Public Health Association). Standard Methods for the Examination of Water and Wastewater, 20th ed.; APHA: Washington, DC, USA, 1998. [Google Scholar]
- Furtado, P.S.; Poersch, L.H.; Wasielesky, W., Jr. Effect of calcium hydroxide, carbonate and sodium bicarbonate on water quality and zootechnical performance of shrimp Litopenaeus vannamei reared in bio—Flocs technology (BFT) systems. Aquaculture 2012, 321, 130–135. [Google Scholar] [CrossRef]
- Schveitzer, R.; Baccarat, R.F.C.; Gaona, C.A.P.; Wasielesky, W., Jr.; Arantes, R. Concentration of suspended solids in superintensive culture of the Pacific white shrimp Litopenaeus vannamei with biofloc technology (BFT): A review. Rev. Aquac. 2024, 16, 785–795. [Google Scholar] [CrossRef]
- Ray, A.J.; Dillon, K.S.; Lotz, J.M. Water quality dynamics and shrimp (Litopenaeus vannamei) production in intensive, mesohaline culture systems with two levels of biofloc management. Aquac. Eng. 2011, 45, 127–136. [Google Scholar] [CrossRef]
- Luo, G.Z.; Xu, J.X.; Meng, H.Y. Nitrate accumulation in biofloc aquaculture systems. Aquaculture 2020, 520, 734675. [Google Scholar] [CrossRef]
- Raza, B.; Zheng, Z.M.; Zhu, J.Y.; Yang, W. A Review: Microbes and Their Effect on Growth Performance of Litopenaeus vannamei (White Leg Shrimps) during Culture in Biofloc Technology System. Microorganisms 2024, 12, 1013. [Google Scholar] [CrossRef] [PubMed]
- Xu, W.J.; Wen, G.L.; Su, H.C.; Xu, Y.; Hu, X.J.; Cao, Y.C. Effect of Input C/N Ratio on Bacterial Community of Water Biofloc and Shrimp Gut in a Commercial Zero-Exchange System with Intensive Production of Penaeus vannamei. Microorganisms 2022, 10, 1060. [Google Scholar] [CrossRef]
- Said, M.M.; Abo-Al-Ela, H.G.; El-Barbary, Y.A.; Ahmed, O.M.; Dighiesh, H.S. Influence of Stocking Density on the Growth, Immune and Physiological Responses, and Cultivation Environment of White-Leg Shrimp (Litopenaeus vannamei) in Biofloc Systems. Sci. Rep. 2024, 14, 11147. [Google Scholar] [CrossRef]
- Sharawy, Z.Z.; Abbas, E.M.; Abdelkhalek, N.K.; Ashry, O.A.; Abd El-Fattah, L.S.; El-Sawy, M.A.; Helal, M.F.; El-Haroun, E. Effect of Organic Carbon Source and Stocking Densities on Growth Indices, Water Microflora, and Immune-Related Genes Expression of Litopenaeus vannamei Larvae in Intensive Culture. Aquaculture 2022, 546, 737397. [Google Scholar] [CrossRef]
- Abakari, G.; Luo, G.Z.; Kombat, E.O.; Alhassan, E.H. Supplemental carbon sources applied in biofloc technology aquaculture systems: Types, effects and future research. Rev. Aquac. 2021, 13, 1193–1222. [Google Scholar] [CrossRef]
- Xu, W.J.; Morris, T.C.; Samocha, T.M. Effects of C/N ratio on biofloc development, water quality, and performance of Litopenaeus vannamei juveniles in a biofloc-based, high-density, zero-exchange, outdoor tank system. Aquaculture 2016, 453, 169–175. [Google Scholar] [CrossRef]
- Kring, N.A.; Fleckenstein, L.J.; Tierney, T.W.; Fisk, J.C.; Lawson, B.C.; Ray, A.J. The effects of stocking density and artificial substrate on production of Pacific white shrimp Litopenaeus vannamei and water quality dynamics in greenhouse-based biofloc systems. Aquac. Eng. 2023, 101, 102322. [Google Scholar] [CrossRef]
- Bardera, G.; Owen, M.A.G.; Façanha, F.N.; Alcaraz-Calero, J.M.; Alexander, M.E.; Sloman, K.A. The influence of density and dominance on Pacific white shrimp (Litopenaeus vannamei) feeding behaviour. Aquaculture 2021, 531, 735949. [Google Scholar] [CrossRef]
- Hamilton, S.; Filho, F.C.; Silva, J.F.; Duarte-Neto, P.J.; Soares, R.; Peixoto, S. The loud crowd: Interactions between stocking density and acoustic feeding activity of different size classes of Litopenaeus vannamei. Aquaculture 2023, 563, 738904. [Google Scholar] [CrossRef]
- Da Costa, F.P.; Gomes, B.S.F.D.F.; Pereira, S.D.D.N.A.; De Fátima Arruda, M. Influence of stocking density on the behaviour of juvenile Litopenaeus vannamei (Boone, 1931). Aquac. Res. 2016, 47, 912–924. [Google Scholar] [CrossRef]

| Management Input | D200 | D400 | D600 | D800 |
|---|---|---|---|---|
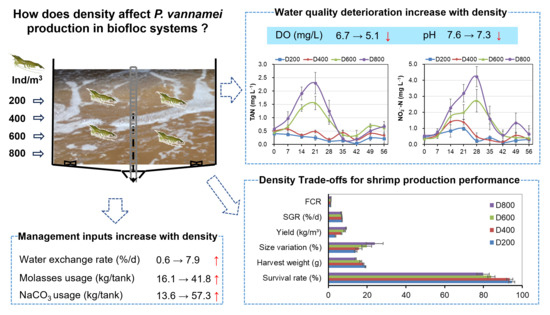
| Water exchange rate (%/d) | 0.6 ± 0.2 a | 2.7 ± 0.4 b | 4.8 ± 0.9 c | 7.9 ± 1.1 d |
| Molasses usage (kg/tank) | 16.1 ± 0.6 a | 28.3 ± 0.9 b | 38.2 ± 1.8 c | 41.8 ± 2.6 d |
| Sodium carbonate usage (kg/tank) | 13.6 ± 1.2 a | 27.5 ± 2.1 b | 45.4 ± 3.6 c | 57.3 ± 4.3 d |
| Parameter | D200 | D400 | D600 | D800 |
|---|---|---|---|---|
| Salinity (g/L) | 25.6 ± 0.3 a | 25.7 ± 0.5 a | 25.8 ± 0.6 a | 26.0 ± 0.6 a |
| Temperature (°C) | 28.1 ± 0.6 a | 28.3 ± 0.9 a | 28.2 ± 0.8 a | 28.4 ± 1.1 a |
| DO (mg/L) | 6.7 ± 0.2 a | 6.1 ± 0.2 b | 5.6 ± 0.3 c | 5.1 ± 0.4 c |
| pH | 7.6 ± 0.1 a | 7.5 ± 0.1 ab | 7.4 ± 0.2 ab | 7.3 ± 0.3 b |
| TAN (mg/L) | 0.23 ± 0.12 a | 0.38 ± 0.14 a | 0.78 ± 0.43 ab | 0.96 ± 0.74 b |
| NO2−-N (mg/L) | 0.47 ± 0.29 a | 0.62 ± 0.46 a | 1.16 ± 0.89 ab | 1.68 ± 1.31 b |
| Indicator | D200 | D400 | D600 | D800 |
|---|---|---|---|---|
| Initial body weight (g) | 0.36 ± 0.14 a | 0.36 ± 0.14 a | 0.36 ± 0.14 a | 0.36 ± 0.14 a |
| Harvest body weight (g) | 19.14 ± 0.21 a | 18.03 ± 0.30 b | 16.72 ± 0.42 c | 14.12 ± 0.31 d |
| Size variation (%) | 14.03 ± 0.67 a | 15.67 ± 1.65 a | 19.77 ± 2.60 ab | 23.90 ± 4.37 b |
| Specific growth rate (%/d) | 7.10 ± 0.10 a | 6.99 ± 0.16 ab | 6.83 ± 0.14 ab | 6.62 ± 0.30 b |
| Survival rate (%) | 94.6 ± 1.5 a | 93.5 ± 1.6 a | 84.0 ± 1.9 b | 79.8 ± 3.2 b |
| Yield (kg/m3) | 3.62 ± 0.20 a | 6.74 ± 0.22 a | 8.43 ± 0.37 b | 9.09 ± 0.30 b |
| Feed conversion rate | 1.12 ± 0.03 a | 1.14 ± 0.02 a | 1.22 ± 0.04 b | 1.29 ± 0.05 b |
Disclaimer/Publisher’s Note: The statements, opinions and data contained in all publications are solely those of the individual author(s) and contributor(s) and not of MDPI and/or the editor(s). MDPI and/or the editor(s) disclaim responsibility for any injury to people or property resulting from any ideas, methods, instructions or products referred to in the content. |
© 2025 by the authors. Licensee MDPI, Basel, Switzerland. This article is an open access article distributed under the terms and conditions of the Creative Commons Attribution (CC BY) license (https://creativecommons.org/licenses/by/4.0/).
Share and Cite
Xu, W.; Zhang, B.; Zhao, Y.; Cao, Y. Effect of Stocking Density on Water Quality, Harmful Nitrogen Control, and Production Performance of Penaeus vannamei in Biofloc-Based Systems with Limited Water Exchange. Fishes 2025, 10, 326. https://doi.org/10.3390/fishes10070326
Xu W, Zhang B, Zhao Y, Cao Y. Effect of Stocking Density on Water Quality, Harmful Nitrogen Control, and Production Performance of Penaeus vannamei in Biofloc-Based Systems with Limited Water Exchange. Fishes. 2025; 10(7):326. https://doi.org/10.3390/fishes10070326
Chicago/Turabian StyleXu, Wujie, Bin Zhang, Yongzhen Zhao, and Yucheng Cao. 2025. "Effect of Stocking Density on Water Quality, Harmful Nitrogen Control, and Production Performance of Penaeus vannamei in Biofloc-Based Systems with Limited Water Exchange" Fishes 10, no. 7: 326. https://doi.org/10.3390/fishes10070326
APA StyleXu, W., Zhang, B., Zhao, Y., & Cao, Y. (2025). Effect of Stocking Density on Water Quality, Harmful Nitrogen Control, and Production Performance of Penaeus vannamei in Biofloc-Based Systems with Limited Water Exchange. Fishes, 10(7), 326. https://doi.org/10.3390/fishes10070326