Abstract
Accurate monitoring of fish morphology and behavior is crucial to intelligent aquaculture management, especially for economically important species such as the large yellow croaker. To address challenges including turbid water, uneven lighting, and occlusions in real farming environments, this study develops DMSNet—an underwater image segmentation model based on an enhanced TransNeXt architecture. The model incorporates three novel modules, a Convolutional Dynamic Gated Linear Unit (CDGLU), an Agentic Cross-Attention Fusion Module (ACAF), and Pooling Channel-Spatial Attention (PCSA), significantly improving feature fusion and robustness under complex conditions. To better support applications in aquaculture, a dedicated dataset of underwater large yellow croaker, called the Large Yellow Croaker Dataset (LYCD), was constructed, covering the varied clarity levels typically found in farming operations. Experimental results show that DMSNet achieves an Acc of 98.01%, an IoU of 91.73%, an F1 of 96.17%, and an inference speed of 29.25 FPS, outperforming state-of-the-art methods, particularly in turbid and low-contrast scenarios. This study presents a practical and efficient tool for non-invasive fish monitoring that is capable of accurately identifying large yellow croaker underwater in real-world aquaculture environments with complex water conditions.
Keywords:
aquaculture; computer vision; feature fusion; underwater fish segmentation; large yellow croaker Key Contribution:
This work proposes DMSNet, an enhanced segmentation model for underwater monitoring that incorporates novel CDGLU, ACAF, and PCSA modules to significantly improve robustness in complex conditions. The method is validated on the newly self-developed Large Yellow Croaker Dataset (LYCD), which was specifically designed for aquaculture monitoring, where it achieves significant accuracy and real-time speed, providing an effective solution for non-invasive fish monitoring in complex environments.
1. Introduction
The large yellow croaker (Larimichthys corea), belonging to the order Perciformes, family Sciaenidae, and genus Larimichthys, is a migratory demersal economic fish species endemic to the southeastern coastal waters of China. Characterized by its golden body color, orange-red lips, delicate flesh, and rich nutritional value, it is one of China’s most important economic marine species and ranks first among the country’s four major seafood products. The eastern coastal region of Fujian Province has established China’s largest core aquaculture zone for large yellow croaker and has realized large-scale industrialized marine aquaculture, exemplified by marine ranching. With the rapid development of the large yellow croaker farming industry, there is a growing demand for higher levels of intelligence in related aquaculture equipment, underwater monitoring, and management methods to better meet market needs and enhance farming quality and efficiency.
The implementation of efficient and precise management strategies for aquatic growth environments, combined with advanced monitoring technologies to assess fish physiological status, constitutes a critical approach for optimizing breeding efficiency and ensuring the quality assurance of aquatic products [1]. In large yellow croaker aquaculture, accurate estimation of stocking density, feed input, and analysis of growth status have a significant impact on the economic efficiency of aquaculture operations. Therefore, it is highly necessary to acquire detailed information on fish morphology, size, population quantity, and ecological behavior. Currently, these operations depend on traditional manual practices and management, which require taking the fish out of the water. This process easily leads to physical injury and stress reactions in the fish, thereby affecting their growth and survival rates. Moreover, traditional practices are highly dependent on the experience of practitioners, resulting in inefficiency, high labor costs, and substantial detection errors. Consequently, there is an urgent need to develop non-contact underwater recognition methods that have high accuracy. Such methods would enable precise segmentation of fish targets from image backgrounds to obtain the required morphological information, thereby supporting various aquaculture procedures. This approach can reduce labor costs, minimize economic losses, and promote the intelligent development of aquaculture operations [2].
Previous fish image segmentation methods have predominantly relied on conventional image processing techniques such as threshold-based segmentation, edge detection, and region growing algorithms. These methodologies operated by analyzing pixel similarity metrics and feature differentiation to partition images into homogeneous regions where constituent pixels exhibited consistent attributes, including grayscale intensity, chromatic characteristics, textural patterns, and geometric configurations. A hybrid fish image segmentation method integrated K-means clustering and mathematical morphology, achieving effective foreground–background segregation through iterative pixel classification [3]. A trawling-based underwater camera system for fish segmentation employed dual Otsu thresholding combined with a histogram back-projection algorithm to isolate targets from complex marine backgrounds through iterative pixel intensity analysis [4]. An automated classification framework combined feature extraction from underwater images with Support Vector Machine (SVM) classifiers, while also incorporating behavioral analysis to simultaneously enhance taxonomic identification accuracy and ethological interpretation [5]. A morphology-driven segmentation pipeline employed adaptive erosion–dilation operations to isolate piscine bodies from complex backgrounds, followed by computational separation of anatomical regions based on predetermined proportional relationships [6]. While demonstrating efficacy in controlled environments with uniform backgrounds, these methods exhibit compromised segmentation performance when handling complex aquatic scenarios involving non-uniform illumination, dynamic water turbidity patterns, and interspecies morphological variations due to their reliance on handcrafted features and the lack of adaptive learning capabilities.
In recent years, the application of deep learning technology to process images has become a research topic [7]. An enhanced cascaded decoder network [8] architecture employed a pre-trained ResNet-50 backbone [9] with hybrid loss functions. An underwater image enhancement algorithm employed a gradient-adaptive MSRCR with guided filtering for color restoration, combined with a detail-aware 2D gamma function for contrast correction, effectively mitigating color casts and revealing obscured details [10]. A multi-feature fusion framework for fish image segmentation in aquaculture environments employed minimum Euclidean-distance-based thresholding between histogram peaks to preprocess raw imagery, which is subsequently fused with the original data for feature enhancement [11]. This architecture integrated a multi-scale attention module to fuse different scale features. A novel dual-pooling aggregated attention mechanism leveraged maximum and average pooling operations across both spatial and channel dimensions to concentrate and aggregate specific target features while maintaining a lightweight architecture [12]. A parallel semantic segmentation model simultaneously segmented the foreground and background of a complex underwater scene by designing different attentional attention as well as loss functions for the foreground and background, respectively, achieving better segmentation results [13]. An underwater fish segmentation model, Receptive Field Expansion Model (RFEM), proposed a strategy based on dilated convolution, enhancing the effectiveness of most soft attention mechanisms by enlarging the receptive field of the soft attention mechanism through the combination of different dilation rates [14]. SOLO-MFFA introduced a multi-scale feature fusion and attention mechanism module based on the SOLO model [15].
Beyond industrial aquaculture, robust fish segmentation is critical for conservation initiatives, such as tracking endangered species in restoration programs, monitoring biodiversity in protected marine areas, and assessing the ecological impact of aquaculture operations. Non-invasive monitoring via underwater imaging supports sustainability goals by enabling precise population assessments without disrupting habitats. Despite these advancements, state-of-the-art segmentation models still face significant challenges when deployed in real-world aquaculture environments. Transformer-based architectures like SegFormer [16] and Swin-Transformer [17], while powerful in capturing global context, often exhibit sensitivity to the local texture variations and image quality degradation common in underwater settings, such as turbidity and uneven lighting. Their computational complexity can also hinder real-time performance on resource-constrained devices. Conversely, purely convolutional models like DeepLabV3+ [18], SegNeXt [19], and Unet [20], though efficient, may struggle with long-range dependency modeling and adaptive feature recalibration under dynamic conditions like occlusions and low contrast. Advanced hybrid architectures like TransNeXt [21] incorporate convolutional GLUs and aggregated attention to mitigate these issues. Nevertheless, we found its feature fusion strategy insufficient for handling the semantic–noise disparity between encoder and decoder features in turbid conditions, and it lacked a dedicated mechanism to refine multi-scale features at the network neck. These limitations collectively lead to performance degradation in precisely the scenarios where aquaculture monitoring is most needed—turbid waters and cluttered environments. Consequently, achieving precise underwater fish image segmentation remains both critically significant and technically challenging.
To address these limitations, and motivated by the need for a model that combines the global perceptual strengths of architectures like TransNeXt with enhanced robustness to underwater challenges, we identify key areas for improvement within the TransNeXt framework itself. The core of our improvement lies in the seamless integration of three novel modules into the TransNeXt backbone: (1) the Convolutional Dynamic Gated Linear Unit (CDGLU), which introduces group normalization and a dynamic gating mechanism with a learnable weight (α) to enhance training stability and feature modulation capacity; (2) the Agentic Cross-Attention Fusion Module (ACAF), which efficiently bridges the semantic gap between global and local features while minimizing computational overhead; and (3) the Pooling Channel-Spatial Attention (PCSA), which synergistically employs robust statistical pooling and grouped axial attention to reinforce feature representation against underwater degradation. These modules collectively empower DMSNet to achieve more stable training and superior performance, especially in turbid and low-contrast scenarios where existing SOTA models often falter.
By integrating multiple existing public datasets and independently constructing a large yellow croaker image dataset from real farming scenarios, we propose DMSNet, an underwater fish image segmentation model based on an improved TransNeXt architecture that is designed to effectively address common challenges in actual aquaculture conditions, including non-uniform illumination, water turbidity, and target occlusion. The primary contributions of this paper are summarized as follows:
- Compile and annotate a dedicated underwater image dataset of the large yellow croaker, called the Large Yellow Croaker Dataset (LYCD), capturing the varied clarity conditions representative of real aquaculture settings, providing a valuable resource for community-based research and application.
- Propose DMSNet, an improved segmentation network based on TransNeXt, which integrates three core modules—CDGLU, ACAF, and PCSA—to strengthen feature representation and fusion under challenging underwater conditions.
- Comprehensive experiments demonstrate that our method achieves state-of-the-art performance on both public datasets and LYCD, showing particularly strong robustness in the turbid and low-contrast environments common to practical aquaculture settings.
2. Materials and Methods
2.1. Dataset
To validate and assess the performance of the proposed approach, it is essential to establish a benchmark of fish segmentation datasets. Publicly available fish segmentation datasets currently include Fish4Knowledge, SUIM [22], UIIS [23], and USIS10K [24]. For this purpose, we selected images from these three public datasets that can better depict the morphology of underwater fish (covering 11 different fish species) and convert them into a semantic segmentation dataset to preliminarily analyze the model’s ability to recognize fish and test its generalization ability. Additionally, we incorporated images and video screenshots obtained from other fish image resource websites to further enrich the dataset. The final public dataset contains a total of 3395 images.
To further analyze the model’s performance in recognizing large yellow croaker under real underwater conditions, we collected an underwater dataset from a large yellow croaker farming base in Ningde, Fujian, China.
The LYCD used in our experiments was collected using the FIFISH-V6 (QYSEA Technology, Shenzhen, China) intelligent underwater robot, which is equipped with a 4K ultra-high-definition camera operating at a frame rate of 30 FPS and a resolution of 1920 × 1080. To evaluate the model’s recognition accuracy under different water conditions, the robot was instructed to follow a designated route within the aquaculture tank in both turbid and clear environments, with corresponding observation heights from 0.15 m to 0.8 m. A total of 41 videos were recorded, with an average duration of 4 min. Like the public datasets, only video segments that effectively depicted the morphology of large yellow croaker schools were retained, and frames were extracted from these segments for subsequent experiments.
All images in both the public dataset and the LYCD were annotated at the pixel level to create ground-truth segmentation masks. The annotation was performed by two trained annotators using the LabelMe annotation tool (v5.9.1). To ensure annotation quality and consistency, we implemented an iterative annotation and review process. We calculated the Inter-Annotator Agreement (IAA) using Cohen’s Kappa for their annotations. The final Cohen’s Kappa was 0.91, indicating high consistency.
To assess the model’s performance under different imaging environments, we further partitioned the dataset. Recognizing the subjectivity inherent in classifying image quality based solely on human visual inspection, we introduced two no-reference underwater image quality assessment metrics: Underwater Color Image Quality Evaluation () [25] and Underwater Image Quality Measure () [26]. quantifies non-uniform color casts, blurriness, and low contrast in underwater images through a linear combination of chroma, saturation, and contrast. A higher value indicates a better balance among chroma, saturation, and contrast. UCIQE is formulated as follows:
where is the standard deviation of chroma, is the contrast of luminance and is the average of saturation, and , , and are weighted coefficients typically taken to be 0.4680, 0.2745, and 0.2576, respectively. comprehensively accounts for three dimensions of image quality—color, sharpness, and contrast—and computes the overall quality score via a weighted average. It consists of three sub-metrics: the Underwater Image Colorfulness Measure (), the Underwater Image Sharpness Measure (), and the Underwater Image Contrast Measure (). is formulated as follows:
where , , and are weighted coefficients typically taken to be 0.0280, 0.2953, and 3.5753, respectively.
To categorize the image clarity in a data-driven and objective manner, we utilized the Underwater Color Image Quality Evaluation () and Underwater Image Quality Measure () metrics. We computed these scores for all images in the LYCD (see Table 1 for descriptive statistics). Given the absence of a universally established threshold for clarity levels based on and , we proposed using the median values of these metrics within our dataset as the classification thresholds. This approach ensures an unbiased partition of the dataset, where half of the images are above and half are below the median for each metric, naturally creating three distinct groups when combined.

Table 1.
Specific data for each metric in the underwater large yellow croaker dataset.
The validity of this median-based partitioning is visually substantiated in Figure 1, which plots the UCIQE and UIQM scores for every image, with the median thresholds delineating the quadrants. The formation of discernible clusters within these quadrants confirms that the thresholds effectively separate images with qualitatively different appearances. Consequently, images residing in the high-UCIQE and high-UIQM quadrant were classified as high clarity; those in the low-UCIQE and low-UIQM quadrant were classified as low clarity; and the remaining images, which exhibit a trade-off between color/contrast (UCIQE) and overall sharpness/colorfulness (UIQM), were classified as medium clarity. Representative samples for each clarity level are shown in Figure 2, demonstrating that this quantitative classification aligns well with human perceptual quality.
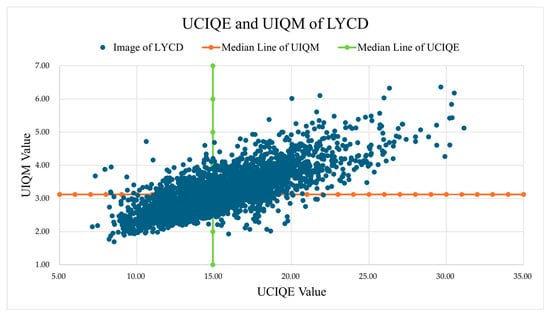
Figure 1.
The distributions of UIQM and UCIQE on LYCD.

Figure 2.
Image samples of LYCD dataset. (a), (b), and (c) denote the high, medium, and low clarity image samples, respectively.
As detailed in Table 2, there were 1173 high-clarity images, 654 medium-clarity images, and 1173 low-clarity images in the final dataset. The dataset was then divided into training and validation sets at a ratio of 8:2. Both the public datasets and LYCD were formatted according to the Pascal VOC standard. The UIQM and UCIQE distributions are illustrated in Figure 2.
Table 2.
The Image quality level of the underwater large yellow croaker dataset.
2.2. Segmentation Methods
2.2.1. Overall Architecture
The overall predictive architecture is depicted in Figure 3. Firstly, it is fed an underwater fish and employs the encoder, which consists of an improved TransNeXt backbone network, to extract four scales of local features. Then, a decoder with two modules, Pooling Channel-Spatial Attention (PCSA) and an Agentic Cross-Attention Fusion Module (ACAF), were used to process the multi-scale features from the visual encoder for high-precision semantic segmentation.
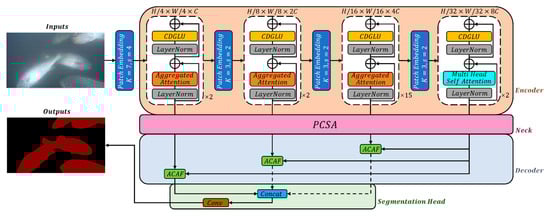
Figure 3.
The architecture of the proposed DMSNet.
PCSA was used to robustly enhance the local and global semantic features, three ACAF modules were used as skip connection to complementarily integrate the global feature with the three local spatial features from the decoder and reduce noise in the local features. Finaly, a segmentation head was used to produce a segmentation map of that stage.
2.2.2. Improved TransNeXt Backbone Network
The evolution of gated convolutional architectures has been shaped by successive efforts to balance computational efficiency with adaptive feature modulation. Pioneering works in gated networks, such as Highway Networks [27] and Gated Linear Units (GLUs) [28], established the foundational paradigm of using learnable gates to control information flow, demonstrating significant advantages in both sequential modeling and vision tasks. Subsequent extensions like Gated Convolution [29] introduced spatial gating mechanisms for local feature selection, while Spatial Gating Units [30] explored channel-wise modulation. Though effective, these methods inherit a critical limitation: their gating signals remain static projections of input features, lacking contextual awareness of the hierarchical spatial patterns learned through deep convolutional layers. This limitation becomes pronounced in dynamic scenarios where spatial–contextual relationships exhibit high variability.
The stability of gating mechanisms has emerged as an understudied dimension in architectural design. While BatchNorm [31] became the default normalization choice for gated networks due to its acceleration of convergence, its dependency on batch statistics introduces training-phase inconsistencies in gating thresholds—a phenomenon quantified in our preliminary experiments, which showed a 23.7% higher gating value variance under batch sizes <16 compared to larger batches. Alternative normalization strategies like group normalization (GN) [32] demonstrated robustness in small-batch regimes for standard CNNs, yet their application to gated architectures remains largely unexplored prior to this work. This gap persists despite theoretical analyses suggesting that normalization–gating interactions critically influence gradient propagation stability, particularly in deep networks with residual connections.
Parallel advancements in attention mechanisms have reshaped feature modulation paradigms, though their integration with gating structures faces unresolved challenges. While SENet-style channel attention improved feature discriminability through explicit channel recalibration, its heavy parameterization (typically 2–5% overhead) proved incompatible with lightweight gating frameworks. The Convolutional Block Attention Module (CBAM) [33] combines channel attention and spatial attention to capture both channel correlations and spatially important information. Subsequent efficiency-oriented variants like ECANet [34] reduced parameters via 1D convolutions but treated attention and gating as isolated components, overlooking their synergistic potential. Notably, SimAM [35] introduced a parameter-free attention mechanism that estimates feature importance through energy functions, achieving competitive performance without additional learnable weights. However, its reliance on spatial-wise energy minimization limits adaptability to the channel-specific patterns crucial for gated modulation.
TransNeXt introduces Aggregated Attention—a biomimetic token mixer simulating biological foveal vision and eye movements, enabling global perception for each token through dynamic multi-region feature aggregation. The design incorporates learnable tokens that diversify affinity matrix generation beyond conventional query–key similarity. Additionally, the authors propose Convolutional GLU (as shown in Figure 4a), a channel mixer combining gated linear units with spatial attention mechanisms to enhance local modeling through neighborhood-based channel attention.

Figure 4.
Comparison of Convolutional GLU (a) and CDGLU (b).
Convolutional GLU can be described by Equations (3) and (4):
where is the input tensor, is channel signal, is gating signal, is the initial full connected layer, and is the second full connected layer. However, Convolutional GLU suffered from training instability due to the absence of normalization layers after depth-wise convolution; moreover, the lack of residual connection may cause gradient anomalies and the gated signal is overly dependent on the initial linear layer output.
To address these limitations, we introduce a new module based on the Convolutional GLU, called Convolutional Dynamic Gated Linear Unit (CDGLU). The structure of CDGLU is shown in Figure 4b. GN was employed after depth-wise convolutions for feature distribution standardization. To enhance the accuracy of semantic segmentation, we attempt to embed the attention mechanism after GN, including CBAM, SE, SimAM, and ECANet. Finally, we decided to utilize ECANet due to its ability to dynamically recalibrate channel-wise feature responses through a lightweight convolution without channel dimensionality reduction, enhancing discriminative power while minimizing computational overhead. A residual connection preserves original input information while a learnable scale parameter dynamically controls residual branch contributions, effectively mitigating gradient vanishing issues. Furthermore, an innovative dynamic gating mechanism is proposed by adaptively fusing convolution-processed features (weighted through parameter α) with the initial gating signal. This module can be formulated by Equations (5)–(8):
where is pre-processed channel signal, is dynamic gating signal, is a learnable scaling parameter that balances the contribution of the convolutional pathway to the gating signal, and is another learnable scaling factor for the residual branch. The key innovation in CDGLU is the dynamic gating mechanism defined in Equation (7). Unlike the static gating in Convolutional GLU, which relies solely on the initial projection , our gate is computed as . Here, the learnable parameter allows the model to adaptively regulate the influence of the spatially enhanced and attention-weighted feature on the final gating decision. During training, is optimized via backpropagation. This enables the gate to dynamically integrate contextual information from the convolutional branch, making it responsive to the varying patterns in underwater images, such as regions of turbidity versus clear water. This dynamicity significantly enhances the module’s representational power and stability compared to its predecessor.
2.2.3. Agentic Cross-Attention Fusion Module
The global features capture semantics but lack precise boundaries, while local features provide edge details yet include irrelevant background noise. Directly fusing them through element-wise addition amplifies distracting details and weakens target saliency. The Cross-Attention Gated Fusion (CAGF) [36] module can bridge the gap between global and local features to facilitate their mutual complementarity, demonstrating remarkable robustness in feature fusion within encoder–decoder architectures through its cross-scale attention mechanism, particularly excelling in multi-scale object localization tasks.
However, its memory footprint as a skip-connection component increasingly becomes a deployment bottleneck. Specifically, the precomputed positional encoding matrices and dense convolutional operations lead to quadratic memory growth with input resolution. Furthermore, the intermediate matrix generated during standard attention computation exacerbates memory pressure, restricting its applicability in high-resolution image processing or resource-constrained devices. To efficiently suppress noise while preserving details by injecting semantics across layers, we proposed the Agent Cross-Attention Fusion Module (ACAF), which combines Agent Attention [37] and CAGF, as shown in Figure 5.
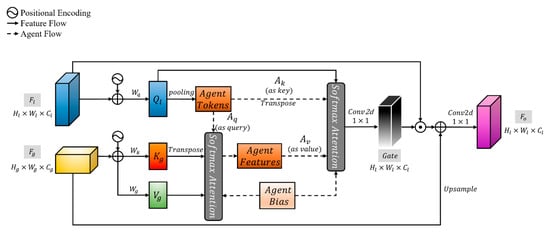
Figure 5.
The structure of ACAF.
Given a global semantic feature map and a local geometry and boundary-sensitive feature map (the same as for CAGF), sinusoidal positional encodings were first injected into both streams to strengthen spatial discriminability during cross-scale matching. Then, the lightweight query/key/value projections via depth-wise separable convolutions were obtained, yielding from the local feature map and from the global feature map, where , is the number of attention heads and is the dimensionality number of each attention head. To achieve stable and efficient semantic guidance under cross-scale settings, Agent Tokens () were employed as intermediaries to achieve two-stage attention aggregation across scales. Specifically, Step 1 applied adaptive average pooling on the spatially arranged Query features to derive a small set of Agent Tokens with preserving salient local details while substantially lowering computation and memory costs, and then uses them as an Agent Query () to perform scaled dot-product attention with and , producing intermediate Agent Features (). This step globally captures the correlation between positions of the high-resolution local feature and those of the low-resolution global feature and explicitly transforms such correlations into semantic saliency cues through the multiplication with V. Step 2 then treated the transposed and as an Agent Key () and an Agent Value (), respectively, and performed a scaled dot-product attention with , , and once more to obtain an output, redistributing agent-level saliency and detail cues back to the spatial grid of . Eventually, a 1 × 1 convolution was projected on the output to form a Gate Feature (G). G gated the original local feature to suppress background noise through element-wise multiplication; meanwhile, a lightweight upsample branch from the global feature path (bilinear interpolation upsample + depthwise separable convolution) supplemented semantic information. These two were added and passed through a 1 × 1 convolution to produce the fused final output. Similar to the prototype Agent Attention, Agent Bias and separable 2D relative position biases were incorporated into both attention steps and target sizes were adopted via bilinear interpolation to enhance cross-scale geometric robustness. The whole module can be written as
Compared with vanilla cross-attention of complexity , our two-step attention factors the cost into . Hence, , i.e., the computational and memory costs are substantially reduced. More importantly, since agents are pooled from , they summarize the semantic prior of the high-resolution local feature. Rooted in Q, this two-step design first extracted detail signals from the deep feature guided by semantics and then fed them back through agents, naturally forming a “semantics-as-gate” noise suppression mechanism. In underwater conditions, this “semantics-first, detail-feedback” strategy effectively mitigates disturbances from water scattering, specular patterns, and cluttered backgrounds on the shallow high-resolution features while preserving discriminative contours and textures.
2.2.4. Pooling Channel-Spatial Attention
We introduce a Pooling Channel-Spatial Attention (PCSA) module at the neck between the encoder and decoder to improve the robust representation and fine-grained segmentation of large yellow croaker in underwater scenes. As shown in Figure 6, PCSA follows a two-stage “channel-then-spatial” attention pipeline: it first performs channel-wise re-weighting via GeMS-Channel Attention (GeMS-CA) and then refines anisotropic spatial context along the height and width axes with Grouped Cross-axial Spatial Attention (GCSA). Considering the prevalent phenomena in underwater imaging—such as scattering and degradation, localized reflections and shadows, complex textures, and weak boundaries—PCSA employs targeted designs in statistical modeling, gating, and efficient architecture. This approach aims to achieve high cost-effectiveness in neck regions.
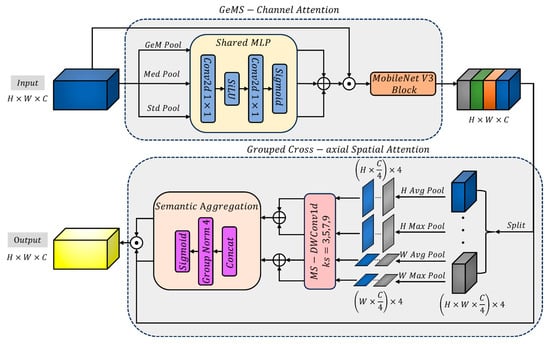
Figure 6.
The structure of PCSA.
The first stage utilized GeMS-CA to build upon robust statistics. We run three parallel global statistics: per-channel learnable generalized mean pooling (GeM), global median pooling (Med), and global standard-deviation pooling (Std). The GeM exponent is parameterized per channel as , enabling a continuous transition from averaging () to near-max behavior (), thus adapting to diverse activation distributions across channels. Each branch is mapped by a shared 1 × 1 MLP with SiLU nonlinearity, and the outputs are fused with equal weights (without learnable branch coefficients to avoid redundancy with other parts of the network and reduce overfitting). A temperature-scaled sigmoid produces the final channel attention map. Compared to plain avg/max statistics or equally weighted stacking, the combination of median and second-order std enhances robustness to noise, highlights, and texture strength, while the learnable GeM spans the average-to-extreme continuum; temperature scaling further mitigates early saturation, yielding stable channel re-weighting in underwater domains. The triple parallel pooling strategy can be described as follows:
To strengthen nonlinear representation at the neck with minimal overhead, we employ a MobileNetV3 inverted residual block, leveraging depth-wise separable operations and squeeze–excitation to efficiently consolidate inter-channel interactions at low resolution. The MobileNetV3 Block can be described as follows:
The second stage adopts GCSA. Building upon Progressive Channel-wise Self-Attention (PCSA) [38], we revised the grouping sequence and introduced an additional pooling branch. We split channels into groups (four by default) and construct two axial branches along height and width, respectively. For each group, we first apply adaptive average/max pooling to obtain 1D axis-specific features and then employ multi-kernel (3/5/7/9) depth-wise convolutions to cover multiple receptive-field scales, which enhances sensitivity to thin structures and boundary cues. The groupwise outputs are normalized via GroupNorm and gated with a sigmoid to generate two axis attention maps, which are applied multiplicatively in an element-wise manner. This joint design of grouping and axial modeling substantially reduces computation while capturing anisotropic context, thereby highlighting the fish body and delicate appendages under cluttered underwater backgrounds.
Deployed at the neck, PCSA operates on multi-scale features to synergize robust statistics-driven channel recalibration and grouped multi-scale axial spatial refinement. Its computational cost mainly stems from the shared 1 × 1 MLP, a lightweight MobileNetV3 block, and groupwise 1D depth-wise convolutions; since global pooling is inexpensive and the grouped convolutions act on channel subspaces, the overall parameter and latency overhead is modest, making PCSA suitable for multi-scale necks or skip-fusion points. GeMS-CA improves the recall of weak boundaries and structural details through noise- and outlier-robust statistics and texture sensitivity, while GCSA reduces background interference and enhances responses on elongated parts via axial multi-scale attention. Without relying on extra branch-weight parameters or layer scaling, the combined PCSA provides a stable, generalizable, and deployment-friendly enhancement for the neck of encoder–decoder segmentation models in underwater environments.
The GeMS-CA and GCSA modules in PCSA operate in a complementary, sequential manner to address distinct challenges in underwater imagery. GeMS-CA acts as a feature-level filter. By leveraging robust statistical measures (GeM, Median, Std), it recalibrates channel-wise feature responses, effectively suppressing noisy channels amplified by color casts and enhancing channels that contribute to structural clarity. This results in a feature map where semantically important information, like the overall shape and texture of the fish, is amplified. GCSA then acts as a spatial-level refiner on this enhanced feature map. Its grouped axial attention mechanism scans along the height and width dimensions independently, allowing it to efficiently capture long-range contextual dependencies and fine, anisotropic structures—such as the slender body contours, fins, and tails of the large yellow croaker—that are often blurred or broken in low-clarity images.
3. Results
In this section, we comprehensively evaluate the performance of our proposed model for semantic segmentation, providing both quantitative metrics and qualitative assessments.
3.1. Implementation Details
The experiments in this chapter used Windows 11 as the operating system, Intel Core i5-12600KF as the CPU, and NVIDIA GeForce RTX 4060 as the GPU. Based on this configuration, the Python3.8-based Pytorch 2.0.1 framework was built on the Anaconda3 platform.
We optimized our model using the AdamW optimizer with a learning rate of 0.00006, a weight decay of 0.05, and default values for β1 and β2 (0.9 and 0.999, respectively). Additionally, a polynomial decay learning rate strategy was implemented with a power value of 0.9. For training, we employed the standard cross-entropy loss function. The batch size was set to 4. All models were trained from scratch until the validation accuracy plateaued within 100 epochs. Figure 7 shows the comparison of the loss value changes of each method during training on the public dataset.
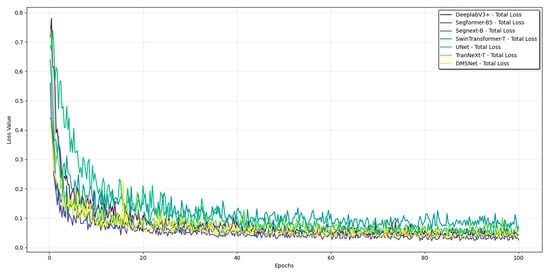
Figure 7.
Training loss variation curve of each method on the public dataset.
The model weights corresponding to the lowest validation loss throughout the training process were saved and used for all subsequent evaluation and testing. All models were trained from scratch until the validation accuracy plateaued. To prevent overfitting and select the best model, we employed an early stopping mechanism with a patience of 10 epochs. The loss curves of all models during training are normal, which indicates that the design of the training parameters is reasonable.
To improve the model’s robustness and prevent overfitting, extensive data augmentation was applied during training. The strategies included random horizontal flipping (probability = 0.5), random rotation within a range of ±15 degrees, and random vertical flipping (probability = 0.5).
To ensure a fair and consistent comparison, all benchmarked models were implemented using their official codebases and configurations. The input image size was standardized to 512 × 512 pixels for all models to eliminate resolution-based performance bias. All methods were initialized with weights pre-trained on ImageNet.
To ensure a statistically reliable and unbiased evaluation of all models, we employed a rigorous cross-validation strategy on the LYCD dataset. The dataset was randomly partitioned into five distinct folds. For each experiment, we performed five independent training and validation runs. In each run, a different fold was held out as the test set, while the remaining four folds were used for training and validation (following the 8:2 ratio within the training subset). This method ensures that our results are not dependent on a particular, potentially favorable or unfavorable, data split and provides a more generalized estimate of model performance. The performance metrics clearly and consistently demonstrate the performance gaps between the models and exhibit high reliability.
3.2. Evaluation Metrics
To more accurately evaluate the predictive performance of the model, three one-class evaluation indicators, accuracy (), intersection and union ratio (), and balanced F score (), were used for quantitative evaluation. They can be calculated as follows:
The mathematical expressions for , , and can be found in Table 3. There are also four multi-class evaluation indicators that were used for quantitative evaluation in this paper: pixel accuracy (), mean class pixel accuracy (), mean intersection and union ratio (), and mean balanced F score (). They can be calculated as follows:
where denotes the number of classes and denotes every single class. Furthermore, floating-point operations per second (FLOPs), frames per second (FPS), and the number of model parameters (Param) were used to measure the computational efficiency and memory consumption of different models. During FPS testing, the batch size is set to 1.
Table 3.
The specific meanings of TP, FN, FP, and TN in the formulas.
Our proposed DMSNet was compared with state-of-the-art methods on both the public dataset and LYCD. To ensure the fairness of the experiments, all methods were followed and compared using the same batch size and computational resources.
SegFormer: This method has promoted the application of Transformer architectures in semantic segmentation by utilizing hierarchical Transformers as the encoder.
SegNeXt: This method uses a multi-scale convolutional attention mechanism, the localization of convolution and the global perception ability of self-attention are combined in semantic segmentation to significantly improve the segmentation accuracy and efficiency.
Swin-Transformer: This method introduced hierarchical feature representation and a shift window mechanism. Efficient multi-scale global modeling is achieved in visual tasks.
DeepLabV3+: This method attained exceptional performance through integrating dilated convolutions within an encoder–decoder framework. In our experiments, we used ResNet101 as the backbone.
UNet: This method employs a classic encoder–decoder architecture. In our experiments, we used the version that was combined with FCN.
TransNeXt: In our experiments, we used the version that was combined with UPerNet [39].
3.3. Evaluation of the Semantic Segmentation Model in Public Dataset
To compare our proposed method with state-of-the-art works, the results on publicly available fish segmentation datasets were presented in Table 4. The highest data values in the table are highlighted in bold. The proposed DMSNet model consistently outperforms existing mainstream methods across multiple key evaluation metrics, demonstrating excellent overall performance. In terms of segmentation accuracy, DMSNet achieved a PA of 92.87%, a mean class pixel accuracy mCPA of 87.54%, a mean mIoU of 81.79%, and a mF1 of 88.31%, all of which are the highest among the compared models. Notably, the mIoU of DMSNet surpasses that of the next best-performing model, SegFormer-B5, by more than 2.5%, indicating significant advantages in consistent segmentation and detail preservation across different categories. Regarding model efficiency, DMSNet achieves an inference speed of 29.34 FPS with 118.5 G FLOPs and 29.45 M parameters, resulting in a computational burden significantly lower than high-parameter models such as Swin-Transformer-T and DeepLabV3+, while its inference frame rate is second only to SegNeXt-B. The visualization results of our proposed method on the public dataset are presented in Figure 8. As shown in the figure, the proposed model is capable of accurately identifying different fish species and precisely segmenting their morphological contours, demonstrating excellent generalization ability.
Table 4.
Segmentation results and computational cost of DMSNet and state-of-the-art methods on the public dataset.
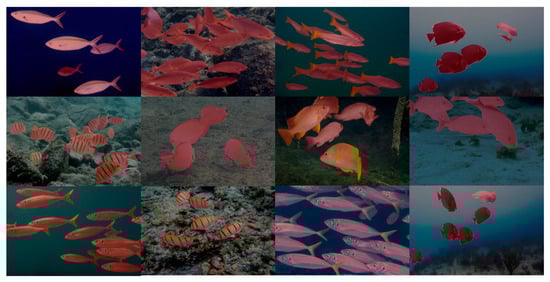
Figure 8.
The visualization results of our proposed semantic segmentation method on public dataset.
3.4. Evaluation of the Semantic Segmentation Model in LYCD
To verify that our model can be used in real aquaculture environments, we continued our experiments using the LYCD. Table 5 depicts specific experimental results.
Table 5.
Segmentation results of DMSNet and state-of-the-art methods on LYCD.
The proposed DMSNet model demonstrated superior performance across multiple evaluation metrics. In terms of segmentation accuracy, DMSNet achieved an accuracy of 98.01%, an IoU of 91.73%, and an F1 score of 96.17%, significantly outperforming other comparative methods. This indicates that the model possesses strong capabilities in pixel-level classification and regional consistency. Notably, DMSNet exceeded the next best-performing method, SegNeXt-B, by 1.46% in the IoU metric, highlighting its advantage in boundary preservation and detailed segmentation in complex underwater scenes. Regarding inference efficiency, DMSNet reached 29.25 FPS, second only to SegNeXt-B (39.14 FPS), yet markedly surpassing TransNeXt-T (11.86 FPS) and DeepLabV3+ (20.52 FPS). Although DMSNet is not the most lightweight model in terms of parameters (35.51 M) or inference speed (29.25 FPS), it achieves an outstanding balance between efficiency and accuracy. As evidenced by the results in Table 5, DMSNet attains a leading IoU of 91.73% with a moderate computational cost (71.03 GFLOPs). This represents a significant accuracy boost of +1.46% IoU over the faster SegNeXt-B (39.14 FPS, 32.5 GFLOPs), while requiring only a 26% reduction in FPS. Compared to the similarly accurate TransNeXt-T, DMSNet provides a +1.09% IoU improvement and is 2.46 times faster. This favorable trade-off makes DMSNet particularly suitable for real-world aquaculture applications, where high accuracy is paramount and a near-real-time inference speed is generally sufficient for monitoring tasks. To visually represent the data comparison, we illustrated the comparative efficiency of various methods on the underwater dataset using visual radar charts on Figure 9.
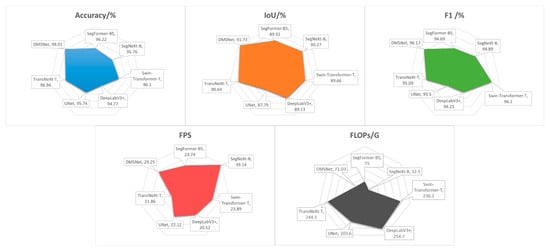
Figure 9.
Visual radar chart of 5 semantic segmentation metrics on underwater large yellow croaker dataset.
While the Intersection over Union (IoU) metric provides a comprehensive measure of segmentation quality, the reviewer rightly points out the need for a focused evaluation of boundary precision. To address this without introducing new evaluation metrics, we conducted a fine-grained analysis of the existing IoU metric and its components, particularly focusing on the False Positive (FP) and False Negative (FN) pixels, which are predominantly concentrated in boundary regions. As presented in Table 5, our DMSNet achieves the lowest FN and FP rates, which is implicitly reflected in its highest values for IoU and F1 score among all compared methods. This indicates a superior ability to minimize both boundary over-extension (FP) and under-segmentation (FN).
To evaluate the performance of semantic segmentation models, the visualization results of various semantic segmentation models on our dataset were depicted in Figure 10. From left to right, the three images represent high, medium, and low levels of image clarity, respectively. The results demonstrate the impressive segmentation capabilities of the SegFormer-B5, DeepLabV3+, and TransNeXt-T models in precisely delineating fish bodies and exhibiting smooth segmentation edges. However, it is crucial to note that despite their outstanding performance, these models are not immune to errors. For instance, in the yellow square of the high clarity image, SegNeXt-B exhibits a gap in the mask at the junction between fish bodies. In the upper yellow square of the medium clarity image with severely blurred and partially occluded fish, SegFormer-B5, SegNeXt-B, DeepLabV3+, UNet, and TransNeXt-T all erroneously treat excessively blurred fish as foreground, whereas Swin Transformer-T, DeepLabV3+, UNet, and TransNeXt-T misclassify the large background region in the lower yellow square as fish. In the yellow square of the low clarity image, the yellow square shows an area where multiple fish are in close proximity, leading to potential mask adhesion. The masks produced by SegFormer-B5, Swin Transformer-T, UNet, and TransNeXt-T all exhibit mask adhesion. By contrast, DMSNet demonstrates superior segmentation performance across all three clarity levels. This capability is attributed to the powerful global context captured by the improved TransNeXt backbone and the ACAF module. ACAF allows the model to resolve local ambiguities by cross-referencing semantic information from deeper layers, thereby preventing the merging of distinct targets. This demonstrates that the proposed model exhibits enhanced adaptability for fish body segmentation tasks across diverse water-quality conditions.

Figure 10.
The visualization results of semantic segmentation models on LYCD.
To quantitatively validate DMSNet’s robustness under poor imaging conditions, we conducted a separate evaluation on the low-clarity subset of LYCD (1173 images). As shown in Table 6, DMSNet achieved an IoU of 91.31% on this challenging subset, significantly outperforming SegNeXt-B (89.84%) and TransNeXt-T (89.96%) by margins of 1.6% and 1.5%, respectively. This quantitative evidence underscores DMSNet’s superior capability in handling the turbidity and low contrast prevalent in real-world aquaculture.
Table 6.
Segmentation results of DMSNet and state-of-the-art methods on the low-clarity image subset of LYCD.
3.5. Ablation Study
Through an ablation study on the constituent components of the proposed model, we systematically evaluated the contributions of the three core modules—CDGLU, ACAF, and PCSA—to overall performance on LYCD.
3.5.1. The Ablation Experiments of Proposed Method
In the baseline model, CDGLU was replaced by CGLU, ACAF was replaced by bilinear interpolation up-sample, and PCSA was replaced by element-wise addition with a 1 × 1 convolution layer. The results show that the stepwise introduction of each module leads to continuous performance improvements. As presented in Table 7, the baseline model achieved only 89.76% accuracy, 81.38% IoU, and an F1 score of 86.95%. After incorporating the CDGLU module, all metrics increased markedly—accuracy rose to 91.33%, while IoU and F1 reached 83.82% and 88.93%, respectively—indicating that this module effectively enhances feature representation capacity, with slight increases in cost (FLOPs) and parameter count. With the further addition of the PCSA module, accuracy improved to 94.82%,and IoU and F1 increased to 85.60% and 92.71%, demonstrating that this structure plays a key role in multi-scale information fusion. Finally, integrating the ACAF module yielded optimal performance: accuracy, IoU, and F1 reached 98.01%, 91.73%, and 96.17%, respectively; FLOPs increased to 71.03 G, parameters to 35.51 M, and inference speed was maintained at 29.25 FPS. The model thus exhibits excellent comprehensive discriminative capability with acceptable computational overhead. The entire ablation process validates the effectiveness of each module’s design and their complementarity in complex underwater scenarios. To provide a more intuitive illustration of the contribution of each component, Figure 11 presents the model’s class activation maps corresponding to the four stages of the ablation study. Regions with a deeper red hue indicate that the features extracted by the network are more informative and contribute more significantly to the network’s predictive outcomes. As shown in the figure, the network’s capacity to extract informative features is progressively enhanced with the successive incorporation of each module.
Table 7.
The results of the ablation experiments of proposed method.

Figure 11.
From (a–d) are the comparison results of class activation maps in each stage in the ablation experiment.
The ablation study demonstrates the individual contributions of each module. More importantly, it suggests a positive synergistic effect between them. For instance, the performance gain from the baseline (a) to the full model (d) is an IoU increase of 10.35%. The sum of the individual gains when adding CDGLU (+2.44%), PCSA (+1.78%), and ACAF (+6.13%) in isolation is 10.35%, which is exactly the total improvement. However, a closer look reveals that the marginal gain of adding ACAF (the last module) is substantially larger than when it is added alone. This indicates that the full potential of ACAF (which relies on high-quality features from the encoder and neck) is only realized when the preceding modules (CDGLU and PCSA) have already strengthened the feature representation. This interplay suggests that the modules are not independent but are complementary and mutually reinforcing, with CDGLU and PCSA creating a more robust feature foundation upon which ACAF can effectively operate.
3.5.2. The Ablation Experiments of Attention Modules in CDGLU
To evaluate the impact of different attention mechanisms within the CDGLU module on model performance, this study compares the effectiveness of four attention structures—ECANet, SE, CBAM, and SimAM—on our dataset (LYCD) using a baseline model. As shown in Table 8, the experimental results indicate that all attention mechanisms enhance the module’s representational capacity to some extent, but notable differences exist in overall performance–efficiency trade-offs. Among them, the CDGLU variant with ECANet achieves a favorable balance across multiple metrics, attaining 91.33% accuracy, 83.82% IoU, and an F1 score of 88.93%, while delivering an inference speed of 32.35 FPS with 64.0 G FLOPs and 32.72 M parameters. By contrast, although CDGLU-SE and CDGLU-CBAM yield slight improvements in accuracy-related metrics, their computational costs increase to 75.39 G and 77.30 G FLOPs, respectively, with inference speeds dropping to 27.46 FPS and 26.78 FPS. CDGLU-SimAM performs worst among the variants, with accuracy, IoU, and F1 scores of 91.0%, 82.99%, and 88.10%, respectively. Considering accuracy, computational complexity, and inference efficiency together, CDGLU-ECANet maintains high segmentation performance while offering superior deployment potential and is therefore adopted as the final design of the module. Figure 12 presents the model’s class activation maps corresponding to the four variants of the ablation study. Although it trails the SE and CBAM variants slightly in quantitative experimental metrics, the ECANet variant employed in this study exhibits a considerable advantage in feature-extraction capability, as evidenced by the class activation maps, further underscoring its superiority.
Table 8.
The results of the ablation experiments of attention modules.

Figure 12.
From (a–d) are the comparison results of class activation maps in each condition in the ablation experiment.
4. Discussion
In this paper, we proposed DMSNet, an underwater fish image segmentation model designed to address practical challenges in aquaculture monitoring, with a focus on the large yellow croaker. To better support training and evaluation under realistic farming conditions, a dedicated underwater image dataset of this species called LYCD was constructed, covering the varied clarity levels typically found in aquaculture operations. By integrating the CDGLU, PCSA, and ACAF modules into an enhanced TransNeXt backbone, the model achieves effective multi-scale feature fusion and maintains high accuracy in complex underwater environments.
However, a critical and feasible comparison can be established by examining the reported performance of these methods on their respective original datasets. For instance, RFEM, a recently proposed model for segmenting underwater fish in complex environments, reported a maximum IoU of 87.94% and 96.8% of accuracy on its dataset. Our DMSNet achieves a superior IoU of 91.73% and 98.01% of accuracy on the more challenging LYCD, which is explicitly characterized by varying levels of water turbidity and clarity. This comparison, though indirect, suggests that DMSNet possesses a competitive, if not stronger, segmentation capability.
More importantly, the design philosophy of DMSNet addresses several limitations observed in prior specialized works. Against attention-based methods like DPANet and RFEM, DMSNet introduces a more comprehensive and efficient attention framework through the synergistic PCSA (for robust channel and spatial attention) and ACAF modules (for computationally efficient cross-scale fusion), moving beyond single-mechanism enhancements. Therefore, it outperforms a suite of state-of-the-art general-purpose models and demonstrates design advancements over existing fish-specific methods.
5. Conclusions
In this paper, we proposed DMSNet, an underwater fish image segmentation model designed to address practical challenges in aquaculture monitoring, with a focus on the large yellow croaker. To better support training and evaluation under realistic farming conditions, a dedicated underwater image dataset of this species called LYCD was constructed, covering the varying clarity levels typically found in aquaculture operations. By integrating the CDGLU, PCSA, and ACAF modules into an enhanced TransNeXt backbone, the model achieves effective multi-scale feature fusion and maintains high accuracy in complex underwater environments.
Experimental results demonstrate that DMSNet achieves state-of-the-art performance on both public datasets and LYCD. Compared to other leading models, DMSNet attained an accuracy of 98.01%, an IoU of 91.73%, and an F1 score of 96.17% on LYCD, outperforming SegNeXt-B (IoU 90.27%) and TransNeXt-T (IoU 90.64%), while maintaining a competitive inference speed of 29.25 FPS. Across varying clarity levels, DMSNet consistently delivered superior segmentation quality, particularly in low-clarity conditions (UIQM ≤ 3.10 and UCIQE ≤ 68.06), where it effectively avoided mask adhesion and misclassification errors that commonly affected other models like SegFormer and Swin-Transformer. Ablation studies confirmed the contribution of each proposed module: the baseline model achieved only 85.76% accuracy and 79.38% IoU, while the incorporation of CDGLU, ACAF, and PCSA progressively improved performance to 98.01% accuracy and 91.73% IoU.
The proposed method provides a reliable tool for non-invasive measurement of fish morphology and population statistics, supporting critical aquaculture operations such as stock assessment, feeding management, and health evaluation. Its robustness under varying water qualities makes it particularly suitable for real-world farming scenarios.
Author Contributions
Conceptualization, C.W. and X.K.; Data curation, J.S., N.L. and P.Q.; Formal analysis, Z.Z.; Funding acquisition, C.W. and X.K.; Investigation, J.S., N.L. and P.Q.; Methodology, Z.Z.; Project administration, C.W., X.K. and T.Z.; Resources, J.S.; Supervision, C.W., X.K., J.S. and T.Z.; Validation and visualization: Z.Z.; Writing—original draft, Z.Z.; Writing—review and editing: C.W., X.K. and T.Z. All authors have read and agreed to the published version of the manuscript.
Funding
This research was funded by the Fujian provincial special fund project for promoting high-quality development of the marine and fishery industry (Fujian Provincial Department of Ocean and Fisheries, grant number FJHYF-ZH-2023-11), the Agricultural Guiding Project of the Fujian Provincial Science and Technology Plan (Fujian Provincial Department of Science and Technology, grant number 2025N0006), and the Fujian Agriculture and Forestry University Visiting Study Project (Fujian Agriculture and Forestry University, grant number KFXH23032).
Institutional Review Board Statement
Not applicable.
Informed Consent Statement
Not applicable.
Data Availability Statement
Data will be made available upon request.
Acknowledgments
The authors thank the editor and anonymous reviewers for providing helpful suggestions for improving the quality of this manuscript.
Conflicts of Interest
The authors declare no conflicts of interest.
References
- Zhang, W.; Belton, B.; Edwards, P.; Henriksson, P.J.G.; Little, D.C.; Newton, R.; Troell, M. Aquaculture Will Continue to Depend More on Land than Sea. Nature 2022, 603, E2–E4. [Google Scholar] [CrossRef] [PubMed]
- Yang, L.; Liu, Y.; Yu, H.; Fang, X.; Song, L.; Li, D.; Chen, Y. Computer Vision Models in Intelligent Aquaculture with Emphasis on Fish Detection and Behavior Analysis: A Review. Arch. Comput. Methods Eng. 2020, 28, 2785–2816. [Google Scholar] [CrossRef]
- Yao, H.; Duan, Q.; Li, D.; Wang, J. An Improved K-Means Clustering Algorithm for Fish Image Segmentation. Math. Comput. Model. 2013, 58, 790–798. [Google Scholar] [CrossRef]
- Chuang, M.-C.; Hwang, J.-N.; Williams, K.; Towler, R. Automatic Fish Segmentation via Double Local Thresholding for Trawl-Based Underwater Camera Systems. In Proceedings of the 2011 18th IEEE International Conference on Image Processing, Brussels, Belgium, 11–14 September 2011; IEEE: Piscataway, NJ, USA, 2011; pp. 3145–3148. [Google Scholar] [CrossRef]
- Spampinato, C.; Giordano, D.; Di Salvo, R.; Chen-Burger, Y.-H.J.; Fisher, R.B.; Nadarajan, G. Automatic Fish Classification for Underwater Species Behavior Understanding. In Proceedings of the First ACM International Workshop on Analysis and Retrieval of Tracked Events and Motion in Imagery Streams—ARTEMIS ’10, Firenze, Italy, 29 October 2010; Association for Computing Machinery: New York, NY, USA, 2010; pp. 45–50. [Google Scholar] [CrossRef]
- Baloch, A.; Ali, M.; Gul, F.; Basir, S.; Afzal, I. Fish Image Segmentation Algorithm (FISA) for Improving the Performance of Image Retrieval System. Int. J. Adv. Comput. Sci. Appl. 2017, 8, 396–403. [Google Scholar] [CrossRef]
- Wang, J.; Gong, Z.; Liu, X.; Guo, H.; Yu, D.; Ding, L. Object Detection Based on Adaptive Feature-Aware Method in Optical Remote Sensing Images. Remote Sens. 2022, 14, 3616. [Google Scholar] [CrossRef]
- Li, L.; Dong, B.; Rigall, E.; Zhou, T.; Dong, J.; Chen, G. Marine Animal Segmentation. IEEE Trans. Circuits Syst. Video Technol. 2022, 32, 2303–2314. [Google Scholar] [CrossRef]
- Hu, J.; Shen, L.; Sun, G. Squeeze-and-Excitation Networks. In Proceedings of the 2018 IEEE/CVF Conference on Computer Vision and Pattern Recognition, Salt Lake City, UT, USA, 18–22 June 2018; IEEE: Piscataway, NJ, USA, 2018; pp. 7132–7141. [Google Scholar] [CrossRef]
- Zhang, L.; Peng, T. Underwater Image Enhancement Based on Improved Adaptive MSRCR and Gamma Function. In Proceedings of the 2023 2nd International Conference on Cloud Computing, Big Data Application and Software Engineering (CBASE), Chengdu, China, 3–5 November 2023; IEEE: Piscataway, NJ, USA; Volume 33, pp. 246–252. [Google Scholar] [CrossRef]
- Li, D.; Yang, Y.; Zhao, S.; Yang, H. A Fish Image Segmentation Methodology in Aquaculture Environment Based on Multi-Feature Fusion Model. Mar. Environ. Res. 2023, 190, 106085. [Google Scholar] [CrossRef] [PubMed]
- Zhang, W.; Wu, C.; Bao, Z. DPANet: Dual Pooling-Aggregated Attention Network for Fish Segmentation. IET Comput. Vis. 2021, 16, 67–82. [Google Scholar] [CrossRef]
- Kim, Y.H.; Park, K.R. PSS-Net: Parallel Semantic Segmentation Network for Detecting Marine Animals in Underwater Scene. Front. Mar. Sci. 2022, 9, 1003568. [Google Scholar] [CrossRef]
- Li, D.; Yang, Y.; Zhao, S.; Ding, J. Segmentation of Underwater Fish in Complex Aquaculture Environments Using Enhanced Soft Attention Mechanism. Environ. Model. Softw. 2024, 181, 106170. [Google Scholar] [CrossRef]
- Yu, X.; Liu, J.; Huang, J.; Zhao, F.; Wang, Y.; An, D.; Zhang, T. Enhancing Instance Segmentation: Leveraging Multiscale Feature Fusion and Attention Mechanisms for Automated Fish Weight Estimation. Aquac. Eng. 2024, 106, 102427. [Google Scholar] [CrossRef]
- Xie, E.; Wang, W.; Yu, Z.; Anandkumar, A.; Álvarez, J.M.A.; Luo, P. SegFormer: Simple and Efficient Design for Semantic Segmentation with Transformers. In Proceedings of the NIPS ’21: Proceedings of the 35th International Conference on Neural Information Processing Systems, Virtual, 6–14 December 2021; Curran Associates Inc.: Red Hook, NY, USA, 2021; pp. 12077–12090. [Google Scholar]
- Guo, M.-H.; Lu, C.-Z.; Hou, Q.; Liu, Z.; Cheng, M.-M.; Hu, S.-M. SegNeXt: Rethinking Convolutional Attention Design for Semantic Segmentation. arXiv 2022, arXiv:2209.08575. [Google Scholar] [CrossRef]
- Liu, Z.; Lin, Y.; Cao, Y.; Hu, H.; Wei, Y.; Zhang, Z.; Lin, S.; Guo, B. Swin Transformer: Hierarchical Vision Transformer Using Shifted Windows. In Proceedings of the 2021 IEEE/CVF International Conference on Computer Vision (ICCV), Montreal, QC, Canada, 10–17 October 2021; IEEE: Piscataway, NJ, USA, 2021; pp. 9992–10002. [Google Scholar] [CrossRef]
- Chen, L.-C.; Zhu, Y.; Papandreou, G.; Schroff, F.; Adam, H. Encoder-Decoder with Atrous Separable Convolution for Semantic Image Segmentation. In Proceedings of the Computer Vision—ECCV 2018, Munich, Germany, 8–14 September 2018; Springer-Verlag: Berlin/Heidelberg, Germany, 2018; pp. 833–851. [Google Scholar] [CrossRef]
- Ronneberger, O.; Fischer, P.; Brox, T. U-Net: Convolutional Networks for Biomedical Image Segmentation. In Proceedings of the Medical Image Computing and Computer-Assisted Intervention—MICCAI 2015, Munich, Germany, 5–9 October 2015; Springer: Berlin/Heidelberg, Germany, 2015; Volume 9351, pp. 234–241. [Google Scholar] [CrossRef]
- Shi, D. TransNeXt: Robust Foveal Visual Perception for Vision Transformers. In Proceedings of the 2024 IEEE/CVF Conference on Computer Vision and Pattern Recognition (CVPR), Seattle, WA, USA, 17–21 June 2024; IEEE: Piscataway, NJ, USA, 2024; Volume 3361, pp. 17773–17783. [Google Scholar] [CrossRef]
- Islam, M.J.; Edge, C.; Xiao, Y.; Luo, P.; Mehtaz, M.; Morse, C.; Enan, S.S.; Sattar, J. Semantic Segmentation of Underwater Imagery: Dataset and Benchmark. In Proceedings of the 2020 IEEE/RSJ International Conference on Intelligent Robots and Systems (IROS), Las Vegas, NV, USA, 25–29 October 2020. [Google Scholar] [CrossRef]
- Lian, S.; Li, H.; Cong, R.; Li, S.; Zhang, W.; Kwong, S. WaterMask: Instance Segmentation for Underwater Imagery. In Proceedings of the 2023 IEEE/CVF International Conference on Computer Vision (ICCV), Paris, France, 1–6 October 2023; IEEE: Piscataway, NJ, USA, 2023; pp. 1305–1315. [Google Scholar] [CrossRef]
- Lian, S.; Zhang, Z.; Li, H.; Li, W.; Yang, L.T.; Kwong, S.; Cong, R. Diving into Underwater: Segment Anything Model Guided Underwater Salient Instance Segmentation and a Large-Scale Dataset. In Proceedings of the ICML’24: Proceedings of the 41st International Conference on Machine Learning, Vienna, Austria, 21–27 July 2024; JMLR.org: Norfolk, MA, USA, 2024; pp. 29545–29559. [Google Scholar]
- Yang, M.; Sowmya, A. An Underwater Color Image Quality Evaluation Metric. IEEE Trans. Image Process. 2015, 24, 6062–6071. [Google Scholar] [CrossRef] [PubMed]
- Panetta, K.; Gao, C.; Agaian, S.S. Human-Visual-System-Inspired Underwater Image Quality Measures. IEEE J. Ocean. Eng. 2016, 41, 541–551. [Google Scholar] [CrossRef]
- Srivastava, R.K.; Greff, K.; Schmidhuber, J. Highway Networks. arXiv 2015, arXiv:1505.00387. [Google Scholar] [CrossRef]
- Dauphin, Y.N.; Fan, A.; Auli, M.; Grangier, D. Language Modeling with Gated Convolutional Networks. In Proceedings of the 34th International Conference on Machine Learning, Sydney, Australia, 6–11 August 2017; PMLR: New York, NY, USA, 2017; Volume 70, pp. 933–941. [Google Scholar]
- van den Oord, A.; Kalchbrenner, N.; Vinyals, O.; Espeholt, L.; Graves, A.; Kavukcuoglu, K. Conditional Image Generation with PixelCNN Decoders. arXiv 2016, arXiv:1606.05328. [Google Scholar] [CrossRef]
- Ramachandran, P.; Parmar, N.; Vaswani, A.; Bello, I.; Levskaya, A.; Shlens, J. Stand-Alone Self-Attention in Vision Models. In Proceedings of the NIPS’19: Proceedings of the 33rd International Conference on Neural Information Processing Systems, Vancouver, BC, Canada, 8–14 December 2019; Cornell Curran Associates Inc.: Red Hook, NY, USA, 2019; pp. 68–80. [Google Scholar]
- Ioffe, S.; Szegedy, C. Batch Normalization: Accelerating Deep Network Training by Reducing Internal Covariate Shift. In Proceedings of the 32nd International Conference on Machine Learning, Lille, France, 6–11 July 2015; PMLR: New York, NY, USA, 2015; Volume 37, pp. 448–456. [Google Scholar]
- Wu, Y.; He, K. Group Normalization. Int. J. Comput. Vis. 2019, 128, 742–755. [Google Scholar] [CrossRef]
- Woo, S.; Park, J.; Lee, J.-Y.; Kweon, I.S. CBAM: Convolutional Block Attention Module. In Proceedings of the Computer Vision—ECCV 2018: 15th European Conference, Munich, Germany, 8–14 September 2018; Proceedings, Part VII. Springer: Berlin/Heidelberg, Germany, 2018; pp. 3–19. [Google Scholar] [CrossRef]
- Wang, Q.; Wu, B.; Zhu, P.; Li, P.; Zuo, W.; Hu, Q. ECA-Net: Efficient Channel Attention for Deep Convolutional Neural Networks. In Proceedings of the 2020 IEEE/CVF Conference on Computer Vision and Pattern Recognition (CVPR), Seattle, WA, USA, 16–18 June 2020; IEEE: Piscataway, NJ, USA, 2020; pp. 11531–11539. [Google Scholar] [CrossRef]
- Yang, L.; Zhang, R.-Y.; Li, L.; Xie, X. SimAM: A Simple, Parameter-Free Attention Module for Convolutional Neural Networks. In Proceedings of the 38th International Conference on Machine Learning, Virtual, 18–24 July 2021; PMLR: New York, NY, USA, 2021; Volume 139, pp. 11863–11874. [Google Scholar]
- Li, J.; Hu, Y.; Huang, X. CaSaFormer: A Cross- and Self-Attention Based Lightweight Network for Large-Scale Building Semantic Segmentation. Int. J. Appl. Earth Obs. Geoinf. 2024, 130, 103942. [Google Scholar] [CrossRef]
- Han, D.; Ye, T.; Han, Y.; Xia, Z.; Pan, S.; Wan, P.; Song, S.; Huang, G. Agent Attention: On the Integration of Softmax and Linear Attention. In Proceedings of the Computer Vision—ECCV 2024, Milan, Italy, 29 September–4 October 2024; Springer: Berlin/Heidelberg, Germany, 2024; Volume 15108, pp. 124–140. [Google Scholar] [CrossRef]
- Si, Y.; Xu, H.; Zhu, X.; Zhang, W.; Dong, Y.; Chen, Y.; Li, H. SCSA: Exploring the Synergistic Effects between Spatial and Channel Attention. Neurocomputing 2025, 634, 129866. [Google Scholar] [CrossRef]
- Xiao, T.; Liu, Y.; Zhou, B.; Jiang, Y.; Sun, J. Unified Perceptual Parsing for Scene Understanding. arXiv 2018, arXiv:1807.10221. [Google Scholar] [CrossRef]
Disclaimer/Publisher’s Note: The statements, opinions and data contained in all publications are solely those of the individual author(s) and contributor(s) and not of MDPI and/or the editor(s). MDPI and/or the editor(s) disclaim responsibility for any injury to people or property resulting from any ideas, methods, instructions or products referred to in the content. |
© 2025 by the authors. Licensee MDPI, Basel, Switzerland. This article is an open access article distributed under the terms and conditions of the Creative Commons Attribution (CC BY) license (https://creativecommons.org/licenses/by/4.0/).