Abstract
Marine heatwaves (MHWs) have become increasingly frequent and intense, raising concerns about their impacts on fisheries production and economic value. We present a global assessment of MHW-related impacts across 2088 marine fisheries from 1985 to 2022. Using high-resolution satellite data and standardized catch production and catch value, we identified significant reductions in catch and ex-vessel value during years of elevated thermal stress. A total of 322 fisheries (15%) showed statistically significant declines during years with high MHW activity, with regional disparities indicating that the Northeast Atlantic and Southeast Pacific experienced the highest cumulative losses, while country ranking highlighted Norway, China, Japan, and Peru as the most affected. Estimated accumulated global losses since 1985 exceeded 5.6 million tonnes and USD 6.6 billion (2005 USD equivalents), nearly 40% of which occurred during 2013–2022. These findings emphasize the need to incorporate extreme thermal events into fisheries risk assessments and adaptation strategies, especially in highly productive or strategic regions.
Keywords:
marine heatwaves; fisheries production; economic losses; catch decline; small pelagic fisheries; Mediterranean Sea; thermal anomalies; spatiotemporal trends; high-income countries; time series analysis Key Contribution:
This study presents a global empirical assessment of marine heatwave impacts on fisheries production and value, showing that 15% of fisheries experienced significant losses, particularly in high-income countries and major regions such as the Northeast Atlantic and Southeast Pacific.
1. Introduction
Marine fisheries are essential for food security and the economic well-being of millions of people around the world. Aquatic products are an accessible source of key nutrients such as essential fatty acids, vitamins, and minerals that are often scarce in other diets [1,2]. This nutritional richness is especially critical in regions with limited access to diverse foods, such as many developing countries in Africa, Asia, and Latin America [3,4]. Moreover, the fisheries sector plays a strategic role in international trade and employment, generating income and supporting livelihoods in coastal areas. For instance, in 2022, global aquatic food production reached 185.4 million tonnes, of which nearly 90% was destined for direct human consumption [5]. However, its sustainability is increasingly threatened by environmental and climatic pressures.
In recent years, marine heatwaves (MHWs) have emerged as an extreme climatic phenomenon with profound implications for ocean ecosystems [6,7,8]. Evidence shows that these events have increased in frequency, duration, and intensity across various regions of the world, with potential repercussions for the structure and productivity of marine systems [6,9,10]. Their growing recurrence has raised concerns about possible economic consequences that still require further examination. MHWs are characterized by regional-scale anomalous increases in sea surface temperature that persist for several days or weeks. In this study, we adopted the quantitative definition proposed in [11,12], according to which an MHW occurs when sea temperature exceeds the 90th percentile of the historical average of a given region for at least five consecutive days.
Environmental temperature is a primary driver of ectotherm performance, directly regulating biochemical and cellular processes and shaping metabolic activity, development, reproduction, and survival [13,14]. With climate change driving temperature increases, many organisms are approaching their upper thermal tolerance limits [15,16]. Coupled with the rising frequency of extreme events, such as MHWs, this trend increases the likelihood that local temperatures will temporarily exceed thresholds that disrupt ecosystem functioning and processes such as growth and reproduction [17]. Despite the rapid expansion of MHW research, most studies have focused on physical drivers or ecological responses, while systematic evaluations of fisheries impact remain scarce [18]. Available evidence is largely restricted to local or taxon-specific case studies, such as declines in anchoveta catches during El Niño events in Peru [5] or impacts on crustaceans in subtropical regions [19,20].
While informative, these fragmented approaches do not allow the identification of global patterns of fisheries impacts and associated socioeconomic consequences. This gap hampers our ability to understand how extreme thermal events disrupt fisheries at broader scales, underscoring the need for empirical assessments that integrate ecological and economic dimensions.
To evaluate the extent to which intense MHWs can lead to significant declines in the production and economic value of marine fisheries, we conducted a global empirical analysis encompassing 2088 fisheries over the 1985 to 2022 period. We estimated the production and economic decreases occurring during abnormally high MHW activity. These losses were examined at the global scale, by taxonomic groups, geographic regions, and national income levels. In addition, we analyzed in more detail two case studies, one regional and one taxonomic, to explore specific patterns of vulnerability and temporal consistency that cannot be detected at the global-scale analysis.
2. Materials and Methods
A schematic representation of data processing workflow is provided in Figure 1.
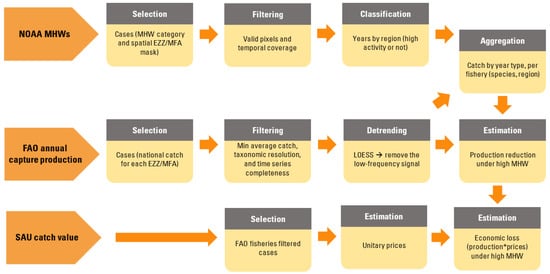
Figure 1.
Schematic workflow of the methodological steps used in this study. The analysis integrates global datasets (NOAA marine heatwaves, FAO fisheries catches, and Sea Around Us ex-vessel prices), applies spatial and quality filtering, removes long-term trends in catch series using LOESS smoothing, classifies years of high MHW activity (Category ≥ 2; ≥1.5× long-term mean), and tests for significant differences with t-tests (lags 0–3). Significant declines are then aggregated to estimate production and economic losses by taxon, region, and income level, including two case studies (Mediterranean Sea and small pelagics).
2.1. Marine Heatwave Detection and Classification
Marine heatwave activity was estimated using the Daily Global 5 km Satellite Monitoring Marine Heatwave Watch, Version 1.0.1 (released on 21 September 2021), publicly available through NOAA Coral Reef Watch [21]. This dataset covers the period from 1985 to 2023 at a daily temporal resolution and 5 km spatial resolution. It reports MHW conditions for each grid cell by calculating temperature deviations from a climatological baseline established for the 1985–2012 period. The intensity of each MHW event is classified according to Hobday et al. [12], based on the difference between the mean SST and the 90th percentile threshold at the 5 km scale. For this study, we aggregated all events corresponding to Category 2 or higher (strong to extraordinary).
MHW data were extracted using a spatial mask that incorporated both Exclusive Economic Zones (EEZs) and FAO Major Fishing Areas (MFAs). This procedure excluded offshore high-seas regions with no direct country-country’s EZZ catch report. As a result, the number of geographic units exceeds the number of countries, since some countries have multiple EEZ/MFA combinations when their EEZ spans more than one FAO region. We applied spatial and temporal quality filters, retaining only those regions with at least 100 valid pixels and more than 90% temporal coverage (i.e., valid pixel-days) throughout the analysis period. This filtering excluded several high-latitude regions where marine sea ice is frequently present or misclassified as such in the source dataset. A visual representation of the final set of 308 analyzed EEZ/MFA regions is provided in Figure S1 (Supplementary Material), which displays their global distribution.
For each region (EEZ/MFA), we calculated the total number of pixel-days per year affected by MHW events of Category 2 or higher. We expressed it as a proportion relative to the total available pixel-days in that region. Years were categorized as high MHW activity when this proportion exceeded 1.5 times the long-term mean (1985–2023). The MHW incidence trend for each region was evaluated by fitting a linear model to the pixel-level time series of MHW activity and testing the slope for statistical significance (p < 0.05; see the mathematical formulation in Supplementary Material File S2).
2.2. Fisheries Production Data
Fisheries production data were obtained from the FAO Global Capture Production dataset (FishStatJ) [22], covering the period 1985–2022. This database includes annual catch records reported by countries, disaggregated by species and FAO Major Fishing Area. It comprises a wide range of marine resources, including finfish, crustaceans, mollusks, and aquatic plants. Inland fisheries and miscellaneous aquatic products were excluded from the analysis.
To ensure the quality and consistency of the dataset, we retained only records that met the following criteria: (1) a minimum average catch of 500 metric tons per year over the study period, (2) taxonomic identification at least to the family level, and (3) complete time series with no missing values for any year between 1985 and 2022. After applying these filters, a total of 2088 fisheries were selected from an initial pool of 24,358 entries. We recognize that these filters may have excluded some fisheries where extreme events have caused short-term fluctuations or missing records. However, these criteria were necessary to ensure comparability across fisheries and to minimize bias from incomplete data series.
To estimate the low-frequency trend in fishery production—often associated with the development phase of each fishery—we applied a LOESS smoother (Locally Weighted Scatterplot Smoothing; [23]) to each annual catch time series. The resulting smoothed curve was subtracted from the original series, yielding a set of residuals that reflect deviations from the long-term trend. We interpreted negative residuals as years in which catches fell below expected levels based on the fishery’s historical development trajectory. This process produced a matrix of annual residual catch values for all 2088 fisheries, which served as the basis for subsequent analyses (see mathematical formulation in Supplementary Material File S2). For certain analyses, fisheries were also grouped into four production-volume categories (low, medium-low, medium-high, and high), based on the 25th, 50th, and 75th percentiles of cumulative catch across the entire 1985–2022 period. A visual summary of the selected fisheries is provided in Figure S2, which shows the number of fisheries analyzed per region, their average annual catch, and mean production value.
2.3. Economic Value Estimation
Ex-vessel prices for marine products were estimated using data from the Sea Around Us (SAU) database [24], developed by the University of British Columbia. Through their online advanced search tool, we extracted price records for taxonomic groups corresponding to the 2088 selected fisheries. The dataset includes information on catch and production value disaggregated by reporting year, country, FAO Major Fishing Area (MFA), fleet type, reporting status (reported or unreported), and intended use of the product. All monetary values are expressed in constant 2005 USD, as provided by the Sea Around Us database, to allow comparability over time and to remove inflationary effects.
We estimated unit prices (USD per tonne) for each fishery by dividing annual SAU reported production value by the corresponding FAO statistics catch. Because multiple production value reports can be available for a single species in a given year, we applied a hierarchical selection procedure prioritizing (a) reported over unreported data, (b) products destined for direct human consumption over reduction or other uses, and (c) values reported by the country owning the EEZ over those reported by foreign fleets operating in the same area.
When price data were unavailable for a given country/species combination, we applied a sequential substitution approach: first using data from a neighboring country for the same species; if not available, from other countries for the same species; and finally, if necessary, from nearby countries for the closest possible taxonomic group. Since the online SAU database provides data up to 2019, we extrapolated the 2019 value to the 2020–2022 years. This approach yielded a complete matrix of annual prices for each of the 2088 fisheries spanning from 1985 to 2022, which was then used to estimate economic losses (see mathematical formulation in Supplementary Material File S2). For subsequent aggregation analyses, fishery products were classified into four price categories—low, medium-low, medium-high, and high—based on the 25th, 50th, and 75th percentiles of the overall price distribution.
2.4. Detecting Fisheries Impacts During Marine Heatwaves
To reduce uncertainty associated with the spatial attribution of catches, we considered only those fisheries where the reporting country matched the Exclusive Economic Zone (EEZ)—thus excluding transnational fleets, for which the fishing location is often ambiguous. For each fishery (defined by species and region), we grouped the LOESS-derived residuals into two categories: years with high MHW activity (considering only fisheries with data for at least three of such years), and all other years. A two-sample t-test (p < 0.05) was applied to determine whether mean catch residuals differed significantly between these two categories. This analysis was conducted not only for lag 0 (coinciding years of high MHW activity and fishery catch) but also for lags of 1 to 3 years to detect potential delayed impacts.
Fisheries exhibiting significant reductions in catch residuals during or following high MHW years were classified as impacted. The magnitude of these impacts was estimated by accumulating the residuals for all the years with high MHW activity across the 1985 to 2022 period, aggregated by region (in tonnes). Economic losses were estimated by multiplying each residual by the corresponding annual product price and adding across all high MHW activity years. To assess trends over time, the same procedure was repeated for the 2013 to 2022 period, and the result expressed as proportion of loss relative to the full period.
We evaluated consistency by quantifying for each region the proportion of high-MHW years that were followed by negative residuals during the event year or up to three years afterward. Higher values of the index indicate greater temporal consistency in catch reductions associated with thermal anomalies (see mathematical formulation in Supplementary Material File S2).
To explore global impact patterns, the global production and economic losses during years of high MHW activity were aggregated by major taxonomic groups (following the ISSCAAP classification; [22]) and by country income level, based on The World Bank categories (high-income, upper-middle-income, lower-middle-income, and low-income countries; [25]). In addition, we generated a national impact ranking by combining the individual ranks of cumulative production and economic losses across all EEZs/MFAs associated with each country.
2.5. Study Case Analyses
Because global-scale analyses may obscure important regional and taxonomic nuances, we incorporated two focused case studies to explore specific dynamics of MHW impacts. These were selected to highlight contrasting yet representative contexts where MHWs may pose substantial ecological and socioeconomic risks. We chose the Mediterranean Sea as a regional case because it is a semi-enclosed basin with accelerated warming trends and documented impacts on marine ecosystems, making it a sentinel region for climate-related stressors [26]. Additionally, we examined the small pelagic fisheries group (herrings, sardines, and anchovies) due to their global economic importance, ecological centrality within marine food webs, and known sensitivity to temperature anomalies.
2.5.1. Regional Focus: The Mediterranean Sea
The subset for the regional case study included 195 fisheries from 13 countries bordering the Mediterranean Sea. We grouped the number of years with high MHW activity by decade, except for the first interval, which covered only eight years. These temporal patterns were then compared to national-level trends in production and economic loss within the region. To explore the taxonomic profile of impacted fisheries, we calculated the proportion of affected fisheries (i.e., those showing catch reductions during high-MHW years) belonging to each ISSCAAP group.
2.5.2. Species Focus: Global Analysis of Herrings, Sardines, and Anchovies
All small pelagic fisheries targeting herrings, sardines, and anchovies were extracted from the filtered FAO FishStat dataset [22], resulting in 169 fisheries distributed across 80 distinct regions. For each fishery, we examined the p-values from the t-tests comparing the mean of LOESS residuals between high-MHW years and the rest of the time series, across lags 0 to 3 years. These p-values were then evaluated in relation to two metrics: the total cumulative catch from 1985 to 2022 (used as a proxy for fishery size) and the number of years with high MHW activity in the corresponding region. Additionally, we aggregated the cumulative catch and production loss of significantly impacted fisheries across FAO MFAs. The Northeast Atlantic—identified as the most affected region—was analyzed in greater detail to assess the species composition of impacted fisheries.
3. Results
3.1. Global Incidence of Marine Heatwaves
Over the past four decades, MHWs have intensified markedly in both frequency and duration, reflecting a clear signal of ocean warming. Worldwide, the frequency of these events has increased by over 80%, and the average number of days per year under MHW conditions has risen by approximately 50% over the past three decades. The spatial analysis revealed an uneven but persistent distribution of intense MHWs (level 2 or higher) between 1985 and 2023, with greater accumulations in coastal areas of mid- and high latitudes (Figure 2). Some regions—such as the Eastern Pacific (off the coasts of Peru and Ecuador), the North Atlantic, the Southwestern Indian Ocean, and the Mediterranean—stand out for their particularly high incidence, whereas others, such as the Central Pacific or the South Atlantic, exhibit comparatively lower exposure (Figure 3). In addition, significant upward trends are evident in the proportion of days under MHW conditions in regions such as the Northwestern Pacific, the Centralwestern Atlantic, and the Greenland Sea (Figure 3). Although slope values in Figure 3 may appear numerically small, they accumulate to substantial changes over time. For example, a coefficient of 0.002 per year corresponds to an increase of about 0.078 (≈8 percentage points) in the proportion of days under Category ≥2 MHW conditions over the 1985–2023 period.
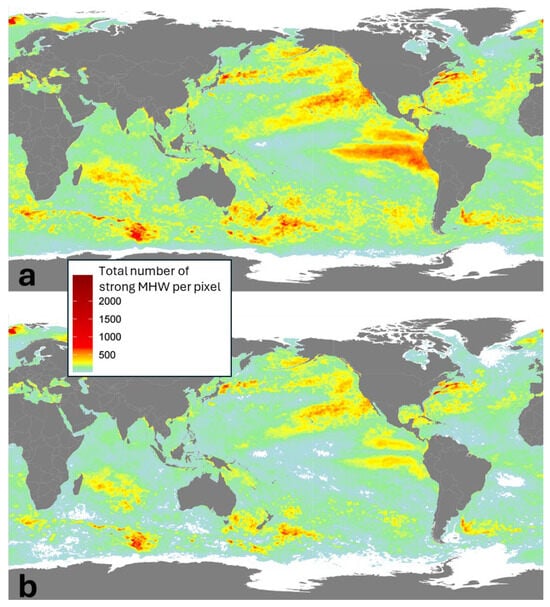
Figure 2.
Global distribution of accumulated strong to extraordinary MHW activity (total number of events) during the 1985 to 2022 (a) and 2013 to 2022 (b) time periods.
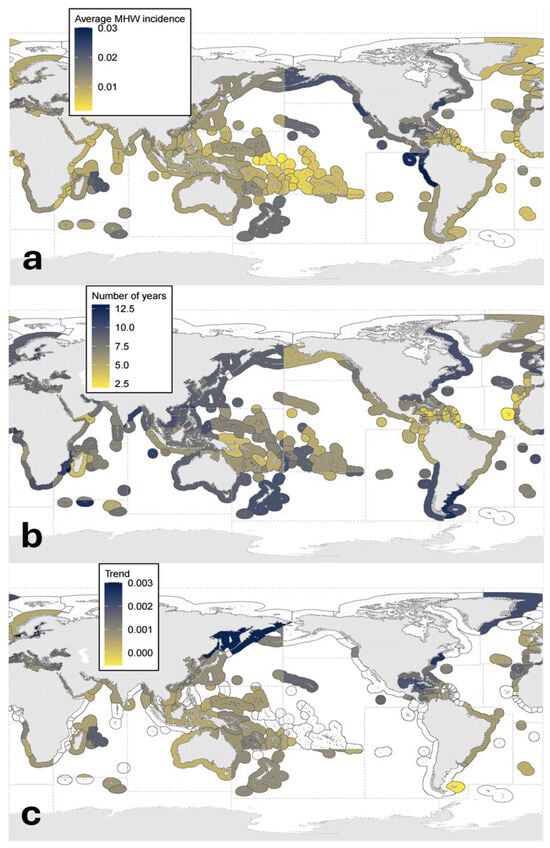
Figure 3.
Marine heatwave activity by region (EEZ/MFA). (a) Average MHW incidence (the ratio of pixels × days exhibiting MHWs of intensity 2 or more over the total number of pixel × days for each region). (b) Number of years with high MHW incidence. (c) Statistically significant trends (slope of the lineal model fit) in the proportion of pixels × days with MHWs during the 1983 to 2023 time-period. White areas indicate regions excluded due to insufficient data or non-significant trends.
3.2. Impacts on Fisheries Production and Economic Value
The global analysis of 2088 marine fisheries between 1985 and 2022 revealed that nearly 15% of the cases evaluated exhibited statistically significant declines (i.e., reductions detected statistically during high MHW years) in production during or following years characterized by intense marine heatwave (MHW) activity. In total, 322 fisheries were identified as having experienced substantial catch reductions (Figure 4). The impact is particularly pronounced in groups such as small pelagic fish (herring, sardines, and anchoveta), squids and octopuses, and miscellaneous coastal fisheries, which account for the bulk of losses in both volume and economic value (Figure 4).
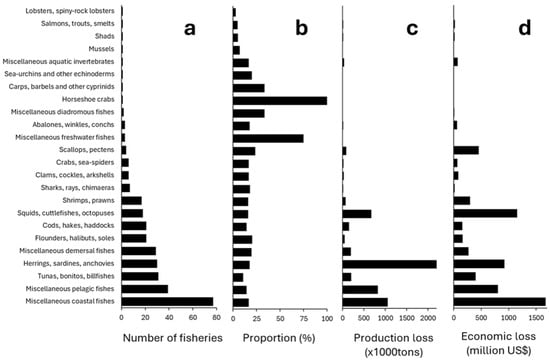
Figure 4.
Fisheries groups: Number (a) and proportion (b) of fisheries showing significant differences under high MHW conditions years, and production (c) and economic (d) loss for the 1983 to 2022 period. The proportion refers to the percentage of fisheries within each ISSCAAP group that exhibited a statistically significant reduction in catch during years of high MHW activity, relative to the total number of analyzed fisheries for that group.
Cumulative estimates reveal that total production losses (i.e., cumulative aggregated differences in tonnes or USD across the study period) associated with high MHW activity reached more than 5.6 million tonnes between 1985 and 2022, equivalent to 0.3% of the 1888 million tonnes analyzed. Similar proportions were observed for the 1993–2022 and 2000–2022 intervals, with losses of 4.6 million tonnes (0.31% of 1484 million tonnes) and 3.8 million tonnes (0.35% of 1098 million tonnes), respectively. In contrast, the most recent decade (2013–2022) showed a sharper decline, with 2.5 million tonnes lost—equivalent to 0.57% of the 442 million tonnes caught during that period. When transformed to economic impact (in 2005 USD equivalents), these production deficits amounted to USD 6.6 billion for 1985–2022, USD 5.9 billion for 1993–2022, USD 5.05 billion for 2000–2022, and USD 3.9 billion for 2013–2022.
Across taxonomic groups, the production decrease of fisheries with significant reductions ranges from 3% to 33%, with an average of approximately 16% across most groups (Figure 4). This pattern suggests that the phenomenon affects a wide range of marine life forms, from pelagic and demersal fish to cephalopods and crustaceans. However, when analyzing the consistency of the impact over time, evaluated as how often the years with intense MHWs coincided with observed catch declines, certain groups exhibited more persistent patterns. Of the 322 impacted fisheries, 121 showed high consistency, with reductions occurring in more than 80% of the MHW years in their respective regions. This proportion surpasses 50% in groups such as sharks and rays, shrimp and prawns, and tunas and billfishes (Table 1).

Table 1.
Consistency (proportion between the number of high MHW activity years with catch reduction/total number of high MHW years for each region), grouped by intervals. Columns 2 to 6 report the number of fisheries for each ISSCAAP group falling within each proportion interval, and the last column the proportion of fisheries for each group falling above 80%.
3.3. Regional and National Disparities
The spatial distribution of impacts reveals that significant catch reductions associated with MHWs occur across all ocean regions, though with varying levels of intensity and frequency depending on the location. The Northeast Atlantic, the Indo-Pacific, and New Zealand account for the highest number of cases (Figure 5). However, when considering the relative share of affected fisheries with respect to the total number of analyzed fisheries in each region, the pattern becomes more homogeneous—except in areas such as the Eastern Pacific and West Africa, where the impact is noticeably lower (Figure 5). In most regions, more than 80% of the years with intense MHWs coincide with declines in catch, although this relationship is weaker in areas such as Brazil, the southern Gulf of Mexico, and the tropical Western Pacific (Figure 5).
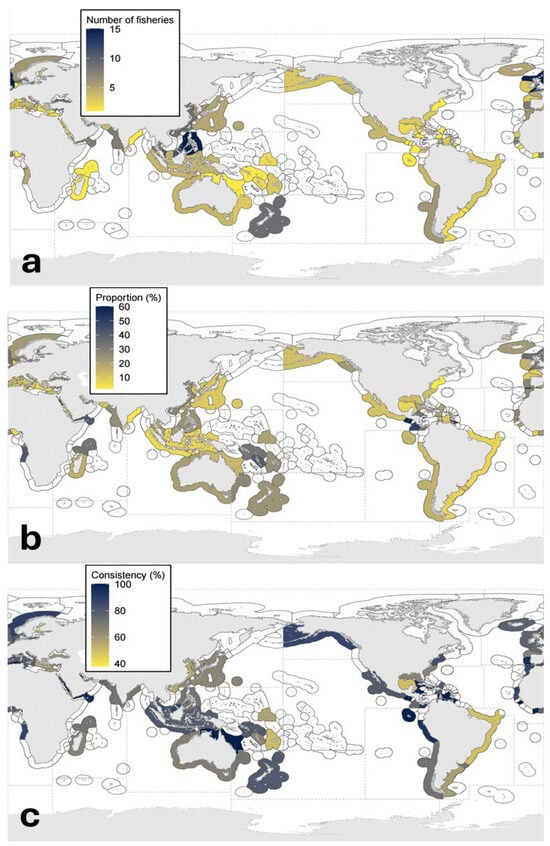
Figure 5.
Fisheries showing significant differences under high-MHW-condition years: (a) number of affected fisheries, (b) proportion of the total analyzed fisheries per region, and (c) consistency (% of occasions showing catch reduction during high-MHW-condition years, with respect to the total number of years with high-MHW conditions). Areas in white indicate regions excluded due to insufficient data or non-significant trends.
In terms of catch loss magnitude, the highest cumulative reductions were detected for the Northeast Atlantic and the Southeast Pacific. Economic losses, in contrast, also extended to regions such as the Southwest Atlantic, the Eastern Central Pacific, and Alaska (Figure 6). Notably, in many regions, more than 50% of the total losses occurred during the last decade, and in some cases—such as Alaska, Mozambique, the Gulf of Mexico, and China—the entire economic impact was concentrated in the 2013–2022 period (Figure 7).
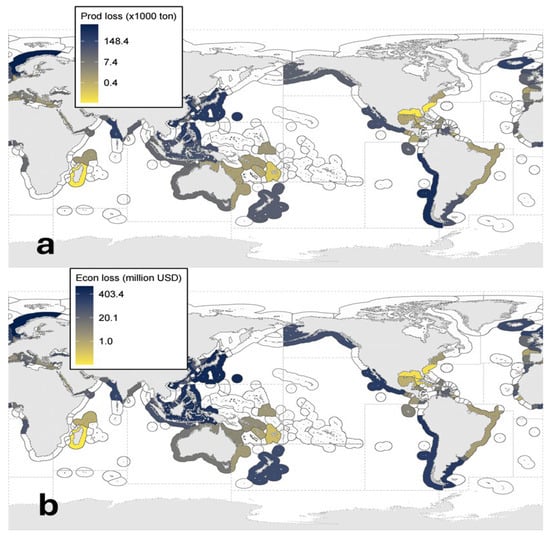
Figure 6.
Accumulated production (a) and economic (b) loss during high-MHW-condition years for the 1983 to 2022 period. Areas in white indicate regions excluded due to insufficient data or non-significant trends.
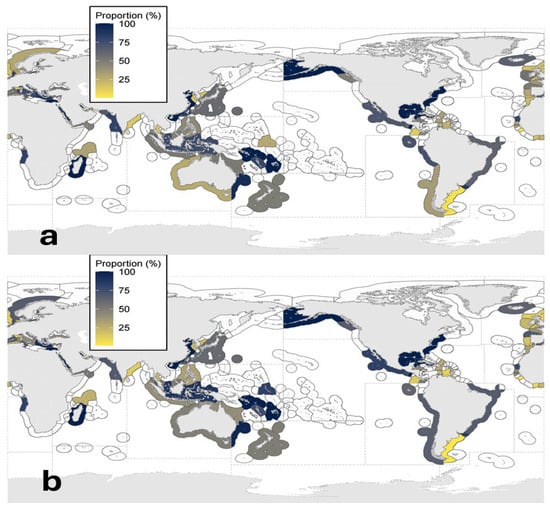
Figure 7.
Proportion of production (a) and economic (b) loss during high-MHW-condition years for the 2013 to 2022 decade with respect to the entire 1983 to 2022 period. Areas in white indicate regions excluded due to insufficient data or non-significant trends.
At the FAO major fishing areas scale, areas 27, 34, 51, and 71—which correspond to the Northeast Atlantic, Eastern Central Atlantic, Western Indian Ocean, and Western Central Pacific—concentrate the largest number of impacted fisheries (Figure 8). At the country level, Norway, Denmark, Japan, China, and Peru stand out as the most affected countries during the 1985–2022 period. Although these five nations together account for only 10% of the fisheries with significant impacts, they represent over 53% of total production losses and 45% of global economic losses. A second group of 14 countries—namely the Philippines, Chile, Indonesia, Thailand, India, Mexico, Argentina, Iceland, the United Kingdom, Ghana, New Zealand, Canada, and the United States—jointly account for 90% of global production loss and nearly 85% of the cumulative economic loss.
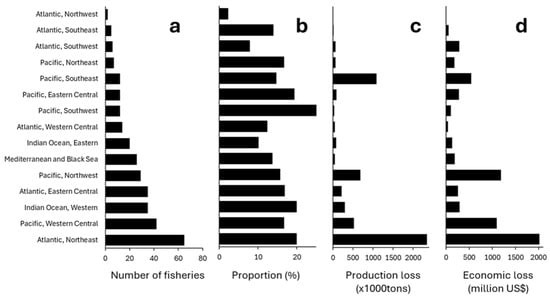
Figure 8.
Marine Fisheries Areas: Number (a) and proportion (b) of fisheries showing significant differences under high-MHW-condition years, and production (c) and economic (d) loss for the 1983 to 2022 period. The proportion refers to the percentage of fisheries within each FAO major fishing area that exhibited a statistically significant reduction in catch during years of high MHW activity, relative to the total number fisheries analyzed for that area.
When focusing on the last decade (2013–2022), the impacts appear even more geographically concentrated. During this recent period, Norway, China, Japan, and Peru alone accounted for 50% of global production loss and 45% of economic loss, followed by a group of 13 countries—Chile, Indonesia, Denmark, India, the Philippines, Mexico, Iceland, the United States, Thailand, Canada, New Zealand, the Maldives, and Angola—which together accounted for the remaining 90% of production loss and 88% of economic loss during this period (Table S1; Supplementary Material).
Notably, most of the affected fisheries are concentrated in high-income countries, both in terms of catch volume and production value, where high productivity and high market value fisheries predominate. The impact was intermediate in upper-middle- and lower-middle-income countries, while low-income countries, exhibited a limited number of cases, consistent with their smaller share of global fishery production (Figure 9).
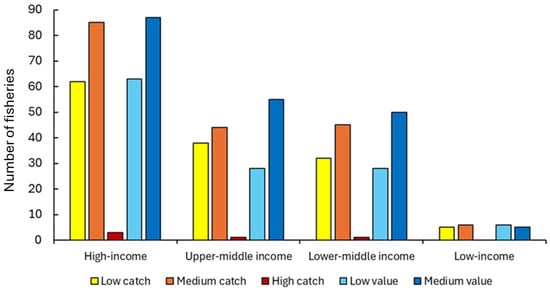
Figure 9.
Country economic class: Number of fisheries showing significant differences in catch under high-MHW-condition years for each World Bank income class country by production level and value level terciles.
3.4. Case Studies
In addition to the global analysis, two case studies are presented below to illustrate in greater detail the nature and diversity of the impacts of marine heatwaves (MHWs) on fisheries. These examples allow for an in-depth examination of both the regional dimension—through the case of the Mediterranean Sea—and the effects on a key functional group at the global level, represented by small pelagic species. In both cases, distinct patterns of impact, temporal consistency, and spatial heterogeneity are identified, which complemented the interpretation of the global results.
3.4.1. Regional Case: Mediterranean Sea
The regional analysis revealed marked differences in the frequency of marine heatwaves (MHWs) among Mediterranean countries. The number of years with high MHW activity ranged from three in Morocco to ten in France, with a notable intensification over the past decade, going from three years with high MHW activity in between 7 and 23% of the Mediterranean EZZs during the 1993 to 2002 decade, to nine years of high MHW activity in between 15 and 70% of the EZZs in the 2013 to 2022 period (Figure S3; Supplementary Material). Although several countries experienced similar levels of MHW activity, the effects on fisheries were markedly uneven, with Turkey accounting for nearly 40% of the region’s total production loss, followed by Tunisia with 17%, while no other country exceeded 10% (Figure S3). In economic terms, both nations together accounted for more than 70% of total losses, albeit with distinct profiles: in Tunisia, the impacts were concentrated in high-value fisheries such as shrimp and prawns, whereas in Turkey, they were distributed across multiple groups of pelagic fish (Figure S3). This disparity is also reflected in the types of fishery resources affected in each country (Table S2). Despite similarities in ecological and fishing conditions among neighboring Mediterranean countries (such as target species, habitats, and practice), the fisheries affected by MHWs differed markedly.
3.4.2. Species Group Case: Herrings, Sardines, and Anchovetas
The group composed of herrings, sardines, and anchovetas stood out as one of the most affected globally. Although it ranked fourth in terms of the number of fisheries with significant differences between MHW years and normal years, it recorded the highest cumulative production loss and the third-highest economic loss (Figure S3). The analysis revealed no clear relationship between the size of the fishery (accumulated catch) and the likelihood of impact, nor between MHW frequency and the magnitude of the observed effect, independently of the relationship time lags (Figure S4).
Spatially, most of the losses were concentrated in the Northeast Atlantic, which accounted for 64% of the total—surpassing the Southeast Pacific, where the largest single species fishery is located (Figure S5). This concentration was largely driven by the case of Atlantic herring (Clupea harengus), which alone accounted for over 60% of the group’s total global loss. This species, primarily exploited by Norway, Iceland, Canada, and Denmark, exhibited a high sensitivity to MHWs, although no single factor was identified to explain its susceptibility (Figure S6).
4. Discussion
Our analysis incorporated event magnitude by focusing on Category ≥ 2 MHWs and quantifying the proportion of days under such conditions. This reveals that warming background temperatures not only increase the frequency of extreme events but also contribute to their persistence. If current trends continue, some regions may approach near-permanent MHW conditions, with potentially severe risks for marine ecosystems and fisheries.
The growing persistence of extreme events is mirrored by disruptions in fisheries worldwide, though the magnitude and distribution of impacts defy simplistic assumptions. Among the 2088 fisheries analyzed across 308 spatial units—defined by the intersection of Exclusive Economic Zones (EEZs) and FAO Major Fishing Areas (MFAs)—322 (15%) showed statistically significant production declines during years of intense thermal stress. Interestingly, this proportion was consistent across most regions, suggesting that the MHW activity alone does not explain the impact magnitude. Instead, the losses appear to reflect more complex interactions involving species-specific responses, ecological conditions, and national-scale fisheries characteristics. The largest absolute losses were concentrated in countries with highly developed fisheries sectors, such as Norway, Japan, China, and Denmark, all of which play a major role in global seafood production [5]. This concentration highlights that economic losses are partly proportional to the magnitude and value of national fisheries. Nevertheless, these results should not conceal that even modest declines in lower-income nations may result in severe repercussions for food security, employment, and local economies [4,27]. A nuanced understanding of both the scale and the context of losses is essential to accurately assess the risks posed by marine heatwaves to different fisheries systems.
Notably, over half of the global production and economic losses occurred during the most recent decade (2013–2022), indicating that MHW-related disruptions have intensified over time. This acceleration is consistent with the documented increase in the frequency, duration, and intensity of marine heatwaves, driven by long-term ocean warming trends [7,9]. Regional hotspots of recent impact included Alaska, the Gulf of Mexico, coastal China, Mozambique, and parts of the Western South Pacific—areas where cumulative losses were almost entirely confined to the last ten years. Moreover, interdecadal shifts were detected in the characteristics of MHWs, with relatively stable conditions before 2010 followed by a sharp upward trend, mirroring the broader climate signal [6,7]. We noted that some regions characterized by strong coastal upwelling exhibited comparatively lower exposure to extreme warming, suggesting potential buffering effects [28].
The pathways through which MHWs impact fisheries are complex and often context-dependent. While this study relied on empirical detection of catch anomalies during years of elevated thermal stress, the lack of a consistent relationship between MHW intensity and the magnitude of observed impacts suggests that multiple interacting mechanisms are at play. MHWs can vary not only in their surface expression but also in vertical structure, spatial extent, and underlying physical drivers such as heat fluxes, horizontal advection, and vertical mixing [7,8]. Recent work has identified four distinct vertical MHW typologies—shallow, subsurface-reversed, subsurface-intensified, and deep events—each associated with different modes of oceanographic forcing and with potentially divergent ecological outcomes [29]. These structural differences influence how fish populations experience thermal stress, especially in relation to depth-specific habitats, migratory behavior, and critical life-history stages. In turn, biological responses depend not only on species-specific traits but also on local adaptation and recent exposure histories, which can modulate tolerance thresholds.
Among the groups analyzed, small pelagic fishes (e.g., herrings, sardines, anchovies) stand out as particularly sensitive to marine heatwaves, owing to their short life cycles, high turnover rates, and strong dependence on plankton productivity. These populations are tightly coupled to oceanographic processes such as upwelling and nutrient availability, both of which can be disrupted during anomalous warming events [30,31]. For instance, El Niño–associated warming in the Southeast Pacific has long been linked to drastic declines in anchoveta (Engraulis ringens) catches [5], illustrating the vulnerability of this group to thermal anomalies. Beyond surface temperature, vertical MHW structures can modify nutrient fluxes and prey availability, further constraining the resilience of pelagic species [29]. These ecological and biological features help explain why small pelagics consistently exhibited some of the largest production declines in our analysis. Recognizing these sensitivities highlights the importance of integrating climate indicators into stock assessments and food system planning to strengthen resilience to future ocean warming.
A comprehensive understanding of MHWs’ impacts goes beyond physical drivers and methodological constraints to consider their social and economic dimensions. These concerns are underscored by the magnitude of cumulative losses: over 5.6 million tonnes of catch and USD 6.6 billion in economic value were lost globally between 1985 and 2022, with a disproportionate concentration in the last decade. Production or monetary losses, though informative, only partially reflect the real risks faced by fisheries-dependent communities. In our analysis, we found that high-income countries—which dominate global catch and trade—absorbed the largest absolute losses. However, their diversified economies and stronger institutional capacity may likely buffer these impacts more efficiently than lower income countries. Nations with low Human Development Index (HDI) scores or high reliance on fisheries may experience greater hardship from even modest disruptions. Climate risk arises from the interaction of hazard, exposure, and vulnerability, with the latter often peaking in small island developing states (SIDS) and low-income nations where fisheries underpin food security, nutrition, and livelihoods [32,33]. This divergence between absolute impact and relative vulnerability underscores the importance of incorporating socioeconomic indicators—such as dependence on fish-derived protein, income inequality, or adaptive capacity—into fisheries risk assessments to potentially increase the adaptive capacity.
While the impacts of marine heatwaves are increasingly evident within fisheries, a more comprehensive understanding of the implications should include considering disruptions in other key food-producing sectors, such as agriculture. Extreme weather events—particularly droughts and terrestrial heatwaves—have been widely recognized for their damaging effects on crop yields and farmer incomes [34,35,36,37]. However, several studies now suggest that marine fisheries may be even more exposed in certain regions. For example, global-scale projections indicate that, under high-emission scenarios, tropical countries could suffer productivity losses of up to 60% in fisheries compared to 25% in agriculture [38]. Although our study does not directly compare food-producing sectors, the significant production and economic losses observed in high-yield fisheries during marine heatwaves support these concerns. This convergence highlights the need to treat fisheries not as peripheral but as central to food security adaptation strategies in a rapidly warming world.
Recognizing the central role of fisheries in climate-resilient food systems also calls for a reevaluation of how we manage and prepare for future disruptions. The varied responses observed across regions and fishery types highlight the importance of developing management strategies that explicitly account for climate risk. Traditional fisheries governance has often relied on historical baselines and assumptions of environmental stability, yet the growing frequency and intensity of MHWs challenge these premises. Adaptive approaches—such as flexible quotas, dynamic closures, or early warning systems—offer promising avenues for mitigating short-term impacts but remain underutilized in many parts of the world [39,40]. Our results suggest that even highly productive fisheries are vulnerable to thermal extremes, reinforcing the urgency of integrating climate indicators into stock assessments and harvest control rules. Furthermore, there is a pressing need to strengthen long-term monitoring and improve data accessibility in tropical and developing regions, where MHWs may interact with chronic stressors like overfishing or habitat loss. Building institutional capacity and incorporating probabilistic climate forecasts into decision-support tools can enhance preparedness, particularly in countries where fisheries are vital for livelihoods and economic resilience.
Beyond governance responses, advancing our understanding of MHWs’ impacts also requires confronting empirical and analytical challenges. This global assessment offers valuable insights into how extreme thermal events affect fisheries, yet its interpretation depends on recognizing the methodological assumptions and data choices that shaped the analysis. A critical aspect of our study concerns the validity of the evaluation and the implications of the datasets selected. Our approach was explicitly empirical and statistical: we detected associations between years of intense marine heatwave (MHW) activity and negative deviations in fisheries catches. This design allows for robust global comparisons, but it does not imply direct causation. Other drivers—including management decisions, natural fluctuations, and inconsistencies in reporting—may also influence observed outcomes. The main strengths of our approach lie in its scope, the standardized use of FAO and Sea Around Us databases, the conversion of all monetary values to constant 2005 USD for temporal comparability, and the exclusion of incomplete or poorly resolved series to ensure statistical robustness. Nevertheless, some limitations must be acknowledged.
First, the use of NOAA’s global MHW dataset guarantees consistency across space and time, yet the decision to classify “high MHW years” as those exceeding 1.5 times the long-term mean reflects an operational choice rather than an ecological boundary. Likewise, while this dataset applies a fixed statistical definition of MHWs, it does not fully capture the diversity of events in terms of intensity, duration, or spatial extent, nor their dynamic mobility across ocean regions. Future research would benefit from explicitly incorporating spatial thresholds to distinguish localized anomalies from basin-scale events most relevant to fisheries systems.
Second, our use of LOESS detrending provided a pragmatic way to filter out long-term development phases of fisheries and isolate short-term anomalies. However, this smoothing may inadvertently suppress multi-decadal signals or mask transitions between contrasting ecosystem states. Such simplifications mean that, in regions with non-monotonic changes in MHWs, the residuals may not fully represent the underlying dynamics.
Third, the economic component also introduces uncertainty. To achieve global coverage, we applied substitution rules for missing price data and extrapolated values beyond 2019. While these steps were necessary and methodologically consistent, they cannot fully reflect recent market volatility, such as those caused by COVID-19 disruptions or international trade shocks.
Finally, the choice of fisheries dataset has important implications. By using the FAO Global Capture Production database with strict filters (e.g., minimum catch, taxonomic resolution, complete time series), we ensured comparability and statistical rigor, but we inevitably excluded smaller, poorly reported, or artisanal fisheries. This means our results primarily reflect industrial and large-scale fisheries from countries with more reliable reporting systems. Consequently, while our findings capture global patterns of production and economic loss, they may underestimate vulnerabilities in small-scale fisheries, which are often critical for food security and local livelihoods. In addition, the case studies on the Mediterranean and small pelagics illustrate important patterns of vulnerability, but the attribution of impacts solely to MHWs must be interpreted with caution. Other pressures—such as overfishing, pollution, and management practices—interact with thermal stress and may also contribute to the observed declines.
5. Conclusions
This study provides the first global empirical assessment of the impacts of marine heatwaves (MHWs) on fisheries productivity and economic value. By documenting the magnitude and geographic distribution of losses, our analysis highlights the disruptive role of MHWs as an emerging climate hazard for the ocean. Approximately 15% of fisheries worldwide showed significant catch declines during years of intense MHW activity, with impacts concentrated in high-income countries and productive taxa such as small pelagics. Cumulative global losses since 1985 exceeded 5.6 million tonnes and USD 6.6 billion (2005 USD equivalents). Notably, more than half of these losses occurred in the last decade, a period when the frequency of MHWs increased by more than 80% and their average duration by about 50% globally. This convergence underscores the accelerating risks posed by ongoing climate warming. Our findings emphasize the urgent need to explicitly incorporate extreme ocean warming events into fisheries risk assessments and to develop adaptive management strategies, particularly in regions of high production and strategic importance.
Supplementary Materials
The following supporting information can be downloaded at: https://www.mdpi.com/article/10.3390/fishes10110594/s1, Figure S1: Analyzed regions (total of 308), a combination of countries’ Exclusive Economic Zones (EEZ) and FAO Major Marine Fisheries Areas (MFA); Figure S2: Analyzed fisheries per region, including number of cases, average catch (thousand tons), and average production value (million USD); Table S1: Countries rank with total number of analyzed fisheries, proportion showing significant impacts, production and value loss for the 1985–2022 and 2013–2022 periods, and national loss ranking; Figure S3: MHWs’ impacts on Mediterranean fisheries, including number of years with high MHW activity, production loss, and economic loss per country; Table S2: Proportion of fisheries with catch reduction under high-MHW-activity years belonging to each ISSCAAP group; Figure S4: Probability of impact in small pelagic fisheries as a function of accumulated catch and number of high-MHW-activity years; Figure S5: Accumulated catch and production loss for herrings, sardines, and anchovies by FAO marine fisheries area; Figure S6: Proportion of production loss for different species of small pelagic fish. Supplementary File S2: Mathematical formulation of methods.
Author Contributions
Conceptualization, A.Y.-A., D.B.L.-C., R.Z.Z. and S.E.L.-C.; methodology, A.Y.-A., D.B.L.-C., J.E.A.-G., R.Z.Z. and S.E.L.-C.; formal analysis, A.Y.-A., D.B.L.-C. and S.E.L.-C.; writing—original draft preparation, A.Y.-A., D.B.L.-C., J.E.A.-G., R.Z.Z. and S.E.L.-C.; writing—review and editing, A.Y.-A., D.B.L.-C., J.E.A.-G., R.Z.Z. and S.E.L.-C.; supervision, S.E.L.-C. All authors have read and agreed to the published version of the manuscript.
Funding
This research received no external funding.
Institutional Review Board Statement
Not applicable.
Data Availability Statement
All analyses are based on publicly available data from the FAO, Sea Around Us (SAU), and marine heatwave (MHW) satellite-derived products. Specific sources and access links are detailed in the Methods section.
Acknowledgments
This work was undertaken as part of research commissioned by the Food and Agriculture Organization of the United Nations. The authors thank the Secretaría de Ciencia, Humanidades, Tecnología e Innovación (SECIHTI) for providing a postgraduate scholarship to the first author. We also acknowledge the institutional and academic support provided by both the Centro de Investigaciones Biológicas del Noroeste (CIBNOR) and the Centro de Investigación y de Estudios Avanzados del Instituto Politécnico Nacional, Unidad Mérida (CINVESTAV Unidad Mérida) during the development of this research.
Conflicts of Interest
The authors declare no conflicts of interest.
References
- HLPE. Sustainable Fisheries and Aquaculture for Food Security and Nutrition; High Level Panel of Experts on Food Security and Nutrition of the Committee on World Food Security: Rome, Italy, 2014; Available online: http://www.fao.org/3/i3844e/i3844e.pdf (accessed on 15 July 2025).
- Colombo, S.M.; Rodgers, T.F.M.; Diamond, M.L.; Bazinet, R.P.; Arts, M.T. Projected Declines in Global DHA Availability for Human Consumption as a Result of Global Warming. Ambio 2020, 49, 865–880. [Google Scholar] [CrossRef] [PubMed]
- Ding, Q.; Chen, X.; Hilborn, R.; Chen, Y. Vulnerability to Impacts of Climate Change on Marine Fisheries and Food Security. Mar. Policy 2017, 83, 55–61. [Google Scholar] [CrossRef]
- Béné, C.; Barange, M.; Subasinghe, R.; Pinstrup-Andersen, P.; Merino, G.; Hemre, G.-I.; Williams, M. Feeding 9 Billion by 2050—Putting Fish Back on the Menu. Food Sec. 2015, 7, 261–274. [Google Scholar] [CrossRef]
- FAO. Global Fisheries and Marine Resources Trends. In The State of World Fisheries and Aquaculture 2024—Blue Transformation in Action; Food and Agriculture Organization of the United Nations: Rome, Italy, 2024. [Google Scholar]
- Smale, D.A.; Wernberg, T.; Oliver, E.C.; Thomsen, M.; Harvey, B.P.; Straub, S.C.; Burrows, M.T.; Alexander, L.V.; Benthuysen, J.A.; Donat, M.G. Marine Heatwaves Threaten Global Biodiversity and the Provision of Ecosystem Services. Nat. Clim. Change 2019, 9, 306–312. [Google Scholar] [CrossRef]
- Holbrook, N.J.; Scannell, H.A.; Sen Gupta, A.; Benthuysen, J.A.; Feng, M.; Oliver, E.C.; Alexander, L.V.; Burrows, M.T.; Donat, M.G.; Hobday, A.J. A Global Assessment of Marine Heatwaves and Their Drivers. Nat. Commun. 2019, 10, 2624. [Google Scholar] [CrossRef]
- Oliver, E.C.J.; Benthuysen, J.A.; Darmaraki, S.; Donat, M.G.; Hobday, A.J.; Holbrook, N.J.; Schlegel, R.W.; Sen Gupta, A. Marine Heatwaves. Annu. Rev. Mar. Sci. 2021, 13, 313–342. [Google Scholar] [CrossRef]
- Oliver, E.C.; Donat, M.G.; Burrows, M.T.; Moore, P.J.; Smale, D.A.; Alexander, L.V.; Benthuysen, J.A.; Feng, M.; Sen Gupta, A.; Hobday, A.J. Longer and More Frequent Marine Heatwaves over the Past Century. Nat. Commun. 2018, 9, 1324. [Google Scholar] [CrossRef]
- Chen, Y.; Su, H.; Yan, X.-H.; Zhang, H.; Wang, Y. Global Oceans Suffer Extreme Heatwaves Intensifying since the Early 21st Century: A New Comprehensive Index. Ecol. Indic. 2024, 162, 112069. [Google Scholar] [CrossRef]
- Hobday, A.J.; Alexander, L.V.; Perkins, S.E.; Smale, D.A.; Straub, S.C.; Oliver, E.C.; Benthuysen, J.A.; Burrows, M.T.; Donat, M.G.; Feng, M. A Hierarchical Approach to Defining Marine Heatwaves. Prog. Oceanogr. 2016, 141, 227–238. [Google Scholar] [CrossRef]
- Hobday, A.J.; Oliver, E.C.; Gupta, A.S.; Benthuysen, J.A.; Burrows, M.T.; Donat, M.G.; Holbrook, N.J.; Moore, P.J.; Thomsen, M.S.; Wernberg, T. Categorizing and Naming Marine Heatwaves. Oceanography 2018, 31, 162–173. [Google Scholar] [CrossRef]
- Hornstein, J.; Pales Espinosa, E.; Cerrato, R.M.; Lwiza, K.M.M.; Allam, B. The influence of temperature stress on the physiology of the Atlantic surfclam, Spisula solidissima. Comp. Biochem. Physiol. A 2018, 222, 66–73. [Google Scholar] [CrossRef]
- Rohr, J.R.; Palmer, B.D. Climate change, multiple stressors, and the decline of ectotherms. Conserv. Biol. 2013, 27, 741–751. [Google Scholar] [CrossRef]
- Jutfelt, F.; Roche, D.G.; Clark, T.D.; Norin, T.; Binning, S.A.; Speers-Roesch, B.; Sundin, J. Brain cooling marginally increases acute upper thermal tolerance in Atlantic cod. J. Exp. Biol. 2019, 222, jeb208249. [Google Scholar] [CrossRef]
- Smith, K.E.; Burrows, M.T.; Hobday, A.J.; King, N.G.; Moore, P.J.; Gupta, A.S. Biological impacts of marine heatwaves. Annu. Rev. Mar. Sci. 2023, 15, 119–145. [Google Scholar] [CrossRef] [PubMed]
- Masanja, F.; Yang, K.; Xu, Y.; He, G.; Liu, X.; Xu, X.; Zhao, L. Impacts of marine heat extremes on bivalves. Front. Mar. Sci. 2023, 10, 1159261. [Google Scholar] [CrossRef]
- FAO. The Impact of Disasters on Agriculture and Food Security 2023—Technological Solutions for Reducing Risks and Impacts; FAO: Rome, Italy, 2025. [Google Scholar]
- Caputi, N.; Kangas, M.; Chandrapavan, A.; Hart, A.; Feng, M.; Marin, M.; de Lestang, S. Factors Affecting the Recovery of Invertebrate Stocks from the 2011 Western Australian Extreme Marine Heatwave. Front. Mar. Sci. 2019, 6, 484. [Google Scholar] [CrossRef]
- Chandrapavan, A.; Caputi, N.; Kangas, M.I. The Decline and Recovery of a Crab Population from an Extreme Marine Heatwave and a Changing Climate. Front. Mar. Sci. 2019, 6, 510. [Google Scholar] [CrossRef]
- NOAA Coral Reef Watch. Daily Global 5km Satellite Monitoring Marine Heatwave Watch (Version 1.0.1, Released 21 September 2021). Available online: https://coralreefwatch.noaa.gov/product/marine_heatwave (accessed on 1 July 2024).
- FAO. FishStatJ–Software for Fishery and Aquaculture Statistical Time Series. Available online: https://www.fao.org/fishery/en/topic/166235?lang=en (accessed on 1 July 2024).
- Cleveland, W.S. Robust Locally Weighted Regression and Smoothing Scatterplots. J. Am. Stat. Assoc. 1979, 74, 829–836. [Google Scholar] [CrossRef]
- Pauly, D.; Zeller, D.; Palomares, M.L.D. Sea Around Us: Concepts, Design and Data. Available online: https://www.seaaroundus.org (accessed on 1 July 2024).
- The World Bank. World Bank Country and Lending Groups. Available online: https://datahelpdesk.worldbank.org/knowledgebase/articles/906519 (accessed on 25 August 2024).
- GRID-Arendal Population Density and Urban Centers in the Mediterranean Basin. Available online: https://www.grida.no/resources/5900 (accessed on 30 August 2024).
- Allison, E.H.; Perry, A.L.; Badjeck, M.; Neil Adger, W.; Brown, K.; Conway, D.; Halls, A.S.; Pilling, G.M.; Reynolds, J.D.; Andrew, N.L.; et al. Vulnerability of National Economies to the Impacts of Climate Change on Fisheries. Fish Fish. 2009, 10, 173–196. [Google Scholar] [CrossRef]
- Wang, S.; Jing, Z.; Wu, L.; Sun, S.; Peng, Q.; Wang, H.; Zhang, Y.; Shi, J. Southern Hemisphere Eastern Boundary Upwelling Systems Emerging as Future Marine Heatwave Hotspots under Greenhouse Warming. Nat. Commun. 2023, 14, 28. [Google Scholar] [CrossRef]
- Zhang, Y.; Du, Y.; Feng, M.; Hobday, A.J. Vertical Structures of Marine Heatwaves. Nat. Commun. 2023, 14, 6483. [Google Scholar] [CrossRef] [PubMed]
- Gomes, D.G.; Ruzicka, J.J.; Crozier, L.G.; Huff, D.D.; Brodeur, R.D.; Stewart, J.D. Marine heatwaves disrupt ecosystem structure and function via altered food webs and energy flux. Nat. Commun. 2024, 15, 1988. [Google Scholar] [CrossRef]
- Swieca, K.; Sponaugle, S.; Schmid, M.S.; Ivory, J.; Cowen, R.K. Oceanographic and trophodynamic underpinnings of anchovy success in the northern California Current. Front. Mar. Sci. 2025, 12, 1558793. [Google Scholar] [CrossRef]
- Boyce, D.G.; Tittensor, D.P.; Garilao, C.; Henson, S.; Kaschner, K.; Kesner-Reyes, K.; Pigot, A.; Reyes, R.B., Jr.; Reygondeau, G.; Schleit, K.E. A Climate Risk Index for Marine Life. Nat. Clim. Change 2022, 12, 854–862. [Google Scholar]
- Heck, N.; Beck, M.W.; Reguero, B.; Pfliegner, K.; Ricker, M.; Prütz, R. Global Climate Change Risk to Fisheries—A Multi-Risk Assessment. Mar. Policy 2023, 148, 105404. [Google Scholar]
- Lesk, C.; Rowhani, P.; Ramankutty, N. Influence of Extreme Weather Disasters on Global Crop Production. Nature 2016, 529, 84–87. [Google Scholar] [CrossRef]
- Tigchelaar, M.; Battisti, D.S.; Naylor, R.L.; Ray, D.K. Future Warming Increases Probability of Globally Synchronized Maize Production Shocks. Proc. Natl. Acad. Sci. USA 2018, 115, 6644–6649. [Google Scholar] [CrossRef]
- FAO. The State of the World’s Land and Water Resources for Food and Agriculture—Systems at Breaking Point; Food and Agriculture Organization of the United Nations: Rome, Italy, 2021. [Google Scholar]
- IPCC. Climate Change 2022: Impacts, Adaptation and Vulnerability. In Contribution of Working Group II to the Sixth Assessment Report of the Intergovernmental Panel on Climate Change; Cambridge University Press: Cambridge, UK, 2022. [Google Scholar]
- Thiault, L.; Mora, C.; Cinner, J.E.; Cheung, W.W.L.; Graham, N.A.J.; Januchowski-Hartley, F.A.; Mouillot, D.; Sumaila, U.R.; Claudet, J. Escaping the Perfect Storm of Simultaneous Climate Change Impacts on Agriculture and Marine Fisheries. Sci. Adv. 2019, 5, eaaw9976. [Google Scholar] [CrossRef]
- Pinsky, M.L.; Mantua, N.J. Emerging Adaptation Approaches for Climate-Ready Fisheries Management. Oceanography 2014, 27, 146–159. [Google Scholar] [CrossRef]
- Mills, K.E.; Pershing, A.J.; Brown, C.J.; Chen, Y.; Chiang, F.-S.; Holland, D.S.; Lehuta, S.; Nye, J.A.; Sun, J.C.; Thomas, A.C. Fisheries Management in a Changing Climate: Lessons from the 2012 Ocean Heat Wave in the Northwest Atlantic. Oceanography 2013, 26, 191–195. [Google Scholar] [CrossRef]
Disclaimer/Publisher’s Note: The statements, opinions and data contained in all publications are solely those of the individual author(s) and contributor(s) and not of MDPI and/or the editor(s). MDPI and/or the editor(s) disclaim responsibility for any injury to people or property resulting from any ideas, methods, instructions or products referred to in the content. |
© 2025 by the authors. Licensee MDPI, Basel, Switzerland. This article is an open access article distributed under the terms and conditions of the Creative Commons Attribution (CC BY) license (https://creativecommons.org/licenses/by/4.0/).