Article

Fish Diversity and Spatial Patterns in the Upper Yangtze River National Nature Reserve for Rare and Endemic Fish Based on Environmental DNA (eDNA) Technology

1
Laboratory of Water Ecological Health and Environmental Safety, School of Life Sciences, Chongqing Normal University, Chongqing 401331, China
2
Chongqing Key Laboratory of Conservation and Utilization of Freshwater Fishes, Chongqing Normal University, Chongqing 401331, China
3
Institute of Intelligent Chinese Medicine, Chongqing University of Chinese Medicine, Chongqing 402760, China
4
Animal Biology Key Laboratory of Chongqing Education Commission, Chongqing Normal University, Chongqing 401331, China
*
Authors to whom correspondence should be addressed.
Fishes 2025, 10(11), 595; https://doi.org/10.3390/fishes10110595
Submission received: 16 October 2025 / Revised: 6 November 2025 / Accepted: 18 November 2025 / Published: 19 November 2025

Abstract

The Upper Yangtze River National Nature Reserve for Rare and Endemic Fish is a critical sanctuary facing increasing pressure from hydropower development. To assess its current ecological state, we employed environmental DNA (eDNA) metabarcoding on 48 water samples collected from 16 transects in August 2024. Our analysis identified 93 fish species from 3 orders, 13 families, and 67 genera, of which 89 were consistent with historical records. The Cyprinidae family was dominant. The fish community was predominantly characterized by slow-flowing, benthic, omnivorous, and migratory taxa that lay adhesive eggs, with key life-history traits including a sexual maturity age of 1–4 years and a length at first maturity under 20 cm. Spatially, species richness was highest in the Chishui River (64 species), followed by the Minjiang River (61 species). While alpha diversity was largely consistent across most rivers (except the Minjiang), beta diversity analysis revealed significant compositional differences among basins (PERMANOVA, R2 = 0.2747, p = 0.001). Notably, the Chishui River supported not only the highest richness but also a distinct community structure. In summary, this study provides a systematic current status assessment of the reserve’s fish resources, revealing significant spatial heterogeneity, Our findings underscore the potential impacts of dam construction and offer a scientific basis for informing effective conservation strategies.
Key Contribution: Environmental DNA (eDNA) metabarcoding uncovered distinct fish communities across the Upper Yangtze River National Nature Reserve. Notably, the undammed Chishui River demonstrated both the highest species richness and a unique composition, findings which provide critical baseline information for future monitoring.

1. Introduction

Fish represent a vital biotic component of aquatic ecosystems [1,2], and their diversity plays a fundamental role in maintaining structural integrity and functional stability [3]. However, increasing human exploitation of river resources has severely threatened fish diversity, leading to alarming declines in populations. The expansion of large-scale water conservancy infrastructure—particularly the construction of cascaded hydropower stations—has severely impaired longitudinal connectivity in river systems [4,5]. Such alterations not only directly interfere with fish physiology and behavior but also contribute to significant declines in fish diversity at the watershed scale. These declines, in turn, affect fish population dynamics and compromise the health and sustainability of aquatic ecosystems as a whole.
This is particularly evident in the Yangtze River. As the world’s third-longest river and China’s most critical freshwater ecosystem, its upper reaches have been intensively developed with a series of large hydropower projects, including major dams such as the Three Gorges—the world’s largest hydraulic project—and Xiangjiaba [6,7]. These structures have altered the natural hydrological regime, exacerbating habitat fragmentation and impairing critical migratory corridors for fish [8,9,10,11,12,13]. As a result, fish populations have declined considerably, community structure has shifted toward homogenization, and species diversity has markedly eroded [9,10,11,12,13], collectively increasing the risk of systemic ecosystem degradation. Against this backdrop, the establishment of the Upper Yangtze River National Nature Reserve for Rare and Endemic Fish (hereafter “the Reserve”) serves as a crucial ecological refuge for conserving fish diversity and germplasm resources in the upper Yangtze Basin.
Conventional methods for assessing fish resources, which rely heavily on fishing operations, present several limitations. These include invasiveness and harm to aquatic organisms, high labor and financial costs, a strong dependence on specialized taxonomic expertise, and low detection efficiency for rare and cryptic species [14,15]. In contrast, environmental DNA (eDNA) technology detects genetic materials released by organisms into environmental samples such as water [16]. By integrating DNA extraction, amplification, high-throughput sequencing, and bioinformatic analysis, it enables efficient and accurate identification of species composition, distribution patterns, and biodiversity characteristics in target areas [17,18,19]. Owing to its non-invasive nature and high sensitivity, this approach effectively overcomes the drawbacks of traditional methods and offers a robust alternative for monitoring aquatic biodiversity [20]. Although eDNA technology originated in microbial diversity research [21], it gained prominence in aquatic ecology following the pioneering study by Ficetola et al., (2008), which successfully detected the invasive American bullfrog (Rana catesbeiana) [22]. Its applicability in fish research was further demonstrated by Jerde et al., (2011) through the identification of invasive ‘Asian carp’ [23]. To date, eDNA technology has been widely applied in fish diversity studies across the Yangtze River Basin [24,25,26], where it has consistently shown high applicability and reliability, establishing itself as a key tool for monitoring and conserving fish resources in the region.
Established in 2005, this Reserve spans Sichuan, Guizhou, and Yunnan Provinces as well as Chongqing Municipality, covering a total area of approximately 33,174.213 hectares. It protects roughly 1162.61 km of riverine habitat, including sections of the upper Yangtze River’s mainstem and its major tributaries. The region features complex topography, significant elevational variation, and a dense river network, which collectively support diverse aquatic habitats [27,28]. These habitats serve as critical refuges for many rare and endemic fish species, such as the first-level nationally protected Acipenser dabryanus, the second-level nationally protected Myxocyprinus asiaticus, and the upper Yangtze endemic Leptobotia rubrilaris [29,30]. However, existing data on fish resources in the area suffer from notable spatiotemporal limitations. Most records are concentrated in the mainstem or isolated tributaries, as illustrated by a recent study by Wang et al., which was confined to the Chongqing section of the reserve [31]. Moreover, the most recent comprehensive basin-wide survey was conducted prior to 2010 [32]. This outdated and spatially biased data hinders an accurate assessment of the current status and overall patterns of fish diversity. In the context of ongoing ecological recovery under the “Ten-Year Fishing Ban” in the Yangtze Basin, this study employs eDNA technology to conduct a systematic survey of fish composition and spatial distribution patterns. Our objective is to provide timely and detailed evidence to support targeted conservation strategies and science-informed policy adjustments for the Reserve.

2. Materials and Methods

2.1. Study Area and Sampling Design

The reserve is geographically situated between 104°9′–106°30′ E and 27°29′–29°4′ N and encompasses a network of seven rivers: the Yangtze River mainstem, the Chishui River, the Minjiang River, the Nanguang River, the Changning River, the Yongning River, and the Tuojiang Rivers. To capture the environmental heterogeneity, we systematically established 16 sampling transects distributed as follows: six along the Yangtze mainstem (JSJ, JA, NX, HJ, ZY, JJ), five in the Chishui River (ZX, MT, GL, XS, CS), and one each in the Minjiang River (MJ), Nanguang River (NGH), Changning River (CNH), Yongning River (YNH), and Tuojiang River (TJ) Rivers. At each transect, three sampling points were arranged with consideration for spacing and river sinuosity, resulting in a total of 48 sampling points to ensure spatial representation and habitat coverage. The study area and sampling layout are illustrated in Figure 1.

2.2. Water Collection and eDNA Enrichment

Field sampling was conducted in August 2024. At each sampling point, a 2 L integrated water sample was collected from the surface, middle, and bottom layers using a sterilized stainless-steel water sampler. The composite sample was stored in a sterile PET bottle and immediately placed in an ice-packed cooler to minimize DNA degradation. A field blank control was prepared at each transect by filtering 2 L of purified water that had been exposed to ambient air during sampling. To minimize exogenous contamination and cross-interference, all equipment (including water samplers and sample bottles) was sterilized by immersion in a 10% bleaching powder solution prior to use at each transect, followed by two rinses with distilled water. Immediately before sampling, equipment was further rinsed once with ambient river water from the sampling site. Field personnel also changed disposable sterile gloves between different transects.
Water samples from the three sampling points within each transect were pooled in equal volumes and thoroughly homogenized. The composite sample was then divided into three parallel 2 L aliquots, resulting in a total of 48 samples. Each of these three aliquots per transect was processed independently through subsequent DNA extraction and PCR amplification. Prior to homogenization, water samples were pre-filtered through sterile medical gauze when necessary to remove sediment or coarse suspended solids [33]. All samples were filtered within 24 h using a vacuum filtration system (SHZ-D(III), Shanghai, China) through 0.45 µm mixed cellulose membranes (Whatman, Maidstone, UK) to concentrate environmental DNA. A distilled water blank was processed alongside the samples at each transect to monitor potential contamination. The filtration unit was sterilized with a bleach solution between samples to prevent cross-contamination. The eDNA-bearing membranes were placed into nuclease-free EP tubes and stored at −80 °C until DNA extraction.

2.3. PCR Amplification

Total DNA was extracted from the filter membranes using the PowerWater® DNA Isolation Kit (Omega Bio-tek, Norcross, GA, USA). For each sample, three independent parallel extractions were performed, including a blank filter membrane as a negative control. The quality of extracted DNA was verified by 1% agarose gel electrophoresis, and qualified samples were stored at −20 °C for subsequent analysis.
A fragment of the mitochondrial 12S rRNA gene was amplified using the universal primer pair Tele02 (Tele02-F: 5′-AAA CTC GTG CCA GCC ACC-3′; Tele02-R: 5′-GGG TAT CTA ATC CCA GTT TG-3′) [34,35]. Amplifications were performed in a 20 μL reaction mixture containing 4 μL of 5× FastPFU Buffer (Transgene Biotech, Beijing, China), 2 μL of dNTPs (2.5 mM), 0.4 μL of FastPFU DNA Polymerase, 10 ng of template DNA, and 0.8 μL each of forward and reverse primers (10 μM). Thermal cycling was conducted on an ABI GeneAmp® 9700 system (Applied Biosystems, Foster City, CA, USA) under the following conditions: initial denaturation at 95 °C for 5 min; 35 cycles of denaturation at 95 °C for 30 s, annealing at 55 °C for 30 s, and extension at 72 °C for 45 s; final extension at 72 °C for 10 min; and hold at 10 °C.
The number of PCR cycles was set to 35 to enhance the detection sensitivity for low-abundance eDNA templates, consistent with common practice in metabarcoding studies [36,37]. To mitigate potential biases associated with higher cycle numbers (e.g., amplification bias and chimera formation), each sample was amplified in triplicate, and a negative control with ddH2O as template was included in each run. Amplification products from the same sample were combined in equal volumes and verified by 2% agarose gel electrophoresis. A total of 48 samples were examined, revealing a target band of approximately 270 bp in length, while no target band was observed in any negative control. The target bands were excised and purified using the AxyPrep™ DNA Gel Extraction Kit (Axygen, Hangzhou, China).
Purified amplicons were then used for PE300 library construction, which involved ligation of “Y”-shaped adapters, bead-based purification to remove adapter dimers, PCR amplification using a unique dual index (UDI) strategy to mitigate index hopping, and NaOH denaturation to generate single-stranded DNA. Sequencing was performed by LingEn Bio-Technology Co., Ltd. (Shanghai, China) on an Illumina NovaSeq 6000 platform (Illumina, San Diego, CA, USA).

2.4. Bioinformatic Analysis

The raw reads were processed using Trimmomatic (v.0.36) to remove low-quality reads. Based on the overlap between the original paired-end reads, FLASH (v1.2.7) was used to merge them into single sequences. Chimeric sequences were removed using a combined denovo and reference-based approach with Usearch (version 10) against the GOLD database (https://gold.jgi.doe.gov/, accessed on 7 September 2024). Additionally, primers were trimmed using Cutadapt (version 4.0, https://cutadapt.readthedocs.io/, accessed on 7 September 2024). Finally, high-quality sequences were clustered, with unique sequences being obtained. Representative sequences from each MOTU were taxonomically assigned via BLASTn (version 2.15.0) alignment against a series of databases in the following order of priority: a fish mitochondrial database (http://mitofish.aori.u-tokyo.ac.jp/download.html, accessed on 10 September 2024), the NT-euk database, and a custom freshwater fish database (Ling’en Bio; https://www.checklistbank.org/dataset/1010/download, accessed on 12 September 2024). Assignments required a minimum of 97% sequence identity, an e-value of ≤10−5, and query coverage of ≥90%. All MOTUs not assigned to fish were excluded from subsequent analysis.
No fish taxonomic units were detected in any of the negative controls (i.e., reads = 0), indicating minimal risk of cross-contamination during the experimental process. To ensure taxonomic accuracy, the preliminary assignments were further verified and manually corrected by cross-referencing regional historical records and survey literature, including Sichuan Fish Fauna [38], Guizhou Fish Fauna [39], and the Scientific Survey Report on the National Nature Reserve for Rare and Endemic Fishes in the Upper Yangtze River [32]. Species protection status was validated against the National List of Key Protected Wild Animals (https://www.gov.cn/zhengce/2021-02/05/content_5727412.htm, accessed on 10 October 2024) to accurately categorize protected species. The final species list was established following this comprehensive manual curation step.

2.5. Statistical Analysis

Spatial patterns in fish communities were examined at two spatial scales: sampling transect and individual river. Using the effective sequence counts of species (Supplementary Table S1), we quantified species composition and relative abundance and computed the dominance index [35]. In addition, all detected fish species were classified according to key ecological traits: flow preference (slow-flowing, fast-flowing, or eurytopic), vertical habitat (pelagic, demersal, or benthic), feeding habit (carnivorous, omnivorous, or herbivorous), spawning type (adhesive, pelagic, demersal, floating, or specialized), the time of first sexual maturity (≤1 year, 1–4 years, or >4 years), body length at first sexual maturity (<10 cm, 10–20 cm, or >20 cm), and migratory behavior (migratory or non-migratory) (Supplementary Table S2).
To ensure comparability across samples, sequence data were normalized by rarefaction to the minimum sequencing depth observed among all samples using QIIME v.1.9.0 [40]. This process involved randomly subsampling the sequences from each sample to an equal number, thereby mitigating biases resulting from uneven sequencing efforts. Following normalization, the relative read abundance of each species per sample was preserved, allowing for consistent cross-sample comparisons. The mean values of three replicate PCR amplifications were then calculated for all subsequent analyses.
Alpha diversity was assessed using the Shannon index [41], Simpson index [42], and Pielou’s evenness index [43]. The α-diversity indices were computed using the Biozeron cloud platform. Statistical analysis of intergroup differences was performed using SPSS (version 27.0.1): the Kolmogorov–Smirnov test was applied to evaluate normality and other assumptions, followed by one-way ANOVA for data satisfying these assumptions. For data violating the assumptions, the Kruskal–Wallis test was used to examine differences in α-diversity among samples.
Based on the Bray–Curtis distance matrix, we performed a permutational multivariate analysis of variance (PERMANOVA) to test for overall differences in community structure between groups, analyzed homogeneity of group dispersions (PERMDISP) to assess variance heterogeneity, and visualized beta diversity patterns using principal coordinates analysis (PCoA). McNaughton’s dominance index was used to identify dominant species [44]. Dominant species in each river section were defined as those with a dominance index (Yi) greater than 0.02. The relevant calculation formulas are as follows:
Shannon Index: H = ∑ PilogPi, Pi = ni/N
Simpson Index: D = 1 − ∑ ni(ni − 1)/N(N − 1)
Pielou Index: J = H/Hmax
Dominance Index: Yi = ni/N × fi
In the equations, N represents the total number of sequences, nᵢ denotes the number of sequences of species “i”, “H” is the Shannon index. “Hmax” denotes the maximum Shannon index achievable under equal species richness (i.e., all species in the community have the same richness), and fᵢ indicates the occurrence frequency of species “i”.

3. Results

3.1. eDNA Sequencing Overview and Data Quality

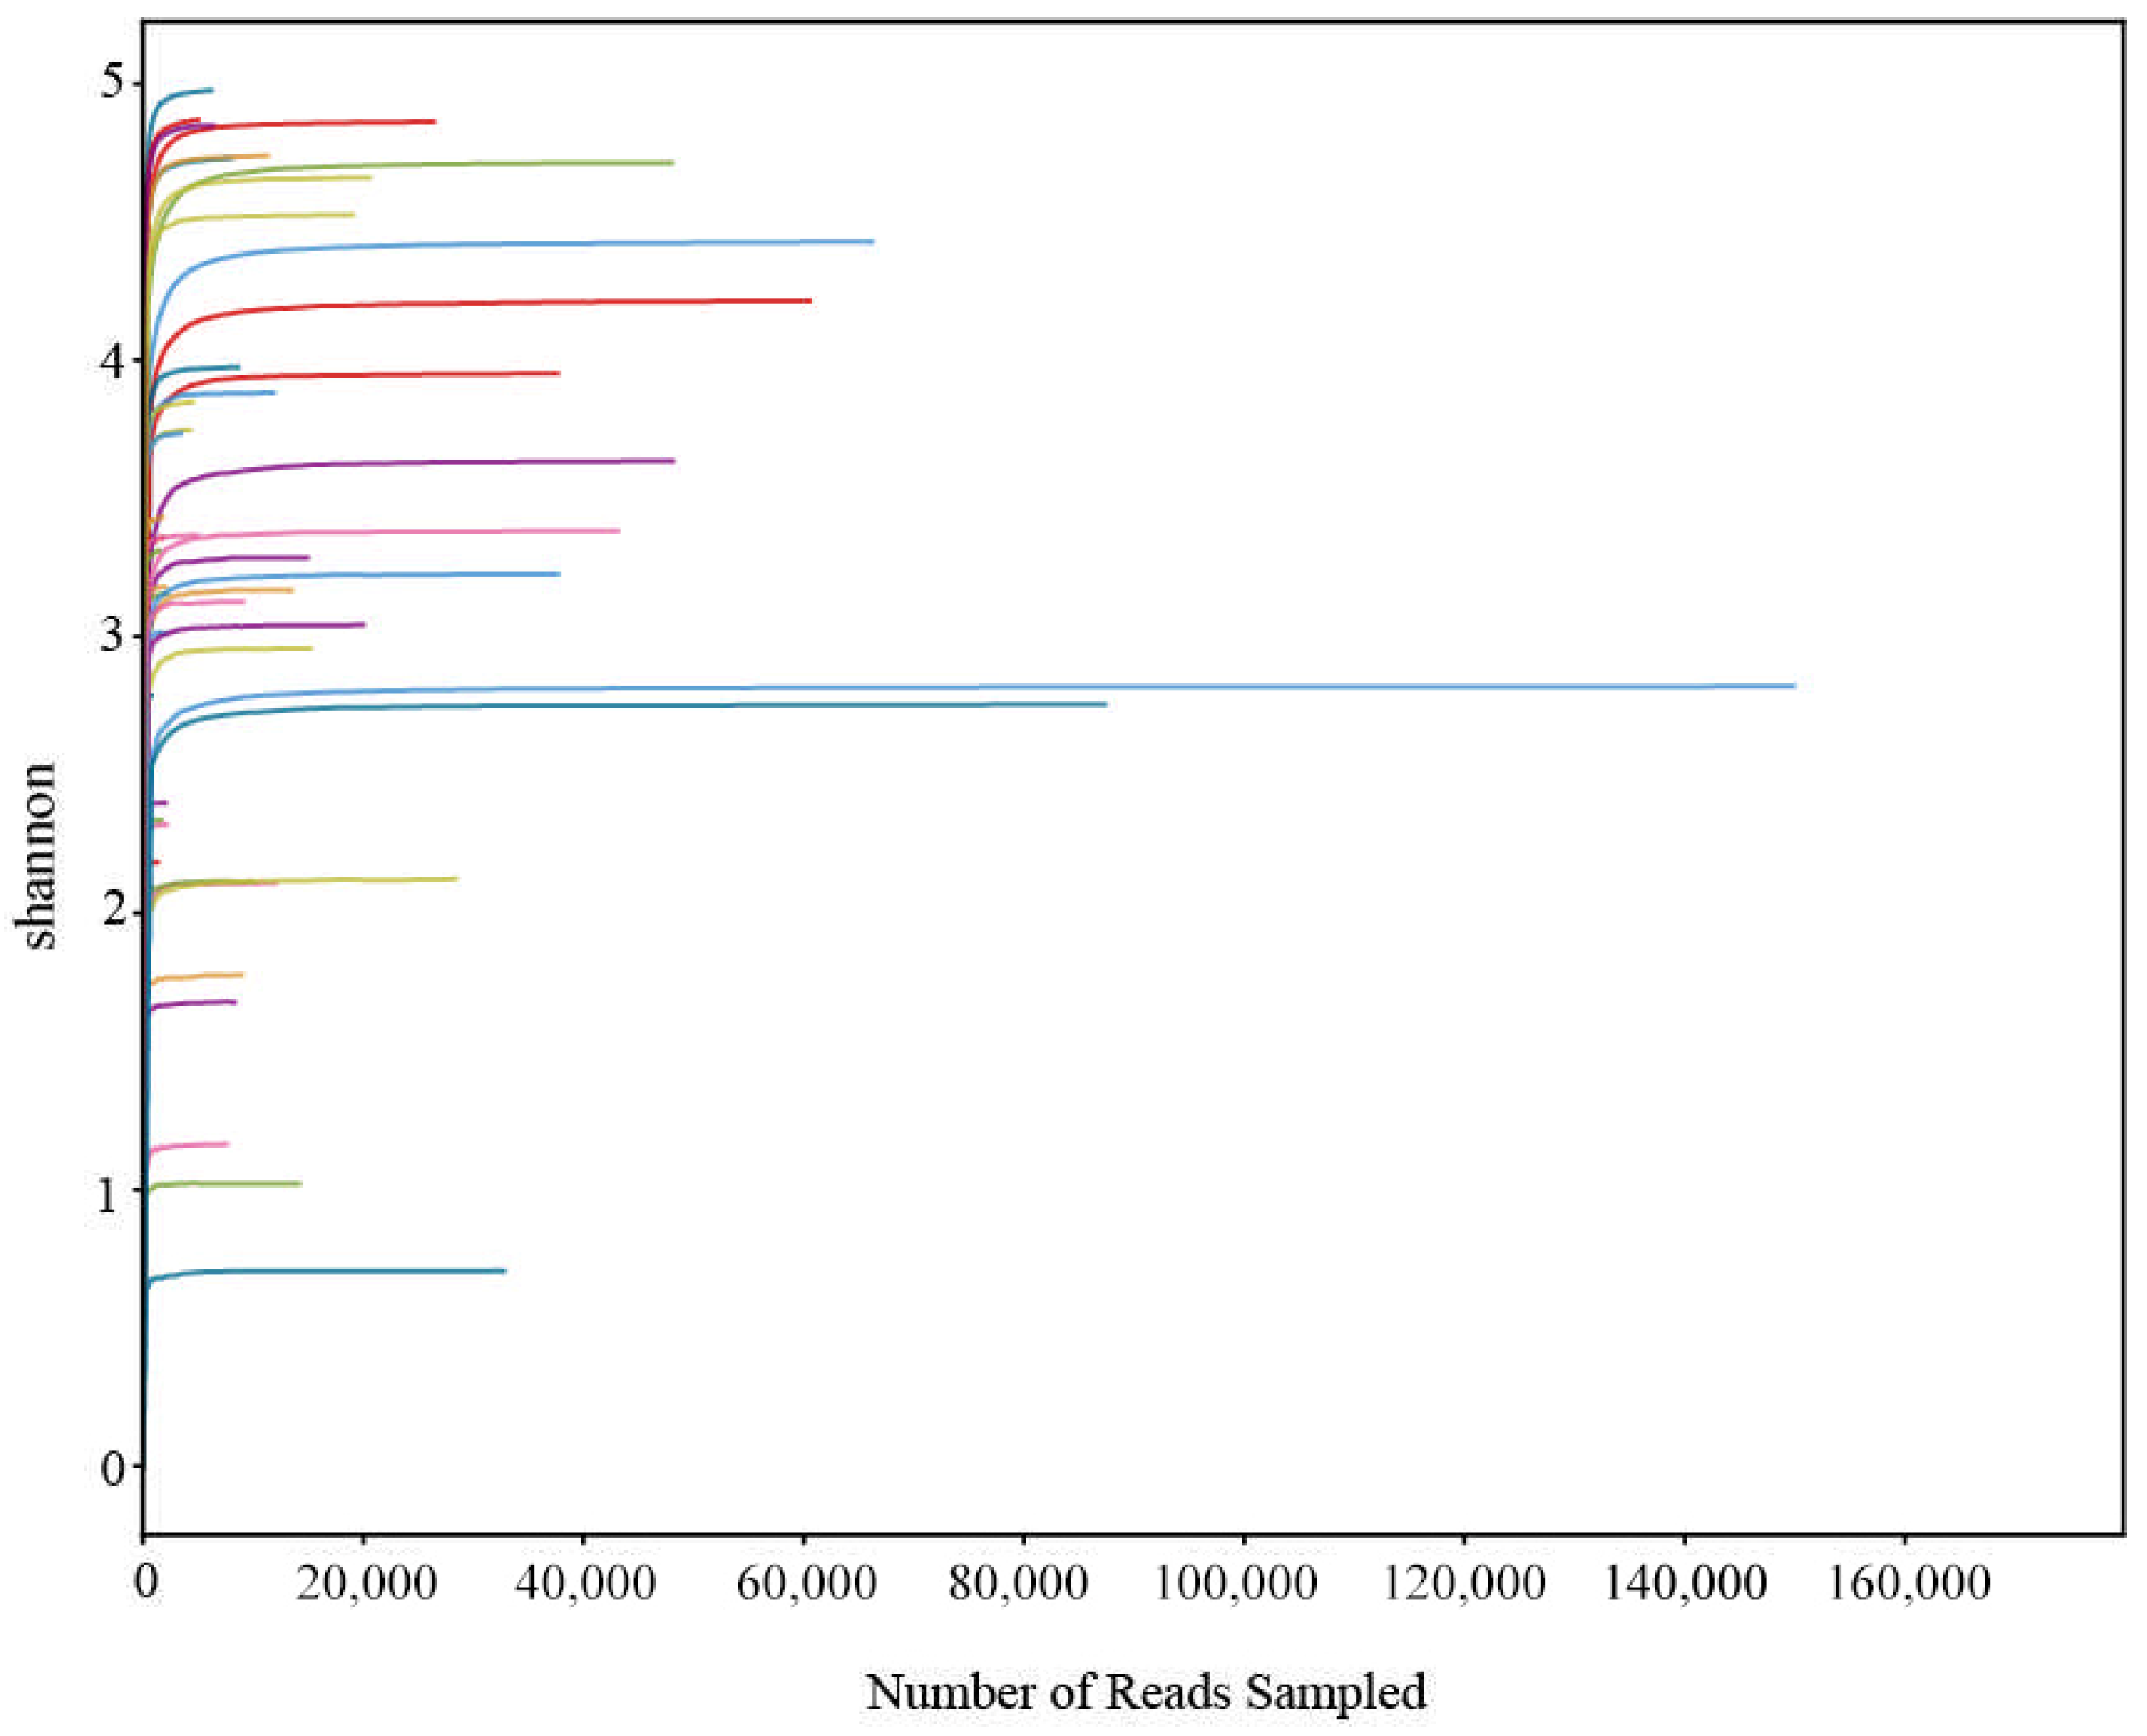
A total of 932,951 high-quality valid sequences were generated from 48 water samples (Supplementary Table S3). The raw data has been deposited in the NCBI SRA database with accession numbers SRR35420248-SRR35420295. These sequences were clustered into 93 Molecular Operational Taxonomic Units (MOTUs). Rarefaction curves demonstrated sufficient sequencing depth, which could accurately reflect the true composition of fish species in the samples (Figure 2).

3.2. Fish Community Composition and Structure

Environmental DNA monitoring detected 93 fish species, representing 3 orders, 13 families, and 67 genera. Cypriniformes constituted the dominant order, accounting for 75.27% of all species, followed by Siluriformes (17.20%) and Perciformes (7.53%). At the family level, Cyprinidae showed the highest richness (63.44%), followed by Bagridae (10.75%) and Cobitidae (8.60%). Specimens of the genus Triplophysa were identified only to the genus level. Among the detected species, four are listed as national key protected species, 22 are endemic to the upper Yangtze River, and six are alien species.
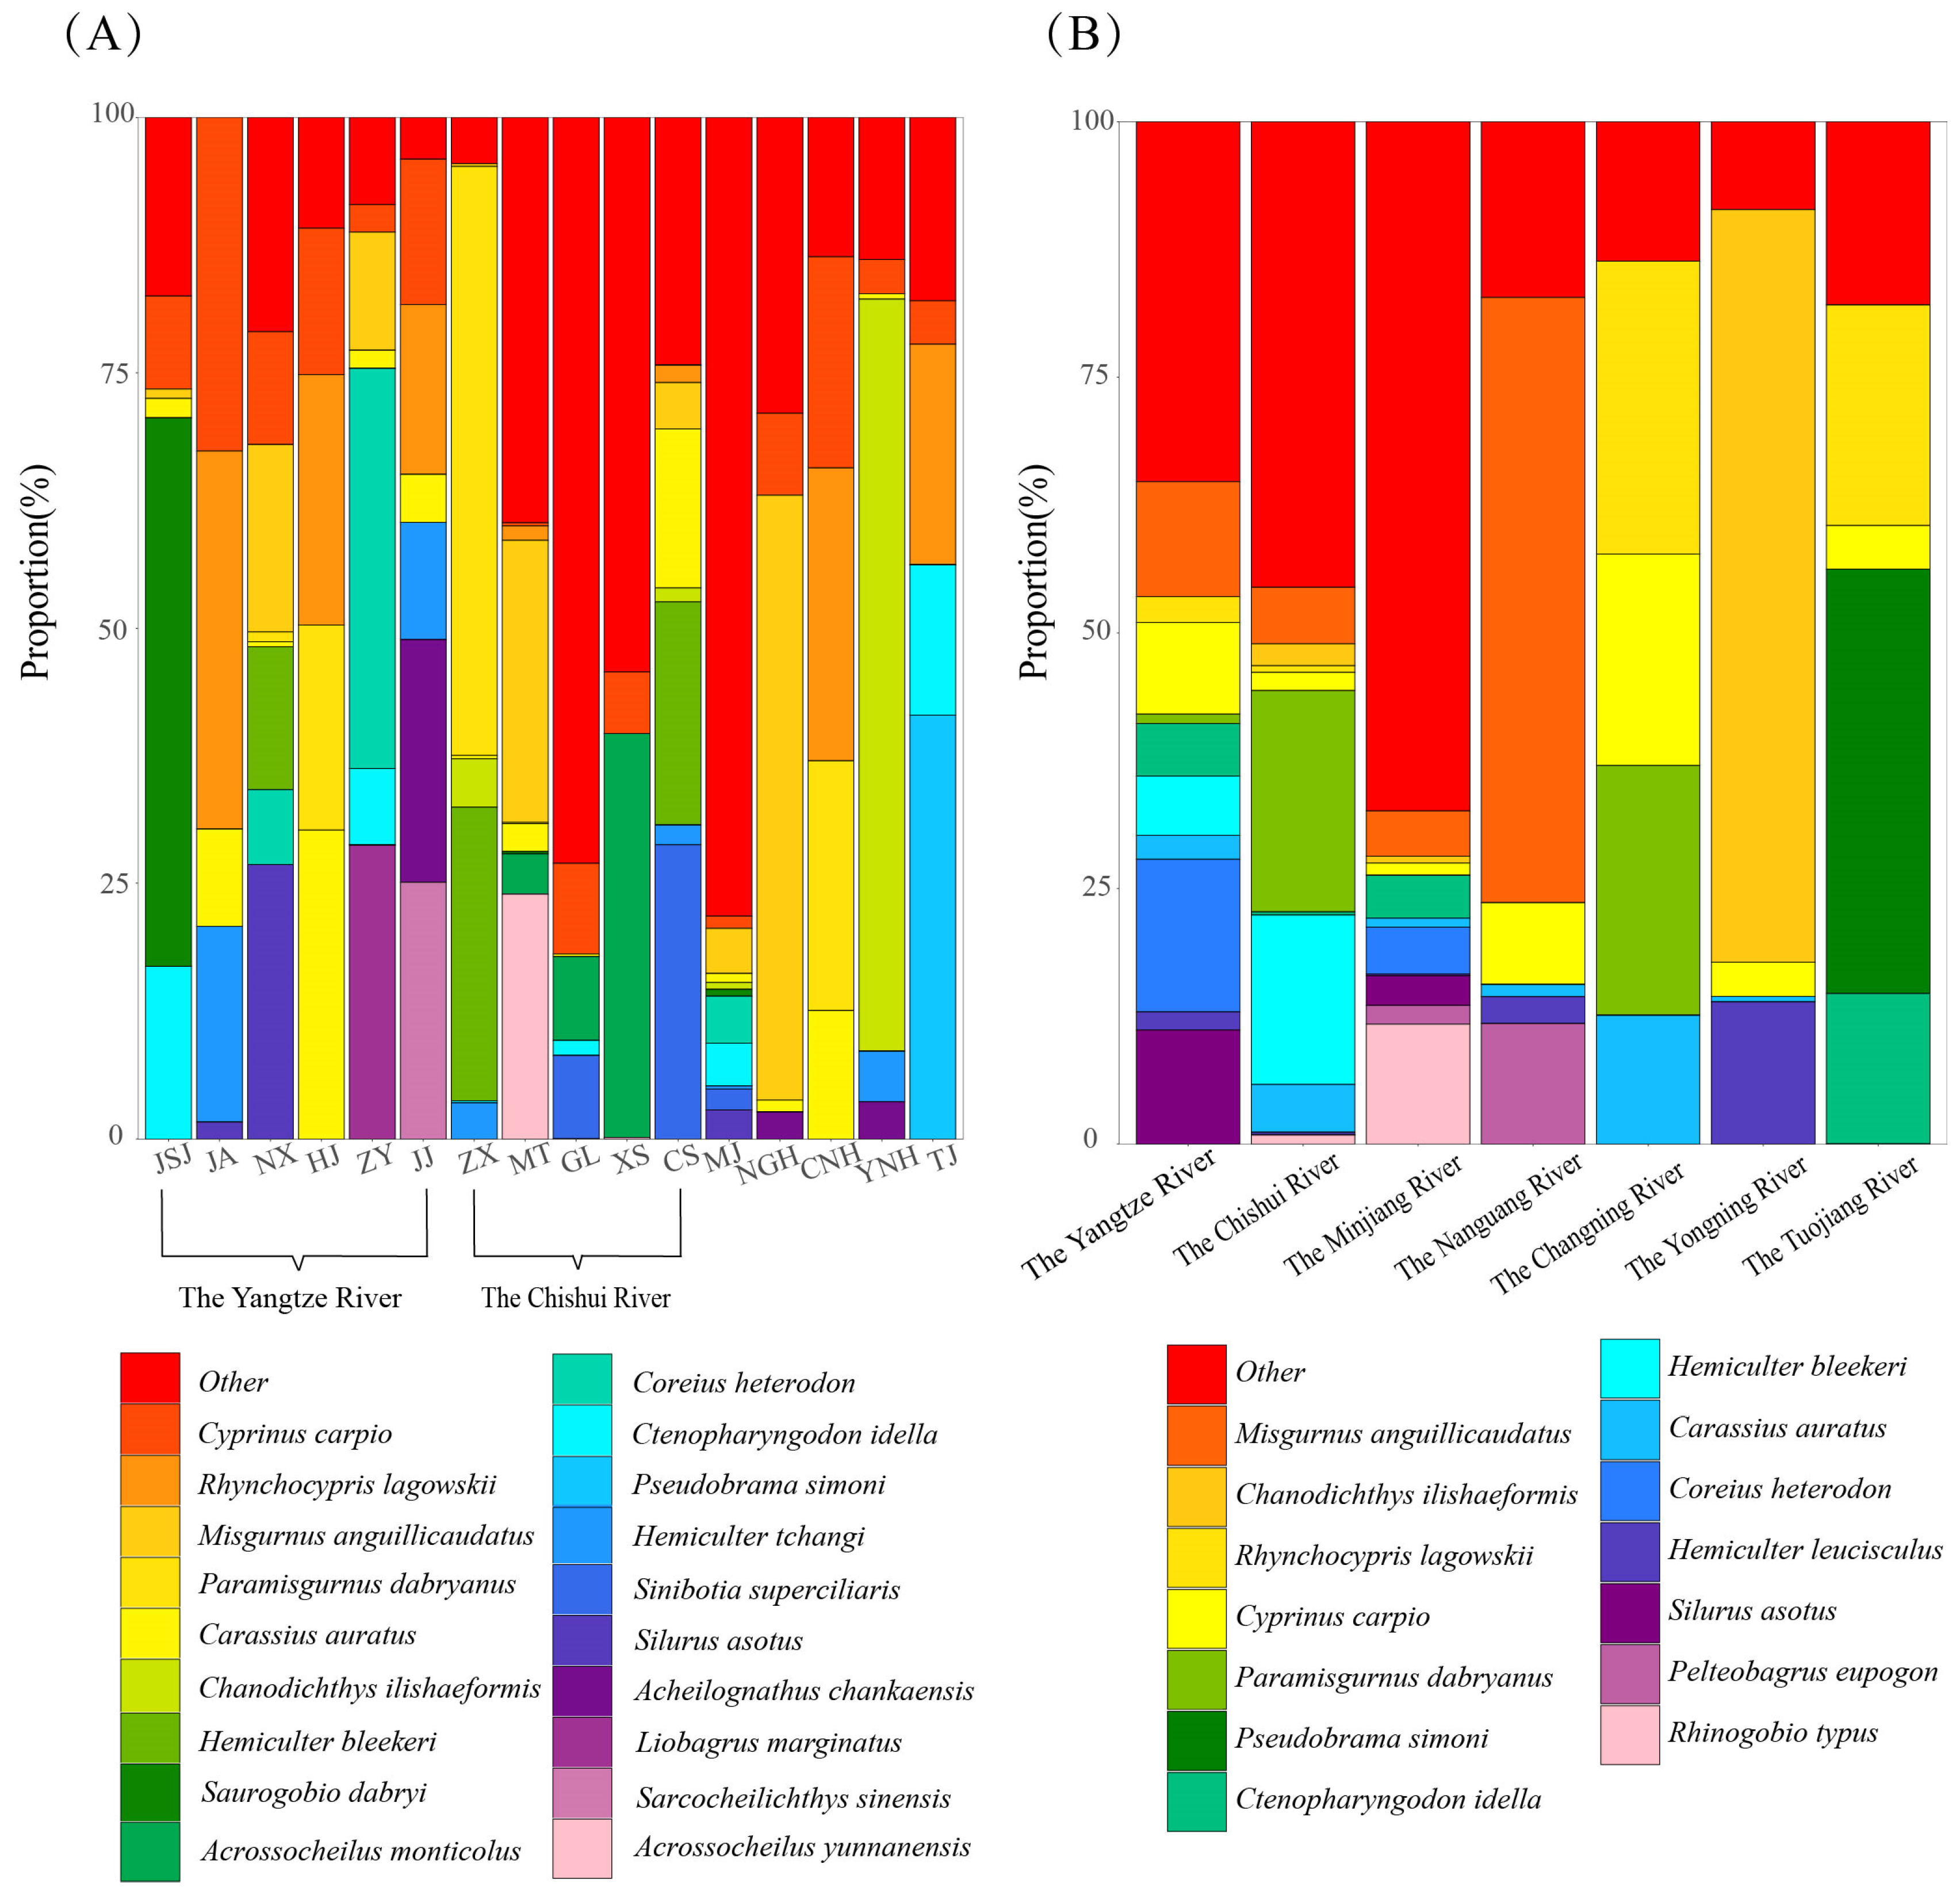
Species richness varied across rivers (Supplementary Table S1), with the Chishui River supporting the highest number of species (64), followed by the Minjiang River (61), the mainstem of the Yangtze River (36), the Nanguang River (17), the Tuojiang River (9), the Changning River (6), and the Yongning River (6). Analysis of relative sequence abundance—defined as the proportion of sequencing reads assigned to a given taxon relative to the total reads in a sample—revealed distinct distribution patterns among dominant species (Figure 3). Cyprinus carpio was widely distributed across all rivers and exhibited a relatively high relative sequence abundance; Misgurnus anguillicaudatus was widely distributed in the Yangtze River, Chishui River, Minjiang River, and Nanguang River; while Chanodichthys erythropterus and Pseudobrama simoni displayed high relative sequence abundances in the Yongning River and Tuojiang River, respectively. It should be noted that relative read abundance serves as a proxy for biological representation and can be influenced by methodological factors such as gene copy number variation, DNA extraction efficiency, and PCR amplification bias. Thus, while suitable for assessing community composition in this study, it does not directly reflect absolute organismal biomass.
Among the alien fish species, Pseudohemiculter dispar was distributed in the Chishui River and Nanguang River; Oreochromis niloticus and M. terminalis were found only in the Chishui River; Channa gachua occurred in the Changning River; and M. skolkovii and Pseudorasbora parva were detected in the Minjiang River.
Dominance index analysis across the entire reserve identified four dominant species: C. auratus, C. carpio, M. anguillicaudatus, and P. dabryanus. In contrast, no significant dominant species were observed in the Minjiang River. At the river scale, dominant fishes are predominantly small-sized (with body length at first maturity < 20 cm), including Hemiculter bleekeri, Acrossocheilus monticolus, and A. yunnanensis in the Chishui River, and Acheilognathus chankaensis and C. erythropterus in the Yongning River (Supplementary Table S4).
Based on historical records and field surveys, a total of 225 fish species have been documented in the reserve, belonging to 9 orders, 28 families, and 114 genera (Supplementary Table S5). The most species-rich families were Cyprinidae, Cobitidae, and Bagridae, collectively accounting for 73.89% of all species, with respective contributions of 53.98%, 12.39%, and 7.52%. Historically, 16 species are classified as national key protected fishes, 76 are endemic to the upper Yangtze River, and 19 are recognized as alien species. Comparison with the historical dataset showed that 89 species detected in our August survey had been previously recorded (Supplementary Table S6), corresponding to an overall coverage of 39.56% (Supplementary Figure S1). Notably, several endemic species from the upper Yangtze River, such as Anabarilius liui, A. songmingensis, Platysmacheilus nudiventris, and Jinshaia abbreviata, were not detected during the August survey.

3.3. Ecological Types of Species

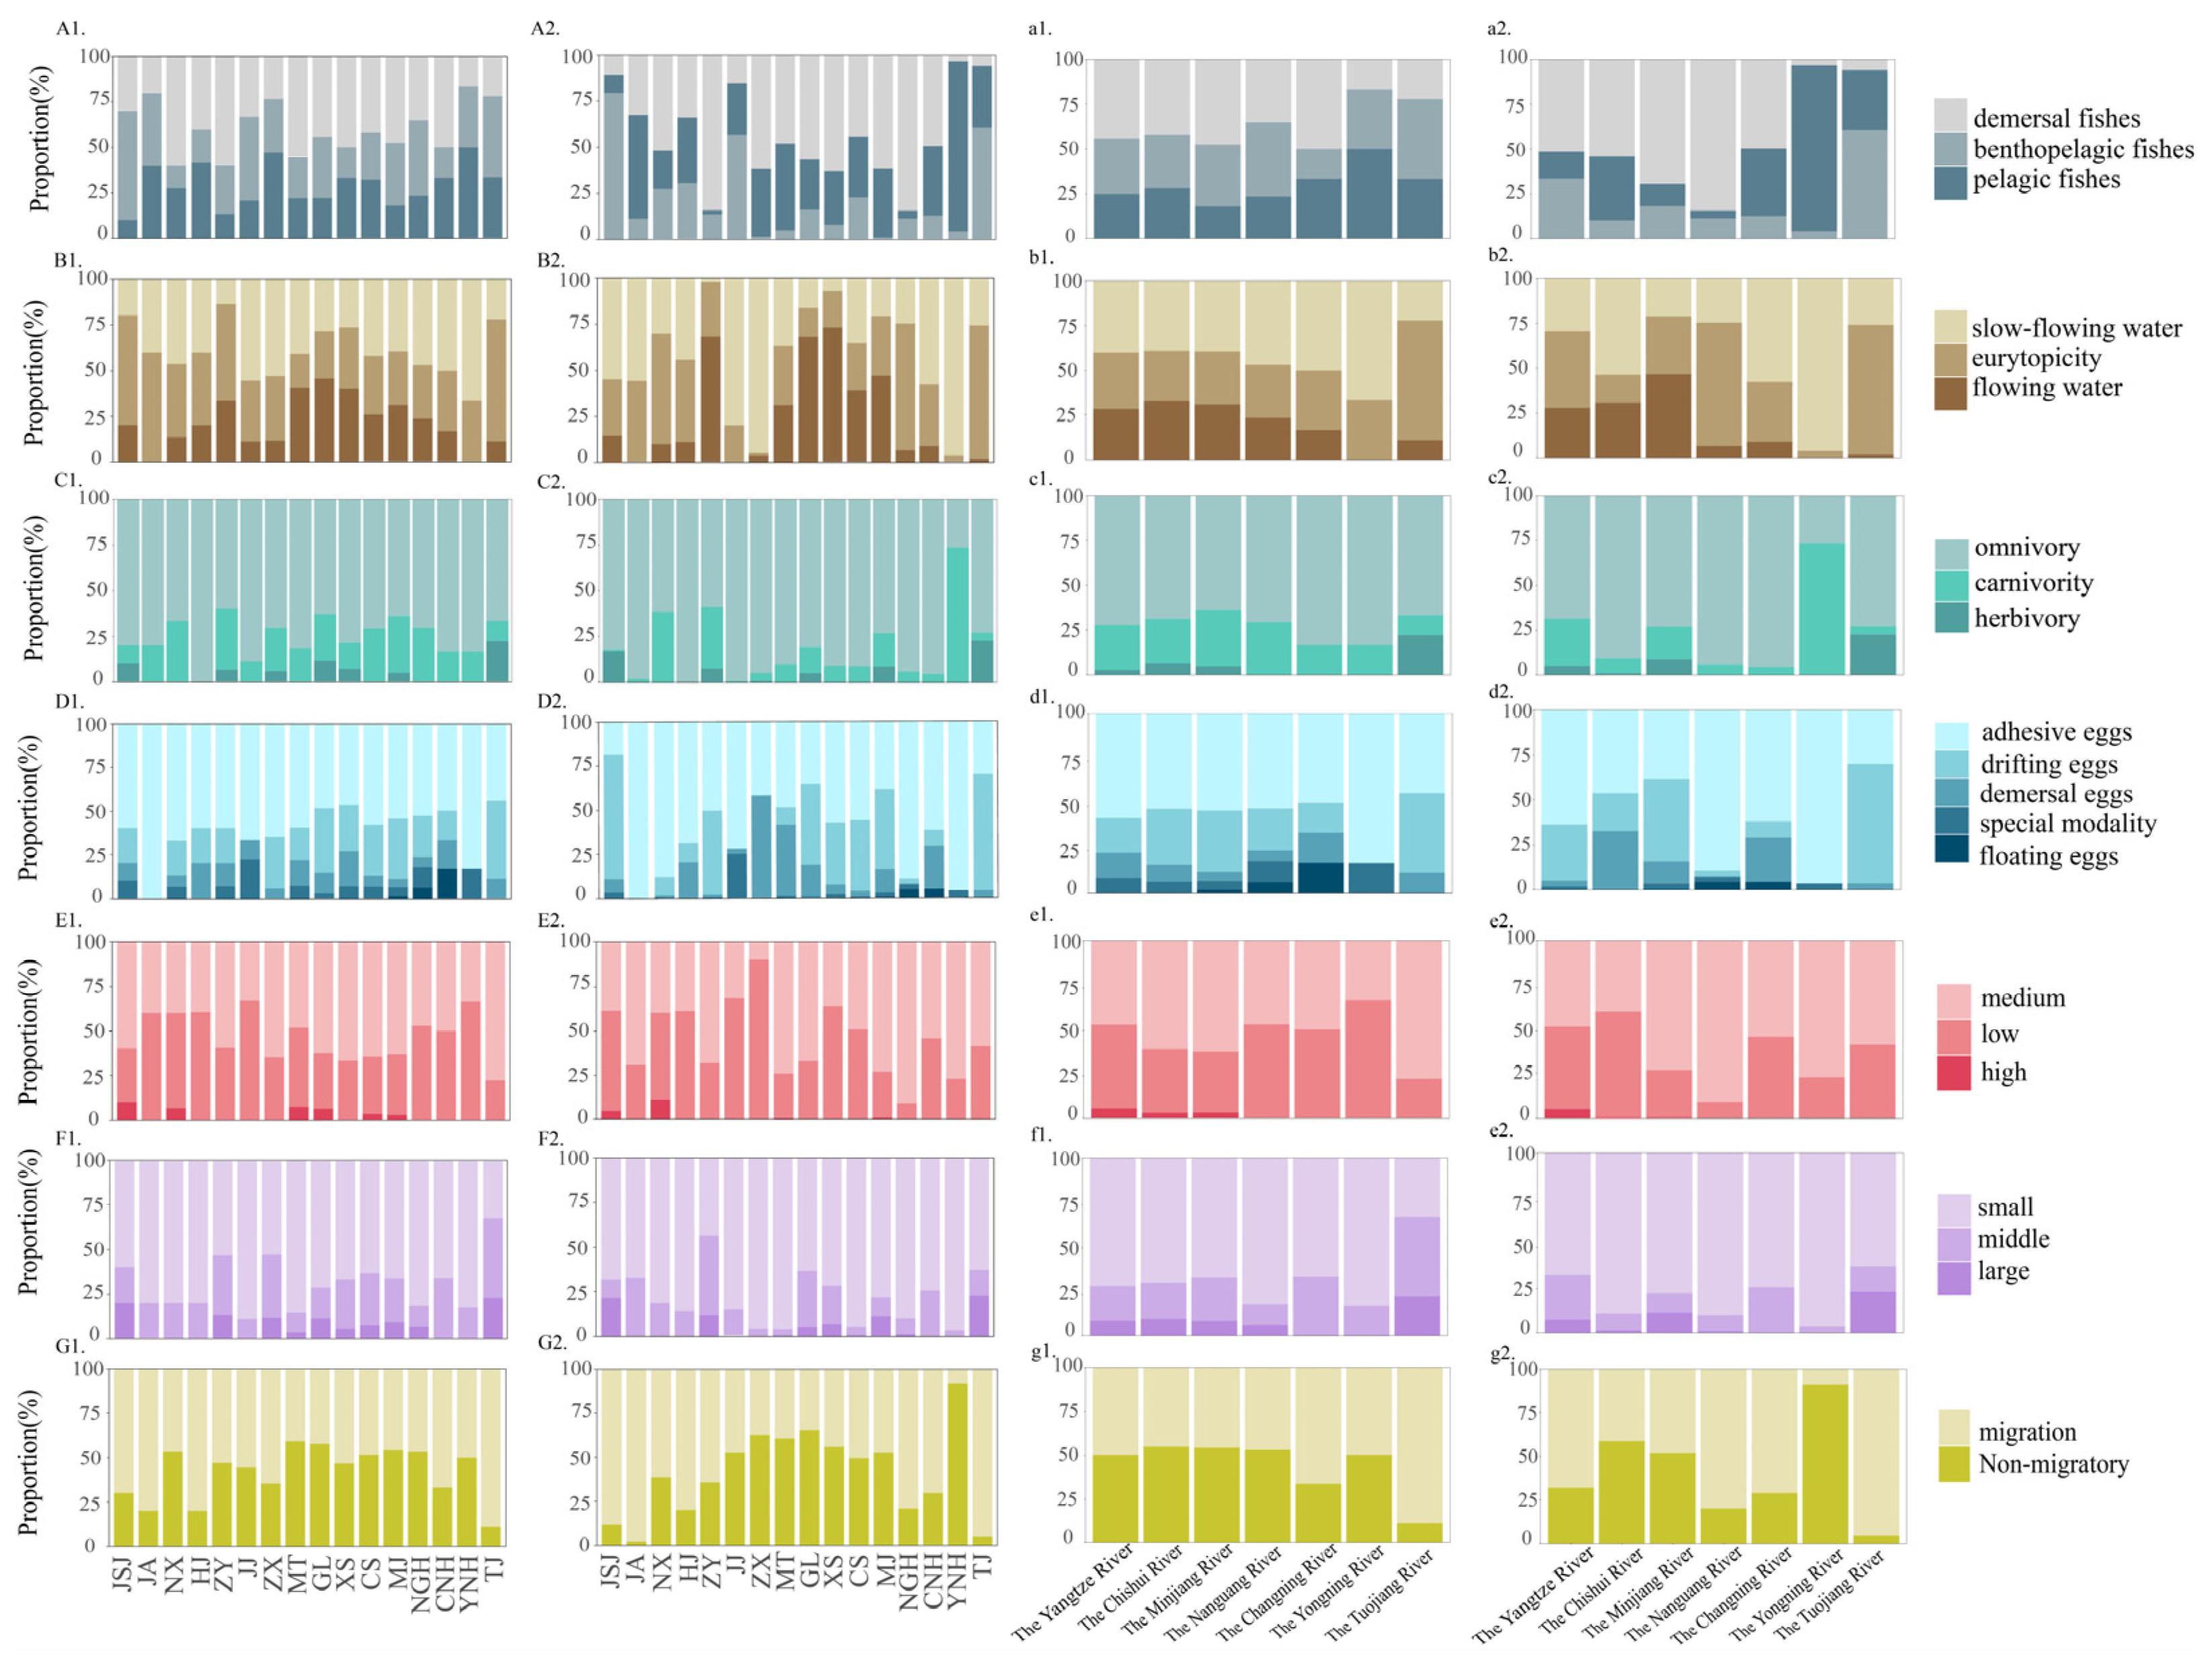
At the species level (Figure 4), the fish community in the reserve was predominantly characterized by ecological groups adapted to slow-flowing benthic habitats, with omnivorous feeding habits, adhesive egg deposition, an age at first maturity of 1–4 years, a body length at first maturity of <20 cm, and migratory behavior. At the individual river scale, the Nanguang and Tuojiang Rivers were dominated by mid- and bottom-water dwellers, whereas the Yongning River showed a higher proportion of surface-water species. Non-migratory fishes prevailed in the Chishui, Minjiang, and Nanguang Rivers, while the composition of other ecological guilds in the remaining rivers was consistent with the overall pattern.
Analysis based on relative sequence abundance revealed clear divergence in ecological types among rivers, despite general consistency with reserve-wide trends. Notably, the Minjiang River supported a significantly higher proportion of flowing-water-adapted taxa and drifting-egg producers compared to other river systems. The Nanguang River was characterized by the highest abundance of generalist species, contrasting with the more specialized assemblages observed elsewhere. Fish assemblages in the Tuojiang River were dominated by mid- to lower-water-column dwellers, a composition distinct from that of the adjacent rivers. Furthermore, the Chishui River exhibited a markedly higher proportion of short-lived species (age at first maturity ≤1 year) relative to other basins (Figure 4). At the transect level, cluster analysis highlighted additional ecological differentiation: the GL and XS transects supported more rheophilic species (forming a distinct rheophilic cluster, Figure 4(A1,A2), whereas the JSJ and GL transects showed a higher relative abundance of fishes producing drifting eggs compared to those laying adhesive eggs, indicating clear reproductive strategy segregation (Figure 4(D1,D2)).

3.4. Spatial Patterns of Fish Alpha Diversity

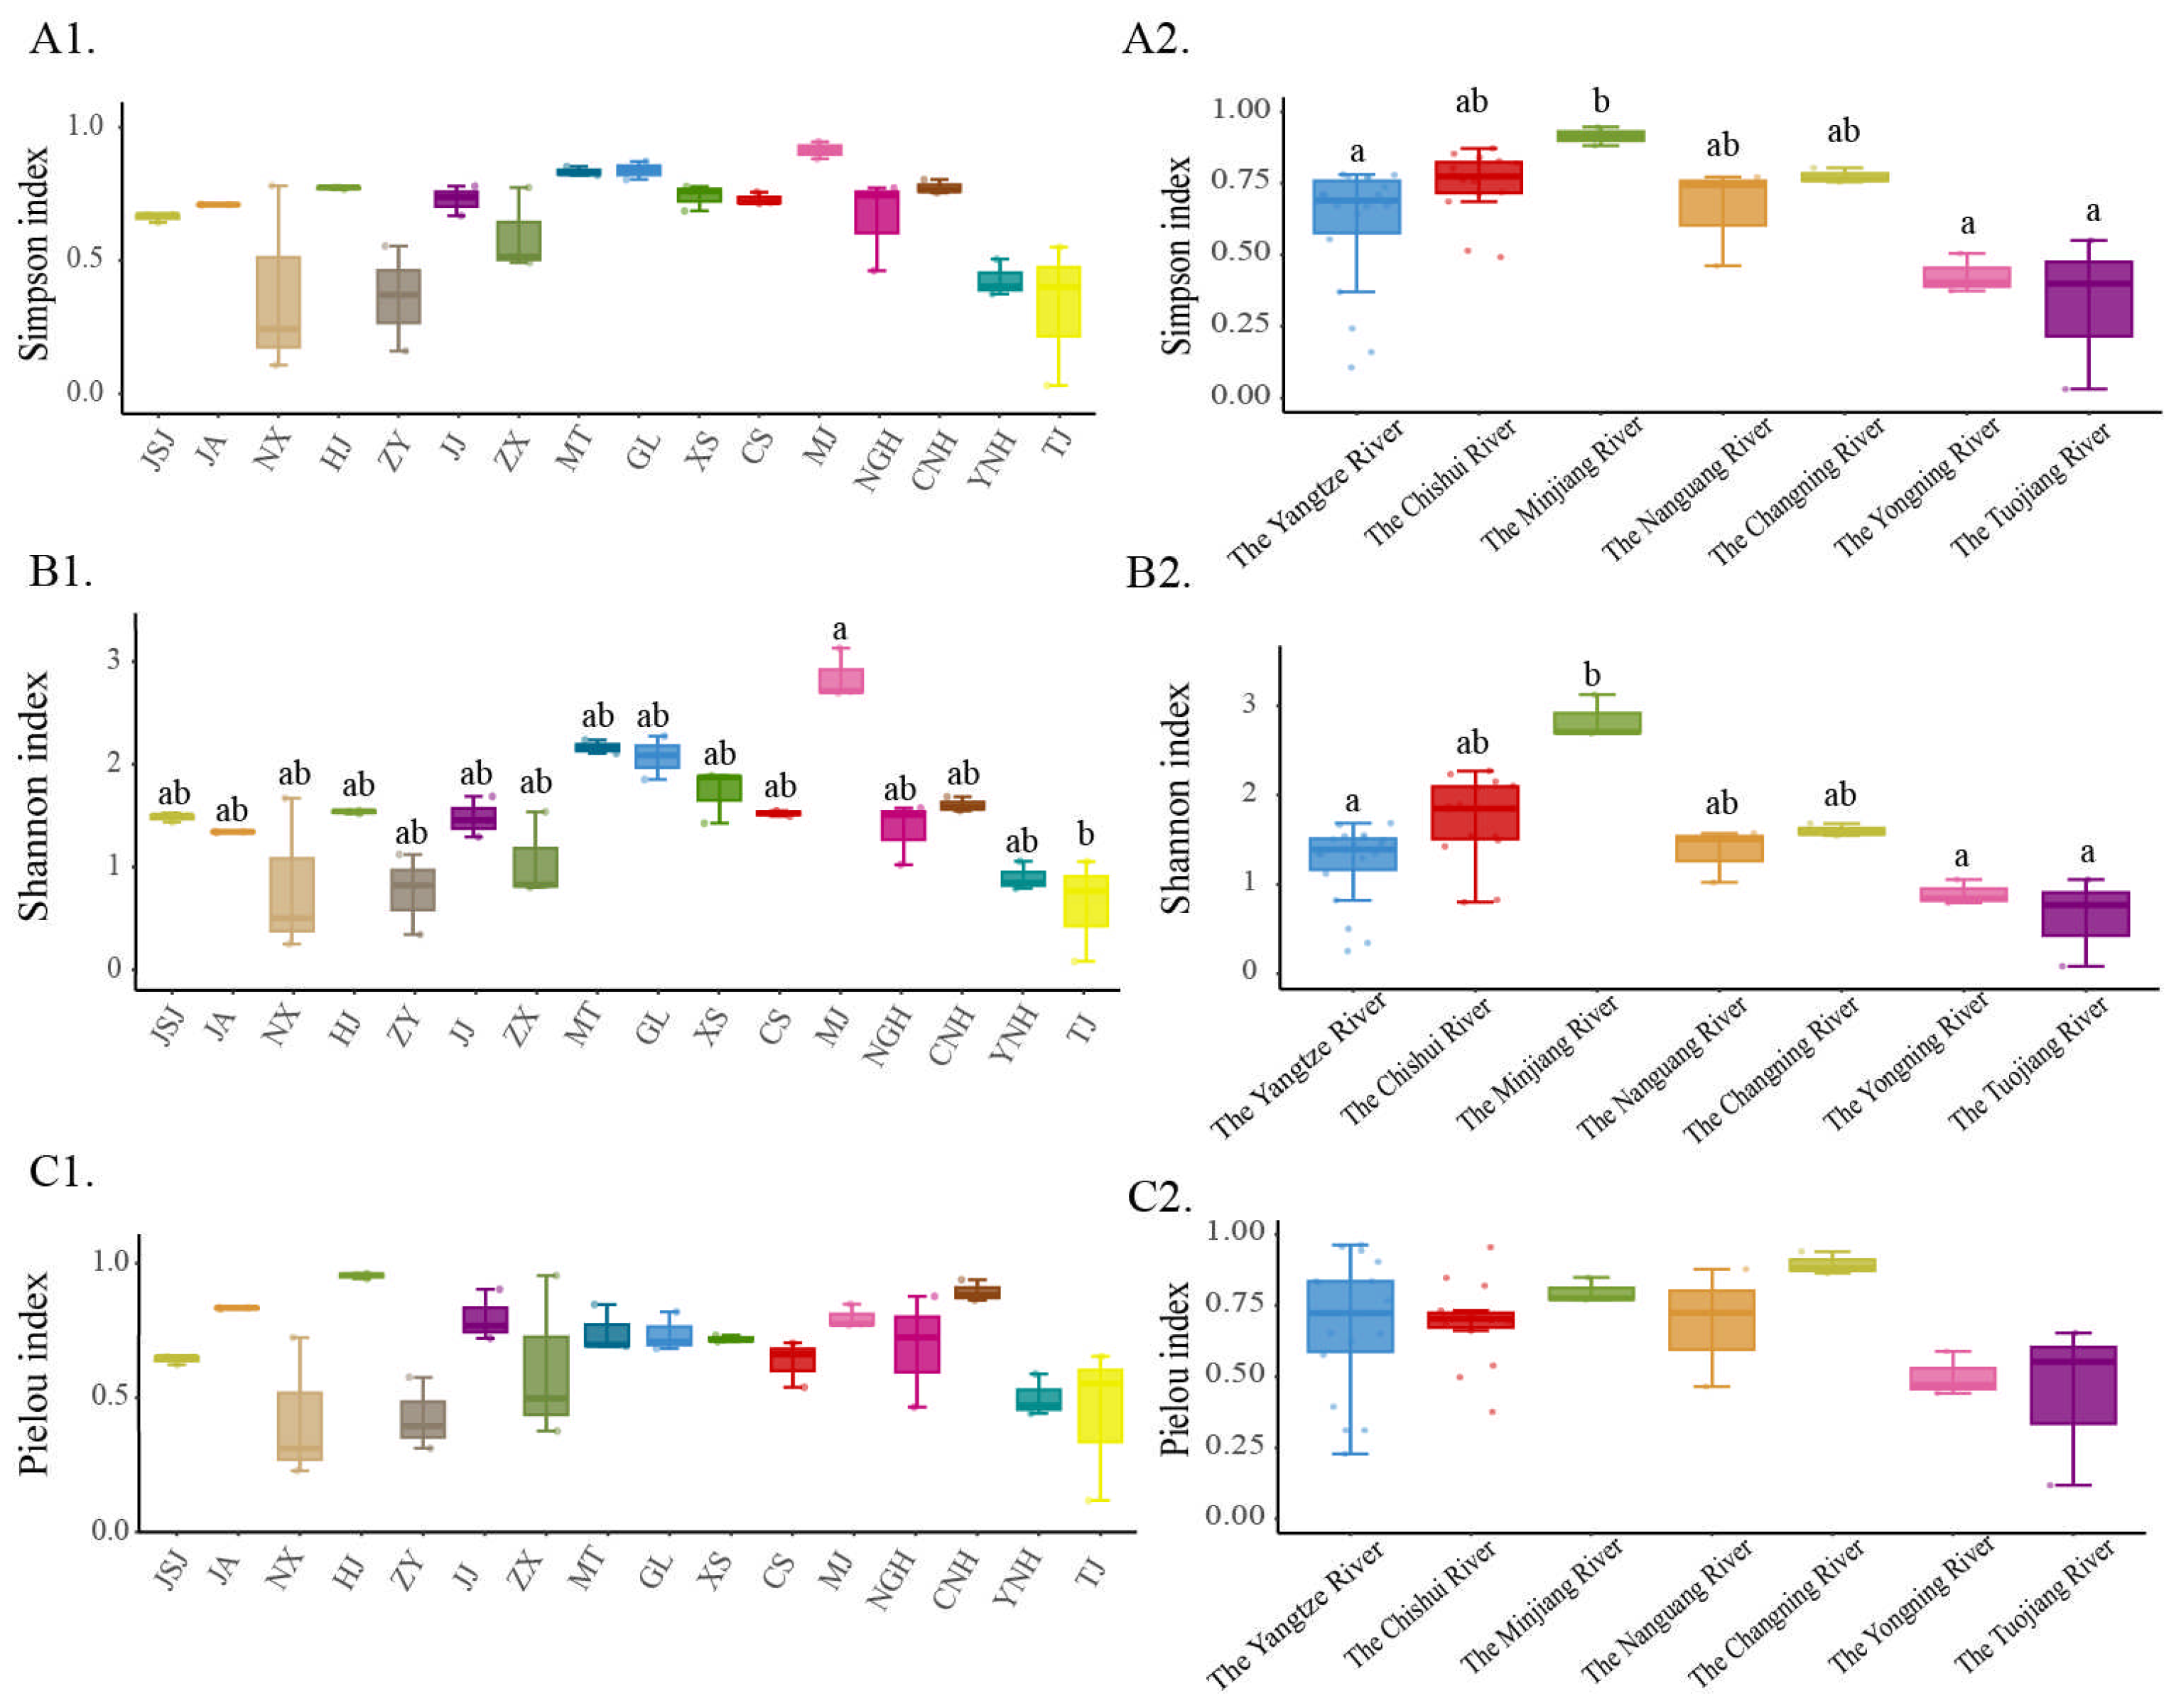
Alpha diversity analysis (Figure 5) indicated that across all sampling sections, the Shannon index ranged from 0.633 to 2.884, the Simpson index from 0.327 to 0.914, and the Pielou index from 0.421 to 0.953. Among the sections, MJ recorded the highest values for both the Shannon and Simpson indices, whereas TJ showed the lowest. In contrast, the Pielou index was highest in the HJ section and lowest in NX (Figure 5(A1)). A significant difference in the Simpson index was detected only between the MJ and TJ sections (P = 0.040 < 0.05). At the river scale, the Minjiang River exhibited the highest alpha diversity, while the Tuo River had the lowest (Figure 5(A2)). The Minjiang River showed statistically significant differences (P < 0.05) in both Shannon and Simpson indices compared with the Yangtze River mainstem, Tuojiang River, and Yongning River (Supplementary Table S7). No other inter-river comparisons were significant.

3.5. Fish Community Beta Diversity and Structural Differentiation

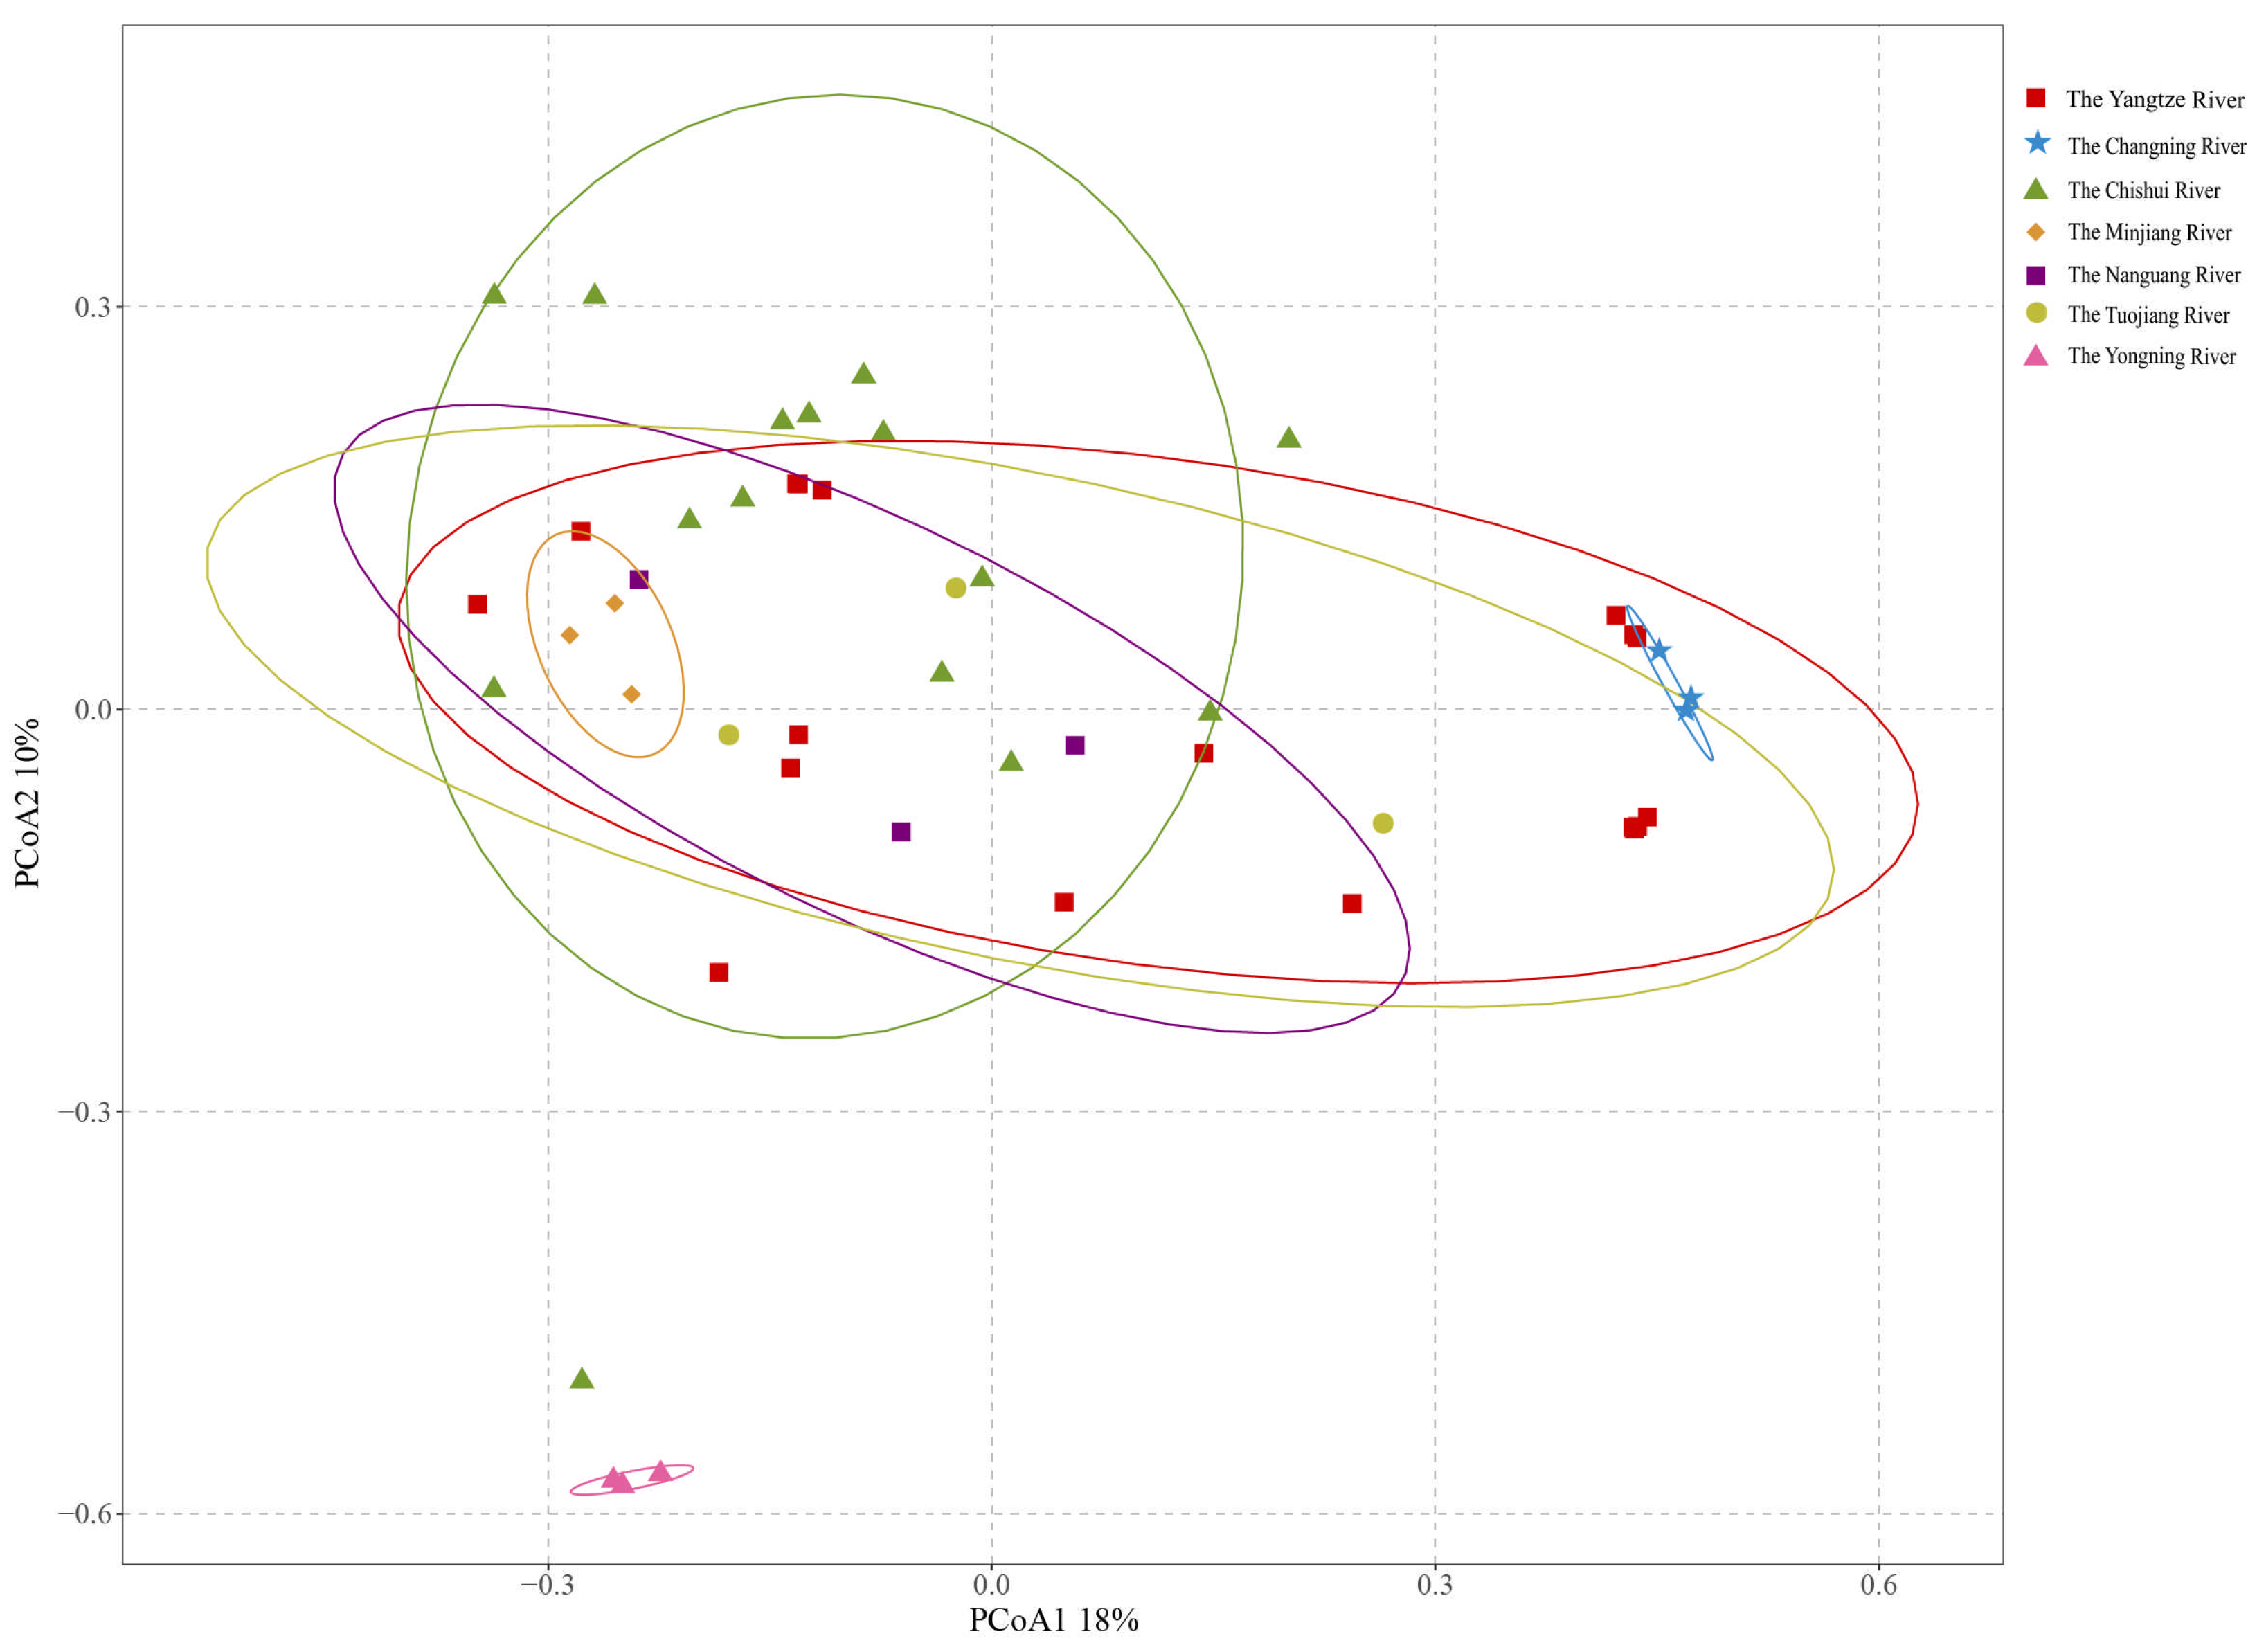
PERMDISP analysis indicated a highly significant difference in the dispersion of fish community composition among the different rivers (F = 16.51, p = 0.01). PERMANOVA further revealed significant differences in fish community structure among the rivers (R2 = 0.2747, p = 0.001). This pattern was corroborated by PCoA, in which the first two axes collectively explained 28% of the total variation (Axis 1: 18%; Axis 2: 10%) (Figure 6). The fish communities of the Yangtze River, Minjiang River, Nanguang River, Tuojiang River, and Chishui River clustered closely, indicating high structural similarity. In contrast, the Yongning River community was distinctly separate from those of all other surveyed rivers, including the Yangtze River, Chishui River, Changning River, Minjiang River, Nanguang River, and Tuojiang River.

4. Discussion

4.1. Temporal Changes in Fish Community Composition and Potential Drivers

The eDNA-based survey conducted in this study identified 93 fish species in the reserve, 89 of which matched historical capture records, yielding a coverage rate of 39.56% (non-recombined species: M. skolkovii, M. terminalis, C. gachua). The dominant families—Cyprinidae, Cobitidae, and Bagridae—remained consistent with in previous studies [45,46]. Commonly dominant species included C. carpio, C. auratus, Coreius heterodon, M. anguillicaudatus, P. dabryanus, A. yunnanensis, Spinibarbus sinensis, H. leucisculus, and H. tchangi. These composition patterns align closely with findings from earlier surveys using traditional methods, such as those by Tang et al. [46] and Wu et al. [47], confirming the high reliability and applicability of eDNA technology for monitoring fish diversity in natural reserves [48].
Another critical factor is the ecological impact associated with the formation of the Three Gorges Reservoir and the cascade hydropower development on the Jinsha River. Dam construction has fragmented the river system, diminishing longitudinal connectivity and impeding the spawning migrations of migratory fishes [49]. The resulting reservoir conditions—characterized by greater water depth and reduced flow velocity—favor lentic-adapted species while disadvantaging rheophilic fishes and those that release drifting eggs. Furthermore, increased water depth can alter thermal regimes, potentially disrupting the reproductive cycles of species that rely on specific temperature cues for spawning [50]. Previous studies have consistently highlighted reduced river connectivity as a major driver of fish diversity loss [51], and both Tang et al. [44] and Liu et al. [49] identified cascade hydropower development as a significant contributor to species decline in the reserve. In this context, the Chishui River represents a notable exception, exhibiting the highest species richness and the most endemic taxa—a pattern largely attributable to its free-flowing character, absence of dams, and the effective enforcement of a comprehensive fishing ban [52]. It should be noted that the observed distribution patterns could be influenced by seasonal factors (August sampling coincided with the fish feeding season) and potential eDNA transport downstream, which may affect the local resolution of species detection. Together, these findings emphasize the essential role of natural hydrological integrity and targeted conservation policies in maintaining freshwater biodiversity.

4.2. Ecological Type Structure and Habitat Adaptation

Consistent with the findings of Li [53], this study confirms that the fish community in the reserve is currently dominated by taxa adapted to slow-flowing and benthic habitats. This compositional shift reflects a selective filtering process driven by the hydrologically homogenized environments created by dam regulation. The operation of large-scale hydraulic engineering projects, particularly the Xiangjiaba and Three Gorges dams, has substantially reduced flow velocities [54], favoring generalist and slow-flow-adapted species. These groups have consequently achieved dominance and now maintain stable proportions across all sampled sections. In contrast, the Chishui River remains free-flowing, and its steep topographic gradient within the Yunnan–Guizhou Plateau has helped preserve natural rapid-flow habitats. These conditions sustain specialized rheophilic fish assemblages, as demonstrated by the dominance of such species at sections CS, GL, and XS. Furthermore, the prevalence of sandy-gravel and silt substrates across the reserve [32] provides suitable microhabitats for benthic fishes and adhesive-egg spawners. Conversely, limited flow velocities likely constrain the dispersal and development of fishes that release drifting eggs. Collectively, these factors result in a close correspondence between the spatial structure of ecological groups in the fish community and the hydraulic and physical templates of the reserve.

4.3. Spatial Patterns of Fish Diversity and Their Potential Drivers

Fish alpha diversity demonstrated clear spatial heterogeneity within the reserve, with the Minjiang River exhibiting the highest value and the Tuojiang River the lowest. As a recognized spawning and feeding ground in the upper Yangtze River [55], the Minjiang River section possesses diverse habitat types and an extensive protected stretch, which collectively sustain an inherently rich species pool. Furthermore, hydropower operations in the lower Minjiang have increased channel width and water depth [56], leading to elevated water levels and greater discharge. These altered hydraulic conditions offer a more suitable environment for species such as C. heterodon and bagrid catfishes [57]. The sampling period in August also aligned with the fish feeding migration season, during which movement from the mainstem into the Minjiang River enhanced local species richness, further reinforcing its high diversity [58]. The Chishui River ranked second in fish diversity, a pattern attributable to its multi-tributary structure, habitat heterogeneity, strong natural flow dynamics, and minimal anthropogenic disturbance—conditions that jointly support diverse fish assemblages [59,60]. Notably, the Chishui River maintains a relatively high proportion of rheophilic species and exhibits a distinct community structure compared to other rivers. Its unimpeded river connectivity (absence of dams), coupled with high habitat heterogeneity, likely underpins the higher functional diversity of its fish fauna. In contrast, the Tuojiang section displayed the lowest diversity, likely resulting from intense human pressure in its middle and lower reaches. This area experiences severe water pollution, where total phosphorus (TP) is a primary pollutant that consistently exceeds regulatory standards [61,62], highlighting the significant stress imposed by anthropogenic activities on riverine biodiversity.
Beta diversity analysis revealed significant differences in fish community structure among the rivers (PERMANOVA, R2 = 0.2747, P = 0.001). Principal coordinates analysis further indicated that the fish communities of the Minjiang, Nanguang, Tuojiang, and Changning Rivers exhibited high similarity to the mainstem of the Yangtze River, while the Yongning River displayed lower species richness and a distinct community structure. In contrast, the Chishui River formed a clearly separated cluster, reflecting its substantial divergence from other river systems. This distinctiveness appears to arise from high habitat heterogeneity across its plateau-to-basin transition zone, where diverse habitats—including rapids, slow-flowing reaches, and shallow pools—support a broad spectrum of ecological groups [63]. The upper and middle reaches of the river offer suitable habitats for rheophilic species such as A. monticola, whereas the downstream sections, with decreasing elevation, are more favorable for slow-water fishes. This longitudinal habitat gradient thereby facilitates the survival and reproduction of species with divergent ecological requirements. Moreover, the natural longitudinal connectivity and absence of dams in the Chishui River basin provide critical refugia for endemic and sensitive fish species. For example, Wu et al. [47] reported the first records of eight endemic upper Yangtze fish species in the Chishui River, including Xenocypris fangi and Schizothorax grahami. In a complementary study, Pan et al. [64] applied a fish-based index of biotic integrity (F-IBI) and classified the river as “healthy.” Together, these findings underscore the critical conservation value of the Chishui River in maintaining basin-wide biodiversity. Therefore, it is imperative to prioritize the protection of its free-flowing segments through legislative or management measures, safeguarding the Chishui River as a key freshwater biodiversity refuge and a natural reference for river ecosystem restoration in the Yangtze Basin.

4.4. Applicability and Limitations of the eDNA Method

Environmental DNA (eDNA) technology has emerged as a prominent tool for monitoring aquatic biodiversity [65], though its effectiveness is influenced by a range of environmental and technical factors. Key environmental variables such as water temperature, flow velocity, and turbidity can directly affect eDNA degradation and transport [66,67]. To address the challenge of turbidity, this study introduced a pre-filtration step using medical-grade sterile gauze for highly turbid samples to reduce adsorption-induced DNA loss [33]. Furthermore, methodological choices—including filter membrane selection, primer specificity, and amplification bias—may also affect taxon detection rates [68]. To enhance data reliability, the study adhered to fully enzyme-free protocols during sample processing, utilized optimized primer–filter combinations, maintained standardized amplification conditions, and included multiple replicates together with negative controls. Additionally, the potential for false positives and negatives in eDNA detection poses challenges for result interpretation [69]. To mitigate these uncertainties, stringent contamination control measures were implemented [70], including rigorous quality control during raw data processing: bases with a quality score below 20 were trimmed from read ends, a 10 bp sliding window was used to evaluate average quality, and reads were truncated once the average quality within any window dropped below 20, while reads shorter than 100 bp after trimming were discarded. In addition, results were cross-referenced with historical species records to enhance data reliability.

4.5. Conservation Implications and Management Recommendations

River development presents a trade-off between ecological conservation and economic benefits. While hydropower projects contribute to energy production, they simultaneously alter hydrological regimes and reduce river connectivity, resulting in biodiversity loss [49]. In light of these trade-offs and the findings of this study, and within the framework of the ongoing “ten-year fishing ban” policy, we propose the following recommendations:
(1)
Implement systematic ecological flow management, incorporating seasonal flow releases timed to key natural hydrological and thermal spawning cues (e.g., spring runoff pulses, temperature thresholds), to restore longitudinal connectivity for fish migration and rehabilitate critical spawning habitats.
(2)
Develop an integrated early-warning and control system for invasive species that combines high-sensitivity eDNA monitoring with conventional methods. This system should establish molecular-based alert thresholds to trigger confirmatory on-ground surveys and targeted netting for rapid response. This initiative must be coupled with strict regulations to prevent invasions from aquaculture escapes and unauthorized fish releases.
(3)
Improve the management of fish stock enhancement to ensure that species introductions are scientifically sound and ecologically appropriate, enhancing the effectiveness of artificial breeding and release programs.
(4)
Strengthen policy guidance by implementing differentiated management strategies—such as designating “core natural river zones” (e.g., the Chishui River) and “ecological restoration zones” (e.g., the Tuojiang River)—to simultaneously advance conservation and rehabilitation goals.

5. Conclusions

Based on environmental DNA (eDNA) technology, a comprehensive fish diversity survey was carried out in the Upper Yangtze River Rare and Endemic Fish National Nature Reserve during August, a period characterized by intensive foraging activities. The study identified 93 fish species, classified into 3 orders, 13 families, and 67 genera. The fish community was predominantly characterized by traits such as adaptation to slow-flowing benthic habitats, omnivorous feeding behavior, adhesive egg laying, sexual maturity at 1–4 years of age and <20 cm body length, and migratory tendencies. Spatially, higher alpha diversity was observed in the Minjiang and Chishui River sections. Notably, the Chishui River supported a distinct fish community structure compared to other rivers, underscoring the uniqueness of its habitat and its high conservation value. This study confirms the efficacy of eDNA technology as a tool for large-scale and rapid monitoring of fish diversity. Furthermore, the findings help identify conservation priorities, such as the Chishui River, and provide a scientific basis for implementing differentiated river basin management strategies under the ongoing “Ten-Year Fishing Ban” in the Yangtze River.

Supplementary Materials

The following supporting information can be downloaded at: https://www.mdpi.com/article/10.3390/fishes10110595/s1, Table S1: Number of fish sequences detected at 16 transects in the reserve based on the eDNA approach; Table S2: Table of fish lists and corresponding ecotypes based on the eDNA approach to fish detection; Table S3: Number of sequences read at each sampling point; Table S4: Species based on river dominance at each sampling section; Table S5: List of historical fish species monitored in protected areas based on traditional methods; Table S6: Comparison of Environmental DNA and Fish Catch Results from Conventional Fishing Methods; Table S7: Results of the Post hoc Dunn’s Test with Bonferroni Correction for Alpha Diversity; Figure S1. Number of fish species common to traditional catch data and eDNA methods.

Author Contributions

Y.S. conceived this study; X.D., J.H., Z.Q. and Z.W. conducted the experiments. X.D. analyzed the data and drafted the manuscript. X.D., Q.Z. and Y.S. revised the manuscript critically and approved the final manuscript. All authors have read and agreed to the published version of the manuscript.

Funding

This research was supported by the Chongqing Natural Science Foundation General Program (CSTB2025NSCQ-GPX0992).

Institutional Review Board Statement

This study is based on environmental DNA (eDNA) analysis and does not involve the use of physical fish specimens. The institutional review board statement is not applicable.

Informed Consent Statement

Not applicable.

Data Availability Statement

The raw sequences are available from the NCBI (https://dataview.ncbi.nlm.nih.gov, accessed on 15 September 2024) under the following accession numbers SRR35420248-SRR35420295.

Conflicts of Interest

The authors declare that they have no known competing financial interests or personal relationships that could have appeared to influence the work reported in this paper.

References

  1. Wang, B.; Jiao, L.; Ni, L.; Wang, M.; You, P. Bridging the gap: The integration of eDNA techniques and traditional sampling in fish diversity analysis. Front. Mar. Sci. 2024, 11, 1289589. [Google Scholar] [CrossRef]
  2. Eloranta, A.P.; Kahilainen, K.K.; Amundsen, P.A.; Knudsen, R.; Harrod, C.; Jones, R.I. Lake size and fish diversity determine resource use and trophic position of a top predator in high-latitude lakes. Ecol. Evol. 2015, 5, 1664–1675. [Google Scholar] [CrossRef]
  3. Chen, F.; Yuan, T.; Xiong, M.; Zhao, X.; Ma, P.; Zhu, B.; Zhang, Z.; Liu, H.; Dong, F.; Li, J. Fish Diversity Investigation in the Three-River Headwater Region and Strategies for Conservation. J. Hydroecol. 2024, 45, 1–8. [Google Scholar]
  4. Luo, S.; Wang, M.; Ma, W.; Gu, D.; Jin, Z.; Yang, R.; Qian, Z.; Song, C.; Wang, Z.; Jin, S. Environment DNA Reveals Fish Diversity in a Canyon River within the Upper Pearl River Drainage. Animals 2024, 14, 2433. [Google Scholar] [CrossRef]
  5. Wetzel, C.R.; Punt, A.E.; Cope, J.M. The effect of reduced data on the ability to monitor rebuilding of overfished fish stocks. Fish. Bull. 2018, 116, 190–206. [Google Scholar] [CrossRef]
  6. Shen, Y.; Hubert, N.; Huang, Y.; Wang, X.; Gan, X.; Peng, Z.; He, S. DNA barcoding the ichthyofauna of the Yangtze River: Insights from the molecular inventory of a mega-diverse temperate fauna. Mol. Ecol. Resour. 2019, 19, 1278–1291. [Google Scholar] [CrossRef]
  7. Tian, J.; Chang, J.; Zhang, Z.; Wang, Y.; Wu, Y.; Jiang, T. Influence of Three Gorges Dam on Downstream Low Flow. Water 2019, 11, 65. [Google Scholar] [CrossRef]
  8. Agostinho, A.A.; Pelicice, F.M.; Gomes, L.C. Dams and the fish fauna of the Neotropical region: Impacts and management related to diversity and fisheries. Braz. J. Biol. 2008, 68 (Suppl. S4), 1119–1132. [Google Scholar] [CrossRef] [PubMed]
  9. Pimentel, M.S.D.J.; Ludwig, S.; Resende, C.L.; Dias, P.F.P.B.; Pereira, A.H.; Abreu, N.L.d.; Rosse, I.C.; Martins, A.P.V.; Facchin, S.; Lopes, J.D.M.; et al. Genetic evaluation of migratory fish: Implications for conservation and stocking programs. Ecol. Evol. 2020, 10, 10314–10324. [Google Scholar] [CrossRef] [PubMed]
  10. Barbarossa, V.; Schmitt, R.J.P.; Huijbregts, M.A.J.; Zarfl, C.; King, H.; Schipper, A.M. Impacts of current and future large dams on the geographic range connectivity of freshwater fish worldwide. Proc. Natl. Acad. Sci. USA 2020, 117, 3648–3655. [Google Scholar] [CrossRef]
  11. Machado, C.B.; Braga-Silva, A.; Freitas, P.D.; Galetti, P.M., Jr. Damming shapes genetic patterns and may affect the persistence of freshwater fish populations. Freshw. Biol. 2021, 67, 603–618. [Google Scholar] [CrossRef]
  12. Liermann, R.C.; Nilsson, C.; Robertson, J.; Rebecca, Y.N. Implications of Dam Obstruction for Global Freshwater Fish Diversity. BioScience 2012, 62, 539–548. [Google Scholar] [CrossRef]
  13. Stone, R. Dam-building threatens Mekong fisheries. Science 2016, 354, 1084–1085. [Google Scholar] [CrossRef]
  14. Bessey, C.; Jarman, S.N.; Berry, O.; Olsen, Y.S.; Bunce, M.; Simpson, T.; Power, M.; McLaughlin, J.; Edgar, G.J.; Keesing, J. Maximizing fish detection with eDNA metabarcoding. Environ. DNA 2020, 2, 493–504. [Google Scholar] [CrossRef]
  15. Merin, C.R.; Florian, A.; Fabian, F.; Antoine, G.; Thomas, K.; Arnaud, L.; Pierre-Louis, R.; Eilísh, R.; Alice, V.; Conor, W.; et al. Catchment-based sampling of river eDNA integrates terrestrial and aquatic biodiversity of alpine landscapes. Oecologia 2023, 202, 1–15. [Google Scholar]
  16. Barnes, A.M.; Turner, R.C. The ecology of environmental DNA and implications for conservation genetics. Conserv. Genet. 2016, 17, 1–17. [Google Scholar] [CrossRef]
  17. Deiner, K.; Walser, J.; Mächler, E.; Altermatt, F. Choice of capture and extraction methods affect detection of freshwater biodiversity from environmental DNA. Biol. Conserv. 2015, 183, 53–63. [Google Scholar] [CrossRef]
  18. Valentini, A.; Taberlet, P.; Miaud, C.; Civade, R.; Herder, J.; Thomsen, P.F.; Bellemain, E.; Besnard, A.; Coissac, E.; Boyer, F.; et al. Next-generation monitoring of aquatic biodiversity using environmental DNA metabarcoding. Mol. Ecol. 2016, 25, 929–942. [Google Scholar] [CrossRef] [PubMed]
  19. Evans, N.T.; Li, Y.; Renshaw, M.A.; Olds, B.P.; Deiner, K.; Turner, C.R.; Jerde, C.L.; Lodge, D.M.; Lamberti, G.A.; Pfrender, M.E. Fish community assessment with eDNA metabarcoding: Effects of sampling design and bioinformatic filtering. Can. J. Fish. Aquat. Sci. 2017, 74, 1362–1374. [Google Scholar] [CrossRef]
  20. Coble, A.A.; Flinders, C.A.; Homyack, J.A.; Penaluna, B.E.; Cronn, R.C.; Weitemier, K. eDNA as a tool for identifying freshwater species in sustainable forestry: A critical review and potential future applications. Sci. Total Environ. 2019, 649, 1157–1170. [Google Scholar] [CrossRef] [PubMed]
  21. Goldberg, C.S.; Turner, C.R.; Deiner, K.; Klymus, K.E.; Thomsen, P.F.; Murphy, M.A.; Spear, S.F.; McKee, A.; Oyler-McCance, S.J.; Cornman, R.S.; et al. Critical considerations for the application of environmental DNA methods to detect aquatic species. Methods Ecol. Evol. 2016, 7, 1299–1307. [Google Scholar] [CrossRef]
  22. Ficetola, G.F.; Miaud, C.; Pompanon, F.; Taberlet, P. Species detection using environmental DNA from water samples. Biol. Lett. 2008, 4, 423–425. [Google Scholar] [CrossRef]
  23. Jerde, C.L.; Mahon, A.R.; Chadderton, W.L.; Lodge, D.M. “Sight-unseen” detection of rare aquatic species using environmental DNA. Conserv. Lett. 2011, 4, 150–157. [Google Scholar] [CrossRef]
  24. Hui, J.; Hui, Z.; Weiwei, X. Fish Diversity Monitored by Environmental DNA in the Yangtze River Mainstream. Fishes 2021, 7, 1. [Google Scholar] [CrossRef]
  25. Lyu, S.; Tong, J.; Wu, J.; Wang, X.; Geng, X.; Gao, C.; Wang, Y. Towards a comprehensive assessment of ichthyofaunal diversity in the Yangtze River estuary: Leveraging environmental DNA technology and bottom trawl surveys. Heliyon 2024, 10, e34761. [Google Scholar] [CrossRef]
  26. Cheng, R.; Luo, Y.; Li, Q.; Zhang, Y.; Liu, Z.; Chen, Q.; Li, Y.; Shen, Y. Application of eDNA metabarcoding for monitoring the fish diversity of the Jiangjin to Fuling section of the upper reaches of the Yangtze River. Hydrobiologia 2023, 850, 4067–4088. [Google Scholar] [CrossRef]
  27. Yang, H.; Shen, L.; He, Y.; Tian, H.; Gao, L.; Wu, J.; Mei, Z.; Wei, N.; Wang, L.; Zhu, T. Status of aquatic organisms resources and their environments in Yangtze River system (2017–2021). Aquacult. Fish. 2024, 9, 833–850. [Google Scholar] [CrossRef]
  28. Sun, Z.; Zhang, M.; Chen, Y. Protection of the rare and endemic fish in the conservation area located in the upstream of the Yangtze River. Freshw. Fish. 2014, 44, 3–8. [Google Scholar]
  29. Lin, P.; Wang, C.; Liu, F.; Liu, M.; Liu, H.; Wang, X.; Yu, J.; Zhu, X. Current status and conservation planning of fish biodiversity in the upper Yangtze River Basin in the context of hydropower development. Acta Hydrobiol. Sin 2019, 43, 130–143. [Google Scholar]
  30. Liu, F.; Lin, P.C.; Li, M.Z.; Gao, X.; Wang, C.L.; Liu, H.Z. Situations and conservation strategies of fish resources in the Yangtze river basin. Acta Hydrobiol. Sin. 2019, 43 (Suppl. S1), 144–156. [Google Scholar]
  31. Wang, M.; Yang, X.; Wang, W.; Duan, C.; Liu, Z.; Chen, Q.; Li, Y.; Shen, Y. Fish Diversity in Chongqing Section of the National Nature Reserve for Rare and Endemic Fish in the Upper Yangtze River Based on eDNA Technology. Acta Hydrobiol. Sin. 2022, 46, 2–16. [Google Scholar]
  32. Wei, Q. Scientific Investigation Report on National Nature Reserve for the Rare and Endemic Fishes in the Upper Reaches of the Yangtze River; Science Press: Beijing, China, 2012; Volume 208, p. 214. [Google Scholar]
  33. Stewart, K.; Ma, H.; Zheng, J.; Zhao, J. Using environmental DNA to assess population-wide spatiotemporal reserve use. Conserv. Biol. 2017, 31, 1173–1182. [Google Scholar] [CrossRef]
  34. Huang, J.; Zhang, Y.; Dong, X.; Zhou, X.; Liu, Z.; Chen, Q.; Chen, F.; Shen, Y. Insights into the Process of Fish Diversity Pattern Changes and the Current Status of Spatiotemporal Dynamics in the Three Gorges Reservoir Area Using eDNA. Fishes 2025, 10, 295. [Google Scholar] [CrossRef]
  35. Zhou, X.; Dong, X.; Huang, J.; Zhu, S.; Chen, W.; Shen, Y. Environmental DNA Insights into the Spatial Status of Fish Diversity in the Mainstem of the Jialing River. Animals 2025, 15, 105. [Google Scholar] [CrossRef]
  36. Miya, M.; Sato, Y.; Fukunaga, T.; Sado, T.; Poulsen, J.Y.; Sato, K.; Minamoto, T.; Yamamoto, S.; Yamanaka, H.; Araki, H.; et al. MiFish, a set of universal PCR primers for metabarcoding environmental DNA from fishes: Detection of more than 230 subtropical marine species. R. Soc. Open Sci. 2015, 2, 150088. [Google Scholar] [CrossRef] [PubMed]
  37. Gohl, D.; Vangay, P.; Garbe, J.; Maclean, A.; Hauge, A.; Becker, A.; Trevor, G.; Jonathan, C.; Timothy, J.; Ryan, H.; et al. Systematic improvement of amplicon marker gene methods for increased accuracy in microbiome studies. Nat. Biotechnol. 2016, 34, 942–949. [Google Scholar] [CrossRef]
  38. Ding, R. The Fish of Sichuan; Sichuan Science and Technology Press: Chengdu, China, 1994. [Google Scholar]
  39. Wu, L. Guizhou Fish Fauna; Guizhou People’s Publishing House: Guiyang, China, 1989. [Google Scholar]
  40. Caporaso, J.G.; Kuczynski, J.; Stombaugh, J.; Bittinger, K.; Bushman, F.D.; Costello, E.K.; Fierer, N.; Peña, A.G. QIIME allows analysis of high-throughput community sequencing data. Nat. Methods 2010, 7, 335–336. [Google Scholar] [CrossRef]
  41. Shannon, E.C. A mathematical theory of communication. Bell Syst. Tech. J. 1948, 27, 379–423. [Google Scholar] [CrossRef]
  42. Simpson, E.H. Measurement of diversity. Nature 1949, 163, 688. [Google Scholar] [CrossRef]
  43. Pielou, E.C.J. The measurement of diversity in different typesof biological collections. J. Theor. Biol. 1966, 13, 131–144. [Google Scholar] [CrossRef]
  44. Ling, L.; Fan, G.; Hu, Y.; Huang, J.; Li, C. Integrating environmental DNA technology and traditional fish survey to reveal the diversityof fishes in the rivers on the Chongming lsland. J. Shanghai Ocean Univ. 2022, 31, 1434–1444. [Google Scholar]
  45. Gao, T.H.; Tian, H.W.; Ye, C.; Duan, X.B. Diversity and composition of fish in the mainstream of national nature reserve of rare and endemic fish in the upper Yangtze River. Freshw. Fish. 2013, 43, 36–42. [Google Scholar]
  46. Tang, C.; Deng, H.T.; Tian, H.W.; Wu, X.H.; Tang, X.; Pu, Y.; Wang, D.Q.; Duan, X.B.; Liu, S.P.; Chen, D.Q. Analysis on the characteristics of fish community structure in the main stream section of the National Nature Reserve for Rare and Endemic Fish in the upper reaches of the Yangtze River. J. Fish. China 2023, 47, 81–100. [Google Scholar]
  47. Wu, J.; Zhao, H.; Miao, Z.; Chen, Y.; Zhang, F.; Wang, J. Status and conservation of fish resources in the Chishui River. Biol. Divers. 2010, 18, 162–172. [Google Scholar]
  48. Chen, L.; Wu, L.; Liu, Y.; Xu, H. Application of environmental DNA metabarcoding in ecology. Acta Ecol. Sin. 2016, 36, 4573–4582. [Google Scholar] [CrossRef]
  49. Liu, X.; Qin, J.; Xu, Y.; Ouyang, S.; Wu, X. Biodiversity decline of fish assemblages after the impoundment of the Three Gorges Dam in the Yangtze River Basin, China. Rev. Fish Biol. Fish. 2019, 29, 177–195. [Google Scholar] [CrossRef]
  50. Zhu, J.; Cao, J.; Zhou, T.; Yang, Z.; Zhu, Z.; Zhu, Q. Early Stage Resource Status of Fish Species Spawning Drifting Eggs in the Jiangjin Section of the Upper Yangtze River and Their Hydrologic Requirements. J. Hydroecol. 2024, 45, 75–86. [Google Scholar]
  51. Li, A.; Fan, J.; Guo, F.; Carpenter-Bundhoo, L.; Huang, G.; Shi, Y.; Ao, Y.; Wang, J. Assessing the impact of river connectivity on fish biodiversity in the Yangtze River Basin using a multi-index evaluation framework. Environ. Res. 2024, 242, 117729. [Google Scholar] [CrossRef] [PubMed]
  52. Liu, F.; Yu, F.; Xia, Z.; Qin, Q.; Xu, C.; Wang, J.; Liu, H. Changes in fish assemblages following the implementation of a complete fishing closure in the Chishui River. Fish. Res. 2021, 243, 106099. [Google Scholar] [CrossRef]
  53. Wang, L.; Li, R.; Yang, J.; Yang, W.; Zhang, X.; Chen, Q.; Duan, C.; Hu, J. Spatial distribution characteristics of fish community composition and diversity in the National Nature Reserve of Rare and Endemic Fishes in the Upper Yangtze River based on environmental DNA Matabarcoding. J. Hydroecol. 2023, 1–14. [Google Scholar]
  54. Cheng, R.; Luo, Y.; Zhang, Y.; Li, Q.; Wang, M.; Zhang, Y.; Li, Y.; Shen, Y. Fish diversity of the cascade hydropower reservoir area of the Wujiang River based on environmental DNA technology. J. Fish. China 2025, 49, 140–157. [Google Scholar]
  55. Yan, T.; Huang, Y.; Yan, J.; Zhao, F.; Zhang, J.; He, B. Investigation and Analysis of Fish Resources in Minjiang River. Acta Ecol. Anim. Domastici 2022, 43, 43–47. [Google Scholar]
  56. He, X.; Hao, L.; Deng, Y.; Li, S.; Cao, M. Confluence characteristics and regulation stage of shoals at Minjiang River mouth. Adv. Water Sci. 2024, 35, 645–656. [Google Scholar]
  57. Yin, H.; Wang, S.; Yang, J.; Chen, S.; Hua, Q.; Wang, L.; Yang, Q.; Hu, M. Fish community and its relationships with environmental variables in the channel connecting Poyang Lake and the Yangtze River. Aquat. Sci. 2024, 86, 59. [Google Scholar] [CrossRef]
  58. Winter, H.V.; Van Densen, W.L.T. Assessing the opportunities for upstream migration of non-salmonid fishes in the weir-regulated River Vecht. Fish. Manag. Ecol. 2001, 8, 513–532. [Google Scholar] [CrossRef]
  59. Li, X.; Yan, L.; Zhi, X.; Hu, P.; Shang, C.; Zhao, B. Characteristics of the macroinvertebrate community structure and their habitat suitability conditions in the Chishui River. Front. Ecol. Evol. 2025, 12, 1459468. [Google Scholar] [CrossRef]
  60. Guo, N.; Shen, M.; Xiao, N.; Gao, X.; Guo, X.; Li, J. Distribution characteristics of autumn fish diversity in Chishui River based on environmental DNA metabarcoding technology. Acta Ecol. Sin. 2023, 43, 1676–1690. [Google Scholar] [CrossRef]
  61. Xu, X.; Liu, Q.; Yang, J.; Wang, Y. Analysis of changes of main water quality pollution indicators and driving factors in Tuojiang River Basin. Yangtze River 2025, 56, 39–47. [Google Scholar]
  62. Sui, H.; Wang, J.; Li, Z.; Zeng, Q.; Liu, X.; Ren, L.; Liu, C.; Zhu, Y.; Lv, L.; Che, Q.; et al. Screening of ecological impact assessment indicators in urban water body restoration process itle. Ecol. Indic. 2020, 113, 106198. [Google Scholar] [CrossRef]
  63. Xia, Z.J.; Yu, F.D.; Tang, Y.Z.; Zhang, Y.Z.; Deng, B.L.; Liu, D.M.; Liu, F.; Wang, J.W. Site uniqueness contributions to fish β diversity in the Chishui River basin, Southwestern China. J. Fish. China 2023, 47, 128–142. [Google Scholar]
  64. Pan, L.; Huang, X.; Liu, J.; Xie, Y.; Zhang, K.; Liu, B.; Zhao, Q.; Guan, X.; Fu, B. Chishui River Health Assessment Based on Fish Biotic Integrity Index. Res. Environ. Sci. 2023, 36, 1532–1542. [Google Scholar]
  65. Lu, S.; Zeng, H.; Xiong, F.; Yao, M.; He, S. Advances in environmental DNA monitoring: Standardization, automation, and emerging technologies in aquatic ecosystems. Sci. China Life Sci. 2024, 67, 1368–1384. [Google Scholar] [CrossRef] [PubMed]
  66. Kumar, G.; Farrell, E.; Reaume, A.M.; Eble, J.A.; Gaither, M.R. One size does not fit all: Tuning eDNA protocols for high- and low-turbidity water sampling. Environ. DNA 2022, 4, 167–180. [Google Scholar] [CrossRef]
  67. Strickler, M.K.; Fremier, K.A.; Goldberg, S.C. Quantifying effects of UV-B, temperature, and pH on eDNA degradation in aquatic microcosms. Biol. Conserv. 2015, 183, 85–92. [Google Scholar] [CrossRef]
  68. Kumar, G.; Eble, J.E.; Gaither, M.R. A practical guide to sample preservation and pre-PCR processing of aquatic environmental DNA. Mol. Ecol. Resour. 2020, 20, 29–39. [Google Scholar] [CrossRef]
  69. Shu, L.; Ludwig, A.; Peng, Z. Standards for Methods Utilizing Environmental DNA for Detection of Fish Species. Genes 2020, 11, 296. [Google Scholar] [CrossRef]
  70. Champlot, S.; Berthelot, C.; Pruvost, M.; Bennett, E.A.; Grange, T.; Geigl, E.M. An efficient multistrategy DNA decontamination procedure of PCR reagents for hypersensitive PCR applications. PLoS ONE 2010, 5, e13042. [Google Scholar] [CrossRef] [PubMed]
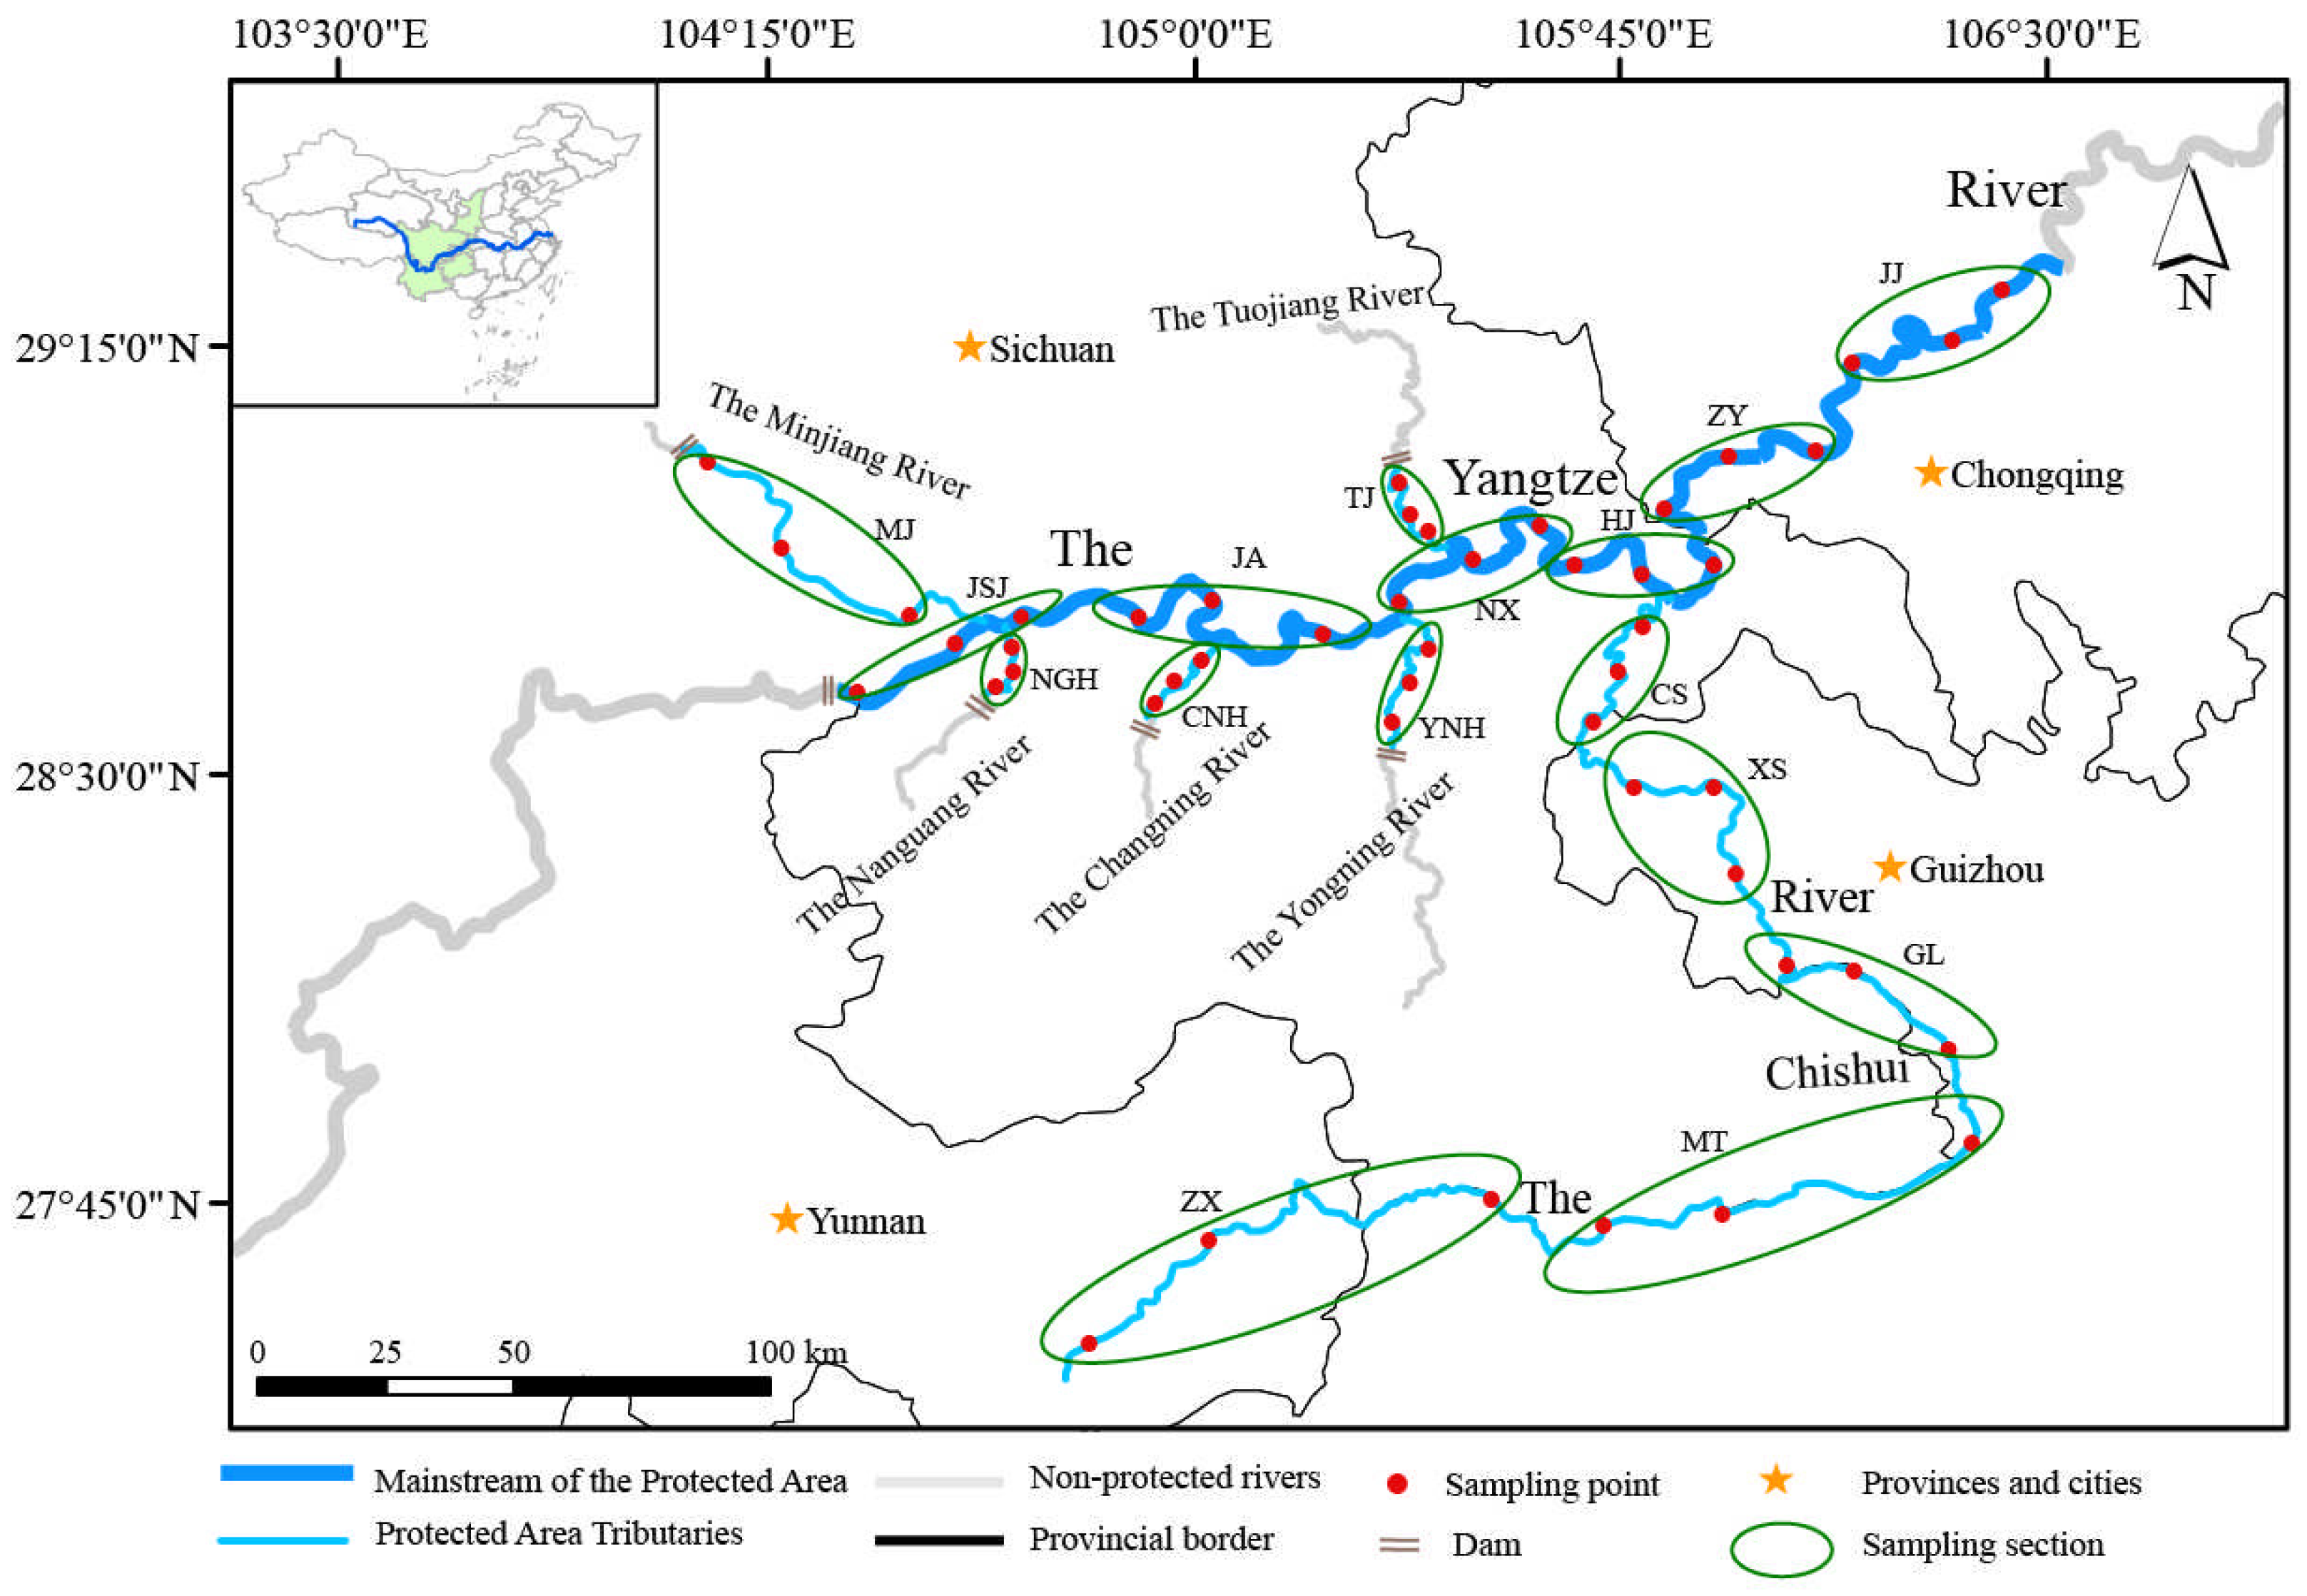
Figure 1. Map of the study area and spatial distribution of sampling sites.
Fishes 10 00595 g001
Figure 2. Rarefaction Curves. (X-axis: Subsampled Read Count, Y-axis: Predicted Shannon Index).
Fishes 10 00595 g002
Figure 3. Fish community composition at the species level based on eDNA relative sequence abundance. (A) Composition across different sampling sections. (B) Composition across different rivers.
Fishes 10 00595 g003
Figure 4. Ecological trait composition of fish communities. Panels (A1,2G1,2): Based on species counts. Panels (a1,2g1,2): Based on relative sequence abundance. Ecological traits: (A1,2,a1,2): Water stratum; (B1,2,b1,2): Flow preference; (C1,2,c1,2): Feeding habit; (D1,2,d1,2): Spawning type; (E1,2,e1,2): Age at first maturity (≤1, 1–4, >4 years); (F1,2,f1,2): Length at first maturity (<20, 20–40, >40 cm); (G1,2,g1,2): Migratory habit.
Fishes 10 00595 g004
Figure 5. Alpha diversity box plots grouped by sampling transects (A1C1), and by river transects (A2C2), with significant differences indicated by absence of the same letter.
Fishes 10 00595 g005
Figure 6. PCoA based on Bray–Curtis matrix according to each river grouping.
Fishes 10 00595 g006
Disclaimer/Publisher’s Note: The statements, opinions and data contained in all publications are solely those of the individual author(s) and contributor(s) and not of MDPI and/or the editor(s). MDPI and/or the editor(s) disclaim responsibility for any injury to people or property resulting from any ideas, methods, instructions or products referred to in the content.