Abstract
The northern snakehead (Channa argus) is an important economic fish species that holds a significant position in Chinese aquaculture due to its high nutritional value, fast growth, and anti-hypoxia capacity. There is a natural albino-mutant (AM) C. argus strain. Albinism, a stable genetic trait characterized by loss of body pigmentation, provides a unique opportunity to study the molecular mechanisms of vertebrate coloration. This study investigates the molecular mechanisms underlying albinism in C. argus through skin transcriptomic analyses of wild type (WT) and AM individuals. Morphological and histological analysis revealed no significant phenotypic difference between WT and AM in early development, whereas adult AM exhibited a severe reduction in melanocytes. Through RNA sequencing of skin tissues from WT-adult, AM-adult, and AM-15dpf, a total of 10,891 differentially expressed genes (DEGs) were identified. Through DEG enrichment analyses, we identified a series of enriched pathways and genes related to albinism, including melanogenesis (i.e., tyr, tyrp1b, kitb, kitlga, pmela, pmelb, mitfa, and mitfb) and xanthophore formation (i.e., pax3a, pax3b, pax7a, and sox10). In conclusion, this study not only enriches the research on fish pigmentation, but also has potential significance for the aquaculture and breeding of C. argus.
Key Contribution:
This study presents the first comprehensive transcriptomic analysis of a naturally albino northern snakehead (Channa argus var.). It reveals an albinism presentation specific to adulthood and identifies key dysregulated genes in melanogenesis and xanthophore formation that cause melanocyte loss. The work offers crucial insights into pigmentation regulation and a genetic foundation for breeding high-value albino strains in cultivated fish.
1. Introduction
Pigmentation is one of the most diverse characteristics in vertebrates. In the natural environment, the differences in the type and distribution of biological body color exert important effects on the adaptability and speciation [1]. Such color differences are significant across different species, populations, genders, and body structures of individuals [2]. The evolutionary difference in pigmentation is best exemplified by fish, as they experienced a fish-specific genome duplication (FSGD) that led to evolutionary changes in their body color [3,4]. For example, during the evolution of mammals and birds, their erythrophores and iridophores were successively lost, whereas teleost fish retain these types of pigment cells. Teleosts possess six major types of pigment cells: melanophore (melanosomes), xanthophore (xanthosome and carotenoid), iridophore (reflecting platelet), erythrophore (erythrosome and carotenoid), leucophore (leucosomes), and cyanophore (cyanosome) [4,5,6,7,8]. All these cells originate from the neural crest, and their differentiation, migration, and spatial distribution collectively determine the complex coloration and patterns observed in fish [9,10,11,12,13]. These variations in body color serve multiple biological functions such as courtship, defense, and predation [14,15,16], and their formation mechanism is essentially a dynamic process involving the migration and interaction of pigment cells, making them important models for studying the genetic mechanisms underlying coloration.
Studies across diverse fish models have significantly advanced our understanding of the genetic mechanisms governing body coloration. Research indicates that the differentiation, migration, and spatial distribution of pigment cells in fish are precisely regulated by a complex network involving key transcription factors such as sox10, pax3, and pax7, as well as signaling pathways like Wnt/β-catenin [17,18]. Within the core process of melanin synthesis, a relatively conserved molecular “toolkit” plays a critical role: the transcription factor mitf acts as a master regulator, integrating upstream signals and activating downstream tyrosinase gene family members (e.g., tyr, tyrp1) to execute melanin production. In mammals, mutations in key genes involved in the melanin synthesis pathway, such as tyr, tyrp1, and mitf, have been definitively linked to albinism [19,20]. Concurrently, the melanocortin system (e.g., the receptor mc1r and its antagonist asip1) modulates the type of pigment synthesized, thereby determining dorsoventral color patterns. Furthermore, gene-specific studies in particular species, such as the oca2 gene in cavefish and the slc7a11 gene in red tilapia, have not only validated the functions of these key genes but also revealed evolutionary adaptations of coloration to specific environments like darkness and deep water. Studies have indicated that the albino variety of goldfish is linked to mutations in the oca2 gene [21], the albinism in catfish and tilapia is mediated by hps4 [22], and the albinism observed in sticklebacks is associated with variations in hps5 [23]. The application of genomics, transcriptomics, and CRISPR/Cas9 gene editing has greatly accelerated the discovery and functional validation of new genes involved in this process. However, in fish, the causality of most genes associated with albinism remains unverified [24,25].
As a significant economic species extensively farmed in Asia and Africa, Channa argus boasts advantages such as fast growth, resistance to low oxygen conditions, and medicinal properties [26,27,28]. There are three natural types of C. argus with different body colors, namely the wild type (WT, grayish-black), the stably inherited albino mutant (AM, in its early stage, its body color is the same as that of the WT), and the newly discovered yellow mutant (YM) [29,30]. Albinism, characterized as a stable genetic variation, has given rise to unique lineages among various economically important fish species [22]. The AM C. argus is naturally found in the middle and lower reaches of the Jialing River basin in Sichuan Province, China. Due to its unique color characteristics, AM C. argus has a market price three to four times higher than that of WT C. argus. However, the molecular mechanism underlying the formation of the albino phenotype remains unclear.
In recent years, the advancement of high-throughput sequencing technology has provided powerful tools for elucidating the molecular mechanisms underlying phenotypic variation. However, the genetic basis of albinism in non-model fish species such as the albino C. argus remains incompletely understood, particularly regarding how pigment loss manifests in adulthood despite normal early development. We hypothesize that this time-dependent albinism in C. argus arises from dysregulation of melanin synthesis and melanocyte maintenance pathways in post-juvenile stages, rather than defects in neural crest migration or initial melanocyte specification. To test this hypothesis, this study employs a systematic analysis combining morphological, histological, and transcriptome to elucidate the genetic basis and molecular regulatory network underlying albinism in C. argus. We anticipate this research will reveal novel insights into the developmental regulation of pigmentation and provide a genetic foundation for understanding albinism as a developmental process rather than a static trait. Concurrently, this study offers theoretical support for targeted selection and breeding of body coloration in C. argus and their close relatives, and enhances our evolutionary biological understanding of vertebrate pigment development.
2. Materials and Methods
2.1. Sample Collections
The WT and AM C. argus used here were collected from a fish farm, located at Neijiang City, Sichuan Province, China. The skin tissues from WT C. argus adults (n = 5), AM C. argus adults (n = 5), and 15-day post-fertilization (dpf) AM C. argus (n = 5) were dissected for transcriptomic analysis. Before sample collection, all specimens randomly selected for the experiment were euthanized using MS-222 (200 mg/L, Sigma, Aldrich (Shanghai)Trading Co., Ltd., Shanghai, China). The samples were immediately frozen in liquid nitrogen for 24 h, and then stored at −80 °C for RNA sequencing. Meanwhile, some pieces of the skin tissues were fixed in 4% paraformaldehyde (PFA) (Sigma-Aldrich (Shanghai)Trading Co., Ltd., Shanghai, China) for histological analysis. Morphological observations were conducted by examining and photographing specimens collected at different time points under a stereomicroscope.
2.2. Histological Analysis
Skins of WT (n = 3) and AM C. argus (n = 3) were fixed with 4% PFA, and then were hydrated in a gradient alcohol series, cleared in xylene (China National Pharmaceutical Group Corporation, Beijing, China), and embedded in paraffin. Embedded sample was serially sectioned at a thickness of 5 μm. Sections were stained using hematoxylin and eosin (HE) staining, then observed under a Nikon Eclipse E600 microscope (Nikon, Chiyoda City, Japan).
2.3. Immunofluorescence
The skin was immediately sampled and fixed in 4% PFA. The fixed specimens were embedded in optimal cutting temperature (OCT)-freeze medium and sectioned at 8 μm. Anti-alpha tyrosinase (Tyr) Rabbit pAb (A1254) and FITC Goat Anti-Rabbit IgG (H+L) (AS011) were purchased from ABclonal Technology Co., Ltd. (Wuhan, China). The procedures of immunofluorescence analysis were performed as described previously [31]. Tissues were observed under a laser scanning confocal microscope (Leica DMi8, Leica Microsystems, Wetzlar, Germany).
2.4. Western Blot (WB) Analysis
The protein samples were collected from skin tissues of WT and AM C. argus, and then the BCA protein assay kit was used to determine the protein concentrations to ensure the standard protein contents for WB analysis. Anti-Rabbit polyclonal antibodies GAPDH Rabbit mAb (A19056) were purchased from ABclonal Technology Co., Ltd. (Wuhan, China). WB assays were performed as described previously [31].
2.5. RNA Extraction, Library Construction, and Illumina Sequencing
Total RNAs extracted from skin of WT-adult, AM-adult, and 15 dpf AM C. argus using RNAiso Plus (TaKaRa, Higashinari-ku, Osaka, Japan) according to the manufacturer’s instructions. Then, NanoDrop 2000 (Thermo Fisher Scientific, Wilmington, DE, USA) was used to test the concentration and purity of 1 µL extracted RNA. Only high-quality RNA sample (OD260/280 = 1.8~2.2, OD260/230 ≥ 2.0, RIN ≥ 6.5, 28S:18S ≥ 1.0, >1 μg) was used to construct sequencing library. RNA-seq transcriptome library was prepared following TruSeq TM RNA sample preparation Kit from Illumina (Illumina, San Diego, CA, USA) using 1 μg of total RNA. Shortly, messenger RNA was isolated according to polyA selection method by oligo (dT) beads and then fragmented by fragmentation buffer first. Secondly, double-stranded cDNA was synthesized using a SuperScript double-stranded cDNA synthesis kit (Illumina, San Diego, CA, USA) with random hexamer primers (Illumina). Then the synthesized cDNA was subjected to end-repair, phosphorylation, and ‘A’ base addition according to Illumina’s library construction protocol. Fifteen skin cDNA libraries were constructed in this study. Libraries were size-selected for cDNA target fragments of 300 bp on 2% Low Range Ultra Agarose followed by PCR amplified using Phusion DNA polymerase (NEB) for 15 PCR cycles. After being quantified by TBS380, paired-end RNA-seq sequencing library was sequenced with the Illumina HiSeq xten/NovaSeq 6000 sequencer (Illumina, San Diego, CA, USA) (2 × 150 bp read length).
2.6. Read Mapping and Functional Annotation
The raw data (raw reads) of fastq format were first processed through in-house perl scripts. In this procedure, high-quality clean data (clean reads) was obtained for subsequent analysis by removing low-quality reads and calculating the Q20, Q30, GC-content, and sequence duplication level of the clean data at the same time. These clean reads were then mapped to the reference genome sequence (NCBI RefSeq: GCA_033026475.1). Hisat2 software (Version 201.0) was used to map with the reference genome. Gene function was annotated based on the following databases: NR (NCBI protein nonredundant, https://www.ncbi.nlm.nih.gov/public/, accessed on 25 June 2025), Pfam (Protein family database, http://pfam.xfam.org/, accessed on 25 June 2025), COG (Clusters of orthologous groups of proteins database, http://eggnogdb.embl.de/#/app/home, accessed on 25 June 2025), Swiss-Prot database (http://pfam.xfam.org/, accessed on 25 June 2025), KEGG (Kyoto encyclopedia of genes and genomes database, http://www.genome.jp/kegg/, accessed on 25 June 2025), and GO (Gene ontology database, http://www.geneontology.org/, accessed on 25 June 2025).
2.7. Identification and Analysis of DEGs
Differential expression analysis of each condition group was performed using DESeq2 (Version 1.10.1). The resulting p value was adjusted using Benjamini and Hochberg’s approach for controlling the false discovery rate. Genes satisfying p value < 0.05 by DESeq2 were considered as the differentially expressed genes. In addition, functional enrichment analyses including GO and KEGG were performed to identify the DEGs that were significantly enriched in GO terms and metabolic pathways at Bonferroni-corrected p value < 0.05 compared with the whole-transcriptome background.
2.8. Quantitative Real-Time PCR (qPCR)
The expression levels of key genes for melanin synthesis including tyr, tyrp1b, dct, aoc2, fzd4, kitb, kitlga, mitfa, mitfb, pmela, and pmelb, and xanthophore formation including pax3a, pax3b, pax4, pax7a, and sox10 were examined in different developmental stages. In addition, ten DEGs (i.e., asip1, camk2a, adcy2b, dbh, adh1, tomt, gstz1, th, ddc, and gch2) were randomly selected to verify the RNA-seq results by qPCR. The qPCR reaction solution consisted of 5 μL 2× FonsSuperTM SYBR Green qPCR Mix (Fonsber Biotechnology Co., Ltd., Wuhan, China), 0.2 μL PCR forward primer (0.1 μM), 0.2 μL PCR reverse primer (0.1 μM), 1.0 μL cDNA solution, and 3.6 μL dH2O. Thermal cycling on QuantStudio® 3 (Thermo Fisher Scientific, Waltham, MA, USA) was 95 °C 5 min; 40 cycles: 95 °C 10 s, 60 °C 30 s; melt curve: 60–95 °C, +0.3 °C/s. The average threshold cycle (Ct) was calculated for each sample using the 2−ΔΔCt method and normalized to β-actin. All of the primer sequences for qPCR are listed in Table S1.
2.9. Statistical Analysis
All data were presented as the mean ± standard deviation (SD). Statistical analyses were performed using SPSS 26.0 software (IBM Analytics, Richmond, VA, USA). Validation was performed for comparison between the two groups. To account for multiple comparisons and control the family-wise error rate, the p value from all statistical tests were adjusted using the Bonferroni correction method. A p value < 0.05 and p value < 0.001 indicated significant differences.
3. Results
3.1. External Morphological and Histological Analysis of WT and AM C. Argus
The phenotypic differences in body color between WT and AM C. argus can be clearly seen from the external morphology. WT has obvious melanin markings, while AM’s skin and scales are white (Figure 1A). To investigate the trajectory of pigmentation in albino C. argus, we observed the surface pigmentation of WT and AM C. argus at different developmental stages through morphology and histology. The results showed that no melanocytes were observed in WT and AM C. argus embryos at 16 h post-fertilization (hpf), and the distribution of melanin was clearly visible on WT and AM C. argus embryos at 36 hpf. At this time, there was no difference between WT and AM C. argus (Figure 1B). We further observed that there was no significant difference in body color between WT and AM C. argus at 2 dpf, 5 dpf, 15 dpf, and 30 dpf. Notably, a large number of melanocytes were scattered throughout the body of AM C. argus at 2 dpf and 5 dpf. However, at 60 dpf, we observed a significant difference in body color between WT and AM C. argus, which is similar to the difference between adult WT and AM C. argus (Figure 1B). The above inference was confirmed through histological analysis, and there was no significant difference in the pigment cells presented by WT and AM C. argus during the juvenile stage. On the contrary, in adulthood, the melanocytes in AM C. argus skin sharply decrease, showing significant differences from WT C. argus (Figure 1C). In summary, our results demonstrated that there is no significant difference in pigmentation between AM and WT C. argus during early development, and albinism gradually forms with changes during growth.
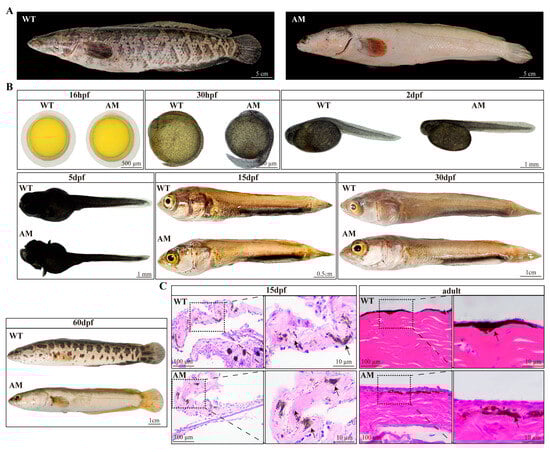
Figure 1.
Comparative observation of body color phenotype between WT and AM Channa argus. (A): Comparison of body color phenotype between adult WT and AM C. argus. (B): Comparison of body color phenotype between embryonic and larvae of WT and AM C. argus. (C): Histological observation of skin of WT and AM C. argus. The black arrow represents melanocytes. WT, wild type; AM, albino-mutant; hpf, hour post-fertilization; dpf, day post-fertilization.
3.2. Sequencing and De Novo Assembly
To further investigate the molecular mechanism underlying albinism in C. argus, we collected skin samples from adult WT and AM individuals, as well as from 15 dpf AM C. argus for RNA-seq. A total of 97.38 Gb clean data was obtained by sequencing. The average clean data of each sample reached 5.91 Gb and the percentage of Q30 was more than 94.76%. The GC content of the entire final assembly was 44.75–47.99%. A total of 650,308,692 clean reads were obtained for de novo assembly (Table 1). After assembling and clustering, a total of 25,314 unigenes were obtained.

Table 1.
Statistical analysis of the assembly quality for betta transcriptomes.
3.3. DEG Analysis
Firstly, the differential expression between the sample groups was analyzed by using DESeq2 to obtain the sets of DEGs. A total of 10,891 genes were significantly differentially expressed in the AM-adult vs. WT-adult, and AM-adult vs. AM-15dpf (Table S2). Specifically, of the 3320 DEGs in AM-adult vs. WT-adult, 1459 were up-regulated and 1861 were down-regulated (Figure 2A); of the 9708 DEGs in AM-adult vs. AM-15dpf, 4239 were up-regulated and 5469 were down-regulated (Figure 2B). Venn diagram analysis revealed overlapping DEGs across the AM-adult vs. WT-adult, and AM-adult vs. AM-15dpf comparison sets (Figure 2C).
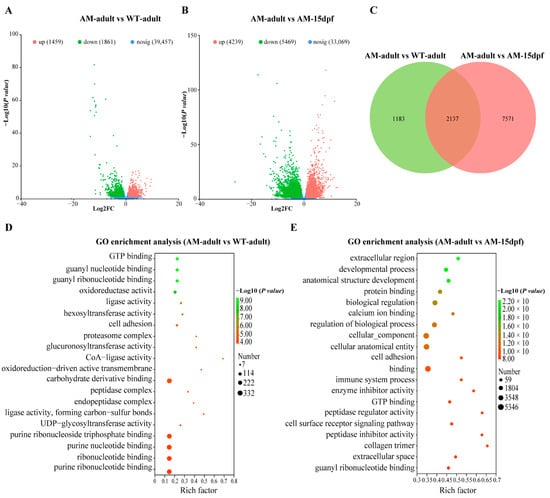
Figure 2.
Comparative transcriptome analysis reveals key gene expression differences in the skin of AM-adult, WT-adult, and AM-15dpf C. argus. (A,B): Volcano plot showing DEGs between skins of WT-adult vs. AM-adult, and AM-adult vs. AM-15dpf C. argus. Significantly up-regulated DEGs in AM-adult are marked in red, and down-regulated DEGs are marked in green. Blue dots represent genes with non-significance. (C): Venn diagram illustrating the overlap of DEGs from the two comparisons (AM-adult vs. WT-adult and AM-adult vs. AM-15dpf). (D,E): GO enrichment analysis of DEGs of AM-adult vs. WT-adult, and AM-adult vs. AM-15dpf. The top significantly enriched terms are shown, indicating key biological processes, cellular components, and molecular functions affected by the albino mutation. WT, wild type; AM, albino-mutant; dpf, day post-fertilization; nosig, non-significant; DEGs, differentially expressed genes; GO, gene ontology database.
To further analyze the functional items involved in these DEGs, we conducted GO and KEGG enrichment analyses on the DEGs of different groups, AM-adult vs. WT-adult, and AM-adult vs. AM-15dpf, respectively. GO enrichment analysis showed that, in AM-adult vs. WT-adult, purine ribonucleotide binding, ribonucleotide binding, purine ribonucleoside triphosphate binding, carbohydrate derivative binding, and purine nucleotide binding were the most enriched (Figure 2D). In AM-adult vs. AM-15dpf, guanyl ribonucleotide binding, extracellular space, collagen trimer, cell surface receptor signaling pathway, and GTP binding were the most enriched (Figure 2E). KEGG enrichment analysis showed that a large number of DEGs are related to pigmentation, and in AM-adult vs. WT-adult, steroid biosynthesis, tyrosine metabolism, steroid hormone biosynthesis, drug metabolism—cytochrome P450, metabolism of xenobiotics by cytochrome P450, and fatty acid degradation are all related to pigmentation (Figure 3A). In AM-adult vs. AM-15dpf, tyrosine metabolism, melanoma, Wnt signaling pathway, metabolism of xenobiotics by cytochrome P450, drug metabolism—cytochrome P450, steroid hormone biosynthesis, and PI3K-Akt signaling pathway are all related to pigmentation (Figure 3B).
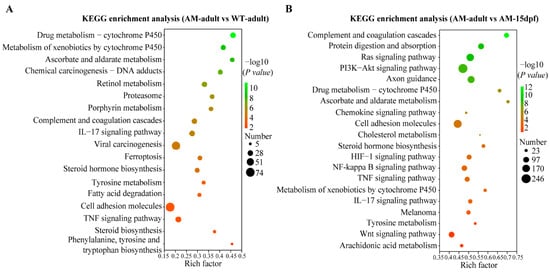
Figure 3.
KEGG enrichment analysis of DEGs of different comparisons. (A): KEGG enrichment analysis of DEGs of AM-adult vs. WT-adult. (B): KEGG enrichment analysis of DEGs of AM-adult vs. AM-15dpf. WT, wild type; AM, albino-mutant; dpf, day post-fertilization. DEGs, differentially expressed genes; KEGG, Kyoto encyclopedia of genes and genomes database.
3.4. Identification of Pigmentation-Related Genes
In order to explore the genes related to the albino of C. argus, we identified genes related to pigmentation in the 2137 DEGs shared by AM-adult vs. WT-adult, and AM-adult vs. AM-15dpf (Figure 2C). Among these DEGs, we first identified the pathways and genes associated with vertebrate pigmentation. They were mainly involved in melanogenesis (include adcy6, adcy2b, asip1, camk2a, camk2d2, crebbpa, fzd2, fzd4, kitlga, creb3l3l, cyld3, gnao1b, adh1, mitfa, mitfb, kitb, aoc2, pmela, tomt, csf1rb, gch2, dct, ddc, th, and pmelb), melanoma (include fgf7, fgf16, fgf20b, fgf21, mdm2, pik3r3b, sdcbp2, ddb2, hgfa, and pdgfab), tyrosine metabolism (include aldh3d4, dbh, gstz1, tyr, tyrp1b, and il4i1), xanthophore formation (include pax3a, pax3b, pax4, pax7a, and sox10), and P53 signaling pathways (include rrm2, atm, tp53, tp53i3, bax, casp3, casp8, fas, gadd45ga, serpine1, and bcl2) (Figure 4). These genes may play an important role in the albino of C. argus.
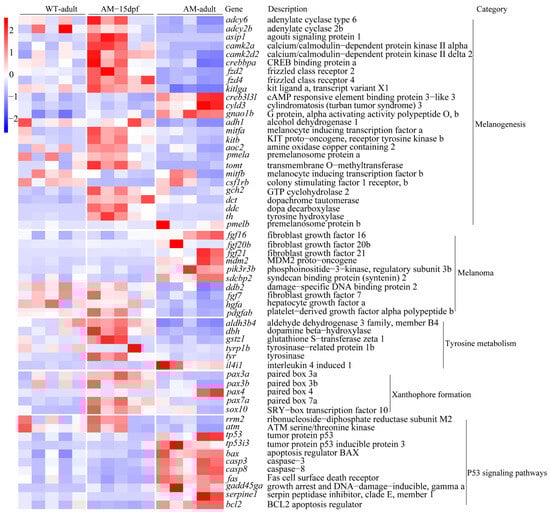
Figure 4.
Heat map of expression levels of DEGs related to body color phenotype. WT, wild type; AM, albino-mutant; dpf, day post-fertilization; DEGs, differentially expressed genes.
3.5. Validation of DEGs by qPCR
To validate the gene expression profiles identified by RNA-seq, we randomly selected ten genes (asip1, camk2a, adcy2b, dbh, adh1, tomt, gstz1, th, ddc, and gch2) for qPCR analysis. The expression patterns in qPCR were consistent with those of RNA-seq (Figure 5).
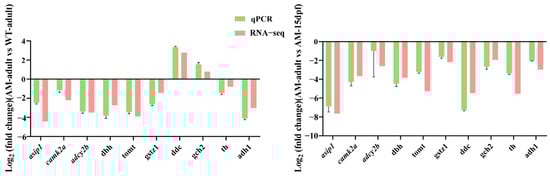
Figure 5.
qPCR validation for RNA-seq data. qPCR, quantitative real-time PCR; WT, wild type; AM, albino-mutant; dpf, day post-fertilization; asip1, agouti signaling protein 1; camk2a, calcium/calmodulin-dependent protein kinase II alpha; adcy2b, adenylate cyclase 2b; dbh, dopamine beta-hydroxylase; tomt, transmembrane O-methyltransferase; gstz1, glutathione S-transferase zeta 1; ddc, dopa decarboxylase; gch2, GTP cyclohydrolase 2; th, tyrosine hydroxylase; adh1, alcohol dehydrogenase 1.
3.6. Expression of Albino-Related Genes in C. argus at Different Developmental Stages
Given that there was no significant difference in pigmentation between AM and WT during the embryonic and juvenile stages, it is speculated that the expression patterns of the aforementioned pigmentation-related genes during the early developmental stage of AM may differ significantly from those during the adult stage. To verify this speculation, we focused on detecting the expression levels of the aforementioned genes during the different ontogenetic stages of WT and AM using qPCR (Figure 6A). Here, we focused on detecting the expression of genes directly related to albinism, including melanogenesis-related genes tyr, tyrp1b, dct, fzd4, kitb, kitlga, pmela, pmelb, mitfa, and mitfb, as well as xanthophore-formation-related genes pax3a, pax3b, pax4, pax7a, and sox10. Compared with WT, genes related to melanogenesis, such as tyr, dct, fzd4, kitb, kitlga, and mitfa, were significantly up-regulated in the different ontogenetic stages of AM C. argus. These genes are significantly down-regulated during the adult stage. However, compared with WT, tyrp1b and mitfb were significantly up-regulated in early embryonic development of AM C. argus, and showed a significant downregulation trend from 2 dpf to 5 dpf onwards. Compared with WT, there was no significant difference in the expression of mitfa gene between 24 hpf and 36 hpf AM C. argus, but it showed a significant increase in 2 dpf~30 dpf stage and a significant decrease in adulthood. Compared with WT, the expression of pmela gene was significantly up-regulated in 24 hpf~2 dpf AM C. argus, while there was no significant difference between 5 dpf and 15 dpf stages, and showed a significant down-regulated trend after 30 dpf. Compared with WT, there was no significant difference in the expression of pmelb gene between 24 hpf and 5 dpf~30 dpf AM C. argus, but it showed a significant up-regulated trend at 36 dpf, 2 dpf, and adult stage. Compared with WT, the xanthophore-formation-related genes pax3a, pax3b, pax7a, and sox10 were significantly up-regulated in the early developmental stage of AM, while in adulthood, except for sox10, the other three genes were significantly down-regulated. Compared with WT, there was no significant difference in the expression of pax4 gene in 24 hpf, 36 hpf, and 30 dpf AM C. argus, but it showed a significant down-regulated trend at 2 dpf, 5 dpf, and 15 dpf stages, and a significant up-regulated trend in adulthood (Figure 6A). The immunofluorescence and WB analysis of the melanocyte marker Tyr further demonstrated the significant reduction in melanocytes in AM skin compared to WT C. argus (Figure 6B,C and Figure S1).
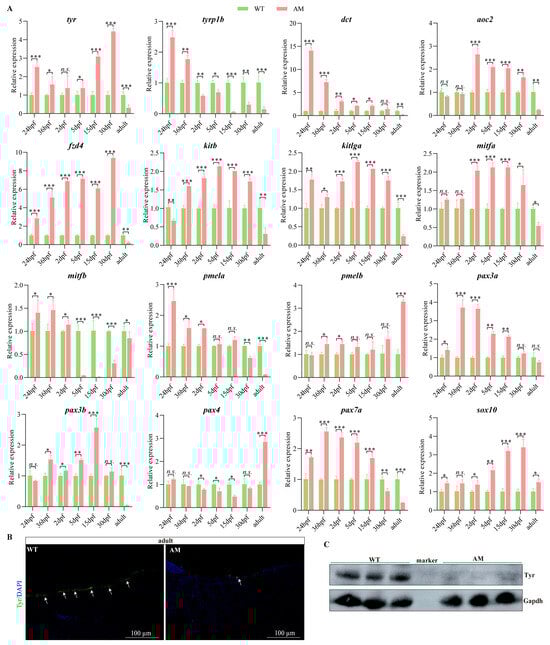
Figure 6.
(A): qPCR detection of mRNA levels of the melanogenic and xanthophore formation genes at different ontogenetic stages of WT and AM Channa argus. “*”, “**” and “***” asterisks above the error bar indicated statistically significant differences at 0.01 < p < 0.05, 0.001 < p < 0.01 and p < 0.001, respectively. (B): Immunofluorescence analysis of Tyr localization in WT and AM C. argus skin. The arrow indicates the location where melanocytes gather. (C): Western blot analysis of protein abundances of Tyr in WT and AM C. argus skin. qPCR, quantitative real-time PCR; WT, wild type; AM, albino-mutant; tyr, tyrosinase; tyrp1b, tyrosinase-related protein 1b; dct, dopachrome tautomerase; aoc2, amine oxidase copper containing 2; fzd4, frizzled class receptor 4; kitb, KIT proto-oncogene, receptor tyrosine kinase b; kitlga, kit ligand a, transcript variant X1; mitfa, melanocyte-inducing transcription factor a; pmela, premelanosome protein a; pax3a, paired box 3a; sox10, SRY-box transcription factor 10.
4. Discussion
Body coloration in vertebrates serves critical biological functions including ultraviolet protection, predator avoidance, species recognition, and mate selection, with teleost fish representing prime models for studying pigment patterning diversity due to their extensive neural crest-derived chromatophore systems [32,33,34]. Coloration mutants are common in fish, particularly in ornamental species such as cichlids, paradise fish (Macropodus opercularis), swordtails (Xiphophorus helleri), and goldfish (Carassius auratus) [34,35]. In aquaculture, body coloration is defined as an economically important trait where appearance directly determines the market value of a species, as exemplified by red Nile tilapia [7,36], yellow-albino rainbow trout [25], yellow-albino Taiwanese loach [37], and most freshwater/marine ornamental species [38]. In genetic research, body color phenotypes serve as visual markers to evaluate chromosomal manipulation efficiency and optimize gene-editing methodologies [39,40]. Furthermore, pigmentary mutations such as albinism serve as crucial, visually traceable models for investigating adaptive evolution in ecology [41]. Extensive studies have been conducted using model organisms like zebrafish and medaka [42,43,44], but the molecular mechanisms underlying skin color formation in non-model fish, including the whole-body albino mutant of C. argus, remain poorly understood. In this study, we identified numerous albinism-related regulatory pathways and genes in the AM-adult vs. WT-adult, and AM-adult vs. AM-15dpf groups, providing a reference for exploring the molecular mechanisms related to the formation of albino C. argus.
In contrast to golden albinism, the light-white albino variant represents a rarer phenotype with limited documentation in fish [45]. Both phenotypes, however, can result from mutations affecting melanophore development or melanin synthesis pathways. The albino phenotype typically involves the absence of both melanophores and xanthophores, while iridophores that reflect all wavelengths of light may be present, leading to a white appearance [17,46]. Nevertheless, regulatory differences exist across species. For instance, in medaka, white coloration is determined by a specific pigment cell called leukophore, which is absent in zebrafish and rainbow trout [43,45]. Furthermore, studies have shown that pigmentation is closely linked to the development, structure, and hormone secretion of the pituitary gland. In this study, we observed that AM and WT C. argus exhibited comparable pigmentation at the larval stage. However, the difference in coloration became progressively apparent with development. We hypothesize that this dynamic phenotypic divergence may be mediated by a complex hormone network associated with growth and maturation. Taking cobalt blue trout as an example, its morphology is highly similar to that of sea trout. During the process of migration (i.e., the transition from freshwater to marine environment), individuals with the sea type will develop specific phenotypic characteristics: their back will be blue gray, their abdomen and sides will be silver white, and their body shape will become slenderer. This adaptive process involves changes in body shape and color patterns, triggered by environmental signals, and mediated through a complex network of hormones, including growth hormone/insulin-like growth factor 1, cortisol, thyroid hormones, and prolactin [47,48,49,50].
This research has detected significant expression changes in critical genes regulating pigmentation, and these changes are believed to play a central role in the development of the albino phenotype. The microphthalmia-associated transcription factor (Mitf) functions as a master regulator of vertebrate melanogenesis, coordinating the expression of key melanogenic enzymes such as tyr, tyrp1, dct, and pmel across diverse species [30,51,52]. Functional impairment of this gene consistently leads to hypopigmentation phenotypes evolutionarily conserved from murine models exhibiting albinism to zebrafish melanophore deficiencies [53]. Phenotypic outcomes are contingent upon mutation type, where coding-sequence alterations disrupt melanocyte differentiation, while regulatory mutations generate context-dependent patterns as demonstrated by canine white spotting through non-coding variants [54]. Teleost-specific genome duplication produced mitfa and mitfb paralogs with distinct sub-functionalized roles. mitfa primarily regulates melanophore development, as observed in zebrafish, whereas mitfb supports sensory organ formation [55,56]. In Nile tilapia (Oreochromis niloticus), this functional divergence manifests through specific phenotypic outcomes. mitfa homozygous mutants display light-yellow body coloration with retained gray vertical bars and black retinal pigment epithelium, though iris hypopigmentation reveals carotenoid-mediated orange pigmentation. mitfb mutants maintain disrupted bar patterns that fragment into horizontal black spots alongside iris hypopigmentation despite preserved retinal pigmentation. Double mutants exhibit synergistic effects including near-complete melanophore loss, resulting in pink body coloration with sporadic black spots, alongside exacerbated iris depigmentation beyond that observed in mitfa single mutants. These findings collectively establish the central role of mitf in tilapia pigmentation while delineating paralog-specific contributions to pattern formation, representing an evolutionary innovation derived from vertebrate genome duplication [7].
The pmel gene functions as a key regulator downstream of mitf in melanin biosynthesis pathways, encoding a transmembrane glycoprotein essential for melanosome matrix structure [57,58]. This protein mediates the assembly of intraluminal fibrils within melanosomes, providing scaffolding for melanin deposition and protecting cells from oxidative stress during pigment synthesis. Loss-of-function mutations cause species-specific pigment defects. In mouse, pmel mutations alter melanosome morphology with minimal coat color impact. Japanese quail with truncating mutations exhibit yellowish plumage due to impaired eumelanin synthesis [57,59]. Chickens carrying pmel null alleles show plumage lightening, while dominant-negative mutations produce completely white feathers, confirming its critical role in melanosome maturation [60]. Human studies link pmel to vitiligo pathogenesis involving melanocyte loss [61,62]. Although pmel expression is elevated in dark vertical bars of cichlid fish, its function remained unverified in teleosts until tilapia pmel mutants demonstrated iris hypopigmentation, lateral bar loss, and melanophore reduction. Notably, residual bars remained localized to their original positions despite pattern disruption [7]. These findings establish pmel as a conserved regulator of eumelanin synthesis and distribution through melanosomal organization across vertebrates. In this study, we also found differential abnormal expression of pmela and pmelb in AM C. argus, which may be directly related to the albino phenotype.
The receptor tyrosine kinase kitb and its ligand kitlga constitute an evolutionarily conserved signaling axis essential for vertebrate melanophore development. This ligand–receptor system orchestrates pigment cell precursor migration and differentiation, directly influencing pigment pattern formation across teleost species [63,64]. Functional impairment of either component consistently reduces melanophore populations and disrupts chromatophore composition, as documented in zebrafish and medaka models [32,64,65]. In tilapia, genetic perturbation of this pathway yields definitive pigmentation defects. kita homozygous mutants exhibit complete loss of body striping alongside a striking golden body coloration, with melanophores reduced to sparse scattered populations. Similarly, kitlga-F0 mutants display significant melanin deficiency in both trunk bars and inter-bar regions. These findings confirm the kit/kitlg pathway’s fundamental role in tilapia melanophore ontogeny and spatial patterning [7].
Carotenoids function as essential lipid-soluble pigments responsible for red, yellow, and orange coloration in vertebrates through accumulation within xanthophores alongside pteridine derivatives [65,66]. The development and maintenance of xanthophores are critically regulated by transcription factors pax3, pax7, and sox10 across teleost species [67,68]. Functional studies demonstrate that pax3 deficiency causes complete xanthophore loss in zebrafish, pax7 knockdown reduces xanthophore density, and sox10 inactivation significantly diminishes xanthophore populations in guppies [67,68]. While pax4 remains uncharacterized in pigment cell biology, carotenoid bioavailability depends on lipid metabolism pathways, evidenced by differential expression of lipid-processing genes between pigmented and unpigmented fin tissues. These findings establish pax3, pax7, and sox10 as core transcriptional regulators of xanthophore development within an evolutionarily conserved network integrating carotenoid transport with pigment cell differentiation.
5. Conclusions
This study provides the first comprehensive transcriptome landscape of economically important albino phenotypes in C. argus. Beyond the established role of known pigmentation genes, our key finding is that albinism in C. argus is a dynamic manifestation, and the pigmentation phenotypes of AM and WT C. argus individuals cannot be distinguished during early development. However, the severe reduction in melanocytes leads to the gradual formation of AM C. argus. This temporal dynamic suggests that C. argusis’ albinism is not caused by the failure of melanocyte formation, but rather by dysregulation of pigment cell maintenance or melanin synthesis during growth and maturation, which may be mediated by complex hormone and gene regulatory networks. Through comparative transcriptomic analysis, we identified DEGs that are crucial for regulating this process, including melanogenesis (i.e., tyr, tyrp1b, kitb, kitlga, pmela, pmelb, mitfa, and mitfb), and xanthophore (i.e., pax3a, pax3b, pax7a, and sox10) formation. The simultaneous downregulation of genes in different pigment cell lineages indicates the failure of transcriptional pleiotropy regulation, providing a molecular explanation for the complete loss of pigments. In conclusion, our findings not only clarify the genetic basis of economically valuable traits, but also provide an important model for studying the postembryonic regulation of pigment cells. The gene resources and regulatory networks identified here lay a key foundation for future functional research using gene editing and targeted cultivation of commercially ideal color forms in aquaculture.
Supplementary Materials
The following supporting information can be downloaded at: https://www.mdpi.com/article/10.3390/fishes10110582/s1, Figure S1: Relative expression levels of Tyr protein; Table S1: Primers used in this study; Table S2: All differentially expressed genes are presented.
Author Contributions
X.C. was involved in supervision, conceptualization, methodology, writing—review and editing, project administration, and funding acquisition. Y.Z. (Yunbang Zhang), Q.R., Y.L., X.W., L.W. and Y.C. performed the material preparation, methodology, data collection and analysis. Y.Z. (Yunbang Zhang), Q.R. and X.C. interpreted the results. The first draft of the manuscript was written by Y.Z. (Yunbang Zhang) and all authors commented on previous versions of the manuscript. Y.Z. (Yuanchao Zou) and J.G. participated in the works of supervision and visualization, and provided a review and modification of the manuscript. All authors have read and agreed to the published version of the manuscript.
Funding
This study was financially supported by Open Research Project of Key Laboratory of Sichuan Province for Fishes Conservation and Utilization in the Upper Reaches of the Yangtze River, Neijiang Normal University (Project Number: NJTCCJSYSYS05), Sichuan Provincial Funding for Freshwater Fish Innovation (Project Number: SCCXTD-2025-15), Project of Sichuan Provincial Department of science and technology (Project Number: 2025NSFSC2126), Open project of Key Laboratory of Freshwater Fish Reproduction and Development (Ministry of Education) (Project Number: FFRD-2022-02), and Laboratory of Sichuan Province for Fishes Conservation and Utilization in the Upper Reaches of the Yangtze River (Project Number: NJTCSC23-5).
Institutional Review Board Statement
The animal study protocol was approved by the Ethics Committee of Neijiang Normal University (protocol code: NJNU-2025-0008; 15 April 2025). All experimental procedures were conducted in strict accordance with institutional animal care guidelines.
Informed Consent Statement
Not applicable.
Data Availability Statement
All data are available on request.
Conflicts of Interest
The authors declare no conflicts of interest.
References
- Manceau, M.; Domingues, V.S.; Mallarino, R.; Hoekstra, H.E. The developmental role of agouti in color pattern evolution. Science 2011, 331, 1062–1065. [Google Scholar] [CrossRef]
- Urban, S.; Gerwin, J.; Hulsey, C.D.; Meyer, A.; Kratochwil, C.F. The repeated evolution of stripe patterns is correlated with body morphology in the adaptive radiations of East African cichlid fishes. Ecol. Evol. 2022, 12, e8568. [Google Scholar] [CrossRef]
- Braasch, I.; Schartl, M.; Volff, J.N. Evolution of pigment synthesis pathways by gene and genome duplication in fish. BMC Evol. Biol. 2007, 7, 74. [Google Scholar] [CrossRef]
- Kimura, T. Pigments in Teleosts and their Biosynthesis. In Pigments, Pigment Cells and Pigment Patterns; Springer: Berlin/Heidelberg, Germany, 2021; pp. 127–148. [Google Scholar] [CrossRef]
- Bagnara, J.T. Cytology and cytophysiology of non-melanophore pigment cells. Int. Rev. Cytol. 1966, 20, 173–205. [Google Scholar] [CrossRef]
- Fujii, R. The regulation of motile activity in fish chromatophores. Pigment Cell Res. 2000, 13, 300–319. [Google Scholar] [CrossRef]
- Wang, C.; Lu, B.; Li, T.; Liang, G.; Xu, M.; Liu, X.; Tao, W.; Zhou, L.; Kocher, T.D.; Wang, D. Nile tilapia: A model for studying teleost color patterns. J. Hered. 2021, 112, 469–484. [Google Scholar] [CrossRef]
- Luo, M.; Lu, G.; Yin, H.; Wang, L.; Atuganile, M.; Dong, Z. Fish pigmentation and coloration: Molecular mechanisms and aquaculture perspectives. Rev. Aquacult. 2021, 13, 2395–2412. [Google Scholar] [CrossRef]
- Hirata, M.; Nakamura, K.; Kanemaru, T.; Shibata, Y.; Kondo, S. Pigment cell organization in the hypodermis of zebrafish. Dev. Dyn. 2003, 227, 497–503. [Google Scholar] [CrossRef] [PubMed]
- Grether, G.F.; Kolluru, G.R.; Nersissian, K. Individual colour patches as multicomponent signals. Biol. Rev. Camb. Philos. Soc. 2004, 79, 583–610. [Google Scholar] [CrossRef]
- Hirata, M.; Nakamura, K.; Kondo, S. Pigment cell distributions in different tissues of the zebrafish, with special reference to the striped pigment pattern. Dev. Dyn. 2005, 234, 293–300. [Google Scholar] [CrossRef] [PubMed]
- Irion, U.; Singh, A.P.; Nüsslein-Volhard, C. The developmental genetics of vertebrate color pattern formation: Lessons from zebrafish. Curr. Top. Dev. Biol. 2016, 117, 141–169. [Google Scholar] [CrossRef]
- Bian, F.F.; Yang, X.F.; Ou, Z.; Luo, J.Z.; Tan, B.Z.; Yuan, M.R.; Chen, T.S.; Yang, R.B. Morphological characteristics and comparative transcriptome analysis of three different phenotypes of Pristella maxillaris. Front. Genet. 2019, 10, 698. [Google Scholar] [CrossRef] [PubMed]
- Nelson, J.S.; Grande, T.C.; Wilson, M.V.H. Fishes of the World, 5th ed.; John Wiley & Sons: Hoboken, NJ, USA, 2016. [Google Scholar]
- Keenleyside, M.H. Diversity and Adaptation in Fish Behaviour; Springer: Berlin/Heidelberg, Germany, 2012. [Google Scholar]
- Johnsson, J.I. Behavioural defenses in fish. In Fish Defenses Vol. 2: Pathogens, Parasites and Predators; CRC Press: Boca Raton, FL, USA, 2019; Volume 2, p. 243. [Google Scholar] [CrossRef]
- Kelsh, R.N. Genetics and evolution of pigment patterns in fish. Pigment Cell Res. 2004, 17, 326–336. [Google Scholar] [CrossRef]
- Schartl, M.; Larue, L.; Goda, M.; Bosenberg, M.W.; Hashimoto, H.; Kelsh, R.N. What is a vertebrate pigment cell? Pigment Cell Melanoma Res. 2016, 29, 8–14. [Google Scholar] [CrossRef]
- Montoliu, L.; Grønskov, K.; Wei, A.H.; Martínez-García, M.; Fernández, A.; Arveiler, B.; Morice-Picard, F.; Riazuddin, S.; Suzuki, T.; Ahmed, Z.M.; et al. Increasing the complexity: New genes and new types of albinism. Pigment Cell Melanoma Res. 2014, 27, 11–18. [Google Scholar] [CrossRef] [PubMed]
- Huizing, M.; Malicdan, M.C.V.; Wang, J.A.; Pri-Chen, H.; Hess, R.A.; Fischer, R.; O’Brien, K.J.; Merideth, M.A.; Gahl, W.A.; Gochuico, B.R. Hermansky-Pudlak syndrome: Mutation update. Hum. Mutat. 2020, 41, 543–580. [Google Scholar] [CrossRef]
- Kon, T.; Omori, Y.; Fukuta, K.; Wada, H.; Watanabe, M.; Chen, Z.; Iwasaki, M.; Mishina, T.; Matsuzaki, S.S.; Yoshihara, D.; et al. The genetic basis of morphological diversity in domesticated goldfish. Curr. Biol. 2020, 30, 2260–2274.e6. [Google Scholar] [CrossRef]
- Wang, C.X.; Kocher, T.D.; Lu, B.Y.; Xu, J.; Wang, D.S. Knockout of hermansky-pudlak syndrome 4 (hps4) leads to silver-white tilapia lacking melanosomes. Aquaculture 2022, 559, 738420. [Google Scholar] [CrossRef]
- Hart, J.C.; Miller, C.T. Sequence-based mapping and genome editing reveal mutations in stickleback hps5 cause oculocutaneous albinism and the casper phenotype. G3 2017, 7, 3123–3131. [Google Scholar] [CrossRef]
- Zou, M.; Zhang, X.; Shi, Z.; Lin, L.; Ouyang, G.; Zhang, G.; Zheng, H.; Wei, K.; Ji, W. A comparative transcriptome analysis between wild and albino yellow catfish (Pelteobagrus fulvidraco). PLoS ONE 2015, 10, e0131504. [Google Scholar] [CrossRef] [PubMed]
- Hattori, R.S.; Yoshinaga, T.T.; Butzge, A.J.; Hattori-Ihara, S.; Tsukamoto, R.Y.; Takahashi, N.S.; Tabata, Y.A. Generation of a white-albino phenotype from cobalt blue and yellow-albino rainbow trout (Oncorhynchus mykiss): Inheritance pattern and chromatophores analysis. PLoS ONE 2020, 15, e0214034. [Google Scholar] [CrossRef]
- Xu, J.; Bian, C.; Chen, K.; Liu, G.; Jiang, Y.; Luo, Q.; You, X.; Peng, W.; Li, J.; Huang, Y.; et al. Draft genome of the northern snakehead, Channa argus. Giga Sci. 2017, 6, gix011. [Google Scholar] [CrossRef]
- Liu, J.; Cui, Y.; Liu, J. Resting metabolism and heat increment of feeding in mandarin fish (Siniperca chuatsi) and Chinese snakehead (Channa argus). Comp. Biochem. Physiol. A Mol. Integr. Physiol. 2000, 127, 131–138. [Google Scholar] [CrossRef]
- China’s Ministry of Agriculture. China Fishery Statistical Yearbook; China Agriculture Press: Beijing, China, 2022.
- Zhou, A.; Xie, S.; Feng, Y.; Sun, D.; Liu, S.; Sun, Z.; Li, M.; Zhang, C.; Zou, J. Insights into the albinism mechanism for two distinct color morphs of northern snakehead, Channa argus through histological and transcriptome analyses. Front. Genet. 2020, 11, 830. [Google Scholar] [CrossRef] [PubMed]
- Sun, D.; Qi, X.; Wen, H.; Li, C.; Li, J.; Chen, J.; Tao, Z.; Zhu, M.; Zhang, X.; Li, Y. The genetic basis and potential molecular mechanism of yellow-albino northern snakehead (Channa argus). Open Biol. 2023, 13, 220235. [Google Scholar] [CrossRef] [PubMed]
- Zhang, Y.B.; Mei, Y.H.; Fujimoto, T.; Gao, J.; Huang, Y.W.; Zheng, Y.X.; Li, R.Y.; Guo, Y.K.; Zhang, N.; Jiang, Y.X.; et al. Polyploid formation through disrupting mitotic sister chromatid separation of spermatogonia based on espl1 heterozygous knockout in fish. Mol Biol. Evol. 2025, 42, msaf195. [Google Scholar] [CrossRef] [PubMed]
- Mills, M.G.; Nuckels, R.J.; Parichy, D.M. Deconstructing evolution of adult phenotypes: Genetic analyses of kit reveal homology and evolutionary novelty during adult pigment pattern development of danio fishes. Development 2007, 134, 1081–1090. [Google Scholar] [CrossRef][Green Version]
- Protas, M.E.; Patel, N.H. Evolution of coloration patterns. Annu. Rev. Cell Dev. Biol. 2008, 24, 425–446. [Google Scholar] [CrossRef]
- Maan, M.; Sefc, K.M. Colour variation in cichlid fish: Developmental mechanisms, selective pressures and evolutionary consequences. Semin. Cell Dev. Biol. 2013, 24, 516–528. [Google Scholar] [CrossRef]
- Yamamoto, T.O. Inheritance of albinism in the goldfish, Carassius auratrus. Jpn. J. Genet. 1973, 48, 53–64. [Google Scholar] [CrossRef]
- Hilsdorf, A.W.S.; Penman, D.J.; Farias, E.C.; McAndrew, B. Melanophore appearance in wild and red tilapia embryos. Pigment Cell Res. 2002, 15, 57–61. [Google Scholar] [CrossRef]
- Huang, Z.; Ma, B.; Guo, X.; Wang, H.; Ma, A.; Sun, Z.; Wang, Q. Comparative transcriptome analysis of the molecular mechanism underlying the golden red colour in mutant Taiwanese loach. Aquaculture 2021, 543, 736979. [Google Scholar] [CrossRef]
- Bagnara, J.T.; Fernandez, P.J.; Fujii, R. On the blue coloration of vertebrates. Pigment Cell Res. 2007, 20, 14–26. [Google Scholar] [CrossRef] [PubMed]
- Thorgaard, G.H.; Spruell, P.; Wheeler, P.A.; Scheerer, P.D.; Peek, A.S.; Valentine, J.J.; Hilton, B. Incidence of albinos as a monitor for induced triploidy in rainbow trout. Aquaculture 1995, 137, 121–130. [Google Scholar] [CrossRef]
- Xu, X.W.; Cao, X.J.; Gao, J. Production of a mutant of large-scale loach Paramisgurnus dabryanus with skin pigmentation loss by genome editing with CRISPR/Cas9 system. Transgenic Res. 2019, 28, 341–356. [Google Scholar] [CrossRef]
- Blanc, J.M.; Poisson, H. Expression of family differences through within-lot competition in juvenile rainbow trout Oncorhynchus mykiss. J. World Aquac. Soc. 2003, 34, 425–432. [Google Scholar] [CrossRef]
- Kelsh, R.N.; Brand, M.; Jiang, Y.J.; Heisenberg, C.P.; Lin, S.; Haffter, P.; Odenthal, J.; Mullins, M.C.; Van Eeden, F.J.; Furutani-Seiki, M.; et al. Zebrafish pigmentation mutations and the processes of neural crest development. Development 1996, 123, 369–389. [Google Scholar] [CrossRef] [PubMed]
- Parichy, D.M. Evolution of danio pigment pattern development. Heredity 2006, 97, 200–210. [Google Scholar] [CrossRef] [PubMed]
- Kelsh, R.N.; Inoue, C.; Momoi, A.; Kondoh, H.; Furutani-Seiki, M.; Ozato, K.; Wakamatsu, Y. The Tomita collection of medaka pigmentation mutants as a resource for understanding neural crest cell development. Mech. Dev. 2004, 121, 841–859. [Google Scholar] [CrossRef]
- Kimura, T.; Nagao, Y.; Hashimoto, H.; Yamamoto-Shiraishi, Y.; Yamamoto, S.; Yabe, T.; Takada, S.; Kinoshita, M.; Kuroiwa, A.; Naruse, K. Leucophores are similar to xanthophores in their specification and differentiation processes in medaka. Proc. Natl. Acad. Sci. USA 2014, 111, 7343–7348. [Google Scholar] [CrossRef]
- Krauss, J.; Geiger-Rudolph, S.; Koch, I.; Nüsslein-Volhard, C.; Irion, U. A dominant mutation in tyrp1A leads to melanophore death in zebrafish. Pigment Cell Melanoma Res. 2014, 27, 827–830. [Google Scholar] [CrossRef]
- Folmar, L.C.; Dickhoff, W.W. The parr-Smolt transformation (smoltification) and seawater adaptation in salmonids: A review of selected literature. Aquaculture 1980, 21, 1–37. [Google Scholar] [CrossRef]
- Björnsson, B.T.; Stefansson, S.O.; McCormick, S.D. Environmental endocrinology of salmon smoltification. Gen. Comp. Endocrinol. 2011, 170, 290–298. [Google Scholar] [CrossRef]
- Nichols, K.M.; Edo, A.F.; Wheeler, P.A.; Thorgaard, G.H. The genetic basis of smoltification-related traits in Oncorhynchus mykiss. Genetics 2008, 179, 1559–1575. [Google Scholar] [CrossRef]
- Raible, D.W.; Eisen, J.S. Restriction of neural crest cell fate in the trunk of the embryonic zebrafish. Development 1994, 120, 495–503. [Google Scholar] [CrossRef] [PubMed]
- Bin, B.H.; Bhin, J.; Yang, S.H.; Shin, M.; Nam, Y.J.; Choi, D.H.; Shin, D.W.; Lee, A.Y.; Hwang, D.; Cho, E.G.; et al. Membrane-associated transporter protein (MATP) regulates melanosomal pH and influences tyrosinase activity. PLoS ONE 2015, 10, e0129273. [Google Scholar] [CrossRef]
- Bian, C.; Li, R.; Wen, Z.; Ge, W.; Shi, Q. Phylogenetic analysis of core melanin synthesis genes provides novel insights into the molecular basis of albinism in fish. Front. Genet. 2021, 12, 707228. [Google Scholar] [CrossRef]
- Cheli, Y.; Ohanna, M.; Ballotti, R.; Bertolotto, C. Fifteen-year quest for microphthalmia-associated transcription factor target genes. Pigment Cell Melanoma Res. 2010, 23, 27–40. [Google Scholar] [CrossRef] [PubMed]
- Baranowska Körberg, I.; Sundström, E.; Meadows, J.R.; Rosengren Pielberg, G.; Gustafson, U.; Hedhammar, Å.; Karlsson, E.K.; Seddon, J.; Söderberg, A.; Vilà, C.; et al. A simple repeat polymorphism in the MITF-M promoter is a key regulator of white spotting in dogs. PLoS ONE 2014, 9, e104363. [Google Scholar] [CrossRef] [PubMed]
- Lister, J.A.; Robertson, C.P.; Lepage, T.; Johnson, S.L.; Raible, D.W. nacre encodes a zebrafish microphthalmia-related protein that regulates neural-crest-derived pigment cell fate. Development 1999, 126, 3757–3767. [Google Scholar] [CrossRef]
- Lister, J.A. Larval but not adult xanthophore pigmentation in zebrafish requires GTP cyclohydrolase 2 (gch2) function. Pigment Cell Melanoma Res. 2019, 32, 724–727. [Google Scholar] [CrossRef]
- Hellström, A.R.; Watt, B.; Fard, S.S.; Tenza, D.; Mannström, P.; Narfström, K.; Ekesten, B.; Ito, S.; Wakamatsu, K.; Larsson, J.; et al. Inactivation of Pmel alters melanosome shape but has only a subtle effect on visible pigmentation. PLoS Genet. 2011, 7, e1002285. [Google Scholar] [CrossRef]
- Ishishita, S.; Takahashi, M.; Yamaguchi, K.; Kinoshita, K.; Nakano, M.; Nunome, M.; Kitahara, S.; Tatsumoto, S.; Go, Y.; Shigenobu, S.; et al. Nonsense mutation in PMEL is associated with yellowish plumage colour phenotype in Japanese quail. Sci. Rep. 2018, 8, 16732. [Google Scholar] [CrossRef]
- Kwon, B.S.; Kim, K.K.; Halaban, R.; Pickard, R.T. Characterization of mouse PMEL 17 gene and silver locus. Pigment Cell Res. 1994, 7, 394–397. [Google Scholar] [CrossRef]
- Kerje, S.; Sharma, P.; Gunnarsson, U.; Kim, H.; Bagchi, S.; Fredriksson, R.; Schütz, K.; Jensen, P.; von Heijne, G.; Okimoto, R.; et al. The dominant white, dun and smoky color variants in chicken are associated with insertion/deletion polymorphisms in the PMEL17 gene. Genetics 2004, 168, 1507–1518. [Google Scholar] [CrossRef]
- Yuan, X.; Meng, D.; Cao, P.; Sun, L.; Pang, Y.; Li, Y.; Wang, X.; Luo, Z.; Zhang, L.; Liu, G. Identification of pathogenic genes and transcription factors in vitiligo. Dermatol. Ther. 2019, 32, e13025. [Google Scholar] [CrossRef]
- Lei, Z.; Yu, S.; Ding, Y.; Liang, J.; Halifu, Y.; Xiang, F.; Zhang, D.; Wang, H.; Hu, W.; Li, T.; et al. Identification of key genes and pathways involved in vitiligo development based on integrated analysis. Medicine 2020, 99, e21297. [Google Scholar] [CrossRef]
- Dooley, C.M.; Schwarz, H.; Mueller, K.P.; Mongera, A.; Konantz, M.; Neuhauss, S.C.; Nüsslein-Volhard, C.; Geisler, R. Slc45a2 and V-ATPase are regulators of melanosomal pH homeostasis in zebrafish, providing a mechanism for human pigment evolution and disease. Pigment Cell Melanoma Res. 2013, 26, 205–217. [Google Scholar] [CrossRef] [PubMed]
- Otsuki, Y.; Okuda, Y.; Naruse, K.; Saya, H. Identification of kit-ligand a as the gene responsible for the medaka pigment cell mutant few melanophore. G3 2020, 10, 311–319. [Google Scholar] [CrossRef] [PubMed]
- Svensson, P.; Wong, B. Carotenoid-based signals in behavioural ecology: A review. Behaviour 2011, 148, 131–189. [Google Scholar] [CrossRef]
- Milani, A.; Basirnejad, M.; Shahbazi, S.; Bolhassani, A. Carotenoids: Biochemistry, pharmacology and treatment. Br. J. Pharmacol. 2017, 174, 1290–1324. [Google Scholar] [CrossRef] [PubMed]
- Akolkar, D.B.; Asaduzzaman, M.; Kinoshita, S.; Asakawa, S.; Watabe, S. Characterization of Pax3 and Pax7 genes and their expression patterns during different development and growth stages of Japanese pufferfish Takifugu rubripes. Gene 2016, 575, 21–28. [Google Scholar] [CrossRef] [PubMed]
- Nagao, Y.; Takada, H.; Miyadai, M.; Adachi, T.; Seki, R.; Kamei, Y.; Hara, I.; Taniguchi, Y.; Naruse, K.; Hibi, M.; et al. Distinct interactions of Sox5 and Sox10 in fate specification of pigment cells in medaka and zebrafish. PLoS Genet. 2018, 14, e1007260. [Google Scholar] [CrossRef] [PubMed]
Disclaimer/Publisher’s Note: The statements, opinions and data contained in all publications are solely those of the individual author(s) and contributor(s) and not of MDPI and/or the editor(s). MDPI and/or the editor(s) disclaim responsibility for any injury to people or property resulting from any ideas, methods, instructions or products referred to in the content. |
© 2025 by the authors. Licensee MDPI, Basel, Switzerland. This article is an open access article distributed under the terms and conditions of the Creative Commons Attribution (CC BY) license (https://creativecommons.org/licenses/by/4.0/).