Abstract
Different lighting conditions can result in accidents of different levels of severity. However, current studies lack the consideration of the heterogeneity and temporal stability of accident data under various lighting conditions. Therefore, three years’ worth of data were used to investigate the critical factors of accident severity. The random parameters logit model was employed to investigate the influence of different lighting conditions on temporal stability and heterogeneity. The critical factors affecting injury severity were also identified. The temporal stability and transferability of the models were investigated by a series of likelihood ratio tests. Based on different lighting conditions (daylight conditions, and night-time conditions with street lighting on), six models were established. Three kinds of accident injury severity levels were classified: property damage only (PDO), severe injury (SI), and fatal injury (FI). The estimation results showed contributing factors of accident severity were significantly different between the two kinds of lighting conditions. Additionally, accidents showed temporal instability. The proposed method can provide a guide for infrastructure construction, operation, and maintenance in traffic-safety management.
1. Introduction
With the development of the global economy, the demand for vehicles in use keeps increasing. However, it also raises more safety issues. The Global Status report on road safety launched by the World Health Organization in 2018 pointed out that traffic accidents were the eighth largest cause of death. It also indicated that accident was the primary cause of death for people aged 5–29 [1]. According to the China Statistical Yearbook published by the National Bureau of Statistics of China in 2020, there were 247,646 traffic accidents in China in 2019, of which 256,101 people were injured and 62,763 people were killed. The direct property loss was over ¥1,346,179,000. Traffic accidents always lead to severe social concerns and huge economic loss [2]. Therefore, it is necessary to evaluate the factors affecting the severity of accidents and explore effective ways to reduce accident rates and property losses.
In recent years, many scholars have investigated factors influencing accident severity among traffic environment, drivers, and passengers. According to the principle of accident “Dominoes” proposed by Heinrich, traffic accidents are aroused from many aspects. The concept of the Dominoes can be migrated to accidents concerning the factors involved; the chain reaction starts from changes in the environment→physiological and psychological changes of drivers→changes in driving behavior→the occurrence of traffic accidents. Therefore, environmental factors should not be ignored since lighting conditions of environmental factors directly impact the drivers’ access to road information. Related research has found that the ratio of traffic information obtained by drivers through vision is about 2:1 [3], comparing the day and night-time conditions. Swedish researchers found that the number of collisions between vehicles and pedestrians at night was about 8.9 times more than in daylight conditions. Collisions between vehicles and bicycles happened 2.5 times more than in the daytime. The number of collisions between vehicles and other objects was about 1.9 times higher than in the daytime [4]. Accident data from the United States in 2014 also showed that fatal accidents at night accounted for about 50 percent of total fatal accidents, even though the number of vehicles during daytime is significantly higher than at night [5]. In addition, a report from International Commission on illumination indicated that accidents at night were about three times as frequent than during the day under insufficient environmental lighting conditions [6]. Since the probability of accidents is much higher at night without lighting conditions than in the daytime, and the severity of traffic accidents at night without lighting conditions is also heavier than in the daytime, it is necessary to explore the influence of lighting conditions on the severity of traffic accidents.
Many researchers conducted have related studies. Anarkooli and Hosseinlou [7] used three-year accident data of two-lane rural roads in Washington. They applied the ordered logit model to investigate factors affecting the severity of accidents under three different lighting conditions. The results showed that the different influences of lighting conditions on accident injury severity could not be clearly explained by one model. Uddin and Huynh [8] applied a random parameter logit model to study factors affecting the accident severity of trucks under five different lighting conditions on urban and rural roads, based on four-year data in Ohio State. The results showed that the influences of different lighting conditions and road types on accident injury severity presented significant differences. Islam and Burton [9] also used a random parameter logit model to study factors affecting the severity of accidents under both daylight conditions and night-time conditions with street lighting, using the accident data of rural intersections in Alabama. The results showed that the factors of daylight conditions and night-time conditions with street lighting on were not completely consistent. Zhang and Yao [10] analyzed the accident data of a certain road in the UK. They found that the accident rate at night with street lighting on was about twice as high as the condition with the street lighting off.
Since accident injury severity is a discrete variable, the discrete choice model in statistical economics is widely used in the factor analysis of accident severity [11], including the ordered logit model [12], the multinomial logit model [13], the nested logit model [14], and the random parameter logit model [15,16,17,18,19]. Due to the random parameter logit model on unobserved heterogeneity generally yielding good results, it has become a prevalent method for accident data analysis.
Many studies have been devoted to analyzing the influence of different lighting conditions on accident severity. However, these studies ignored the latent impact of temporal heterogeneity [20]. Accidents that happened at a different time may not fit well in the model. Therefore, this paper used the random parameter Logit model to study the temporal stability and the unobserved heterogeneity of accident data under different lighting conditions.
2. Overview of Research Data
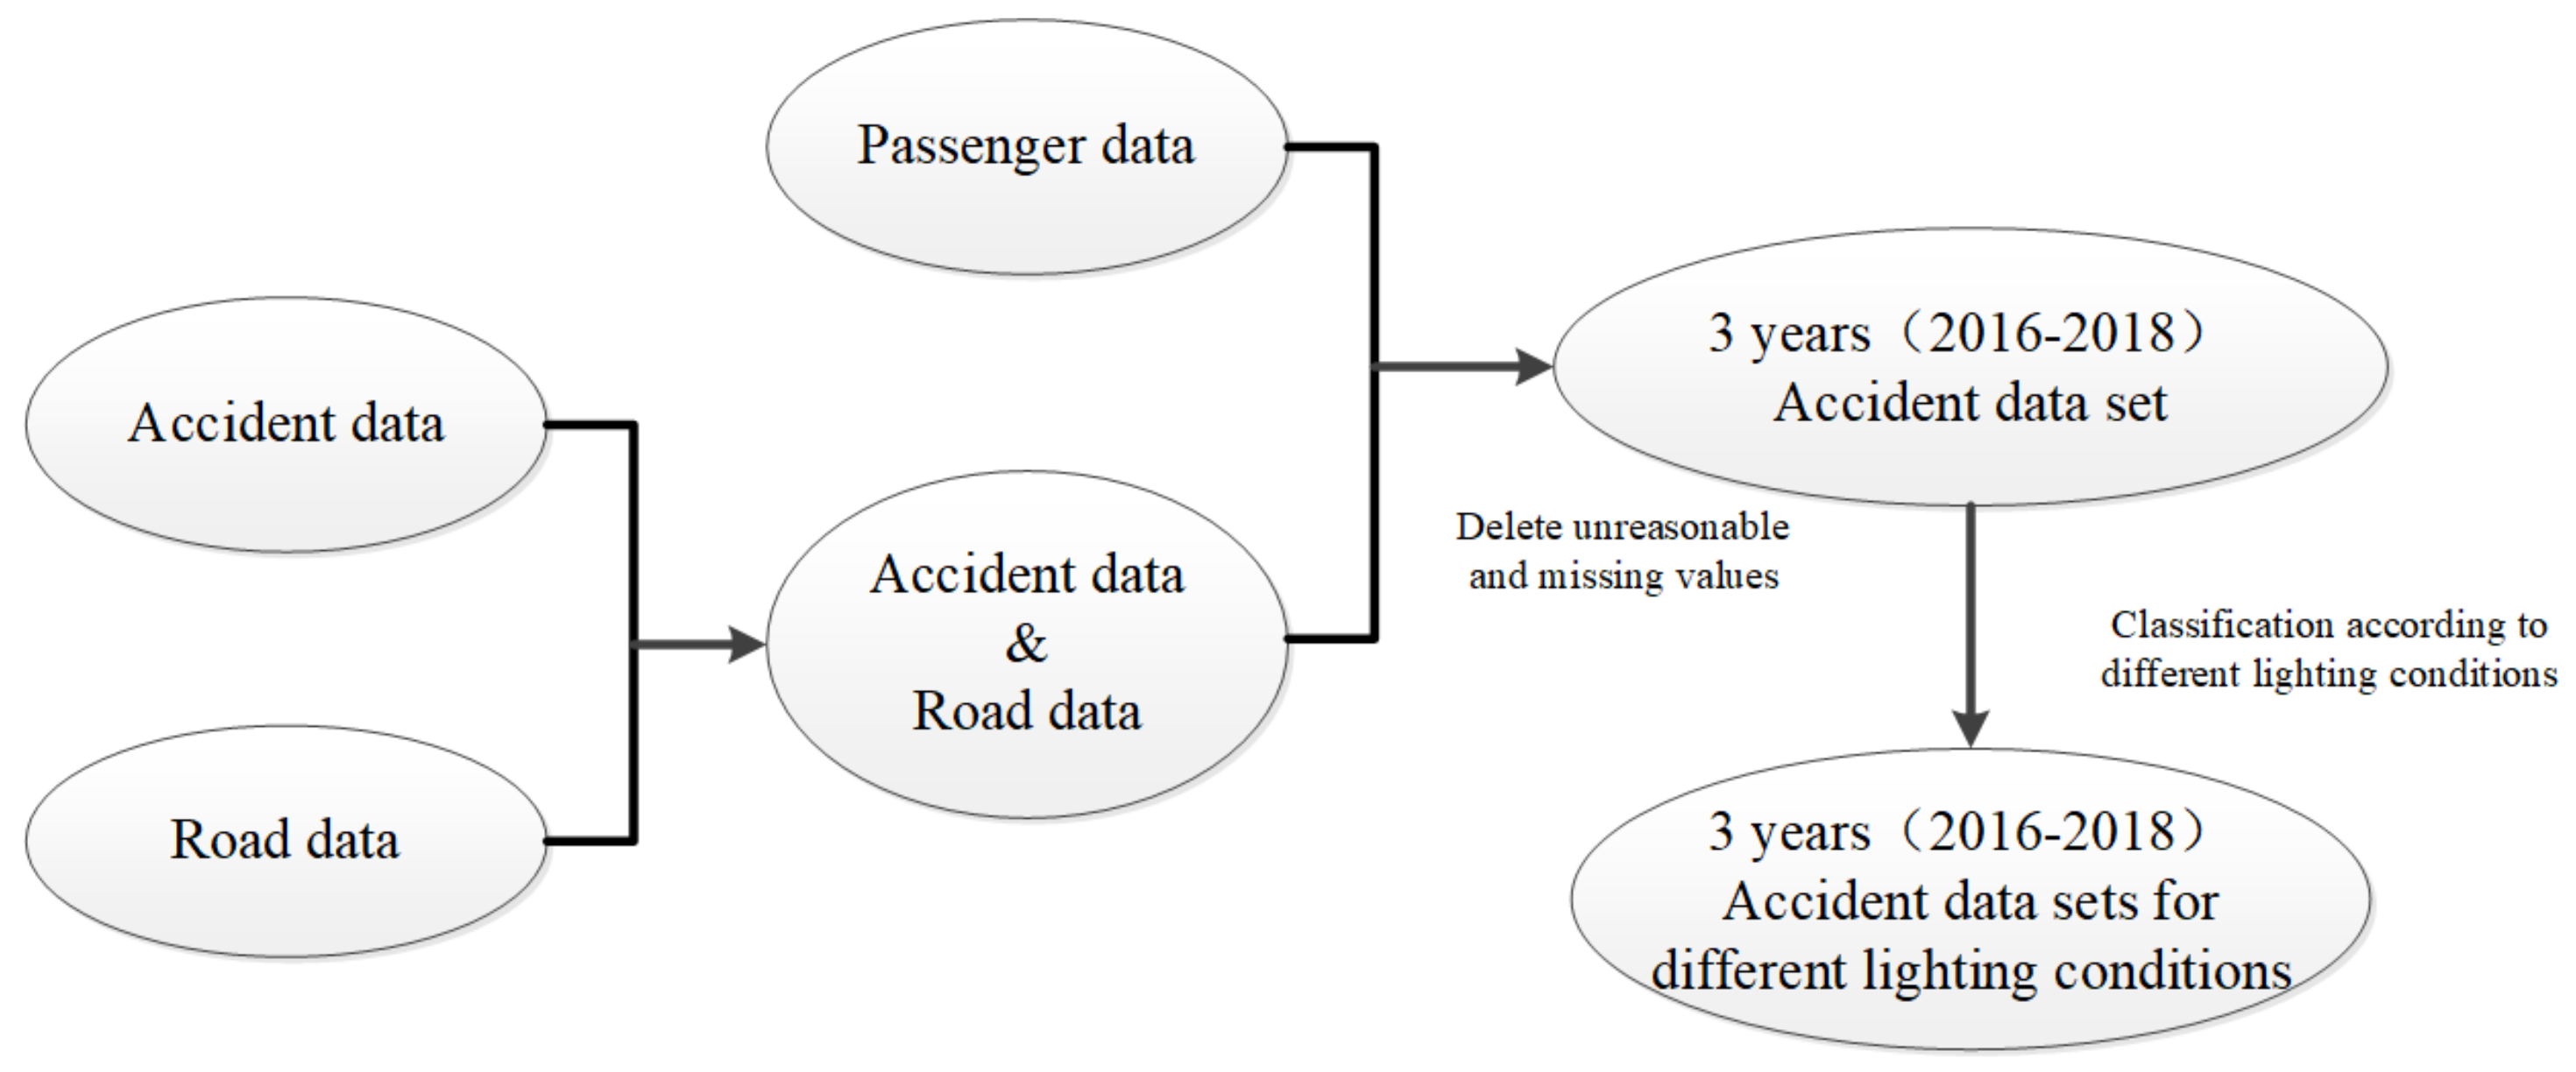
This study selected accident data from 2016 to 2018 with 44,386 cases (already excluded unreasonable and missing values). Each piece of accident data contains four characteristics: driver, road, passenger, and environment. The severity of accidents was divided into seven categories in the original data set: Ⅰ. no injury (NI); Ⅱ. possible injury (POI); Ⅲ. nondisabling injury (NDI); Ⅳ. disabling injury (DI); Ⅴ. dead at the hospital (DAH); Ⅵ. dead on arrival (DOA); and Ⅶ. dead at the scene (DAS). Considering the low proportion of several accident types, the original seven types were merged into three types: property damage only (PDO), severe injury (SI), and fatal injury (FI); their percentage ratios were 72.11%, 27.72 %, and 0.17 %, respectively. The dataset used in this paper was derived from the highway safety information system (HSIS) of the United States. The dataset was divided into four types: accident data, road data, vehicle data, and passenger data. These four parts needed to be merged before data analysis. The data merging process is shown in Figure 1.
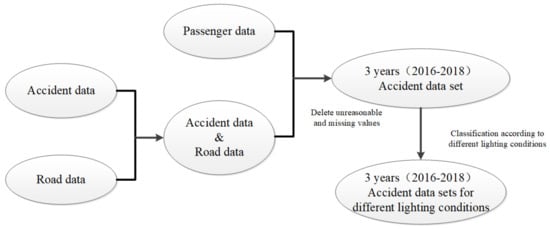
Figure 1.
The flow chart of the data processing.
The purpose of this paper is to analyze the influence of lighting conditions on the latent heterogeneity and the temporal stability of accident severity. Daylight conditions and night-time conditions with street lighting were selected as two different lighting conditions for comparison. The statistical characteristics of data under different lighting conditions for 3 years are described in Appendix A (daylight) and Appendix B (night with street lighting on) [21].
3. Research Method
To explore the latent heterogeneity and temporal instability of accident injury severity, this paper adopted the random parameter logit model considering the heterogeneity of random parameter in means and variances. The corresponding utility function of the model presenting accident severity is expressed in Equation (1):
where Vki denotes the utility function of accident i with severity at k; k could be 1, 2, 3 denoting PDO, SI, and FI, respectively; Xki is the set of factors impacting accident severity, which are variables expressed in Appendix A; βk represents the parameter vector corresponding to the factors when accident severity is k; and εki means error. Considering the unobserved heterogeneity of various factors impacting accident severity, randomness should be distributed to the estimated parameter βk. The distribution process involves applying βk to a multivariate normal distribution with a probability density function of ; here, is the parameter vector, and εki obeys the extreme value distribution of type 1. In this way, the function of calculating accident severity can be expressed as Equation (2) [22]:
where Pi(k) represents the probability of accident i with severity at k. Considering the heterogeneity of random parameters in means and variances on the basis of Formula (2), the relevant calculation formula is shown in Equation (3) [23]:
where is the mean of the estimated parameter; is the factor of accident severity using the means of parameters to reflect heterogeneity; is the corresponding estimated parameter of factors; is the factor of accident severity using the variance of parameters to reflect heterogeneity; is the corresponding estimated parameter of factor; is the standard deviation of the estimated parameter; and is the error.
Previous studies indicated that the estimation model showed great fitting results when random parameters followed a normal distribution. In this paper, the Halton simulation method was used for parameter estimation, and the corresponding size of the Halton draws was 1500 [24,25].
4. Likelihood Ratio Test
Extensive studies demonstrated that the factors of accident injury severity showed temporal instability [20]. To find out whether the analyzed data share the same property, two groups of likelihood ratio tests were conducted [16,26,27,28]. The test for the first group was to verify whether the model estimated by any two-year data has temporal instability under certain lighting conditions. The calculation process is expressed in Equation (4) [16,28]:
where is the likelihood value of the logarithmic function when the estimated parameter of the model converges (based on data of year y1); also represents the likelihood value of the logarithmic function when the estimated parameter of the model converges. The likelihood value can be obtained by applying parameters estimated by y2 year data to the model of y1 year. The relevant calculation results were shown in Table 1 and Table 2.

Table 1.
The likelihood ratio test results of different years (daylight).
The calculation results of 2016 and 2017 in Table 1 were used as an example to further explain the results of the likelihood ratio test. Parameters estimated by data of year 2016 were used in the estimation model for year 2017. From Equation (4), the value of was 136.94 when the parameter with a degree of freedom was 17; the null hypothesis indicates that models estimated by data of 2016 and 2017 were the same and could be rejected under the condition of confidence level reaching 99.99%. Additionally, the parameters estimated from the data of 2017 were used in the parameter estimation of the data of 2016. could be calculated as 106.54 when the degree of freedom was 18, which also verified the null hypothesis that was rejected under the 99.99% confidence level.
To verify whether there is temporal instability between models built based on data of 1 and 3 years, we conducted a second set of likelihood-ratio tests; the relevant calculation is shown in Equation (5) [28]:
where is the log-likelihood value at the convergence of the model corresponding to all year data, and represents the log-likelihood value at the convergence of the model corresponding to data for any given year. The values of two different lighting conditions were 114.40 (with a degree of freedom 21) and 74.36 (with a degree of freedom 31). The test results showed that under different lighting conditions, the null hypothesis that the accident severity model, based on one-year data and three-year data, respectively, showed that temporal stability was rejected when the confidence level was higher than 99.99%.
Except for exploring the temporal instability of accident severity under two lighting conditions, we also conducted a likelihood ratio test on the transferability of the accident severity model under different lighting conditions. The definition was shown in Equation (6) [29].
where , , and means the log-likelihood values at the convergence of the model parameters. The above model was built, and parameters were estimated based on data for any given year under two different lighting conditions. The values of the in three years (2016, 2017, and 2018) were 67.80, 46.68, and 75.74, respectively; the corresponding degrees of freedom were 17, 18, and 19, respectively. The test results showed that under conditions of confidence level higher than 99.99%, the null hypothesis that the model of daylight and the model of the night with street lighting on were the same could be rejected.
5. Results Analysis and Discussion
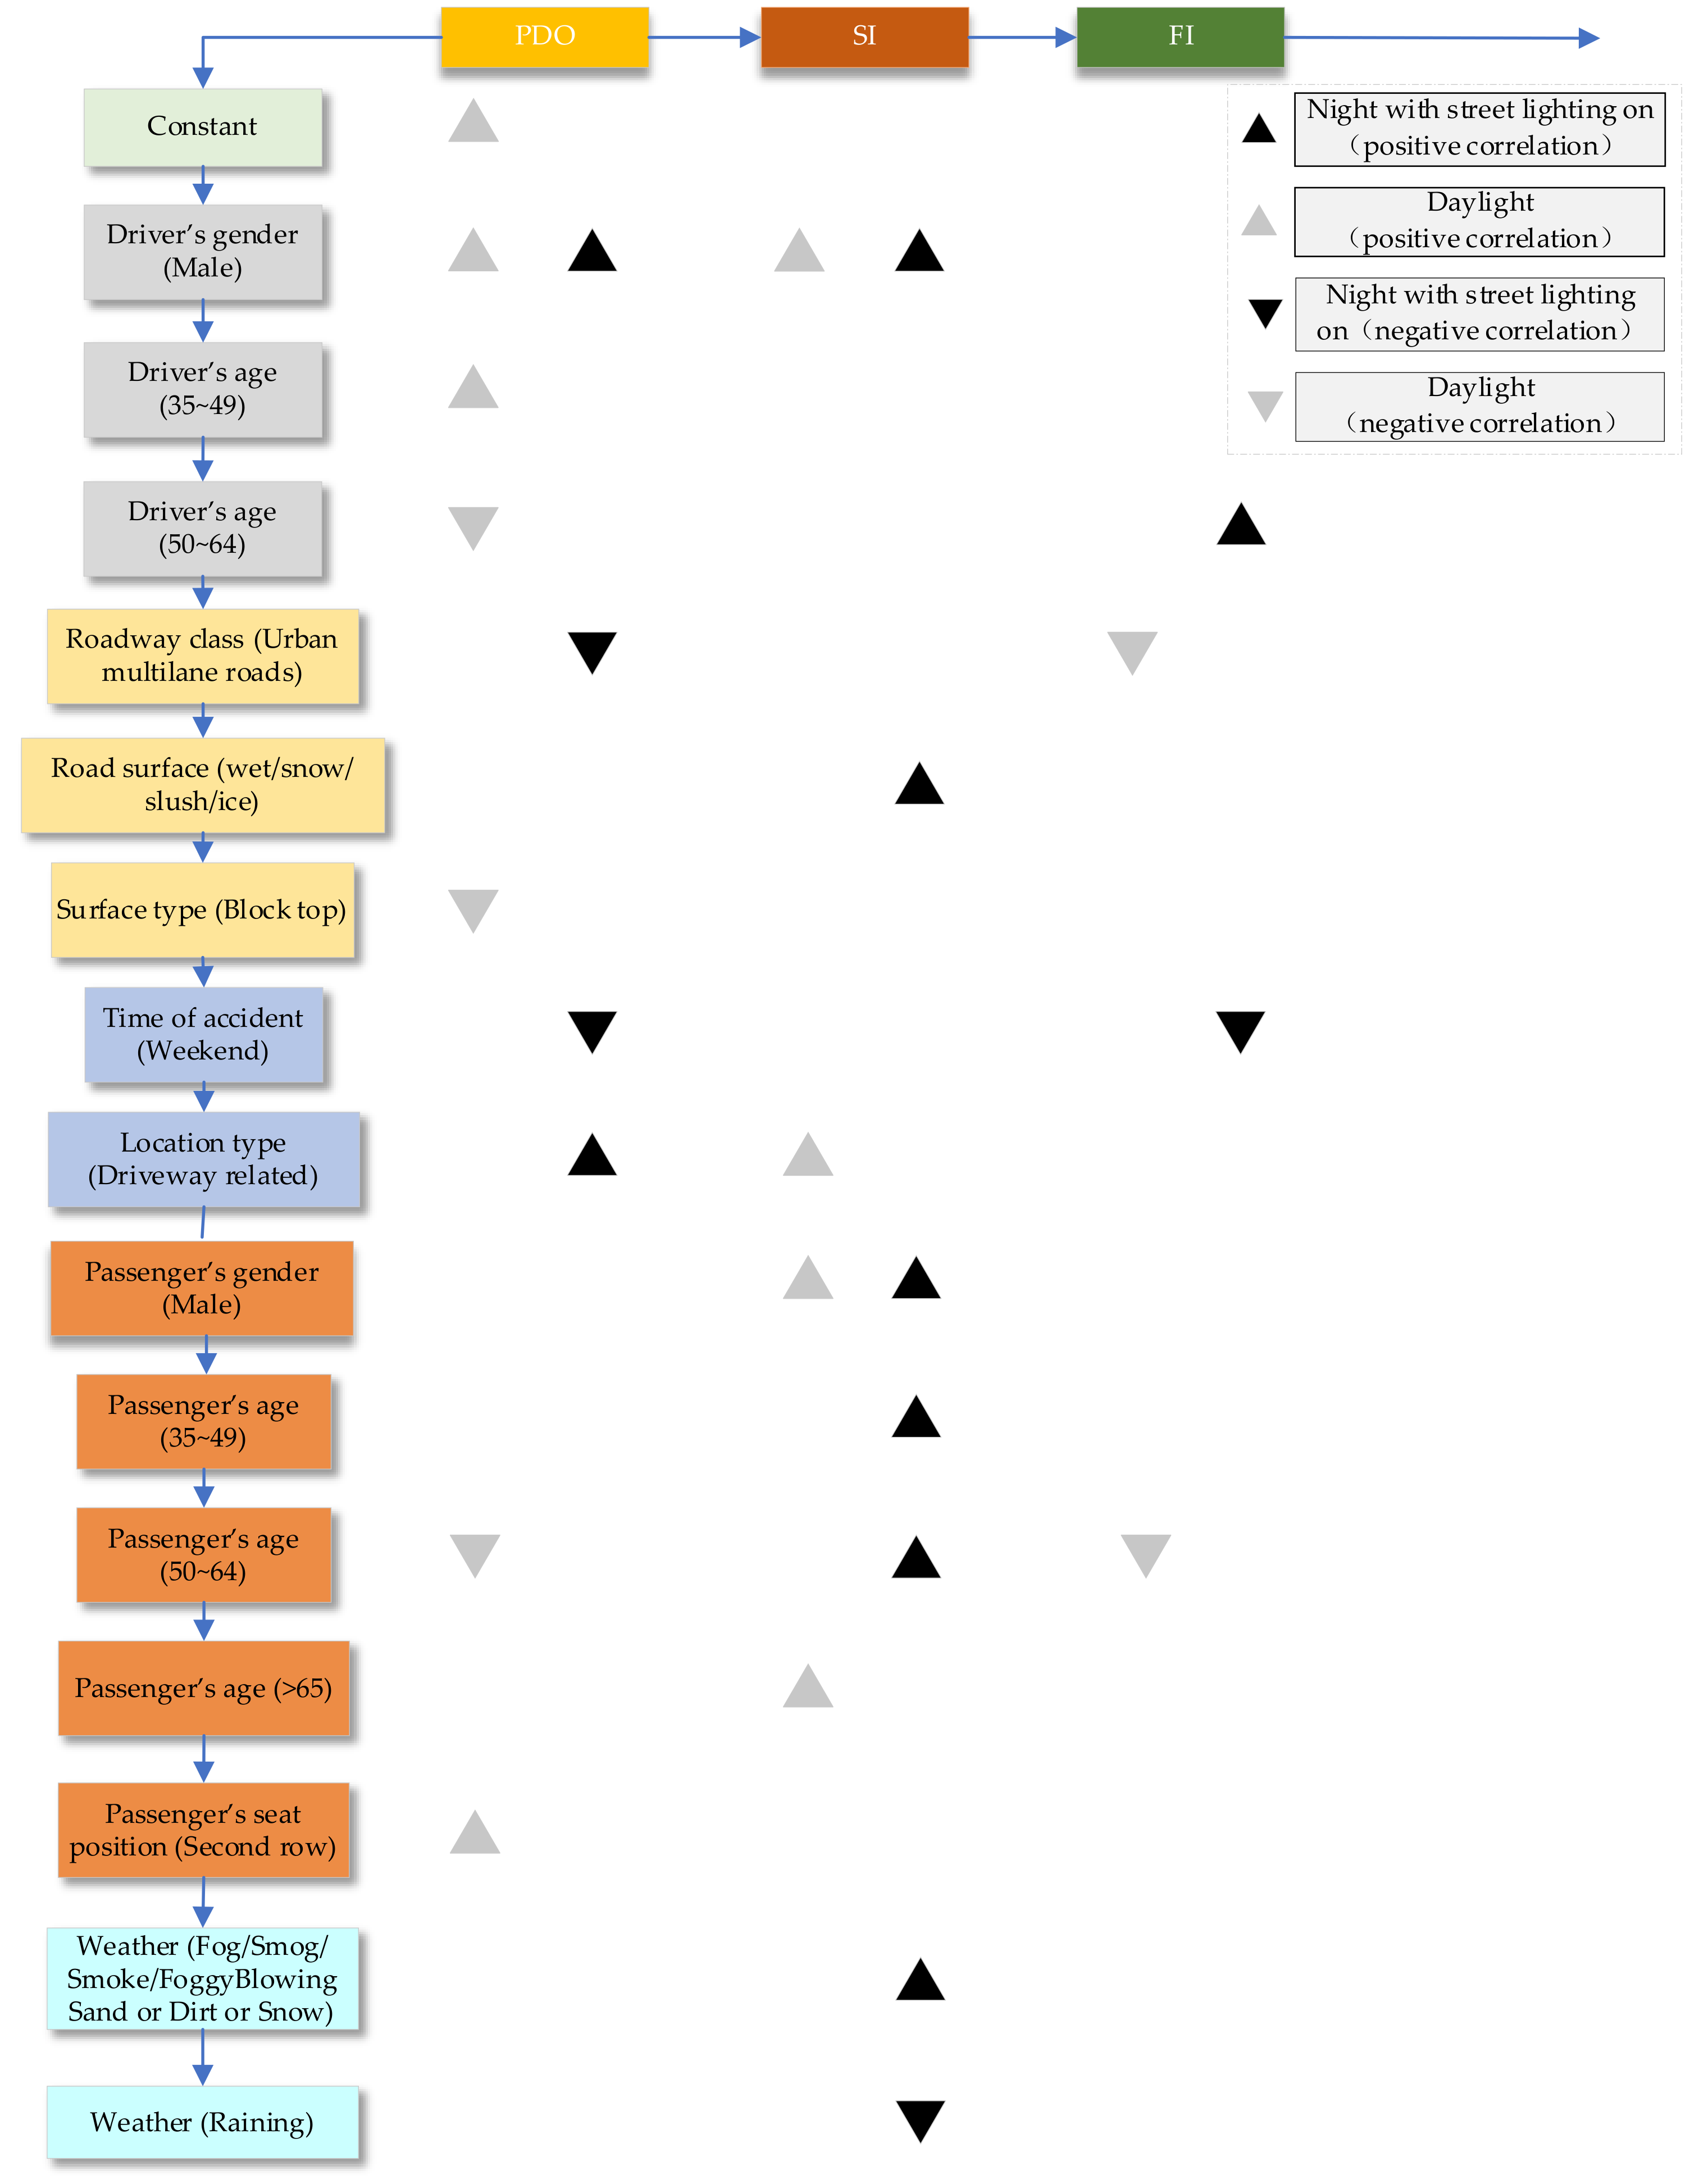
Table 2 is the result of parameter estimation based on the random parameter logit model considering the heterogeneity of random parameters in means and variance. For example, the parameter estimation results of 2018 to express the trend of significant factors are shown in Figure 2. From Table 2, three types of factors were determined as random parameters, including passenger’s gender (male), passenger’s age (50~64), passenger’s protection measures (lap/shoulder/child restrained) in 2016; passenger’s age (35~49), passenger’s seat position (second row), and passenger’s protection measures (lap/shoulder/child restrained) in 2017; and passenger’s gender (male), passenger’s protection measures (lap/shoulder/child restrained), and road surface (wet\snow\slush\ice) in 2018.

Figure 2.
The trend impacted by significant factors of accidents in 2018.
Table 2.
The likelihood ratio test results of different years (in night-time conditions with street lighting present).
Table 2.
The likelihood ratio test results of different years (in night-time conditions with street lighting present).
| 2016 | 2017 | 2018 | |
|---|---|---|---|
| 2016 | 106.26 (16) (>99.99%) | 76.32 (17) (>99.99%) | |
| 2017 | 76.74 (14) (>99.99%) | 46.46 (17) (>99.99%) | |
| 2018 | 132.4 (14) (>99.99%) | 120.82 (16) (>99.99%) |
As shown in Table 3, in terms of driver characters, six different models showed that the probability of PDO accidents could significantly be increased when the driver was male; this is reasonable because male drivers were more prone to doing radical driving behaviors, which are likely to result in accidents. Factors of the female drivers also showed better temporal stability under different lighting conditions. Compared with drivers aged between 18 and 24, the drivers aged between 25 and 34 in the model of 2016, 2017, and 2018 showed an increase in the probability of PDO and SI accidents. What is more, drivers aged between 50 and 64 showed temporal instability.
Table 3.
The estimation results of the random parameters models in 2016, 2017, and 2018.
As for road characteristics, rural freeways significantly reduced the possibility of PDO accidents and SI accidents in the year 2016. Parameter estimation results in 2018 showed that urban multiline roads significantly reduced the probability of FI accidents under the condition of the night with street lighting on in the year 2018. This may be due to the rural road condition being worse than the urban road, which required a longer braking distance when vehicles decelerated from high speed. However, when the traffic flow was heavy, drivers could be more nervous to prevent collisions with other vehicles. What’s more, a reasonable explanation for this phenomenon was the drivers always kept alert when passing curved roads, they used a relatively low speed, in this way more serious accidents could be avoided. While the situation became more complicated when driving at night, the driver’s view was easy to be obscured to cause accidents. The combined effect of the above factors greatly increased the probability of FI accidents. Compared with dry road surfaces, the wet or frozen road surface may increase the probability of Accidents. The likelihood of SI accidents significantly decreased in the year 2018 due to road surface(wet/snow/slush/ice). The before and after comparison of estimation results validated the temporal instability of road surface. Besides that, the estimation results of 2016 showed that the curved roads could significantly increase the probability of PDO accidents.
Cloudy, rainy, snowy, windy, and foggy weather would increase the probability of PDO accidents and SI accidents compared with sunny weather under different lighting conditions, which demonstrated the temporal instability of parameters. The estimation results in 2016 and 2017 showed that when the accidents occurred on weekends, it could be more severe than on a weekday. The difference between the performance of location types also demonstrated temporal instability among three years.
In terms of passenger characteristics, female passengers were more likely to encounter PDO accidents and FI accidents (in 2016 and 2017). Passengers with age between 50 and 64 may increase the probability of causing SI and PDO accidents, the reason was that older passengers tend to have inactive reactions and were more likely to suffer severe injuries. The probability of PDO and FI accidents in daylight conditions in the year 2016 significantly decreased (passengers with age between and 35 and 49), while in years 2017 and 2018, the probability of SI accidents was significantly increased in night-time conditions with street lighting on (passengers with age between 35 and 49). The reason for this phenomenon was drivers were more cautious to avoid accidents when having aged people on board in the night. Temporal instability of factors impacting accident injury severity was also proved by the estimation results.
In terms of random parameters’ means and heterogeneity, passenger’s gender (male) (PDO), passenger’s age (50~64) (SI), passenger’s age (35~49) (PDO), passenger’s protection measures (lap/shoulder/child restrained) (PDO), passenger’s seat position (second(second row) (PDO), and road surface (wet/snow/slush/ice) (PDO) were identified as random parameters in this paper. In all the significant variables, the means of the random parameter decreased with a lower probability of serious accidents regarding road characteristics (curve and passenger’s age (>65); regarding passenger’s age (50~64) and driver’s gender (male), the means value of random parameters was increased with a higher possibility of severe accidents. As for heterogeneity in variance of random parameters, roadway class (urban multilane roads), passenger’s age (>65), and roadway class (rural freeways) were identified as significant factors impacting the probability of accidents. Under daylight conditions, the passenger’s position (third row), the driver’s gender (female), and the passenger’s age (25~60) increased the variance of the random parameters.
The corresponding marginal effects among different years was shown in Table 4, Table 5, Table 6, Table 7, Table 8 and Table 9.
Table 4.
The marginal effects of 2016 in daylight conditions.
Table 5.
The marginal effects of 2016 in daylight conditions with street lighting on.
Table 6.
The marginal effects of 2017 in daylight conditions.
Table 7.
The marginal effects of 2017 in daylight conditions with street lighting on.
Table 8.
The marginal effects of 2018 in daylight conditions.
Table 9.
The marginal effects of 2018 in daylight conditions with street lighting on.
6. Conclusions
This paper used three-year accident data to analyze the impact of different lighting conditions and temporal stability on severity by using a random parameter logit model considering heterogeneity in the means and variances. The estimation results of the total six models showed that: (1) the three variables of the driver’s gender (male), the roadway class (urban multilane roads), and the passenger’s age (50~64) could increase the probability of accidents no matter what the lighting conditions. (2) The passenger’s gender (male), the passenger’s age (35~49), the passenger’s age (50~64), the passenger’s protection measures (lap/shoulder/child restrained), the passenger’s seat position (second(second row), and the road surface (wet\snow/slush/ice) were all determined as random parameters in this paper, and the estimation results of these parameters clarified the common heterogeneity of the accident data; (3) the driver’s age (50~64), the roadway class (urban multilane roads), the road surface (other), and other factors performed discriminatingly in different years, verifying the possession of the temporal instability of these factors.
The test results of this paper can provide a guide for taking measures to improve traffic safety, for example, setting warning signs on roads with latent dangers, such as a rural freeway; alerting past vehicles of poor road conditions; getting drivers to remind aged passengers of wearing safety belts; and in conditions with poor weather and road surfaces, adopting dynamic information panels to alert vehicles to slow to increase driving safety. Given that the major of automated vehicles (AVs) employ cameras as primary object-detection devices, the lighting conditions could have a huge impact on the performance of object detection. Poor lighting conditions decrease the precision and scope of AVs’ perception, contributing to the danger of road traffic.
There are still some deficiencies in this paper: (1) this paper only considered temporal instability without considering the spatial instability; (2) the impact of lighting conditions on accident injury severity was analyzed in this paper, and the influence provided by the combination of lighting and other factors was ignored; (3) the estimation results of accident data from the United States could not provide very accurate references for the traffic situation in China; and (4) not enough datasets were employed for the establishment of random parameters due to temporal instability; this may have jeopardized the estimation results. All these deficiencies will be addressed in the next paper.
Author Contributions
Conceptualization, F.H.; methodology, C.L. and R.P.; software, C.L. and R.P.; validation, F.H. and H.G.; writing—original draft preparation, F.H. and C.L.; writing—review and editing, Q.L., R.Y. and X.G.; supervision, X.G.; project administration, R.C.; and funding acquisition, H.G. All authors have read and agreed to the published version of the manuscript.
Funding
This research was funded by the Key Research and Development Program of Shandong Province, grant number 2020CXGC010118; in part by the National Natural Science Foundation of China, grant number 52002224; in part by the Natural Science Foundation of Jiangsu Province, grant number BK20200226; in part by the Program of Science and Technology of Suzhou, grant number SYG202033; in part by the Research Program of Department of Transportation of Shandong Province, grant number 2020BZ01-03; and in part by the Natural Science Foundation of Guangdong Province in China, grant number 2021A1515011587.
Institutional Review Board Statement
Not applicable.
Informed Consent Statement
Not applicable.
Data Availability Statement
The data that support the findings of this study are available from the corresponding author, upon reasonable request.
Acknowledgments
We would like to thank the Federal Highway Administration (FHWA) for providing accident datasets.
Conflicts of Interest
The authors declare no conflict of interest. The funders had no role in the design of the study; in the collection, analyses, or interpretation of data; in the writing of the manuscript; or in the decision to publish the results.
Appendix A
| Variable | 2016 | 2017 | 2018 | |||||||
| Variable | Variable Name | PDO | SI | FI | PDO | SI | FI | PDO | SI | FI |
| The driver’s gender | Male * | 4407 (39.3) | 1756 (15.66) | 6 (0.05) | 4580 (42.57) | 1601 (14.88) | 10 (0.09) | 4437 (42.73) | 1431 (13.78) | 5 (0.05) |
| Female | 3581 (31.93) | 1459 (13.01) | 5 (0.04) | 3190 (29.65) | 1373 (12.76) | 6 (0.06) | 3210 (30.91) | 1296 (12.48) | 6 (0.06) | |
| The driver’s age | 18~34 | 3681 (30.35) | 1943 (16.02) | 4 (0.03) | 3924 (33.07) | 1652 (13.92) | 9 (0.07) | 3726 (31.81) | 2065 (17.63) | 5 (0.04) |
| 35~49 | 2359 (19.45) | 1320 (10.88) | 2 (0.016) | 2163 (18.23) | 1604 (13.52) | 4 (0.03) | 2219 (18.94) | 1157 (9.88) | 3 (0.025) | |
| 50~64 | 1597 (13.16) | 785 (6.47) | 3 (0.02) | 1287 (10.85) | 694 (5.85) | 2 (0.02) | 1384 (11.82) | 713 (6.08) | 2 (0.017) | |
| >65 | 326 (2.68) | 106 (0.87) | 2 (0.016) | 389 (3.28) | 135 (1.14) | 1 (0.008) | 302 (2.58) | 136 (1.16) | 1 (0.008) | |
| The driver’s protection measures | Not restrained | 34 (0.3) | 30 (0.27) | 1 (0.01) | 17 (0.16) | 17 (0.16) | 3 (0.03) | 20 (0.19) | 17 (0.16) | 1 (0.01) |
| Lap/shoulder/child restrained | 7954 (70.93) | 3185 (28.4) | 10 (0.09) | 7753 (72.05) | 2957 (27.48) | 13 (0.12) | 7627 (73.44) | 2710 (26.1) | 10 (0.1) | |
| The roadway class | Urban freeways * | 3657 (32.61) | 1349 (12.03) | 3 (0.03) | 3827 (35.57) | 1386 (12.88) | 5 (0.05) | 3861 (37.18) | 1188 (11.44) | 5 (0.05) |
| Urban multilane roads | 2940 (26.22) | 1258 (11.22) | 2 (0.02) | 2648 (24.61) | 1045 (9.71) | 2 (0.02) | 2454 (37.18) | 1051 (10.12) | 1 (0.01) | |
| Rural freeways | 643 (5.73) | 229 (2.04) | 3 (0.03) | 643 (5.98) | 222 (2.06) | 4 (0.04) | 619 (5.96) | 181 (1.74) | 5 (0.05) | |
| Rural multilane road | 748 (6.67) | 379 (3.38) | 3 (0.03) | 652 (6.06) | 321 (2.98) | 5 (0.05) | 713 (6.87) | 307 (2.96) | 0 (0) | |
| The road characteristics | Straight * | 7281 (64.93) | 2865 (25.55) | 6 (0.05) | 7061 (65.62) | 2712 (25.2) | 10 (0.09) | 6960 (67.02) | 2437 (23.47) | 10 (0.1) |
| Curve | 707 (6.3) | 350 (3.12) | 5 (0.04) | 709 (6.59) | 262 (2.43) | 6 (0.06) | 687 (6.62) | 290 (2.79) | 1 (0.01) | |
| The function class | Rural * | 1393 (12.42) | 609 (5.43) | 6 (0.05) | 1298 (12.06) | 544 (5.06) | 9 (0.08) | 1336 (12.86) | 491 (4.73) | 5 (0.05) |
| Urban | 6595 (58.81) | 2606 (23.24) | 5 (0.04) | 6472 (60.15) | 2430 (22.58) | 7 (0.07) | 6311 (60.77) | 2236 (21.53) | 6 (0.06) | |
| The surface type | Concrete * | 1939 (17.29) | 699 (6.23) | 2 (0.02) | 5836 (54.24) | 2270 (21.1) | 8 (0.07) | 1762 (16.97) | 520 (5.01) | 4 (0.04) |
| Block top | 6044 (53.9) | 2514 (22.42) | 9 (0.08) | 1905 (17.7) | 698 (6.49) | 8 (0.07) | 5880 (56.62) | 2205 (21.23) | 7 (0.07) | |
| Brick/block/gravel/dirt | 5 (0.04) | 2 (0.02) | 0 (0) | 29 (0.27) | 6 (0.06) | 0 (0) | 5 (0.05) | 2 (0.02) | 0 (0) | |
| The time of the accident | Not weekend * | 5304 (47.3) | 2126 (18.96) | 4 (0.04) | 5018 (46.64) | 1992 (18.51) | 10 (0.09) | 4846 (46.66) | 1738 (16.74) | 7 (0.07) |
| Weekend | 2684 (23.93) | 1089 (9.71) | 7 (0.06) | 2752 (25.58) | 982 (9.13) | 6 (0.06) | 2801 (26.97) | 989 (9.52) | 4 (0.04) | |
| The location type | Intersection-related * | 2833 (25.26) | 1230 (10.97) | 2 (0.02) | 2378 (22.1) | 1011 (9.4) | 5 (0.05) | 2296 (22.11) | 1019 (9.81) | 4 (0.04) |
| Driveway-related | 565 (5.04) | 238 (2.12) | 1 (0.01) | 478 (4.44) | 199 (1.85) | 1 (0.01) | 403 (3.88) | 189 (1.82) | 0 (0) | |
| Not at intersection driveway | 4590 (40.93) | 1747 (15.58) | 8 (0.07) | 4914 (45.67) | 1764 (16.39) | 10 (0.09) | 4948 (47.65) | 1519 (14.63) | 7 (0.07) | |
| The weather | Clear/partly Cloudy/overcast * | 6714 (59.87) | 2628 (23.43) | 11 (0.1) | 6396 (59.44) | 2464 (22.9) | 8 (0.07) | 6471 (62.31) | 2355 (22.68) | 10 (0.1) |
| Raining/sleet/hail/freezing rain | 1122 (10.01) | 529 (4.72) | 0 (0) | 1119 (10.4) | 414 (3.85) | 6 (0.06) | 984 (9.48) | 320 (3.08) | 0 (0) | |
| Fog/smog/smoke/foggy/windy/sand, dirt, or snow | 131 (1.17) | 42 (0.37) | 0 (0) | 186 (1.73) | 81 (0.75) | 1 (0.01) | 109 (1.05) | 30 (0.29) | 1 (0.01) | |
| Severe crosswind | 21 (0.19) | 16 (0.14) | 0 (0) | 69 (0.65) | 15 (0.14) | 1 (0.01) | 8 3(0.8) | 22 (0.21) | 0 (0) | |
| The road surface | Dry * | 1939 (17.29) | 698 (6.23) | 2 (0.02) | 1812 (0.64) | 667 (6.2) | 1 (0.01) | 6029 (58.05) | 2166 (20.86) | 10 (0.1) |
| Wet/snow/slush/ice | 6044 (53.9) | 2514 (22.42) | 9 (0.08) | 5954 (55.33) | 2306 (21.43) | 15 (0.14) | 1595 (15.36) | 552 (5.32) | 1 (0.01) | |
| Other | 5 (0.04) | 2 (0.02) | 0 (0) | 4 (0.04) | 1 (0.01) | 0 (0) | 23 (0.22) | 9 (0.09) | 0 (0) | |
| The passenger’s age | 18~34 | 6081 (50.62) | 2490 (20.72) | 5 (0.04) | 5972 (56.11) | 2046 (19.22) | 12 (0.11) | 6027 (53.18) | 1897 (16.74) | 6 (0.05) |
| 35~49 | 1269 (10.56) | 619 (5.15) | 3 (0.02) | 1067 (10.02) | 469 (4.41) | 2 (0.018) | 1359 (11.99) | 641 (5.66) | 1 (0.009) | |
| 50~64 | 752 (6.26) | 349 (2.90) | 2 (0.016) | 691 (6.49) | 51 (0.48) | 2 (0.018) | 625 (5.51) | 368 (3.25) | 3 (0.026) | |
| >65 | 349 (2.90) | 94 (0.78) | 1 (0.008) | 308 (2.89) | 23 (0.22) | 0 (0.00) | 296 (2.61) | 107 (0.94) | 2 (0.017) | |
| The passenger’s gender | Male * | 3612 (32.21) | 1272 (11.34) | 5 (0.04) | 3525 (32.76) | 1132 (10.52) | 6 (0.06) | 3441 (33.13) | 1031 (9.93) | 2 (0.02) |
| Female | 4376 (39.02) | 1943 (17.33) | 6 (0.05) | 4245 (39.45) | 1842 (17.12) | 10 (0.09) | 4206 (40.5) | 1696 (16.33) | 9 (0.09) | |
| The passenger’s seat position | First row * | 3941 (35.14) | 1790 (15.96) | 9 (0.08) | 3661 (34.02) | 1683 (15.64) | 4 (0.04) | 3579 (34.46) | 1512 (14.56) | 5 (0.05) |
| Second row | 1244 (11.09) | 432 (3.85) | 1 (0.01) | 1206 (11.21) | 366 (3.4) | 5 (0.05) | 1182 (11.38) | 335 (3.23) | 1 (0.01) | |
| Third row | 2803 (25) | 993 (8.86) | 1 (0.01) | 2903 (26.98) | 925 (8.6) | 7 (0.07) | 2886 (27.79) | 880 (8.47) | 5 (0.05) | |
| Ejection | Not ejected * | 7981 (71.17) | 3208 (28.61) | 10 (0.09) | 7766 (72.17) | 2971 (27.61) | 12 (0.11) | 7642 (73.59) | 2725 (26.24) | 9 (0.09) |
| Ejected | 7 (0.06) | 7 (0.06) | 1 (0.01) | 4 (0.04) | 3 (0.03) | 4 (0.04) | 5 (0.05) | 2 (0.02) | 2 (0.02) | |
| The passenger’s protection measures | Not restrained * | 64 (0.57) | 58 (0.52) | 1 (0.01) | 49 (0.46) | 45 (0.42) | 4 (0.04) | 56 (0.54) | 34 (0.33) | 3 (0.03) |
| Lap/shoulder/child restrained | 7924 (70.66) | 3157 (28.15) | 10 (0.09) | 7721 (71.76) | 2929 (27.22) | 12 (0.11) | 7591 (73.1) | 2693 (25.93) | 8 (0.08) | |
* means the base parameter.
Appendix B
| Variable | 2016 | 2017 | 2018 | |||||||
| Variable Type | Variable Type | PDO | SI | FI | PDO | SI | FI | PDO | SI | FI |
| The Driver Characteristics | ||||||||||
| The driver’s gender | Male | 1865 (44.44) | 673 (16.04) | 7 (0.17) | 1795 (44.36) | 665 (16.44) | 10 (0.25) | 1711 (44.74) | 581 (15.19) | 15 (0.39) |
| Female | 1115 (26.57) | 537 (12.79) | 0 (0.00) | 1097 (27.11) | 477 (11.79) | 2 (0.05) | 1056 (27.62) | 458 (11.98) | 3 (0.08) | |
| The driver’s age | 18~34 | 1794 (42.96) | 749 (17.93) | 4 (0.09) | 1709 (42.15) | 734 (18.10) | 6 (0.15) | 1683 (42.75) | 709 (18.01) | 13 (0.33) |
| 35~49 | 983 (23.54) | 271 (6.49) | 1 (0.02) | 943 (23.26) | 326 (8.04) | 4 (0.10) | 993 (25.22) | 197 (5.00) | 5 (0.127) | |
| 50~64 | 139 (3.33) | 57 (1.36) | 1 (0.02) | 105 (2.59) | 61 (1.50) | 1 (0.02) | 91 (2.31) | 64 (1.63) | 0 (0.00) | |
| >65 | 109 (2.61) | 67 (1.60) | 1 (0.02) | 113 (2.79) | 51 (1.26) | 1 (0.02) | 109 (2.77) | 73 (1.85) | 0 (0.00) | |
| The driver’s protection measures | Not restrained * | 4 (0.13) | 16 (0.38) | 1 (0.02) | 9 (0.22) | 9 (0.22) | 3 (0.07) | 5 (0.13) | 6 (0.16) | 10 (0.26) |
| Lap/shoulder/child restrained | 2976 (70.91) | 1194 (28.45) | 6 (0.14) | 2883 (71.26) | 1133 (28.00) | 9 (0.22) | 2762 (72.23) | 1033 (27.01) | 8 (0.21) | |
| The Road Characteristics | ||||||||||
| The roadway class | Urban freeways * | 1408 (33.55) | 540 (12.87) | 2 (0.05) | 1368 (33.81) | 461 (11.39) | 1 (0.02) | 1364 (35.67) | 449 (11.74) | 8 (0.21) |
| Urban multilane roads | 1008 (24.02) | 464 (11.06) | 1 (0.02) | 949 (23.46) | 451 (11.15) | 1 (0.02) | 877 (22.93) | 398 (10.41) | 2 (0.05) | |
| Rural freeways | 281 (6.70) | 89 (2.12) | 1 (0.02) | 307 (7.59) | 122 (3.02) | 7 (0.17) | 619 (5.96) | 181 (1.74) | 5 (0.05) | |
| Rural multilane roads | 283 (6.74) | 117 (2.79) | 3 (0.07) | 268 (6.62) | 108 (2.67) | 3 (0.07) | 264 (6.90) | 108 (2.82) | 4 (0.10) | |
| The road characteristics | Straight * | 2650 (63.14) | 1038 (24.73) | 5 (0.12) | 2532 (62.58) | 1014 (25.06) | 11 (0.27) | 2409 (63.00) | 932 (24.37) | 12 (0.31) |
| Curve | 330 (7.86) | 172 (4.10) | 2 (0.05) | 360 (8.90) | 128 (3.16) | 1 (0.02) | 358 (9.36) | 107 (2.80) | 6 (0.16) | |
| The function class | Rural * | 565 (13.46) | 209 (4.98) | 4 (0.10) | 575 (14.21) | 231 (5.71) | 10 (0.25) | 358 (9.36) | 107 (2.80) | 6 (0.16) |
| Urban | 2415 (57.54) | 1001 (23.85) | 3 (0.07) | 2317 (57.27) | 911 (22.52) | 2 (0.05) | 6311 (60.77) | 2236 (21.53) | 6 (0.06) | |
| The surface type | Concrete * | 1542 (36.74) | 36.74 (15.20) | 3 (0.07) | 1498 (37.02) | 669 (16.53) | 6 (0.15) | 558 (14.59) | 193 (5.05) | 6 (0.16) |
| Block top | 1409 (33.57) | 541 (12.89) | 4 (0.10) | 1370 (33.86) | 457 (11.30) | 6 (0.15) | 2209 (57.77) | 846 (22.12) | 12 (0.31) | |
| Brick/block/gravel/dirt | 29 (0.69) | 31 (0.74) | 0 (0.00) | 24 (0.59) | 16 (0.40) | 0 (0.00) | 22 (0.58) | 11 (0.29) | 3 (0.08) | |
| The Crash Characteristics | * | |||||||||
| The time of the accident | Not weekend | 1840 (48.12) | 697 (18.23) | 7 (0.18) | 1932 (47.75) | 745 (18.41) | 8 (0.20) | 1840 (48.12) | 697 (18.23) | 7 (0.18) |
| Weekend | 927 (24.24) | 342 (8.94) | 11 (0.29) | 960 (23.73) | 397 (9.81) | 4 (0.10) | 927 (24.24) | 342 (8.94) | 11 (0.29) | |
| The roadway class | Intersection-related * | 987 (23.52) | 477 (11.37) | 2 (0.05) | 845 (20.88) | 418 (10.33) | 1 (0.02) | 772 (20.19) | 370 (9.68) | 1 (0.03) |
| Driveway-related | 175 (4.17) | 71 (1.69) | 0 (0.00) | 128 (3.16) | 76 (1.88) | 0 (0.00) | 146 (3.82) | 46 (1.20) | 0 (0.00) | |
| Not at intersection driveway | 1818 (43.32) | 662 (15.77) | 5 (0.12) | 1919 (47.43) | 648 (16.02) | 11 (0.27) | 1849 (48.35) | 623 (16.29) | 17 (0.44) | |
| The weather | Clear/partly cloudy/overcast * | 1883 (44.87) | 820 (19.54) | 5 (0.12) | 1811 (44.76) | 796 (19.67) | 9 (0.22) | 1909 (49.92) | 712 (18.62) | 12 (0.31) |
| Raining/sleet/hail/freezing rain | 965 (22.99) | 347 (8.27) | 2 (0.05) | 855 (21.13) | 267 (6.60) | 1 (0.02) | 729 (19.06) | 282 (7.37) | 3 (0.08) | |
| Fog/smog/smoke/foggy/windy/sand, dirt, or snow | 96 (2.29) | 34 (0.81) | 0 (0.00) | 181 (4.47) | 50 (1.24) | 1 (0.02) | 103 (2.69) | 27 (0.71) | 0 (0.00) | |
| Severe crosswind | 36 (0.86) | 9 (0.21) | 0 (0.00) | 45 (1.11) | 29 (0.72) | 1 (0.02) | 26 (0.68) | 18 (0.47) | 3 (0.08) | |
| The road surface | Dry * | 712 (16.96) | 193 (5.05) | 6 (0.16) | 618 (15.27) | 227 (5.61) | 1 (0.02) | 1587 (41.50) | 579 (15.14) | 11 (0.29) |
| Wet/snow/slush/ice | 2209 (57.77) | 846 (22.12) | 12 (0.31) | 2272 (56.15) | 913 (22.57) | 11 (0.27) | 1158 (30.28) | 449 (11.74) | 4 (0.10) | |
| Other | 22 (0.58) | 11 (0.29) | 3 (0.08) | 2 (0.05) | 2 (0.05) | 0 (0.00) | 22 (0.58) | 11 (0.29) | 3 (0.08) | |
| The Passenger Characteristics | 18~34 | |||||||||
| The passenger’s age | 18~34 | 2274 (54.41) | 917 (21.94) | 5 (0.12) | 2361 (53.42) | 981 (22.19) | 8 (0.18) | 2091 (55.21) | 815 (21.52) | 14 (0.37) |
| 35~49 | 481 (11.51) | 152 (3.64) | 1 (0.02) | 593 (13.42) | 163 (3.69) | 3 (0.08) | 413 (10.90) | 107 (2.82) | 3 (0.08) | |
| 50~64 | 91 (2.18) | 79 (1.89) | 1 (0.02) | 83 (1.88) | 79 (1.79) | 1 (0.02) | 87 (2.30) | 76 (2.01) | 1 (0.026) | |
| >65 | 109 (2.61) | 68 (1.63) | 1 (0.02) | 91 (2.06) | 57 (1.29) | 0 (0.00) | 113 (2.98) | 67 (1.77) | 0 (0.00) | |
| The passenger’s gender | Male * | 1326 (31.59) | 512 (12.20) | 2 (0.05) | 1351 (33.39) | 465 (11.49) | 9 (0.22) | 1282 (33.53) | 413 (10.80) | 10 (0.26) |
| Female | 1654 (39.41) | 698 (16.63) | 5 (0.12) | 1541 (38.09) | 677 (16.73) | 3 (0.07) | 1485 (38.83) | 626 (16.37) | 8 (0.21) | |
| The passenger’s seat position | First row * | 1448 (34.50) | 658 (15.68) | 4 (0.10) | 1351 (33.39) | 636 (15.72) | 6 (0.15) | 1314 (34.36) | 602 (15.74) | 8 (0.21) |
| Second row | 449 (10.70) | 171 (4.07) | 1 (0.02) | 394 (9.74) | 147 (3.63) | 1 (0.02) | 338 (8.84) | 95 (2.48) | 4 (0.10) | |
| Third row | 1083 (25.80) | 381 (9.08) | 2 (0.05) | 1147 (28.35) | 359 (8.87) | 5 (0.12) | 1115 (29.16) | 342 (8.47) | 6 (0.16) | |
| Ejection | Not ejected * | 2978 (70.96) | 1205 (28.71) | 6 (0.14) | 2892 (71.48) | 1134 (28.03) | 7 (0.17) | 2764 (72.28) | 1032 (26.99) | 14 (0.37) |
| Ejected | 2 (0.05) | 5 (0.12) | 1 (0.02) | 0 (0.00) | 8 (0.20) | 5 (0.12) | 3 (0.08) | 7 (0.18) | 4 (0.10) | |
| The passenger’s protection measures | Not restrained * | |||||||||
| Lap/shoulder/child restrained | ||||||||||
| The road characteristics | Straight * | 14 (0.33) | 39 (0.93) | 0 (0.00) | 10 (0.25) | 31 (0.77) | 6 (0.15) | 24 (0.63) | 19 (0.50) | 10 (0.26) |
| Curve | 2966 (70.67) | 1171 (27.90) | 7 (0.17) | 2882 (71.23) | 1111 (27.46) | 6 (0.15) | 2743 (71.73) | 1020 (26.67) | 8 (0.21) | |
* means the base parameter.
References
- WHO. Global Status Report on Road Safety 2018; World Health Organization: Geneva, Switzerland, 2018. [Google Scholar]
- Hong, J.; Tamakloe, R.; Park, D. A Comprehensive Analysis of Multi-Vehicle Accidents on Expressways: A Double Hurdle Approach. Sustainability 2019, 11, 2782. [Google Scholar] [CrossRef] [Green Version]
- Bougna, T.; Hundal, G.; Taniform, P. Quantitative analysis of the social costs of road traffic crashes literature. Accid. Anal. Prev. 2021, 165, 106282. [Google Scholar] [CrossRef] [PubMed]
- Hobbs, M.; Mayou, R.; Harrison, B.; Worlock, P. A randomised controlled trial of psychological debriefing for victims of road traffic accidents. Bmj 1996, 313, 1438–1439. [Google Scholar] [CrossRef] [PubMed] [Green Version]
- Zhao, G.; Li, S.; Jiang, Y. Safety and Cost Performance of Intersection Lighting; Indiana Department of Transportation: : Indianapolis, IN, USA; Purdue University: West Lafayette, IN, USA, 2016. [Google Scholar]
- CIE. Recommendations for the Lighting of Roads for Motor and Pedestrian Traffic; CIE: Vienna, Austria, 1995. [Google Scholar]
- Anarkooli, A.J.; Hosseinlou, M.H. Analysis of the injury severity of Accidents by considering different lighting conditions on two-lane rural roads. J. Saf. Res. 2016, 56, 57–65. [Google Scholar] [CrossRef]
- Uddin, M.; Huynh, N. Truck-involved Accidents injury severity analysis for different lighting conditions on rural and urban roadways. Accid. Anal. Prev. 2017, 108, 44–55. [Google Scholar] [CrossRef]
- Islam, S.; Burton, B. A comparative injury severity analysis of rural intersection Accidents under different lighting conditions in Alabama. J. Transp. Saf. Secur. 2020, 12, 1106–1127. [Google Scholar]
- Zhang, K.; Yao, L. Study on the influence of road lighting on traffic safety in UK. Ergonomics 2014, 20, 65–67. [Google Scholar]
- Mannering, F.; Bhat, C.R.; Shankar, V.; Abdel-Aty, M. Big data, traditional data and the tradeoffs between prediction and causality in highway-safety analysis. Anal. Methods Accid. Res. 2020, 25, 100113. [Google Scholar] [CrossRef]
- Azimi, G.; Rahimi, A.; Asgari, H.; Jin, X. Severity analysis for large truck rollover Accidents using a random parameter ordered logit model. Accid. Anal. Prev. 2020, 135, 105355. [Google Scholar] [CrossRef]
- Vajari, M.A.; Aghabayk, K.; Sadeghian, M.; Shiwakoti, N. A multinomial logit model of motorcycle accident injury severity at Australian intersections. J. Saf. Res. 2020, 73, 17–24. [Google Scholar] [CrossRef]
- Wu, Q.; Zhang, G.; Zhu, X.; Liu, X.C.; Tarefder, R. Analysis of driver injury severity in single-vehicle Accidents on rural and urban roadways. Accid. Anal. Prev. 2016, 94, 35–45. [Google Scholar] [CrossRef]
- Yu, M.; Zheng, C.; Ma, C. Analysis of injury severity of rear-end Accidents in work zones: A random parameters approach with heterogeneity in means and variances. Anal. Methods Accid. Res. 2020, 27, 14. [Google Scholar]
- Yu, M.; Ma, C.; Shen, J. Temporal stability of driver injury severity in single-vehicle roadway departure Accidents: A random thresholds random parameters hierarchical ordered probit approach. Anal. Methods Accid. Res. 2021, 29, 100144. [Google Scholar]
- Yan, X.; He, J.; Zhang, C.; Liu, Z.; Wang, C.; Qiao, B. Temporal analysis of accident severities involving male and female drivers: A random parameters approach with heterogeneity in means and variances. Anal. Methods Accid. Res. 2021, 30, 100161. [Google Scholar]
- Waseem, M.; Ahmed, A.; Saeed, T.U. Factors affecting motorcyclists’ injury severities: An empirical assessment using random parameters logit model with heterogeneity in means and variances. Accid. Anal. Prev. 2019, 123, 12–19. [Google Scholar] [CrossRef]
- Liu, J.; Hao, X. Evaluation of the Metro’s In-vehicle Congestion Parameters Based on Random Parameters Logit Model. J. South China Univ. Technol. (Nat. Sci. Ed.) 2019, 47, 62–75. [Google Scholar]
- Mannering, F. Temporal instability and the analysis of highway accident data. Anal. Methods Accid. Res. 2018, 17, 1–13. [Google Scholar] [CrossRef]
- Zhou, H.; Yuan, C.; Dong, N.; Wong, S.C.; Xu, P. Severity of passenger injuries on public buses, a comparative analysis of collision injuries and non-collision injuries. J. Saf. Res. 2020, 74, 55–69. [Google Scholar] [CrossRef]
- McFadden, D.; Train, K. Mixed MNL models for discrete response. J. Appl. Econom. 2000, 15, 447–470. [Google Scholar] [CrossRef]
- Seraneeprakarn, P.; Huang, S.; Shankar, V.; Mannering, F.; Venkataraman, N.; Milton, J. Occupant injury severities in hybrid-vehicle involved Accidents: A random parameters approach with heterogeneity in means and variances. Anal. Methods Accid. Res. 2017, 15, 41–55. [Google Scholar]
- Xu, P.; Zhou, H.; Wong, S.C. On random-parameter count models for out-of-sample crash prediction: Accounting for the variances of random-parameter distributions. Accid. Anal. Prev. 2021, 159, 106237. [Google Scholar] [CrossRef] [PubMed]
- Hou, Q.; Huo, X.; Leng, J.; Mannering, F. A note on out-of-sample prediction, marginal effects computations, and temporal testing with random parameters crash-injury severity models. Anal. Methods Accid. Res. 2022, 33, 100191. [Google Scholar] [CrossRef]
- Al-Bdairi NS, S.; Behnood, A.; Hernandez, S. Temporal stability of driver injury severities in animal-vehicle collisions: A random parameters with heterogeneity in means (and variances) approach. Anal. Methods Accid. Res. 2020, 26, 100120. [Google Scholar] [CrossRef]
- Behnood, A.; Mannering, F. Time-of-day variations and temporal instability of factors affecting injury severities in large-truck Accidents. Anal. Methods Accid. Res. 2019, 23, 100102. [Google Scholar]
- Islam, M.; Alnawmasi, N.; Mannering, F. Unobserved heterogeneity and temporal instability in the analysis of work-zone accident-injury severities. Anal. Methods Accid. Res. 2020, 28, 100130. [Google Scholar]
- Washington, S.P.; Karlaftis, M.G.; Mannering, F.L. Statistical and Econometric Methods for Transportation Data Analysis; CRC: Boca Raton, FL, USA, 2003. [Google Scholar]
Publisher’s Note: MDPI stays neutral with regard to jurisdictional claims in published maps and institutional affiliations. |
© 2022 by the authors. Licensee MDPI, Basel, Switzerland. This article is an open access article distributed under the terms and conditions of the Creative Commons Attribution (CC BY) license (https://creativecommons.org/licenses/by/4.0/).