Abstract
Fully electric ships have been widely developed, investigated and evaluated by the maritime industry as a potential solution to respond to the emissions control required according to the International Maritime Organization (IMO). This study aims at presenting a novel approach to evaluate the safety level of a battery-powered high speed catamaran. Following the Formal Safety Assessment procedure, the risk assessment of the considered ship was conducted leading to the identification of the involved hazards along with the estimation of their frequency and consequences thus allowing for the identification of the most severe hazards. Fault tree analysis is carried out for and the identified top events followed by an event tree analysis to estimate the risk and safety level of the vessel. Furthermore, a cost-benefit assessment is conducted to evaluate the financial impact of selected risk control options. The derived results indicate that the application of battery power systems for high speed ferries exhibits low and acceptable accident frequencies. It is also supported the current regulation to carry out mandatory risk assessment for battery-powered ships.
1. Introduction
International shipping has made a huge effort to achieve sustainable operations and reduce its environmental footprint including gaseous emissions. According to International Maritime Organization’s (IMO’s) third Greenhouse Gas (GHG) study, 80% of global transportation by volume is delivered by international shipping, whereas the carbon dioxide emissions generated from shipping activities only amounts to 2.2% of the global emissions [1]. However, to meet the ultimate goal of eliminating GHGs, the IMO has set up its agenda to control the GHG emissions in phases. By the year of 2030, it targets to reduce 40% of carbon dioxide emissions from the maritime sector, whereas by the year of 2050, at least 50% of the total GHG emissions from marine industry must be mitigated. To address this challenge, many technologies have been emerging and are under development targeting to completely eliminate the gaseous emissions. One of these technologies is the fully electric ship, which employs energy storage systems as the power source, such as battery and super-capacitors.
Battery-powered systems have been investigated by a number of researchers as delineated in the following. Galloway and Hustmann [2] investigated the material cost and recycling of batteries for the automotive industry. Dai et al. [3] analysed the lithium-ion battery for automotive applications using the life cycle approach, which indicates that the emissions generated of the battery come from the manufacturing phase, but depend on the production location and the material sources. It proved the research results from Dunn et al. [4], who presented the life cycle assessment summary for li-ion battery production and recycling. The LCA of battery is further investigated by Raugei and Windfield [5]. Zhao and You [6] carried out a comparative study on Li-ion battery through a process based and integrated hybrid life cycle assessment (LCA) approach, comparing the GHG emissions and the energy consumption of two types of batteries (LiMn2O4 (LMO) and Li(NixCoyMnz)O2 (NCM)). Hiremath et al. [7] investigated and compared different battery storage systems applied for stationary applications using the LCA approach. Matheys et al. [8] evaluated the environmental impacts of five electric vehicle battery systems to find out the preferred one for the automotive industry.
A number of studies focused on the maritime transportation, most of which dealt with hybrid systems consisting of batteries and marine diesel engines. Kluiters et al. [9] investigated a battery-powered marine vessel employing the sodium/nickel chloride zero emissions batteries research activity (ZEBRA). The battery was tested and investigated for navy vessels by simulating the charge and discharge processes based on the ships practical operation. Lan et al. [10] conducted an optimisation of a ship hybrid power system including a photovoltaic system, a diesel engine and a battery, concluding on the optimal system sizing to minimize the CO2 emissions, as well as the capital and fuel costs. Misyris et al. [11] investigated the use of battery on marine vessels (including hybrid and fully electric ships) and developed a parameter identification method for the battery state estimation to support the battery performance evaluation during the on-board operation. Yu et al. [12] investigated the potential of combining a photovoltaic (PV)/battery/generator for short route ferries operated in inland waters considering charging in ports. Another assessment on fully electric ships was carried out by Zahedi et al. [13], who investigated a system including diesel engines, synchronous generator-rectifier units, a full-bridge bidirectional converter, and a Li-Ion battery bank as energy storage, estimating the potential fuel savings for an offshore support vessel. Jones et al. [14] investigated the application of a battery system in PV applications to estimate the performance of the system from the perspective of CO2 emissions reduction in order to meet the requirement from Paris Climate Change Agreement.
However, although the benefits of battery power systems have been broadly evaluated, specifically from the perspectives of the fuel cost savings and environmental footprint, studies on the system safety assessment that greatly affects the applicability of these systems on-board ships have not been reported in the pertinent literature. A number of accidents have been reported for battery powered vessels, which indicates that the safety assessments, the employed risk mitigation measures and the safety system design for such vessels may not be adequate [15]. Existing risk assessments for battery systems focus on automotive or stationary applications. Wang et al. [16] carried out a review on a li-ion battery and its failure mode and fire prevention strategies for electric vehicles and energy storage system. In [17], a risk assessment was carried out for stationary li-ion batteries to reduce the probability of frequency/consequences of all the risks related to the battery life cycle to acceptable or tolerable levels.
However, there exist a few studies carrying out risk assessments on marine battery power plants. Jeong et al. [18] developed a multi-criteria decision making approach for a hybrid battery-engine system and focused on cost-environment-risk issues. The risk assessment carried out could be further expanded to include more detailed hazard identification. Classification societies provide guidelines for the batteries application on-board ships [19,20]. This study aims at investigating the safety level of the battery-powered high speed catamaran. This is accomplished by employing an approach, which combines hazard identification (HAZID), fault tree analysis (FTA), event tree analysis (ETA) and cost-benefit assessment to identify the potential hazards and top events during the life span of the considered vessel and to quantitatively estimate their risk impacts (including frequency, consequences, risk and the cost of risk control options). The approach will be applied on passenger ships for validation and then tailored for ferries, which can be compared to the respective results for passenger ships and provided a general view on ferries’ safety and risk levels.
2. Methodology
This study employs a series of methods to quantitatively assess the safety and risk level of a fully electric ferry. A general formal safety assessment (FSA) is carried out supported with HAZID, fault tree analysis and event tree analysis.
2.1. Formal Safety Assessment
A formal safety assessment (FSA) is a risk assessment approach approved by IMO to evaluate the risks associated with shipping industry as well as to determine the cost and benefits of risk control options (RCOs) to reduce the potential risks [21]. It comprises six steps as shown in Figure 1. In this study, Step 1 will be supported by HAZID in Section 2.2; Step 2 will be provided in fault tree (FT) and event tree (ET) in Section 2.3 and Section 2.4; the approach of cost-benefit assessment will be presented in Section 2.4.
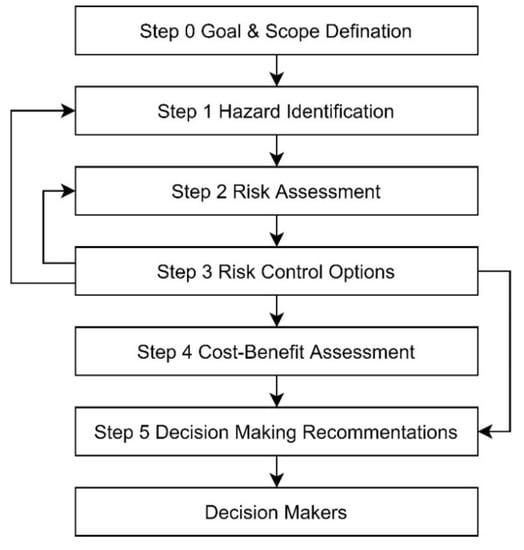
Figure 1.
General approach of a formal safety assessment (FSA) [21].
2.2. Hazard Identification and Risk Assessment
Hazard identification (HAZID) [21] is an essential part of the risk assessment where participants, including ship operators, technology inventors, manufacturers, assessment investigators and regulation makers, sit down and brainstorm all the possible hazards during the ship’s holistic life span. It also need to consider the existing database, reports, latest regulations and guidance. The HAZID will confirm the most concerned hazards for the ferry and provide frequencies and consequence levels for each hazards so that a quantitative risk assessment could determine the risk levels from risk matrix. A risk matrix could be developed using defined consequence and probability indices by a logarithmic scale. A risk index can be established by adding the probability/frequency and consequence indices. The logarithmic scale of the risk index for ranking purposes of an event can be presented in (1):
Risk = Frequency × Consequence,
log (Risk) = log (Frequency) + log (Consequence),
RI = FI + CI,
log (Risk) = log (Frequency) + log (Consequence),
RI = FI + CI,
According to IMO’s FSA guideline [21], the frequency and consequence are defined and categorized as shown in Table 1 and Table 2. The possibility index ranges from 1 to 7 presenting the likelihood of hazard happening in one ship year. The consequence index ranges from 1 to 5 showing the severity of the consequence based on the impact of hazards on cost or human life. In this step, the experience and judgement from the participant of shipping industry will be adapted. All the indices will be filled in to the risk analysis table and then the risk impacts/results will be calculated directly (see Table 3). With the definition of risk levels, the levels of hazards will be determined. There are many different hazard impacts justifying the consequence level, such as effects on ship and effects on potential loss of human life. However, in one study, one appropriate effect should be selected. In this study, effects on ships will be firstly considered and in the following steps, the impacts on assets, human life and environment will be considered.

Table 1.
Definition of frequency index [21].
Table 2.
Definition of consequence index [21].
Table 3.
Risk matrix [21].
2.3. Fault Tree Analysis
Fault tree analysis is applied to determine the probabilities of top events in order to identify the most concerned events. A fault tree analysis (FTA) will be based on the hazard identified in the HAZID and applying Bayes’ Theorem to determine the final probabilities of top events [22]. The Bayes’ Theorem is stated in (2):
where,
P(A|B) = P(A) P(B|A)/P(B)
- A, B are events under consideration;
- P(A), P(B) presents the independent probabilities of A and B;
- P(A|B) presents the probability of A given B is true;
- P(B|A) presents the probability of B given A is true.
All the identified hazards will be sorted based on the consequences in order to categorize them into different top events which will help to build the event tree and carry our event tree analysis afterwards.
2.4. Event Tree Analysis
Event tree analysis is an inductive way to show all possible outcomes from an initiating event which could be sub system failure, external event (like flood, fire, and earthquake) or operator error. An event tree can be used to model the sequences including the relationships among initiating event, subsequent responses and final states. Various accident sequences will be identified and probability of occurrence of each sequence will be further quantified in an event tree analysis. The procedures for event development are shown in Figure 2.
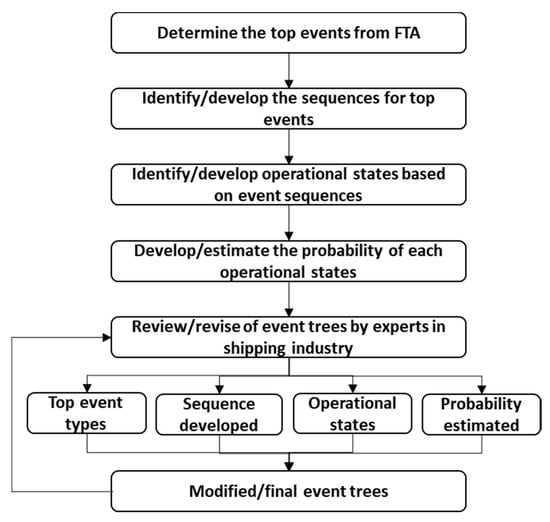
Figure 2.
Fault tree assessment approach.
To carry out an ETA, based on the FSA report for cruise ship and data from goal based damage ship stability (GOALDS), event trees are established first. With the sequences, event trees for the case ferry could be developed. Assumptions are made to determine the financial and fatality cost impacts:
- Cruise ship and ferry have construction prices of €700M and €5M respectively;
- Cost of averting fatality (CAF) is €7.45M according to GOALDS project, although previous FSAs have used a value of €3M;
- Maximum number (capacity) of passengers and crews on board cruise ship and ferry are 8000 and 150, respectively;
- Average numbers of people on board cruise ship and ferry at peak hours are 5493 and 103 respectively;
- The environmental impact due to the sinking of the vessel is considered as: a deep sea salvage will cost €5M and a near shore (shallow water) salvage will cost €1M.
The probabilities for two ships are different and based on experts’ recommendations the following assumptions are made:
- The probability of getting struck and striking other ships is 50–50 for high-speed battery driven ferry; it is 37.5% and 62.5% for larger passenger ships;
- In this project, the probability of water ingress under condition of getting struck in limited waters is 12% which is 42% for larger passenger ships;
- The probability of sinking under condition of water ingress after getting struck in limited waters is 15% in this study and it is 27% for larger passenger ships;
- The rest highlighted are agreed to have the same probability for both types of vessels.
In this study, to determine the impact on asset, human life and environment due to hazard occurrence, the following assumptions were made:
- Collision:
- The financial loss factor is 10% for water ingress only and 1% for non-water ingress;
- The fatality rate is 30% under fast capsizing and 5% for slowly capsizing;
- A deep-sea salvage will cost €5M and a near shore (shallow water) one will cost €1M;
- Grounding:
- The financial loss factor is 10% for water ingress only and 1% for non-water ingress;
- The fatality rate is 5% for water ingress; the fatality rate is 30% under fast capsizing and 18% for slowly capsizing;
- There will be only near shore salvage which will cost €1M;
- Contact:
- The financial loss factor is 10% for water ingress only and 1% for non-water ingress;
- The fatality rate is 30% under fast capsizing and 5% for slowly capsizing;
- A deep-sea salvage will cost €5M and a near shore (shallow water) one will cost €1M;
- Fire
- High, medium and low damage degree fire have financial loss factor of 70%, 50%, and 30%, respectively;
- Restrict fire inside the ignition compartment but rapidly suppressed will have fatality rates of 5% and 0% for high and low damage degree; for slow fire suppression situation, the fatality rates rise to 30% and 5%.
- For fire expanded to the other compartment, when the fire is suppressed fast, the fatality rates are 5%, 0% and 0% for high, medium and low damage degree; for slow fire suppression, the rates rise to 30%, 18% and 5%;
- No salvage required.
From the event tree analysis, the probabilities of identified and developed scenarios will be estimated based on the collected data of fleet at risk and accidents. A general approach to connect all these methods will be presented in the next section to present an overall view of the methodology.
The method applied to determine the individual risk is based on IMO’s FSA and the equation is shown below (3):
where,
IR = F × P × E
- IR is the individual risk;
- F is the frequency;
- P is the resulting casualty probability;
- E is the factional exposure to that risk.
2.5. Cost-Benefit Analysis of Risk Control Options
Although the findings of quantitative risk assessment can be determined using above mentioned approaches, it is necessary to investigate measures which could improve the design further. According to the methodology used, a cost-benefit assessment (CBA) is required in order to rank the appropriateness of the proposed risk control options (RCOs). The gross cost to avert a fatality and the net cost to avert a fatality are used as indicators. The definitions of GrossCAF and NetCAF are given here below in (4) and (5):
where:
GrossCAF = ΔC/ΔR
NetCAF = (ΔC − ΔB)/ΔR
- ΔC is the cost per ship of the risk control option during the lifetime of the vessel.
- ΔB is the economic benefit per ship resulting from the implementation of the risk control option during the lifetime of the vessel.
- ΔR is the risk reduction per ship, in terms of the number of fatalities averted, implied by the risk control option during the lifetime of the vessel.
2.6. General Approach
This paper will follow the procedure of FSA to evaluate the risk impact of full electric ferry. HAZID will identify potential hazards during the design, construction and operation of the ferry and the installation and usage of the battery power system. A schematic diagram was shown in Figure 3. to present the overall and collaboration of approaches in this study. Within the identification processes, the frequency and consequence levels will be estimated based on experts’ experience and judgement in order to determine the risk impacts of the hazards. It will also help to identify a list of most concerned top events which will be analysed using ETA to determine the frequencies of a series of accident scenarios. The impacts under different scenarios will be further evaluated from the perspective of asset financial cost, fatality cost and environmental recycle cost. To make sure the data collected providing reasonable and acceptable results, a validation process will be used to test the data collected for passenger ships before applying to high-speed inland waterway ferries. The validation will be conducted by comparing the determined accident frequencies with other projects: GOALDS, design, operation and regulation for safety (SAFEDOR) and the study investigating cost effective measures for reducing the risk from fires on ro-ro passenger ships (FIRESAFE) [23,24,25,26]. Until the model is valid, the same approach will be carried out for ferries in order to determine the accident frequencies for this type of ship. It will also indicate the accident frequency variation from passenger ships to ferries after comparison. A list of risk control options with cost and their potential to reduce the accident frequencies will be provided based on the recommendations of HAZID members (experts from shipyard, ship operators, technology providers and research institutes). Eventually, the risk assessment will be quantified from risk levels to financial costs which provides a straightforward approach to shipping industry to evaluate the performance of full electric vessels from the perspective of risk.
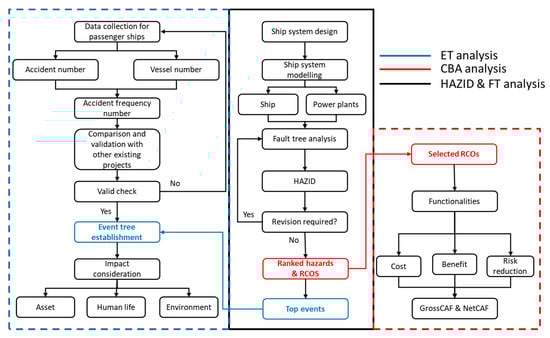
Figure 3.
Overview of approaches relationships: hazard identification (HAZID), fault tree analysis (FTA), event tree analysis (ETA) and cost benefit analysis (CBA).
3. Case Study
3.1. Case Ship
To investigate the safety level of battery power plants on marine vessels, one case ship study was carried out on a high-speed battery powered ferry operated in Norwegian Sea which area covers many small islands and requires frequent passenger transportation between islands and mainland. The specification of the case ship has been presented in Table 4.
Table 4.
Case ship specifications and general arrangement.
3.2. Battery System
The battery power system includes two packs of batteries, located on port and starboard sides of the case study ferry. The battery power plant on the vessel comprises two identical battery packs connected to the direct current (DC) hubs and through the power module (DC/alternating current (AC convertors) they can provide energy to motors, driving propellers and thrusters, and hotel loads. The battery packs will be charged while in port from local grid power or existing auxiliary power supply in the shore changing station. The capacity of a Wartsila approved battery pack is 653 kWh and the output voltage ranges from 672 to 896 V. There are two battery packs onboard (port and starboard). To identify the hazards among the battery system, the systems of innovative battery and conventional engine power plant are simplified as shown in Figure 4 and Figure 5. Inside the dash line area, the deviations between two power plants are highlighted so that the risk assessment will be focused in these components.
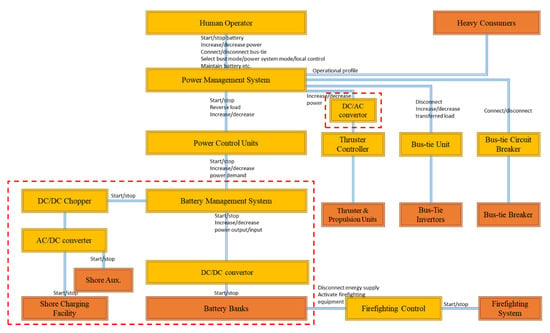
Figure 4.
System diagram of battery power plant.
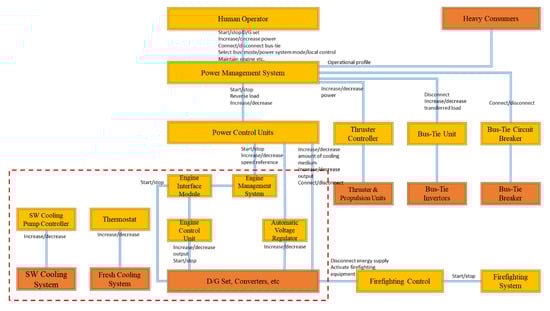
Figure 5.
System diagram of engine power plant.
3.3. Scope of This Study
The scope of this study will be confined and confirmed so that the risk assessment directly evaluates the most concerned issues to the stakeholders. Figure 6 presents the scopes of the risk assessment including mainly three phases: (1) design, construction and installation; (2) operation: voyage and approaching/leaving port; and (3) emergency situations. Different activities will be considered while assessing these phases. In this study, the first phase will take into account of ship design, ship production processes, battery design, battery room arrangement (in a general ship arrangement), battery installation and operation in the shipyard. Phase two will mainly focus on the operational activities so the route and schedule, load case conditions, operational profile, arrangement, maintenance and crew operations will be under consideration. In the last phase, the operation during emergency will be evaluated including crew operation, training, manoeuvring capacity, evacuation route, lifesaving equipment and safety systems (fire suppression and fire alarming systems).
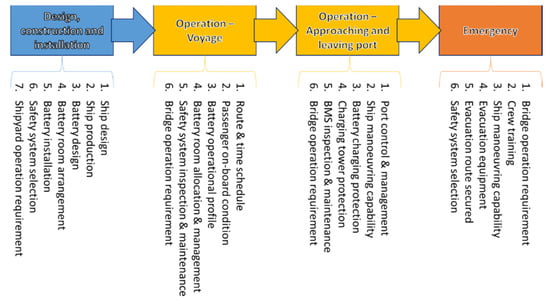
Figure 6.
Scope of risk assessment study.
4. Risk Assessment Results and Discussion
According to the methodology in Section 2, the risk assessment has been carried out and results were determined and presented in the following sections including hazard identification, accident statistic, event tree analysis and cost-benefit assessment of identified RCOs.
4.1. HAZID
A risk register was developed during the HAZID meeting (shown in Appendix A: Risk Register) and the consequent follow-up work and discussions on estimating probabilities and consequences of the identified hazards and their ranking were carried out to determine the most concerned top events: collision, contact, grounding and fire. The fault trees of them are presented in Figure 7, Figure 8, Figure 9 and Figure 10. The HAZID questionnaire is summarized in the following tables (Table 5, Table 6, Table 7 and Table 8). The risk register containing a total of 55 hazards whose frequencies and consequences were evaluated. The following number of hazards was identified:
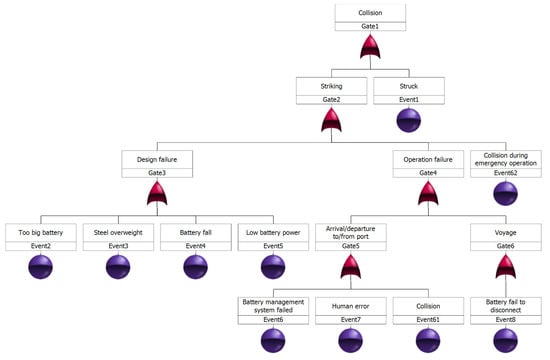
Figure 7.
Fault tree analysis on hazard associate with collision.
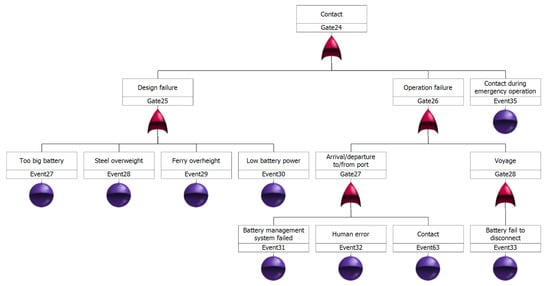
Figure 8.
Fault tree analysis on hazard associate with contact.
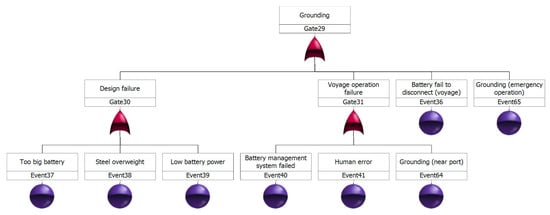
Figure 9.
Fault tree analysis on hazard associate with grounding.
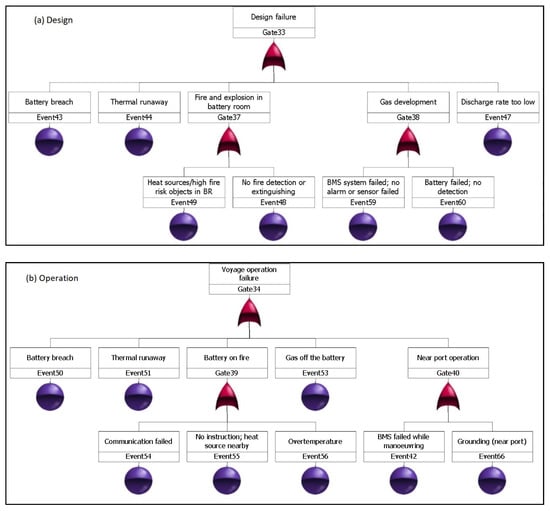
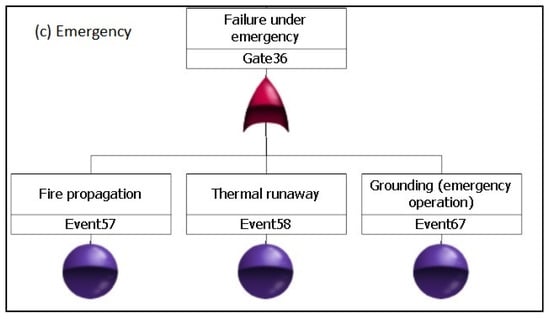
Figure 10.
Fault tree analysis on hazard associate with fire: (a) design; (b) operation; (c) emergency.
Table 5.
HAZID questionnaire results—design, construction and installation.
Table 6.
HAZID questionnaire results—operation: voyage.
Table 7.
HAZID questionnaire results—operation: arrive and leave port.
Table 8.
HAZID questionnaire results—emergency operation.
- Design, construction, installation (21 hazards);
- Operation (25 hazards);
- Emergency (9 hazards).
4.2. Uncertainty Analysis
To provide a trustworthy decision on the hazard identified and the associate risk levels, the uncertainty analysis on the frequency and consequence index were carried out. The index of frequency and consequence are resulted of HAZID meeting and determined based on engineer judgement and estimations. Goerlandt and Reniers [27] proposed a qualitative approach to apply strength-of-evidence to develop three-level of data confidences based on expert judgments and assumptions. Three levels are colour coded as green/yellow/red, which presents strong/medium/low data confidences (Table 9).
Table 9.
Definition of data confidence levels [27].
Based on the confidence level and the HAZID questionnaires reports, the confidence levels of the frequency and consequence of the identified hazard are derived and shown in the Table 10. It indicates that 25% of the determined frequency indices (FI) and consequence indices (CI) are strongly trustworthy and about 71% of them have a medium level of data confidence. Therefore, the overall strength-of-evidence is medium.
Table 10.
Determination of data confidence levels (Three levels are colour coded as green/yellow/red, which presents strong/medium/low data confidences).
4.3. Accident Statistics
One of the challenges with the qualitative risk assessment is the collection of reliable data regarding past accidents. The challenge in this case is that the previous FSAs have not addressed inland/protected water and high-speed vessels similar to our designs. In this respect, new data had to be collected. The accident data derived from the Global Integrated Shipping Information System (GISIS): Marine Casualties and Incidents (IMO). Passenger ship accident data were collected and there are 337 accidents in the database, and the numbers of accidents in different categories were determined and listed [28]. According to data provided by Sea-Web [29], the number of passenger vessels in the world merchant fleet in a yearly base were derived in Table 11 and the ship-year for global passenger ships is 4872. The accident frequencies for global passenger ship fleet are derived and presented in Table 12 and Figure 11.
Table 11.
Number of passenger ships in service vs. year.
Table 12.
Number of incidents and frequencies for global passenger ship fleet.
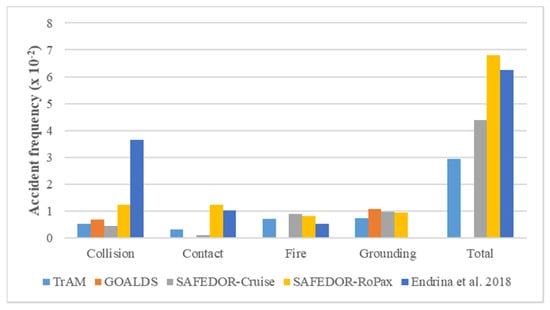
Figure 11.
Comparison of accident frequency results between this study and existing projects.
The newly collected data are compared for verification purposes with the frequencies found in previous projects, namely GOALDS and SAFEDOR. GOALDS reported the accident frequencies (collision and grounding) for the cruise ship and ro-ro passenger ship (RoPax) from 1994 to 2010; SAFEDOR reported the accident frequencies (collision, contact, grounding and fire) for cruise ships and RoPax respectively from 1994 to 2004. Another research carried out by Endrina et al. ([30]) was presented in Table 12 comparing with the accident frequency from this study. It is observed that the results from this study, are at the same exponential level with the previously reported figures.
For the fire accident frequency, the results from FIRESAFE project were used which indicates that the fires on ro-ro vessels have a frequency (per ship year) of 5.79 × 10⁻³. In this report, it mentioned the fire accident frequencies from DNV GL are 5.83 × 10⁻⁴ (year 1990–2003) and 2.00 × 10⁻³ (year 2005–2016). According to SAFEDOR, it is about 1.02 × 10⁻³. Therefore, the fire accident frequency is expected to be in the order of 10−3.
Following the same approach, the number of accidents for the inland waterways ferries is derived based on the accident database (GISIS) and the number of inland waterways ferries in the world from 2006 to 2018 are determined from Sea-web database which in total has 1178 existing (Table 13). The incident frequencies are determined and shown in Table 14.
Table 13.
Number of inland waterways ferries in service vs. year.
Table 14.
Number of incidents and frequencies for inland waterways ferries.
It is reasonable to have much lower accident frequencies since ferries are usually operation in the conditions of rapid response to extreme weather conditions, better manoeuvring characteristics of these vessels and the propulsion redundancy, and human factors (e.g., better training, less fatigue etc.).
After determining these data, an event tree analysis has been conducted to determine the impact of the different accident scenarios.
4.4. Event Tree Analysis
Based on the results from the HAZID session and the analysis of available accident statistics, the following top events were selected for event tree analysis and the sequences are described and presented in the following section:
- Collision
- ○
- Struck/Striking = > Operational state = > Water Ingress = >Sinking = > Consequences
- Contact
- ○
- Contact Objects = > Water Ingress = >Sinking = > Fatalities = > Consequences
- Fire
- ○
- Escalation = > Extinguishing speed = > Damage degree = > Consequences
- Grounding
- ○
- Navigation = > Sea Bed = > Water Ingress = > Staying Aground = > Afloat = > Consequences
With the assumptions in Section 2.4., the following event trees with cost impacts are derived in the following figures. Figure 12, Figure 13, Figure 14 and Figure 15 correspond to the ET developed for larger passenger ships in previous studies (GOALDS and cruise ship FSA). The ET in Figure 16, Figure 17, Figure 18 and Figure 19 are purposely developed for this study.
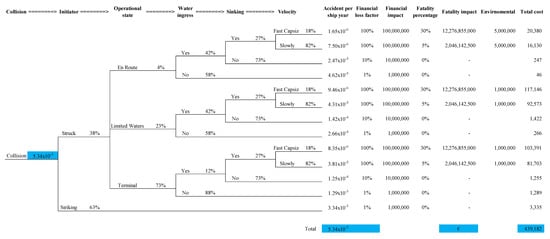
Figure 12.
Event tree analysis of collision for passenger ships.
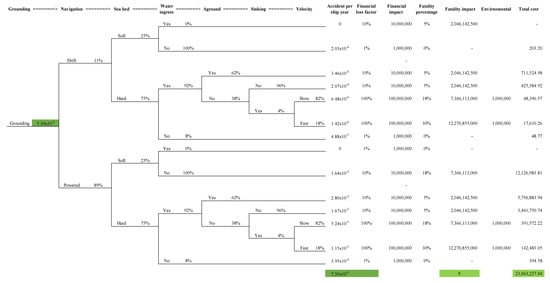
Figure 13.
Event tree analysis of grounding for passenger ships.
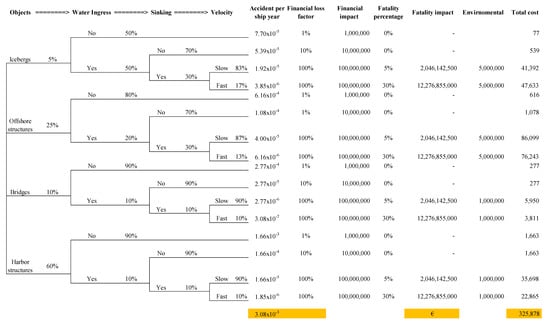
Figure 14.
Event tree analysis of contact for passenger ships.
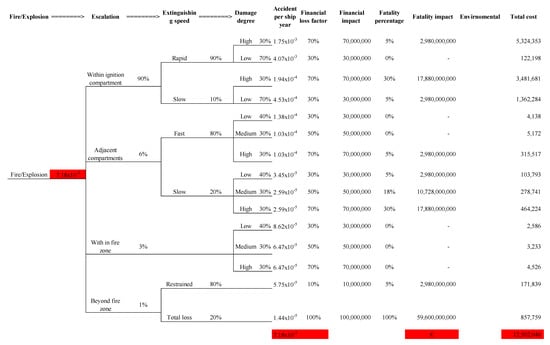
Figure 15.
Event tree analysis of fire for passenger ships.
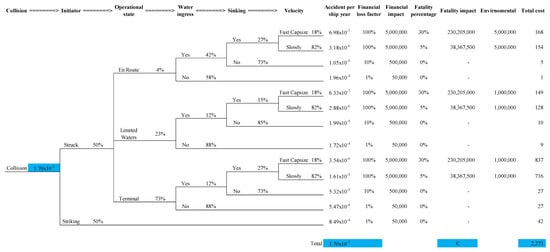
Figure 16.
Event tree analysis of a collision for the ferry in this study.
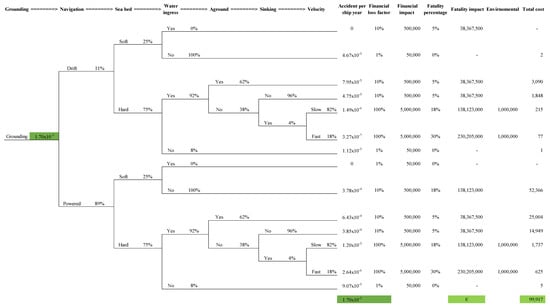
Figure 17.
Event tree analysis of grounding for the ferry in this study.
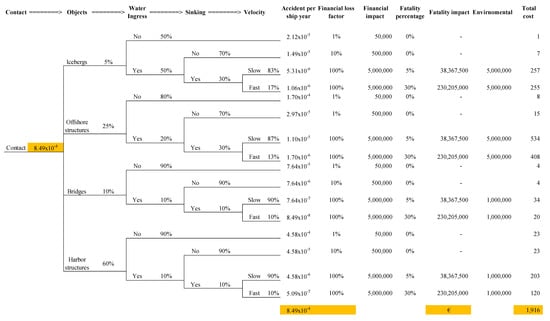
Figure 18.
Event tree analysis of contact for the ferry in this study.
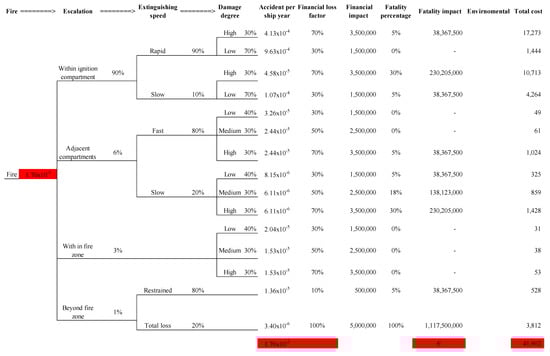
Figure 19.
Event tree analysis of fire for the ferry in this study.
The ETs developed includes both the fatalities per year and the financial impacts of incidents per year. For cruise ships, the fatalities per year due to collision accidents are 8.22 × 10⁻² which is much higher than that for high-speed ferries (4.90 × 10⁻⁴). The fatalities per year are 1.12 and 4.82 × 10⁻³ (large cruise ships and small ferries) due to grounding accidents; they are 6.06 × 10⁻² and 2.36 × 10⁻⁴ due to contact, and 3.43 × 10⁻¹ and 1.52 × 10⁻³ due to fire. The total fatalities per year due to accidents for cruise ships are much higher than small ferries. The financial impacts of incidents per year were determined: for cruise ships, the impacts for four categories (collision, grounding, contact and fire) are €130,706, €521,777, €100,106, and €2,132,184 respectively; for small ferries, the impacts are much lower than cruise ships, which are €297, €856, €165 and €3599. The costs for cruise ships are significantly higher, which are resulted from the total loss prices (i.e., construction costs) of large cruise ships and small ferries. The total loss prices used in the calculation for cruise ship and ferry are €700M and €5M. Therefore, the financial impacts are determined to be 4.1‰ and 1‰ of the total loss prices of cruise ship and ferry respectively which indicates the financial impacts on cruise ships are still higher than small ferries. To compare the risk impacts for these two types of ships, further calculations and discussions will be carried out next.
The overall risk calculation is shown in Table 15 and Table 16. For the large passenger ships (8000 PoB), these assumptions are made: 16 knots, sailing 358 days per year, 23.45 h and 695 km per sailing. For high-speed battery-driven ferry in this project, the assumptions are: 23 knots, sailing 330 days per year, 15 h per day, 1 h per sailing and 23 nm per sailing. The following results are derived, compared and presented it in Table 17: individual risk per sailing, maximum sailing per year for crew member, maximum sailing per year for any passenger, maximum individual risk for crew member, maximum individual risk for passenger the fatalities per 108 person hours (fatality accident rate, FAR), the fatalities per 108 person km and the fatalities per 108 person sailings.
Table 15.
Overall risk calculation for all passenger ships.
Table 16.
Overall risk calculation for ferry.
Table 17.
Results comparison for all passenger ship and high-speed battery-driven ferry.
According to [22], the fatalities per 108 passenger-km and Fatalities per 108 passenger hours (FAR) of waterways travelling are 0.6 and 12 respectively. In this study, they are considerably lower. They are 0.081 and 3.505 for typical large passenger ships and 0.028 and 0.052 for the high-speed battery-driven ferry in this study. Based on this findings, the ferry in this study meets the expectation to be “as safe as the existing ships”.
4.5. RCOs and Cost Assessment
The risk reductions, costs and benefits brought by the different RCOs were estimated based on the feedback from the experts in the consortium so that the cost-benefit impacts can be determined after applying the RCOs. Their values will be updated when more details about the design are available and market prices are confirmed. There are seven potential RCOs identified after HAZID indicating the most severe hazards:
- 1.
- Move the battery room on the main deck:
Moving the battery room of the case study vessel on the main deck will reduce the risks associated with potential fire in that room. This is in line with Norwegian Maritime Authority’s (NMA’s) recommendations. This measure will also have the benefit of reducing the allowable minimum breadth of the demihulls, resulting to potential total resistance reductions which will produce capital expenditures (CAPEX, battery costs) and operating expenses (OPEX, recharging costs) reduction. On the other hand, it will raise the vertical centre of gravity (VCG) and affect the stability, but due to the catamaran design, this will not affect adversely its collision, contact and grounding risks.
- 2.
- Select proper firefighting system:
A firefighting system will be equipped with a minor modification of the ferry, and the operation and maintenance cost of the system shall be considered.
- 3.
- Add alarm system:
An alarm system will be coupled with the ferry and the operation and maintenance cost of the system shall be considered.
- 4.
- Pre-test system/equipment:
Pre-test any new system and equipment before the installation will avoid incidents/accidents while operating. It will require system/equipment inspection and checking where labours and testing equipment will be necessary.
- 5.
- Supply protection for crew:
Protections such as goggles, gloves and jackets should be provided to crews while working on board and repairing faulty systems. The associated costs are investment of these protections and might be replacing them every a few years to keep the quality to be well functioning.
- 6.
- Regular inspection and maintenance:
This is necessary to prevent accident and incident from happening. This requires labour investment as well as replacement of aging spare parts.
- 7.
- Crew training:
Crew training should be included in all phases, i.e., construction, operation and maintenance phases, in order to avoid unskilled persons who might mis-operate and cause accidents.
The costs, benefits and risks associated to the application of RCOs are estimated and presented in Table 18. The cost data based on experts’ recommendation, judgment and experience. The costs of the RCOs include the investment (CAPEX) and operational cost (OPEX). The potential reduction rate on accident frequencies (collision, contact, grounding and fire) of each RCO was estimated. With an assumption of 20 years ferry life span and 5% interest rate, the gross and net cost-benefits were determined. This indicates that RCO 1 (relocation of the battery room on the main deck) brings the highest benefits. For RCO 1, this corresponds to €112.3K savings while averting a fatality but other RCOs require capital investment to help to reduce the potential loss of life (RCOs 2 and 3 require capital investment of €25.6K; RCO 4 requires €12.5K; RCO 5 needs to invest €10.9K; RCO 6 requires €25.9K; and RCO 7 needs a capital investment of €9.3K).
Table 18.
Cost and benefit assessment of risk control options (RCOs).
5. Conclusions and Recommendations
In this study, we presented an approach to assess the risk and safety level for a battery-powered high-speed catamaran ferry using HAZID, fault tree, event tree and cost-benefit assessment. The conducted HAZID session provided experts’ judgement and experience on the identified hazards to determine the levels of frequency and consequence of these hazards. A supplement was made to the hazard register to include more concerned risk incidents in the register. In addition, based on the expertise of the HAZID session experts, some hazards were eliminated and are not necessary to be included. Based on the HAZID results, four most severe top events were identified: collision, contact, grounding and fire. With data collected from IMO and the Sea-Web database, the accident frequencies of these top events were determined for passenger ships and then tailored for ferries. Referring to the GOALDS project and the FSA report (IMO), event trees were firstly established for all types of passenger ships in this study. The event trees were modified based on experts’ suggestion to fit for HSC ferries. With consideration of financial, potential loss of life and environmental impacts, eventually the total risk and its impact were determined for the considered ferry and were compared to large passenger ships as well as other types of ferries.
The main findings of the risk and safety assessment are the following:
- The accident frequencies for vessels, and high-speed battery-driven ferries, are not significantly different from the ones for larger passenger ships;
- The system architecture (Figure 4), especially the battery management system, does not raise any concerns regarding higher accident frequencies. This needs to be confirmed with the final battery management system (BMS) design and the more detailed analysis the manufacturer will perform as the ship design progresses;
- The updated event trees and the quantitative risk assessment show that the vessel’s design is as safe as existing ships.
- Risk control options for further reduction of the risk have been examined. Among all the proposed risk control options, the relocation of the battery room on the main deck is the most cost-effective RCO.
The results from this study could be updated along with a more complete battery system and ferry design. With further detail information about the system and the ferry, a more accurate assessment will be achieved in future studies.
Author Contributions
Conceptualization, H.W. and E.B.; formal analysis, H.W., A.P. and G.S.; funding acquisition, E.B.; investigation, H.W., A.P. and G.S.; methodology, H.W., E.B. and G.T.; project administration, E.B. and G.T.; resources, G.T., M.D. and E.T.; supervision, E.B. and G.T.; writing—original draft, H.W.; writing—review and editing, H.W., E.B., G.T., A.P., G.S., M.D. and E.T. All authors have read and agreed to the published version of the manuscript.
Funding
This research was funded by the European Union’s Horizon 2020 Research and Innovation Programme under grant agreement No 769303.
Acknowledgments
The authors gratefully acknowledge that the research presented in this paper was partially generated as part of the Transport: Advanced and Modular (TrAM) project. TrAM has received funding from the European Union’s Horizon 2020 Research and Innovation Programme under grant agreement No 769303. The authors affiliated with Maritime Safety Research Centre (MSRC) greatly acknowledge the financial support by the MSRC sponsors DNV GL and RCCL. The opinions expressed herein are those of the authors and should not be construed to reflect the views of Stavanger, EU, DNV GL, RCCL.
Conflicts of Interest
The authors declare no conflict of interest.
Abbreviations
| € | Euro |
| AC | Alternating Current |
| CAF | Cost of Averting Fatality |
| CAPEX | Capital Expenditures |
| CBA | Cost-benefit Analysis |
| CI | Consequence Indices |
| CO2 | Carbon Dioxide |
| DC | Direct Current |
| DG | Diesel Generator |
| EMSA | European Maritime Safety Agency |
| ET | Event Tree |
| ETA | Event Tree Analysis |
| FAR | Fatality Accident Rate |
| FIRESAFE | Study Investigating Cost Effective Measures for Reducing the Risk from Fires on Ro-Ro Passenger Ships |
| FSA | Formal Safety Assessment |
| FT | Fault Tree |
| FTA | Fault Tree Analysis |
| FW | Fresh Water |
| GHG | Greenhouse Gas |
| GISIS | Global Integrated Shipping Information System |
| GOALDS | Goal Based Damage Ship Stability |
| GrossCAF | Gross Cost to Avert a Fatality |
| h | Hour |
| HAZID | Hazard Identification |
| HSC | High-speed Craft |
| IMO | International Maritime Organization |
| K | Thousand |
| LCA | Life Cycle Assessment |
| LOA | Length Overall |
| M | Million |
| MSC | Maritime Safety Committee |
| NetCAF | Net Cost to Avert a Fatality |
| NMA | Norwegian Maritime Authority |
| OPEX | Operating Expenses |
| P | Probability |
| PI | Probability Indices |
| PLL | Potential Loss of Life |
| PoB | Passengers on Board |
| PV | Photo Voltaic |
| RCOs | Risk Control Options |
| RI | Risk Indices |
| RoPax | Ro-Ro Passenger Ship |
| SAFEDOR | Design, Operation and Regulation for Safety |
| STABALID | Stationary Batteries Li-ion Safe Deployment |
| SW | Sea Water |
| TrAM | Transport: Advanced and Modular |
| VCG | Vertical Centre of Gravity |
| ZEBRA | Zero Emissions Batteries Research Activity |
Appendix A. Risk Register
| Hazards | RCOs | P | C | R | |||
| No. | Initial Accidental Event | Cause | Consequence | ||||
| Design, construction, installation | |||||||
| 1 | Ferry over-height | Designed battery pack didn’t comply with the height requirement for ferries operated area | Contact | Check design to fulfil the requirement | 1.27 * | 4.10 | 5.37 |
| 2 | Too big battery | Too large battery in size and weight | Failed the classification check | Design optimization | 1.00 | 4.20 | 5.20 |
| 3 | Steel overweight | Change of ferry structure and design due to battery system | Failed the classification check | Design optimization | 1.10 | 4.60 | 5.70 |
| 4 | Battery breach | Physical damage: cut, shock, vibrations, metal projection | Fire, Corrosion, Asphyxia | Pre-test system/equipment when arrived and after installation | 1.40 | 4.60 | 6.00 |
| 5 | Battery fail to start | Component damaged due to harsh installation environment | Power unavailability | Check and test system when arrived and after installation; follow the installation manual | 1.64 | 4.10 | 5.74 |
| 6 | Thermal runaway | Occur flame or heat source | Fire | Install firefighting system | 1.33 | 4.66 | 5.99 |
| 7 | Battery room damaged | Didn’t comply the ship hull design rule: keep certain distance between battery room wall and outer hull during collision contact and grounding | Flooding, ship power loss | Check design to fulfil the requirement | 1.09 | 2.10 | 3.19 |
| 8 | Loss of propulsion or steering | Battery room contains other systems supporting essential vessel services | Ship power loss | Remove unnecessary systems in battery room | 1.17 | 3.34 | 4.51 |
| 9 | Battery room damaged | Battery room is positioned before the collision bulkhead | Flooding | Follow DNV GL’s regulation on battery room arrangement | 1.09 | 2.10 | 3.19 |
| 10 | Loss of essential services | Battery room contains other systems supporting essential vessel services | Other essential services failed | Follow DNV GL’s regulation to avoid other systems in battery room | 1.64 | 2.64 | 4.28 |
| 11 | Fire and explosion in battery room | Heat sources or high fire risk objects in battery room | Fire and explosion | Follow DNV GL’s regulation on battery room arrangement | 1.18 | 3.00 | 4.18 |
| 12 | Gas development (toxic, flammable, corrosive) | No system equipped; not start automatically; low capacity; no local start-stop system; lack of monitoring; no alarm system; sensor malfunctioning | Asphyxia; fire | Follow DNV GL’s regulation on ventilation requirement | 1.09 | 4.64 | 5.73 |
| 13 | Release of flammable/toxic gases | Failure/damage of the battery system; lack of detection | Fire and explosion | Follow DNV GL’s regulation on Hazardous area design | 1.09 | 4.82 | 5.91 |
| 14 | Fire and explosion in battery room | No fire assessment; no detection methods; improper fire extinguishing | Fire and explosion | Design follow DNV GL’s regulation on Fire integrity | 1.09 | 6.10 | 7.19 |
| 15 | Short circuit in battery or power system | Fail to shut the battery: 1 No circuit breaker available; 2 no fuses available; 3 wrong breaker selected. | Power loss | Equip with switchgear | 1.42 | 4.50 | 5.92 |
| 16 | Overvoltage and under-voltage | Bad converter design | Potentially fire | Test of converters and regular inspection; add alarm | 1.25 | 3.34 | 4.59 |
| 17 | Battery system unavailable | Insufficient testing: interface, converter, system and its auxiliaries, and the installation space (possible ventilation, liquid cooling, gas detection, fire detection, leakage detection) | Battery damaged | Test of the whole system and regular inspection; add alarm; and add condition monitoring system | 1.67 | 3.00 | 4.67 |
| 18 | Battery out of power | Selected battery capacity insufficient | Other essential services failed | Design to fulfil the power requirement | 1.50 | 3.00 | 4.50 |
| 19 | Battery fall | Collision; too high battery (improper design) | Battery damaged; injury | Reduce stack height; batteries shall be properly attached to the ship hull. | 1.17 | 3.00 | 4.17 |
| 20 | Low battery power | Low capacity of battery; low charging rate of charging system | Power unavailability | Understand and match the system to the operational profile | 1.08 | 2.34 | 3.42 |
| 21 | Evacuation obstructed | Evacuation station too close to battery room | Fail to evacuate | Evacuation plan simulation; risk based ship design. | 1.00 | 3.00 | 4.00 |
| Operation | |||||||
| a. Voyage | |||||||
| 1 | Battery breach | Cut, shock, vibrations, metal projection on battery | Fire, corrosion, asphyxia | Restrict access to and objects in battery rooms | 1.00 | 5.00 | 6.00 |
| 2 | Thermal runaway | Heat sources or high fire risk objects in battery rooms | Fire, corrosion, asphyxia | Comply with the rule of no heat source in battery rooms and install alarming and firefighting system | 1.20 | 5.20 | 6.40 |
| 3 | Battery on fire | No communication between EMS and the packs | Fire | Keeping the packs powered up; ensure ESS parameters are showing on the interface; and install alarming and firefighting system; | 1.64 | 5.18 | 6.82 |
| 4 | External short circuit | Wire aging, bad insulation | System failed; injuries | Wear protection gloves and check and replace aging wire | 1.55 | 3.36 | 4.91 |
| 5 | Gas off the battery (toxic, flammable, corrosive) | Failure/damage of the battery system | Fire, corrosion, asphyxia | Ventilation system | 1.09 | 4.28 | 5.37 |
| 6 | Battery fail to disconnect | Battery management system failed; no emergency disconnections | Fire | Regularly maintenance the BMS; disconnection switch installed | 1.10 | 3.90 | 5.00 |
| 7 | Internal thermal incident | No emergency instruction; aging wire | Battery damaged | Include instructions and avoid heat or sparks | 1.60 | 2.80 | 4.40 |
| 8 | External fire | No emergency instruction; heat source nearby | Fire and explosion | Prepare emergency document; keep battery from heat, spark and fire; firefighting system | 1.27 | 4.28 | 5.55 |
| 9 | System failed | Lack of systematic maintenance and function testing and observation | Battery damaged | Advance inspection and testing; maintenance and change regularly; condition based monitoring system | 1.55 | 2.64 | 4.19 |
| 10 | Fire and explosion | Over-temperature | Fire and explosion | Ventilation system; avoid heat source in BM and install alarming and firefighting system; | 1.30 | 5.80 | 7.10 |
| 11 | Battery fall | Collision; too high battery (improper design) | Battery damaged; injury | Reduce stack height; strength and maintain battery shelves | 1.00 | 3.20 | 4.20 |
| 12 | No cooling of battery | Failures of fans; loss of coolant | Battery damaged | Include monitoring and inspection | 1.73 | 2.26 | 3.99 |
| 13 | Passenger get in the battery room | Lack of sign and warning | Battery damaged; injury | Add warning sign; lock the battery room | 1.09 | 1.18 | 2.27 |
| 14 | Terrorism | Enormous media attention | Loss of ship, fatalities | Apply ISPS Code, anti-piracy procedures to be in place and ship security | 1.00 | 5.90 | 6.90 |
| 15 | Cyber-attack/connect to wrong system | Enormous media attention; lack of cyber security protection | Loss of ship | Include security system; cautions of spam emails and regulating the remote access | 1.27 | 3.90 | 5.17 |
| 16 | Damage to the hull | Electrical-chemical corrosion due to high DC from shore charging to ship | Corrosion | Supply protection for crew; regular inspection and maintenance | 1.00 | 5.00 | 6.00 |
| 17 | Battery life span shortened | Battery working at adverse SOC | Battery damaged | Detection; alarm systems | 1.00 | 3.00 | 4.00 |
| b. Arrival/departure to/from port | |||||||
| 1 | Battery overcharging/overheating | No automatic disconnection or lack of monitoring; failure of temperature sensors | Battery damaged | Charging/discharging failure shall give alarm at a manned control station. | 1.30 | 2.40 | 3.70 |
| 2 | Battery fail to start | Component damaged due to bad battery operation and harsh operation conditions | Battery damaged | Check and test system before servicing; follow the operation manual | 1.70 | 2.00 | 3.70 |
| 3 | Battery management system failed | Overvoltage and under-voltage without protection | Fire | Converter designed following regulation | 1.64 | 3.18 | 4.82 |
| 4 | Human error | Lack of crew training on manoeuvring | Collision, contact, grounding | Train crew before onboard and provide guide for operation. | 2.55 | 3.36 | 5.91 |
| 5 | Collision | Operation failure, Struck by other ship | Total loss | Enhance navigation system; crew training | 1.00 | 7.00 | 8.00 |
| 6 | Contact | Bad manoeuvring | Hull damaged | Train crews; include anti-contact equipment | 2.00 | 1.00 | 3.00 |
| 7 | Grounding | Mooring ropes broke; An insufficient or improper information of the port or the navigational water ways | Hull damaged | Navigation system/plan; berthing system | 2.00 | 3.00 | 5.00 |
| 8 | Charging station damaged | Lack of protection: hit by objects (cable, plug, etc.); electrical hazard; overheating | System/equipment damaged | Pre-test system/equipment; standard electrical safeguarding (fuses, breakers, overvoltage protection, power control, etc.) | 1.00 | 5.00 | 6.00 |
| Emergency operation | |||||||
| 1 | Fire propagation | Improper firefighting system; fire door failure; no detection or alarm | Total loss | Apply proper firefighting and alarming system; regular inspection and maintenance on fire door; | 1.10 | 5.40 | 6.50 |
| 2 | Evacuation failed | Lack of ladders, rope, lifebuoy and life jacket; evacuation blocked | Fatalities | Evacuation equipment check; arrangement of evacuation route | 1.00 | 5.60 | 6.60 |
| 3 | Collision | Operation failure, struck by other ship | Total loss | Enhance navigation system; crew training | 1.50 | 6.60 | 8.10 |
| 4 | Contact | Bad manoeuvring | Hull damaged | Train crews; include anti-contact equipment | 2.40 | 2.40 | 4.80 |
| 5 | Thermal runaway | Battery power down during events; no other packs running | Fire | Keep battery power on; run other battery systems | 1.10 | 3.80 | 4.90 |
| 6 | Crew unsafe when entering the room | Lack of ventilation, protection, initial assessment and check | Asphyxia | Keep the ventilation system running, Supply protection for crew; inspection before entering the site | 1.10 | 5.20 | 6.30 |
| 7 | Crew unsafe when removing damaged equipment | Lack of ventilation; system still working while removing; lack of training, assessment, monitoring, inspection of other module in same column | Asphyxia | Keep the ventilation system running; crew training; assessing and monitoring before crew entering to remove | 1.10 | 5.00 | 6.10 |
| 8 | Grounding | Mooring ropes broke; An insufficient or improper information of the port or the navigational water ways | Hull damaged | Navigation system/plan; berthing system | 2.00 | 3.00 | 5.00 |
| 9 | Flooding | Contact, collision, grounding. | Capsizing | Regular inspection and maintenance on ship hull and watertight doors | 1.00 | 5.00 | 6.00 |
| * Different colours were used to show the levels of frequency, consequences and risks: green = low; yellow = medium; red = high. | |||||||
References
- Smith, T.W.P.; Jalkanen, J.P.; Anderson, B.A.; Corbett, J.J.; Faber, J.; Hanayama, S. Third IMO GHG Study 2014: Executive Summary and Final Report; International Maritime Organization: London, UK, 2015. [Google Scholar]
- Galloway, R.C.; Dustmann, C.H. ZEBRA battery-material cost availability and recycling. In Proceedings of the EVS 20, 20th International Electric Vehicle Symposium and Exposition, Powering Sustainable Transportation, Conference Proceedings, Long Beach, CA, USA, 15–19 November 2003; pp. 1–9. [Google Scholar]
- Dai, Q.; Kelly, J.C.; Gaines, L.; Wang, M. Life cycle analysis of lithium-ion batteries for automotive applications. Batteries 2019, 5, 48. [Google Scholar] [CrossRef]
- Dunn, J.B.; Gaines, L.; Kelly, J.C.; Gallagher, K.G. Life cycle analysis summary for automotive lithiumion battery production and recycling. In REWAS 2016: Towards Materials Resource Sustainability; Springer: Cham, Switzerland, 2016; pp. 73–79. [Google Scholar] [CrossRef]
- Raugei, M.; Winfield, P. Prospective LCA of the production and EoL recycling of a novel type of Li-ion battery for electric vehicles. J. Clean. Prod. 2019, 213, 926–932. [Google Scholar] [CrossRef]
- Zhao, S.; You, F. Comparative Life-Cycle assessment of li-ion batteries through process-based and integrated hybrid approaches. ACS Sustain. Chem. Eng. 2019, 7, 5082–5094. [Google Scholar] [CrossRef]
- Hiremath, M.; Derendorf, K.; Vogt, T. Comparative life cycle assessment of battery storage systems for stationary applications. Environ. Sci. Technol. 2015, 49, 4825–4833. [Google Scholar] [CrossRef] [PubMed]
- Matheys, J.; Timmermans, J.M.; Van Mierlo, J.; Meyer, S.; Van Den Bossche, P. Comparison of the environmental impact of five electric vehicle battery technologies using LCA. Int. J. Sustain. Manuf. 2009, 1, 318–329. [Google Scholar] [CrossRef]
- Kluiters, E.C.; Schmal, D.; Ter Veen, W.R.; Posthumus, K.J.C.M. Testing of a sodium/nickel chloride (ZEBRA) battery for electric propulsion of ships and vehicles. J. Power Sources 1999, 80, 261–264. [Google Scholar] [CrossRef]
- Lan, H.; Wen, S.; Hong, Y.Y.; Yu, D.C.; Zhang, L. Optimal sizing of hybrid PV/diesel/battery in ship power system. Appl. Energy 2015, 158, 26–34. [Google Scholar] [CrossRef]
- Misyris, G.S.; Marinopoulos, A.; Doukas, D.I.; Tengnér, T.; Labridis, D.P. On battery state estimation algorithms for electric ship applications. Electr. Power Syst. Res. 2017, 151, 115–124. [Google Scholar] [CrossRef]
- Yu, W.; Zhou, P.; Wang, H. Evaluation on the energy efficiency and emissions reduction of a short-route hybrid sightseeing ship. Ocean Eng. 2018, 162, 34–42. [Google Scholar] [CrossRef]
- Zahedi, B.; Norum, L.E.; Ludvigsen, K.B. Optimized efficiency of all-electric ships by dc hybrid power systems. J. Power Sources 2014, 255, 341–354. [Google Scholar] [CrossRef]
- Jones, C.; Peshev, V.; Gilbert, P.; Mander, S. Battery storage for post-incentive PV uptake? A financial and life cycle carbon assessment of a non-domestic building. J. Clean. Prod. 2017, 167, 447–458. [Google Scholar] [CrossRef]
- Norwegian Maritime Authority Battery Fire with Subsequent Gas Explosion. 2019. Available online: https://www.sdir.no/en/shipping/legislation/directives/battery-fire-with-subsequent-gas-explosion/ (accessed on 1 July 2020).
- Wang, Q.; Mao, B.; Stoliarov, S.I.; Sun, J. A review of lithium ion battery failure mechanisms and fire prevention strategies. Prog. Energy Combust. Sci. 2019, 73, 95–131. [Google Scholar] [CrossRef]
- Soares, F.J.; Carvalho, L.; Costa, I.C.; Iria, J.P.; Bodet, J.M.; Jacinto, G.; Lecocq, A.; Roessner, J.; Caillard, B.; Salvi, O. The STABALID project: Risk analysis of stationary Li-ion batteries for power system applications. Reliab. Eng. Syst. Saf. 2015, 140, 142–175. [Google Scholar] [CrossRef]
- Jeong, B.; Oguz, E.; Wang, H.; Zhou, P. Multi-criteria decision-making for marine propulsion: Hybrid, diesel electric and diesel mechanical systems from cost-environment-risk perspectives. Appl. Energy 2018, 230, 1065–1081. [Google Scholar] [CrossRef]
- Andersson, P.; Wikman, J.; Arvidson, M.; Larsson, F.; Willstrand, O. Safe Introduction of Battery Propulsion at Sea. Safety and Transport Borås, Sweden. 2017. Available online: http://www.diva-portal.org/smash/get/diva2:1118026/FULLTEXT01.pdf (accessed on 1 July 2020).
- DNV GL. Rules For Classification Ships. DNV GL AS: Oslo, Norway, 2019. Available online: https://rules.dnvgl.com/ServiceDocuments/dnvgl/#!/industry/1/Maritime/1/DNV%20GL%20rules%20for%20classification:%20Ships%20(RU-SHIP) (accessed on 1 July 2020).
- IMO. Revised Guidelines for Formal Safety Assessment (Fsa) for Use in the Imo Rule-Making Process; IMO: London, UK, 2018. [Google Scholar]
- Kristiansen, S. Maritime Transportation: Safety Management and Risk Analysis; Routledge: London, UK, 2013. [Google Scholar]
- Hamann, R.; Olufsen, O.; Zaraphonitis, G. The GOAL based damage stability project (GOALDS)—Development of a new risk-based damage. In Proceedings of the 11th International Ship Stability Workshop, Belgrade, Serbia, 5–7 June 2017; Volume 8. [Google Scholar]
- Grønstøl, E. SAFEDOR—HAZID for RoPax—Design, Operation and Regulation for Safety; SAFEDOR: Hamburg, Germany, 2006. [Google Scholar]
- Nilsen, O.V. SAFEDOR—HAZID for Cruise Ship—Design, Operation and Regulation for Safety; SAFEDOR: Hamburg, Germany, 2006. [Google Scholar]
- EMSA. Study Investigating Cost Effective Measures for Reducing the Risk from Fires on ro-ro Passenger Ships (FIRESAFE) Appendix: Sensitivity and Uncertainty Analyses. EMSA, Euroupean Union, 2016. Available online: http://www.emsa.europa.eu/firesafe/download/4580/2904/23.html (accessed on 1 July 2020).
- Goerlandt, F.; Reniers, G. On the assessment of uncertainty in risk diagrams. Saf. Sci. 2016, 84, 67–77. [Google Scholar] [CrossRef]
- IMO. GISIS: Marine Casualties and Incidents Database; IMO: London, UK, 2019. [Google Scholar]
- IHS Markit. Sea-Web Ships: Ship Details & Technical Specifications; IHS Markit: London, UK, 2019. [Google Scholar]
- Endrina, N.; Rasero, J.C.; Konovessis, D. Risk analysis for RoPax vessels: A case of study for the Strait of Gibraltar. Ocean Eng. 2018, 151, 141–151. [Google Scholar] [CrossRef]


© 2020 by the authors. Licensee MDPI, Basel, Switzerland. This article is an open access article distributed under the terms and conditions of the Creative Commons Attribution (CC BY) license (http://creativecommons.org/licenses/by/4.0/).