1. Introduction
Waste electrical and electronic equipment (WEEE) recycling is of paramount importance in tackling the escalating issue of electronic waste and its detrimental environmental consequences [
1,
2,
3,
4]. With the proliferation of electronic devices worldwide, the proper disposal and recycling of electronic waste have become imperative [
5,
6,
7]. In 2019, global e-waste generation reached a staggering 53.6 metric tons (Mt), and this figure is projected to surge to 74.7 Mt by 2030, with a potential further increase to 110 Mt by 2050 [
8]. However, only 17% of the e-waste generated in 2019 was collected and recycled, resulting in the loss of valuable materials amounting to a staggering
$57 billion USD. Approximately 44.3 Mt of e-waste flows remain unaccounted for, likely being dumped, traded, or recycled in an inappropriate manner [
9]. The primary objective of WEEE recycling is to mitigate the environmental impact associated with electronic waste and delay the depletion of valuable resources by extracting and recycling precious metals from discarded electronic devices [
10,
11].
WEEE materials are known to contain precious metals such as gold (Au), silver (Ag), and the platinum group metals (PGMs), which possess superior characteristics including high melting points, corrosion resistance, and excellent electrical conductivity [
12,
13]. The recovery of these precious metals not only helps to preserve valuable resources but also reduces the need for extracting virgin ores, thereby mitigating the environmental impact associated with conventional mining practices [
14,
15]. Pyrometallurgical recycling processes have been considered as highly effective methods for the recovery of valuable metals from WEEE [
16,
17,
18]. This approach utilizes high-temperature thermal processes to extract and separate metals from electronic waste, providing an efficient and reliable means of metal recovery [
19,
20]. Valuable metals such as copper (Cu), gold (Au), silver (Ag), palladium (Pd), and platinum (Pt) can be successfully recovered from complex electronic waste streams using pyrometallurgical techniques [
21,
22,
23,
24].
The refining stage is a crucial step in the pyrometallurgical recycling process, aiming to purify and concentrate the recovered metals to ensure their quality and market value. During refining, impurities and contaminants are selectively removed, while valuable metals are recovered and refined to high purity levels [
25]. The oxidative refining process follows the principles outlined in the Ellingham diagram, which illustrates the formation of metal oxides as a function of pO
2 and temperature. Base metals exhibit stronger affinities for oxidation compared to precious metals, making them more susceptible to oxidation and elimination during the refining process [
26]. This process is essential to obtain metals that meet industry specifications and can be reintroduced into the production cycle. Oxidative refining has emerged as a promising technique for the purification and concentration of metals in the pyrometallurgical recycling of WEEE [
27]. The oxidative refining process selectively oxidizes impurities such as iron (Fe), aluminum (Al), silicon (Si), and lead (Pb), while preserving and enhancing the concentration of valuable metals [
28]. This method has shown great potential in improving the efficiency and effectiveness of metal recovery from electronic waste, as it allows for targeted removal of impurities while maximizing the concentration of valuable metals.
This study focuses on exploring the oxidative refining process as an effective method for recovering and concentrating precious metals, such as Pd and Au, from waste printed circuit boards (PCBs), through pyrometallurgical techniques. The study aims to optimize the refining parameters to maximize the concentration of precious metals in the recovered metals. Comprehensive characterization techniques, including scanning electron microscopy (SEM), energy-dispersive X-ray spectroscopy (EDX), X-ray diffraction (XRD), and inductively coupled plasma (ICP) analysis, were employed to assess the microstructure, elemental composition, and concentration of the refined metals recovered from waste PCBs through the oxidative refining process. These techniques provide valuable insights into the effectiveness of the oxidative refining process and its potential for enhancing the recovery of precious metals from electronic waste.
2. Materials and Methods
Waste PCBs and lead frames were collected and mechanically shredded to reduce their size for subsequent processing. The resulting shredded PCBs and lead frames were subjected to smelting, where the material was heated to high temperatures, causing the metals to melt and separate from the slag layer.
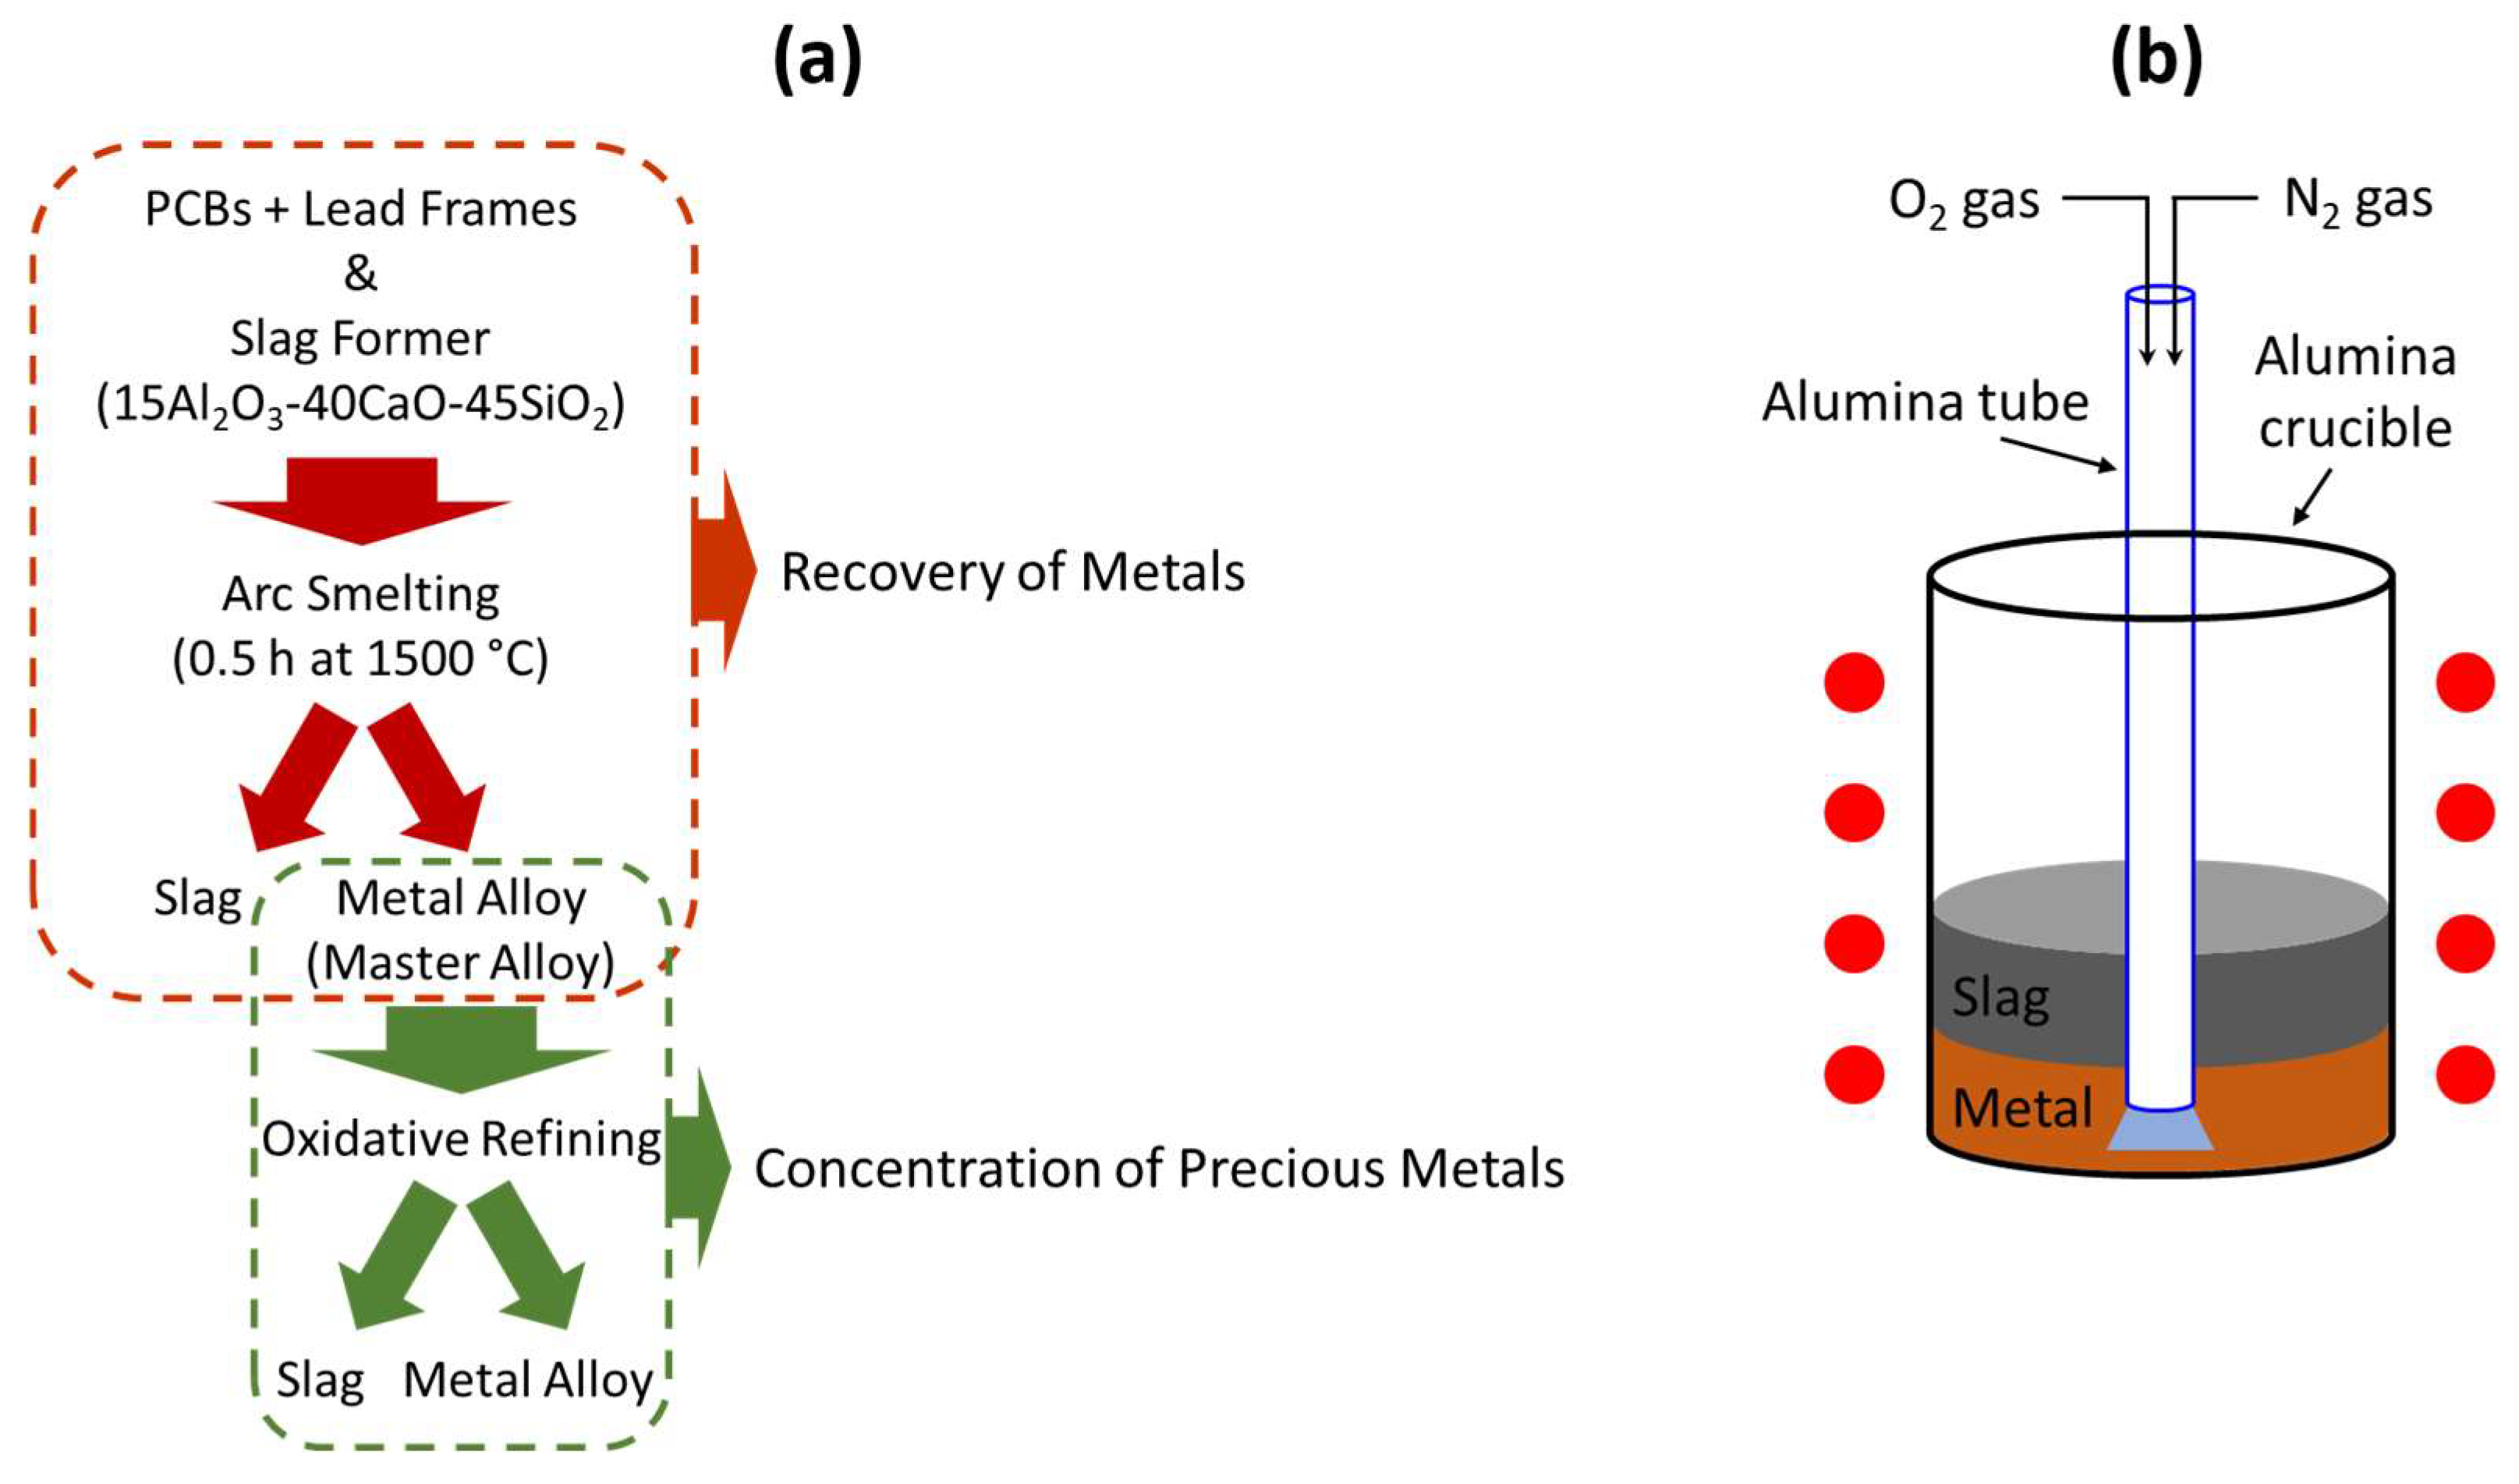
Figure 1a shows the pyrometallurgical recycling process including smelting and refining process. In order to form a slag layer to recover metals from PCBs and lead frames during the smelting process, a slag former, which is 15Al
2O
3-40CaO-45SiO
2, was introduced. PCBs and lead frames mixed with the slag former were subjected to a high-density carbon crucible in an electric arc furnace, which is powered by a three-phase electrical supply. Then, they were heated until the temperature reached 1500 °C. After they were completely melted, the melt was kept for 0.5 h at 1500 °C. Throughout the smelting process, the organic components of the materials, such as plastics and resins, decomposed into gaseous products. Additionally, impurities and undesired elements like calcium (Ca), phosphorus (P), Si, and Al were separated from the molten metals and formed the slag layer.
The separated metals were subjected to oxidative refining processes aimed at removing residual impurities and concentrating the precious metals. The oxidative refining process is shown schematically in
Figure 1b. A 300 g master alloy obtained from the smelting process was prepared and introduced into a high-density alumina crucible with a size of 47Φ × 120 mm. For the refining process, a gas mixture of oxygen (O
2) and nitrogen (N
2) was used. The sample was heated using a MoSi
2 heater system with a heating/cooling rate of 5 °C/min. When the temperature reached the desired processing temperature, the mixture of O
2 and N
2 gases were directly injected to the melt through the alumina tube. To optimize the oxidative refining process, several parameters were varied. Firstly, the process duration was adjusted between 10 and 40 min. Secondly, the gas injection pressure was controlled by regulating the gas flow rate, and the total gas flow rate of the mixed gas was varied between 3 and 4 L/min. The flow rate of O
2 gas was kept constant at 2.5 L/min, while the flow rate of N
2 gas was adjusted within the range of 0.5 to 1.5 L/min. Lastly, the process temperature was also varied between 1300 °C and 1400 °C to investigate its effect on the oxidative refining process.
To analyze the microstructure of the obtained metals and slag after the refining process, scanning electron microscopy (SEM, Quanta 200 FEG, FEI Company, Hillsboro, OR, USA) was employed. The phase formation in the slag was characterized using X-ray diffraction (XRD, SmartLab 9 kW, Rigaku, Japan). The components of the resulting metals and slags were identified and quantified using wavelength dispersive X-ray fluorescence spectroscopy (WD-XRF, ARL PERFORM’X, Thermo Fisher Scientific, Basel, Switzerland). Additionally, inductively coupled plasma optical emission spectroscopy (ICP-OES, Integra XL, GBC Scientific, Braeside, Australia) analysis was conducted to accurately determine the content of precious metals within the recovered metal.
3. Results and Discussions
3.1. Characterization of A Master Alloy
The metals obtained from the smelting process were used as the master alloy for the oxidative refining process. The composition of the metal was analyzed using WD-XRF analysis, and the results are presented in
Table 1. The analysis confirmed that the master alloy consisted of a high quantity of Cu including impurities such as Si, Fe, P, Pb and Al. Additionally, precious metals like Pd and Au were also present.
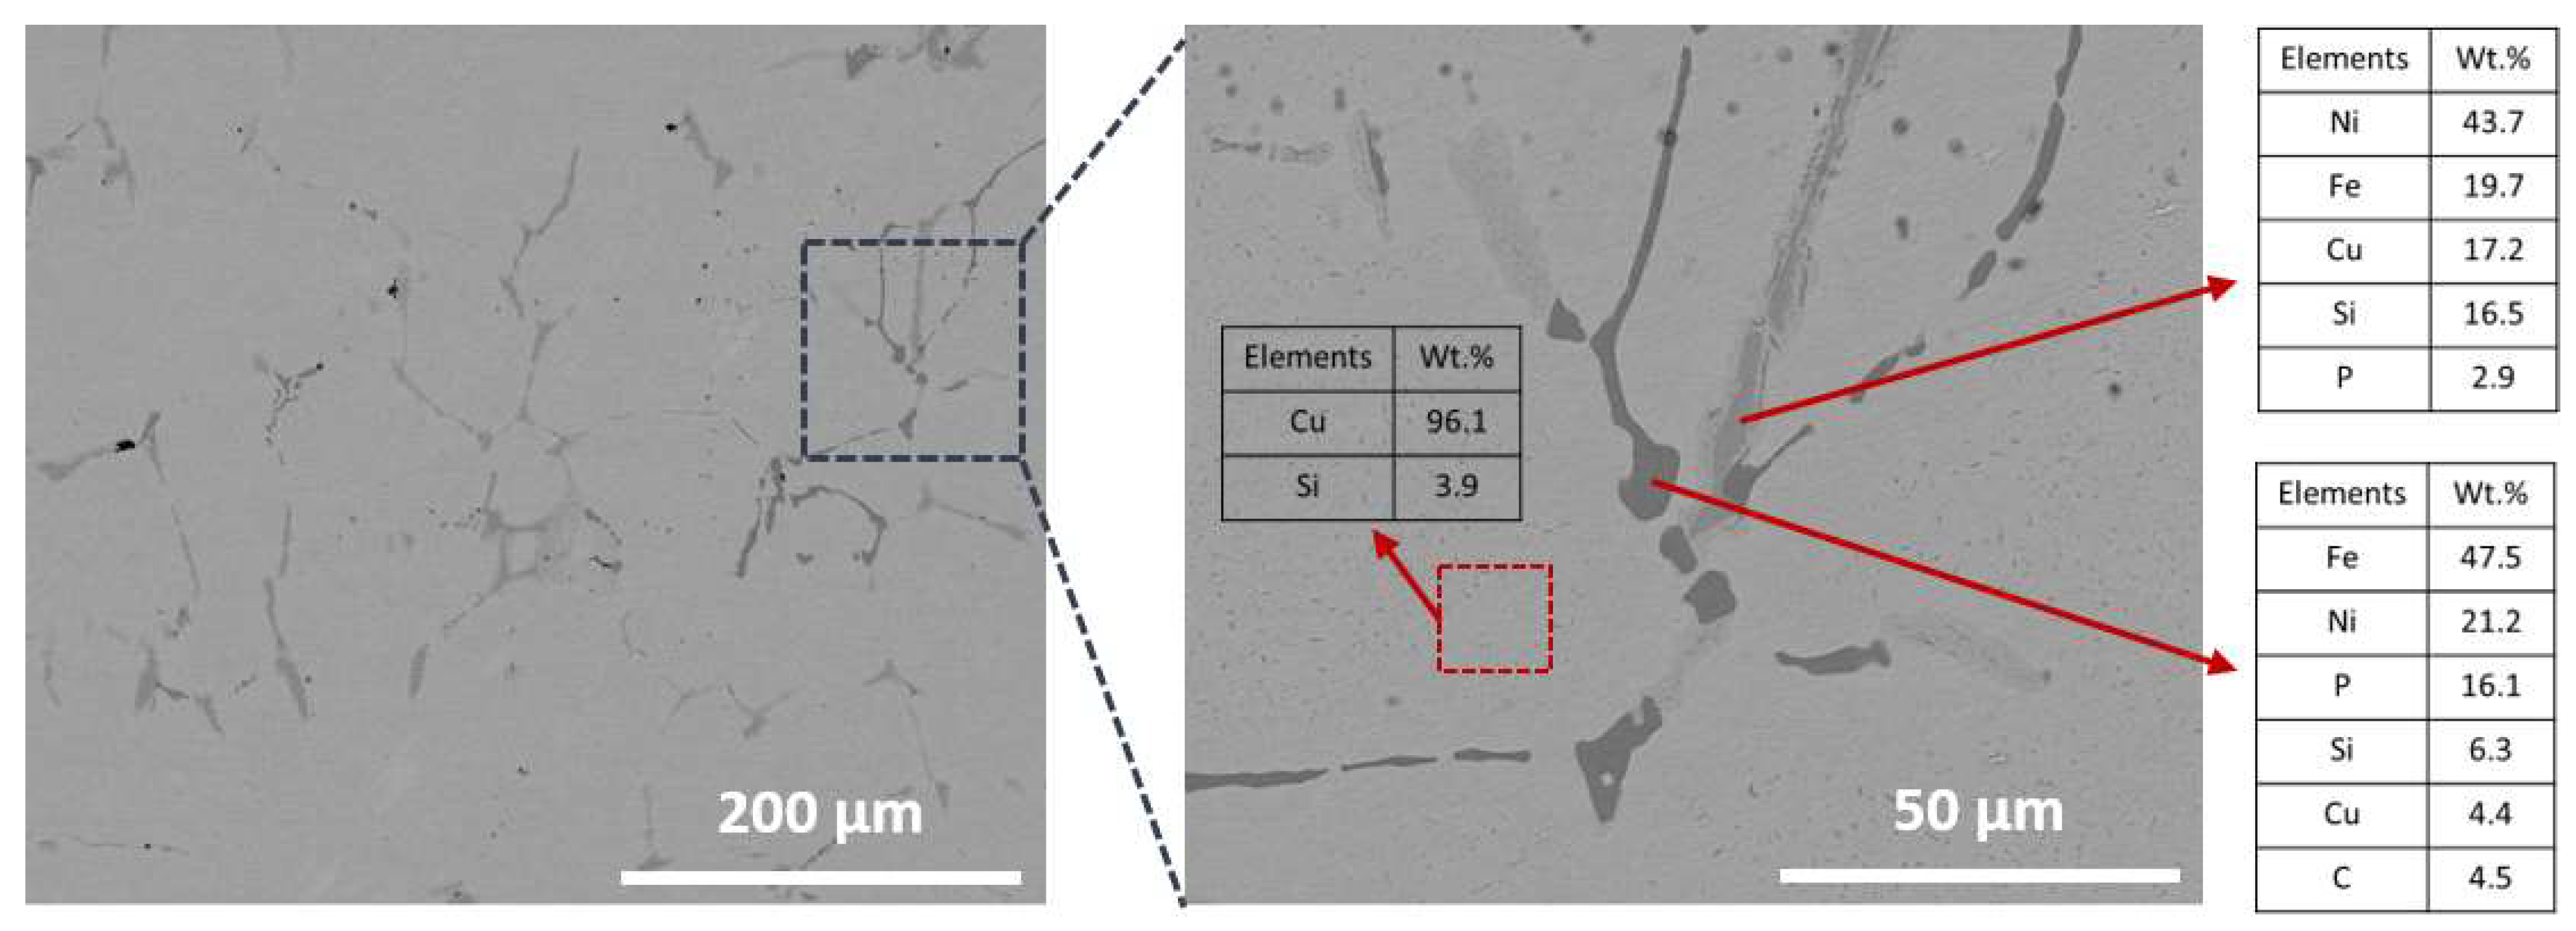
Figure 2 shows the microstructures of the master alloy along with the EDX results, revealing the distribution of impurities within the Cu-rich grains. The Cu-rich grains contained a small amount of Si (4.20 wt%), which is expected to be removed during the oxidative refining process. Along the grain boundaries, two phases were observed, represented by dark gray color, as shown in
Figure 2. The phase with a darker gray color was composed of a high quantity of Fe, while the other phase, richer in Ni, appeared with a lighter gray color. These Fe- and Ni-rich phases also contained other impurities such as Si and P. Although precious metals were present in very small quantities in the WD-XRF result, they were not detectable through EDX analysis.
To investigate the thermal behavior of the master alloy, DSC analysis was performed, and the results are shown in
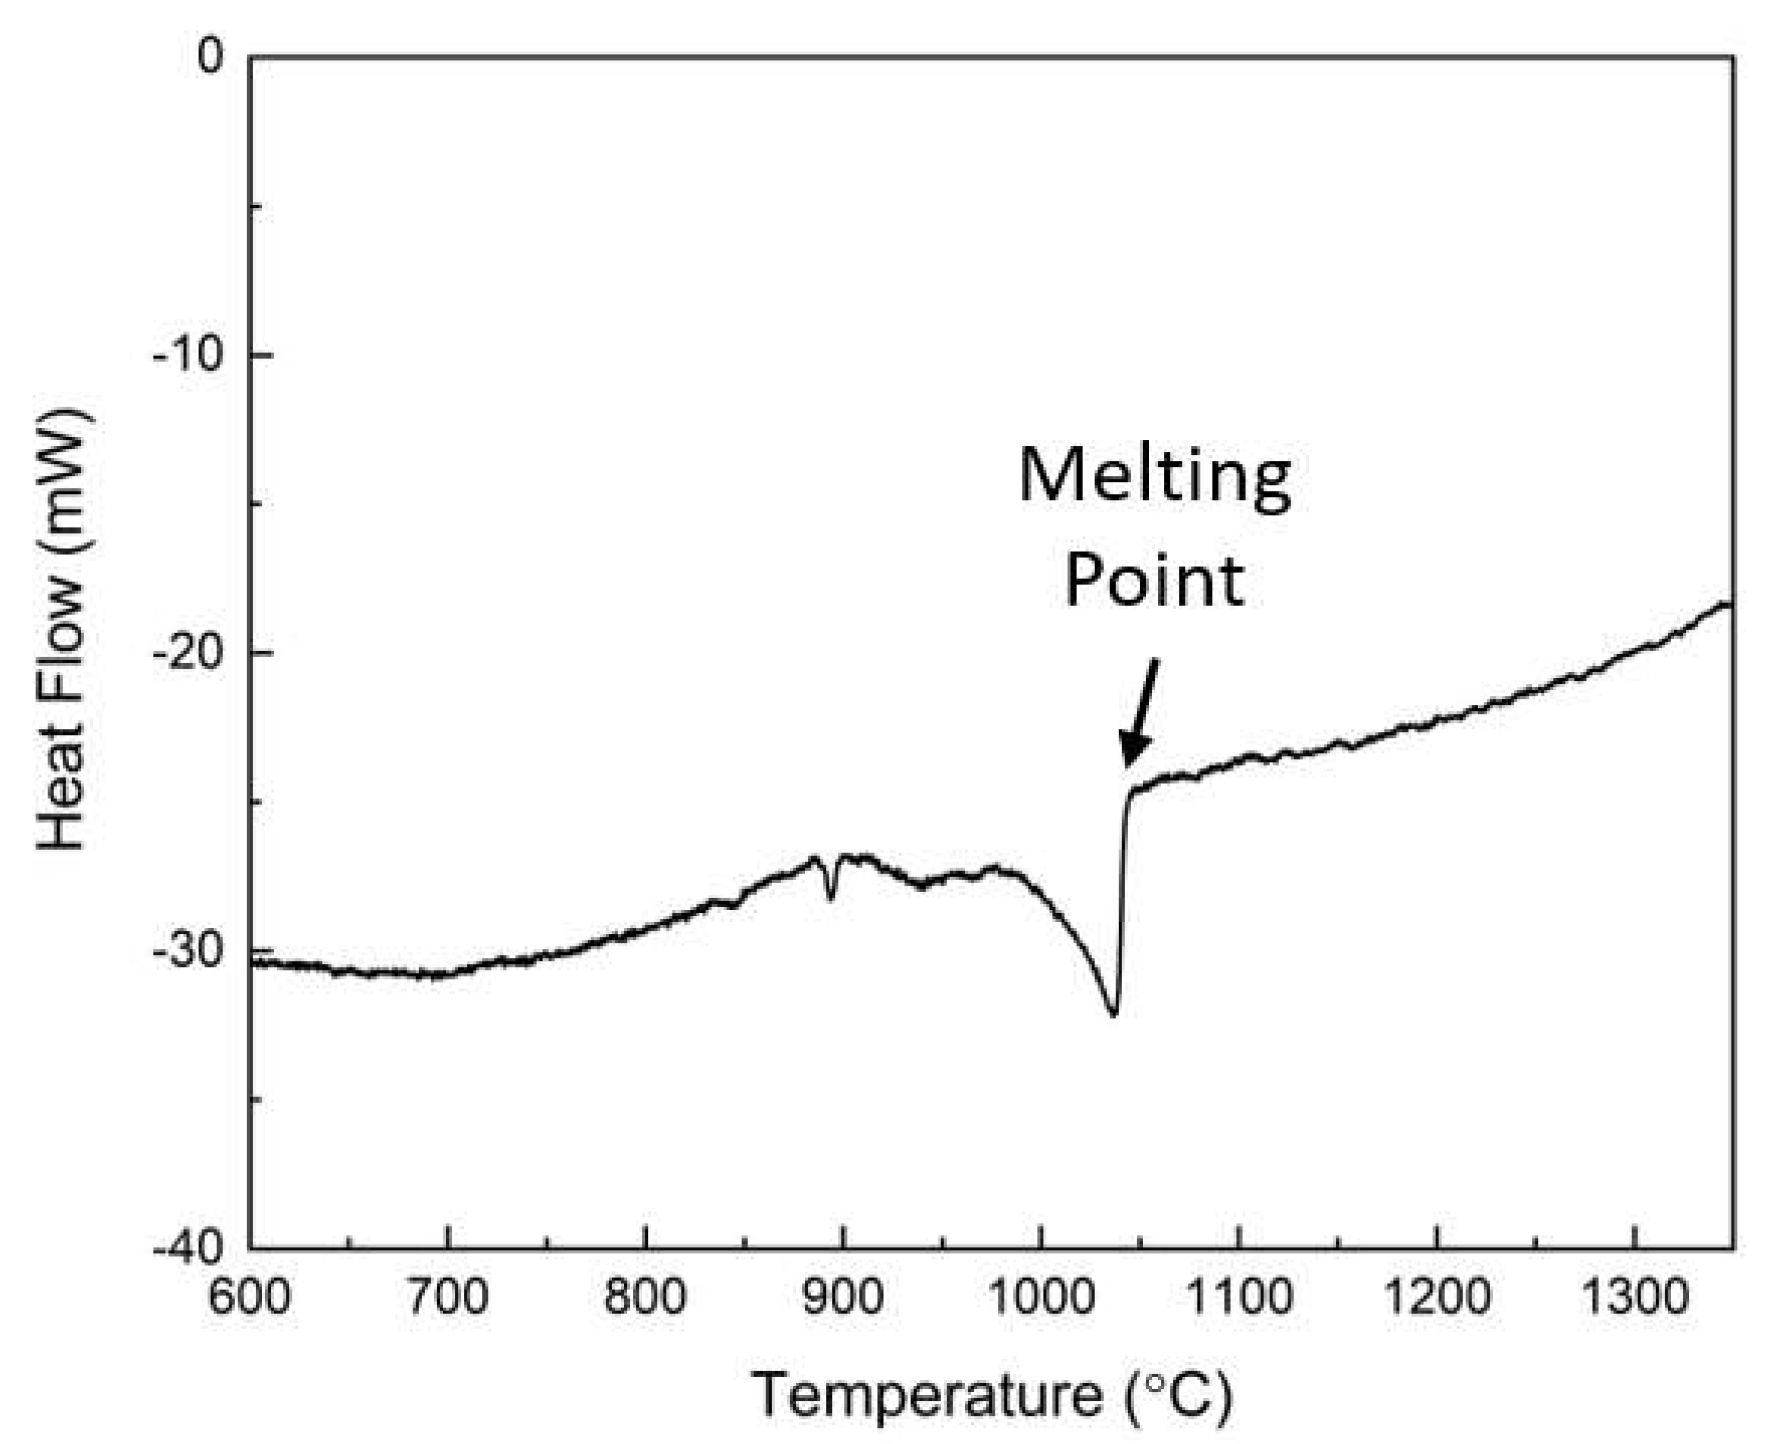
Figure 3. During the heating process, a significant endothermic peak was observed at temperatures above 1000 °C, indicating a characteristic melting reaction. This observation confirmed that the melting point of the master alloy is 1046 °C. Consequently, it was determined that the process temperature for the oxidative refining needs to be set within a higher temperature range to ensure proper processing of the master alloy.
3.2. Effect of Process Time on Oxidative Refining
The temperature for the oxidative refining process was determined as 1300 °C, based on the DSC result shown in
Figure 3, which is a typical converting temperature of Cu. A gas mixture of O
2 and N
2 with a 1:1 ratio was injected at a fixed total flow rate of 3 L/min. To establish an appropriate process duration, the time was varied between 10 min and 40 min. After the oxidative refining process, the master alloy was separated into a slag layer and a metal layer.
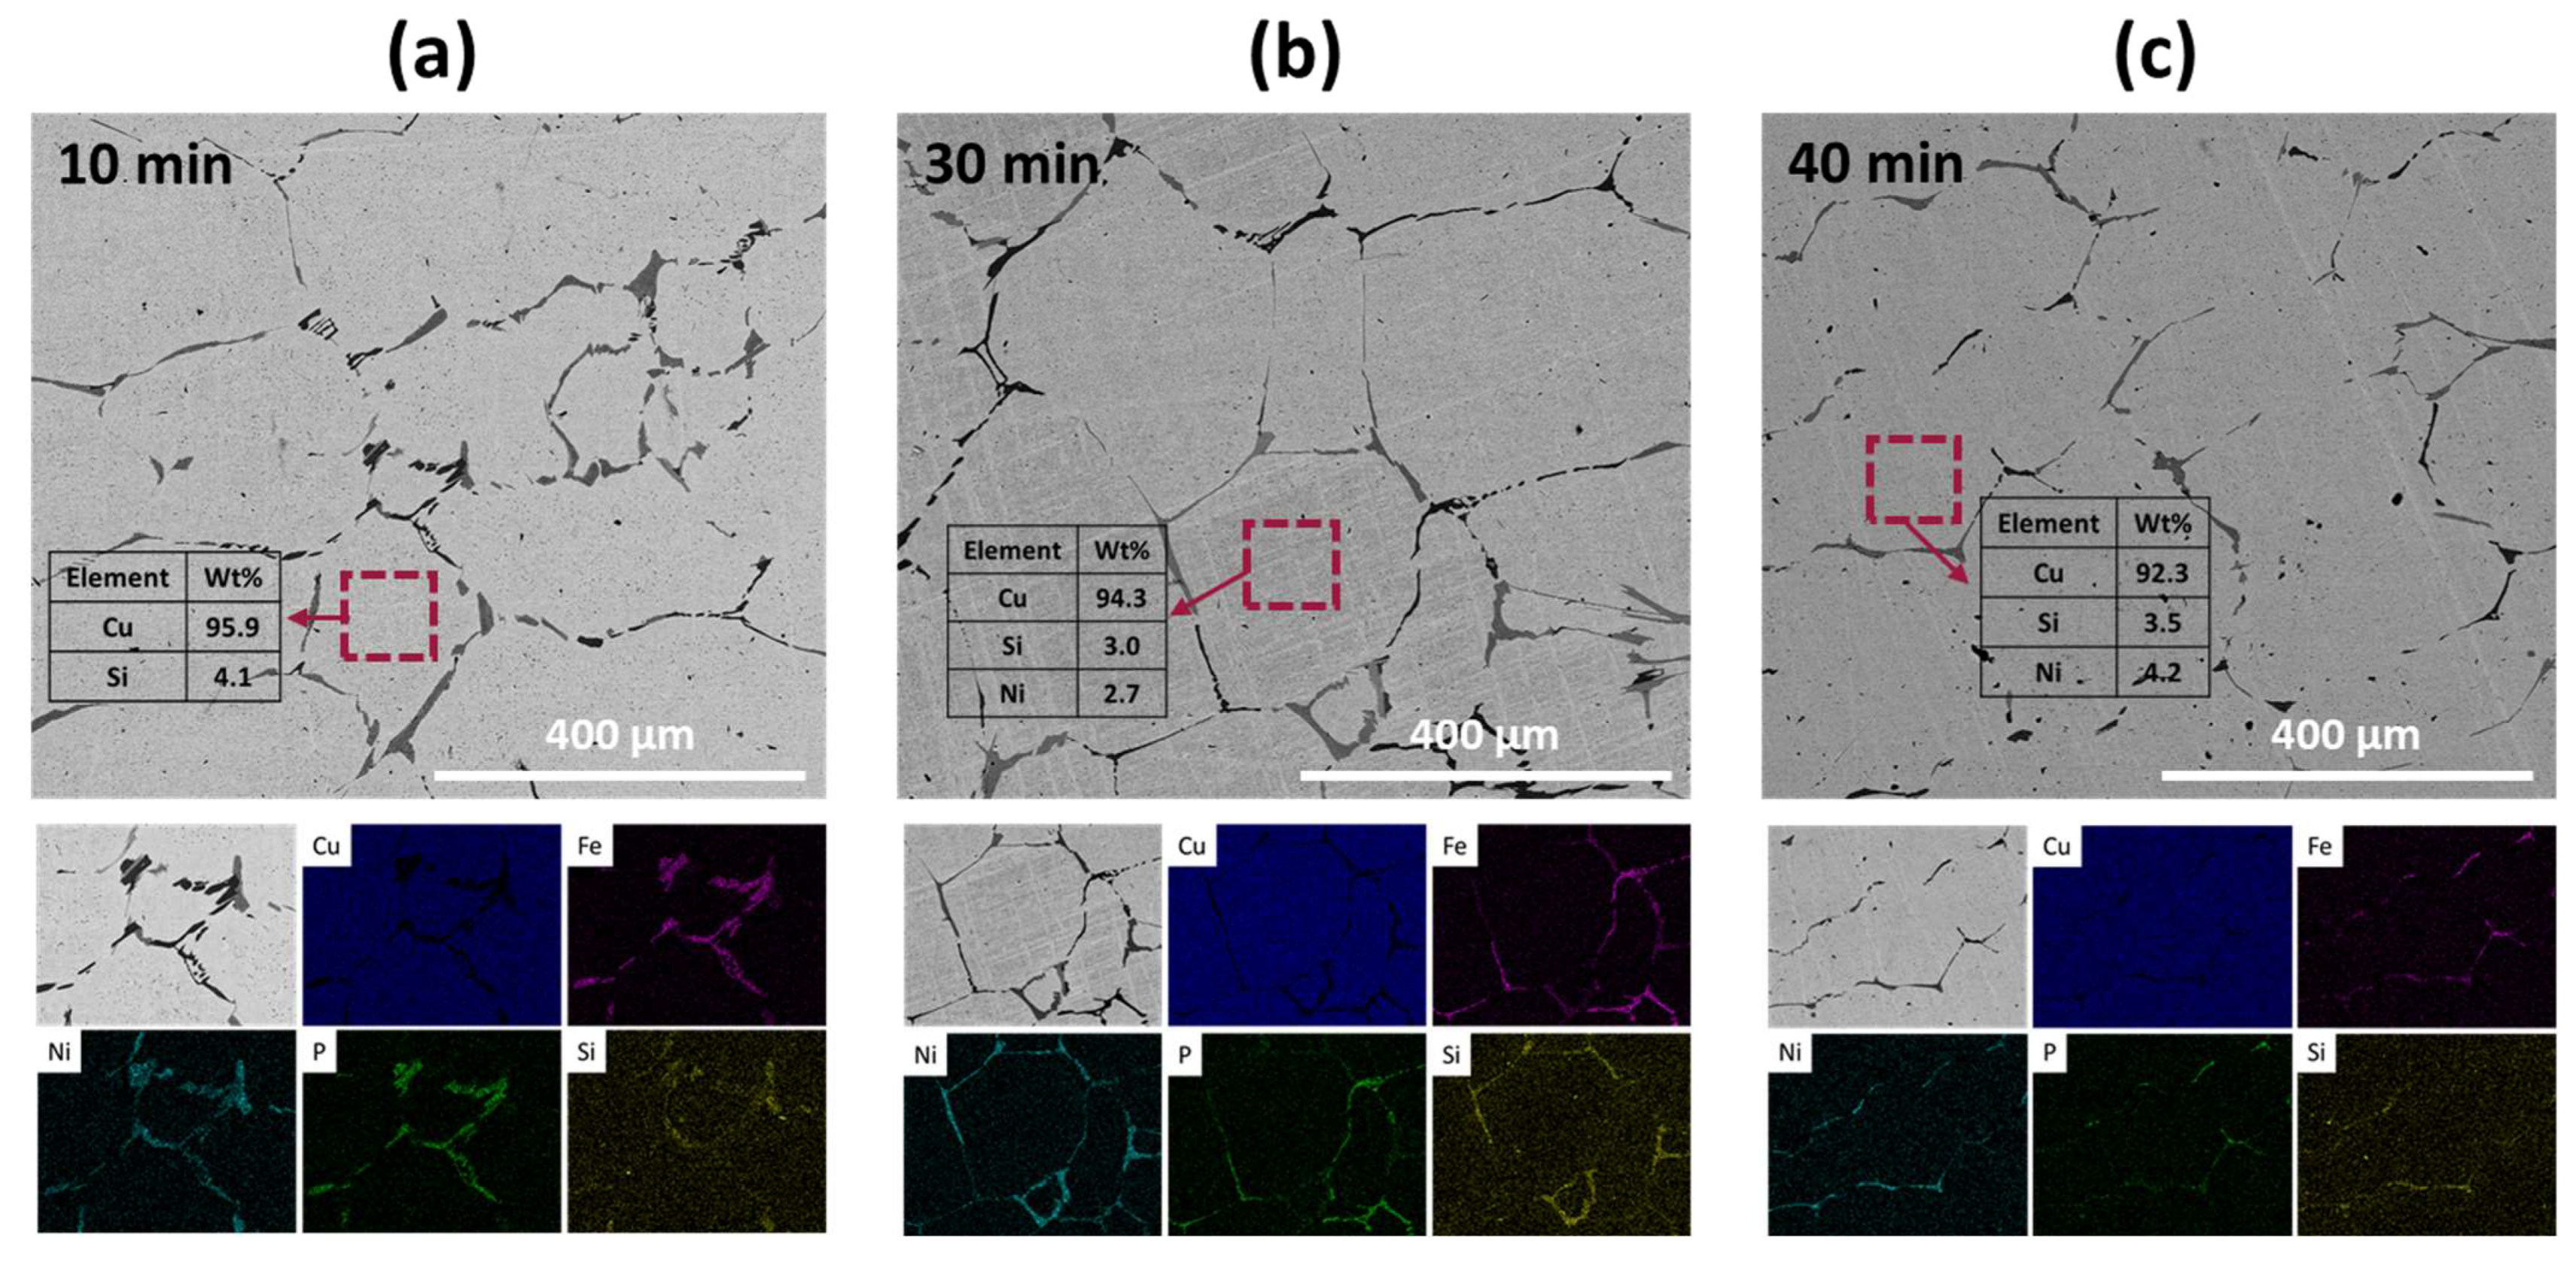
Figure 4 shows the microstructures and EDX results of the recovered metals obtained after the oxidative refining process. After the 10 min process, distinct black and dark gray phases were observed along the boundaries of the Cu grains, identified as Fe-rich and Ni-rich phases, respectively, from the EDX mapping analysis. Inside the Cu grains, a small amount of Si (4.1 wt.%) was found, consistent with the observations made in the master alloy (as shown in
Figure 2). With an increase in the process duration up to 40 min, the Cu grain sizes grew larger, leading to a decrease in the volume fraction of grain boundaries. Consequently, this reduction in grain boundaries resulted in a decrease in the volume fraction of the Fe-rich and Ni-rich phases. However, the composition of the Cu grains remained largely unchanged, retaining impurities such as Si and Ni. Therefore, while the extended process duration effectively reduced impurities at the Cu grain boundaries, it had minimal impact on the impurity content within the Cu grains themselves.
XRF analysis was performed to analyze the composition of the metals and slag obtained after the refining process.
Figure 5 presents the results of the XRF analysis, with (a) and (b) representing the analyzed results of the metals and slag, respectively. The metals were primarily composed of Cu along with impurities and precious elements. After a 10-min process, there was a slight increase in Cu content accompanied by an increase in Si content. This suggests that, initially, Cu oxidation was the dominant process. As the process time increased, the Cu content showed a slight increase while the Si content decreased. Impurities such as Fe, Ni, and P exhibited a continuous decrease over time. However, even after a 40 min process, the impurities were not completely removed, and the contents of precious metals (Pd and Au) did not exhibit significant changes. Regarding the slag layer, copper oxide (CuO) was predominantly formed during the initial 10 min of the process. Subsequently, the content of other oxides, such as silicon oxide (SiO
2), aluminum oxide (Al
2O
3), iron oxide (Fe
2O
3), and nickel oxide (NiO), started to increase, and their mass fraction rapidly increased over time.
The X-ray diffraction patterns of the slag obtained after the oxidative refining process are displayed in
Figure 5c. The diffraction peaks of Cu
2O and CuO were observed with high intensities, indicating the predominant formation of copper oxides. Additionally, low-intensity diffraction peaks of SiO
3, Fe
3O4, and Fe
3SiO
4 were detected. These findings suggest that, during the oxidative refining process, not only were copper oxides formed predominantly, but there was also partial oxidation of Si and Fe.
This result indicates that duration time was not the only variable to control the impurity during the refining process for the selective control of the elements (Fe, Si, and P). Although increasing the process time allowed for selective oxidation of undesired elements, it was evident that additional variable control is necessary to enhance the effectiveness of impurity removal and the concentration of precious elements.
3.3. Effect of Injected Mixed Gas Pressure
For a higher efficiency of the refining process, the total pressure of the injected gas was differentiated. This was achieved by controlling the flow rates of O2 and N2 gases. The flow rate of O2 gas was maintained at a constant 2.5 L/min, while the flow rate of N2 gas was varied from 0.5 to 1.5 L/min. As a result, the total gas flow rate ranged from 3 to 4 L/min, while the supply of O2 gas remained consistent. The oxidative refining process was performed at 1300 °C for a duration of 40 min.
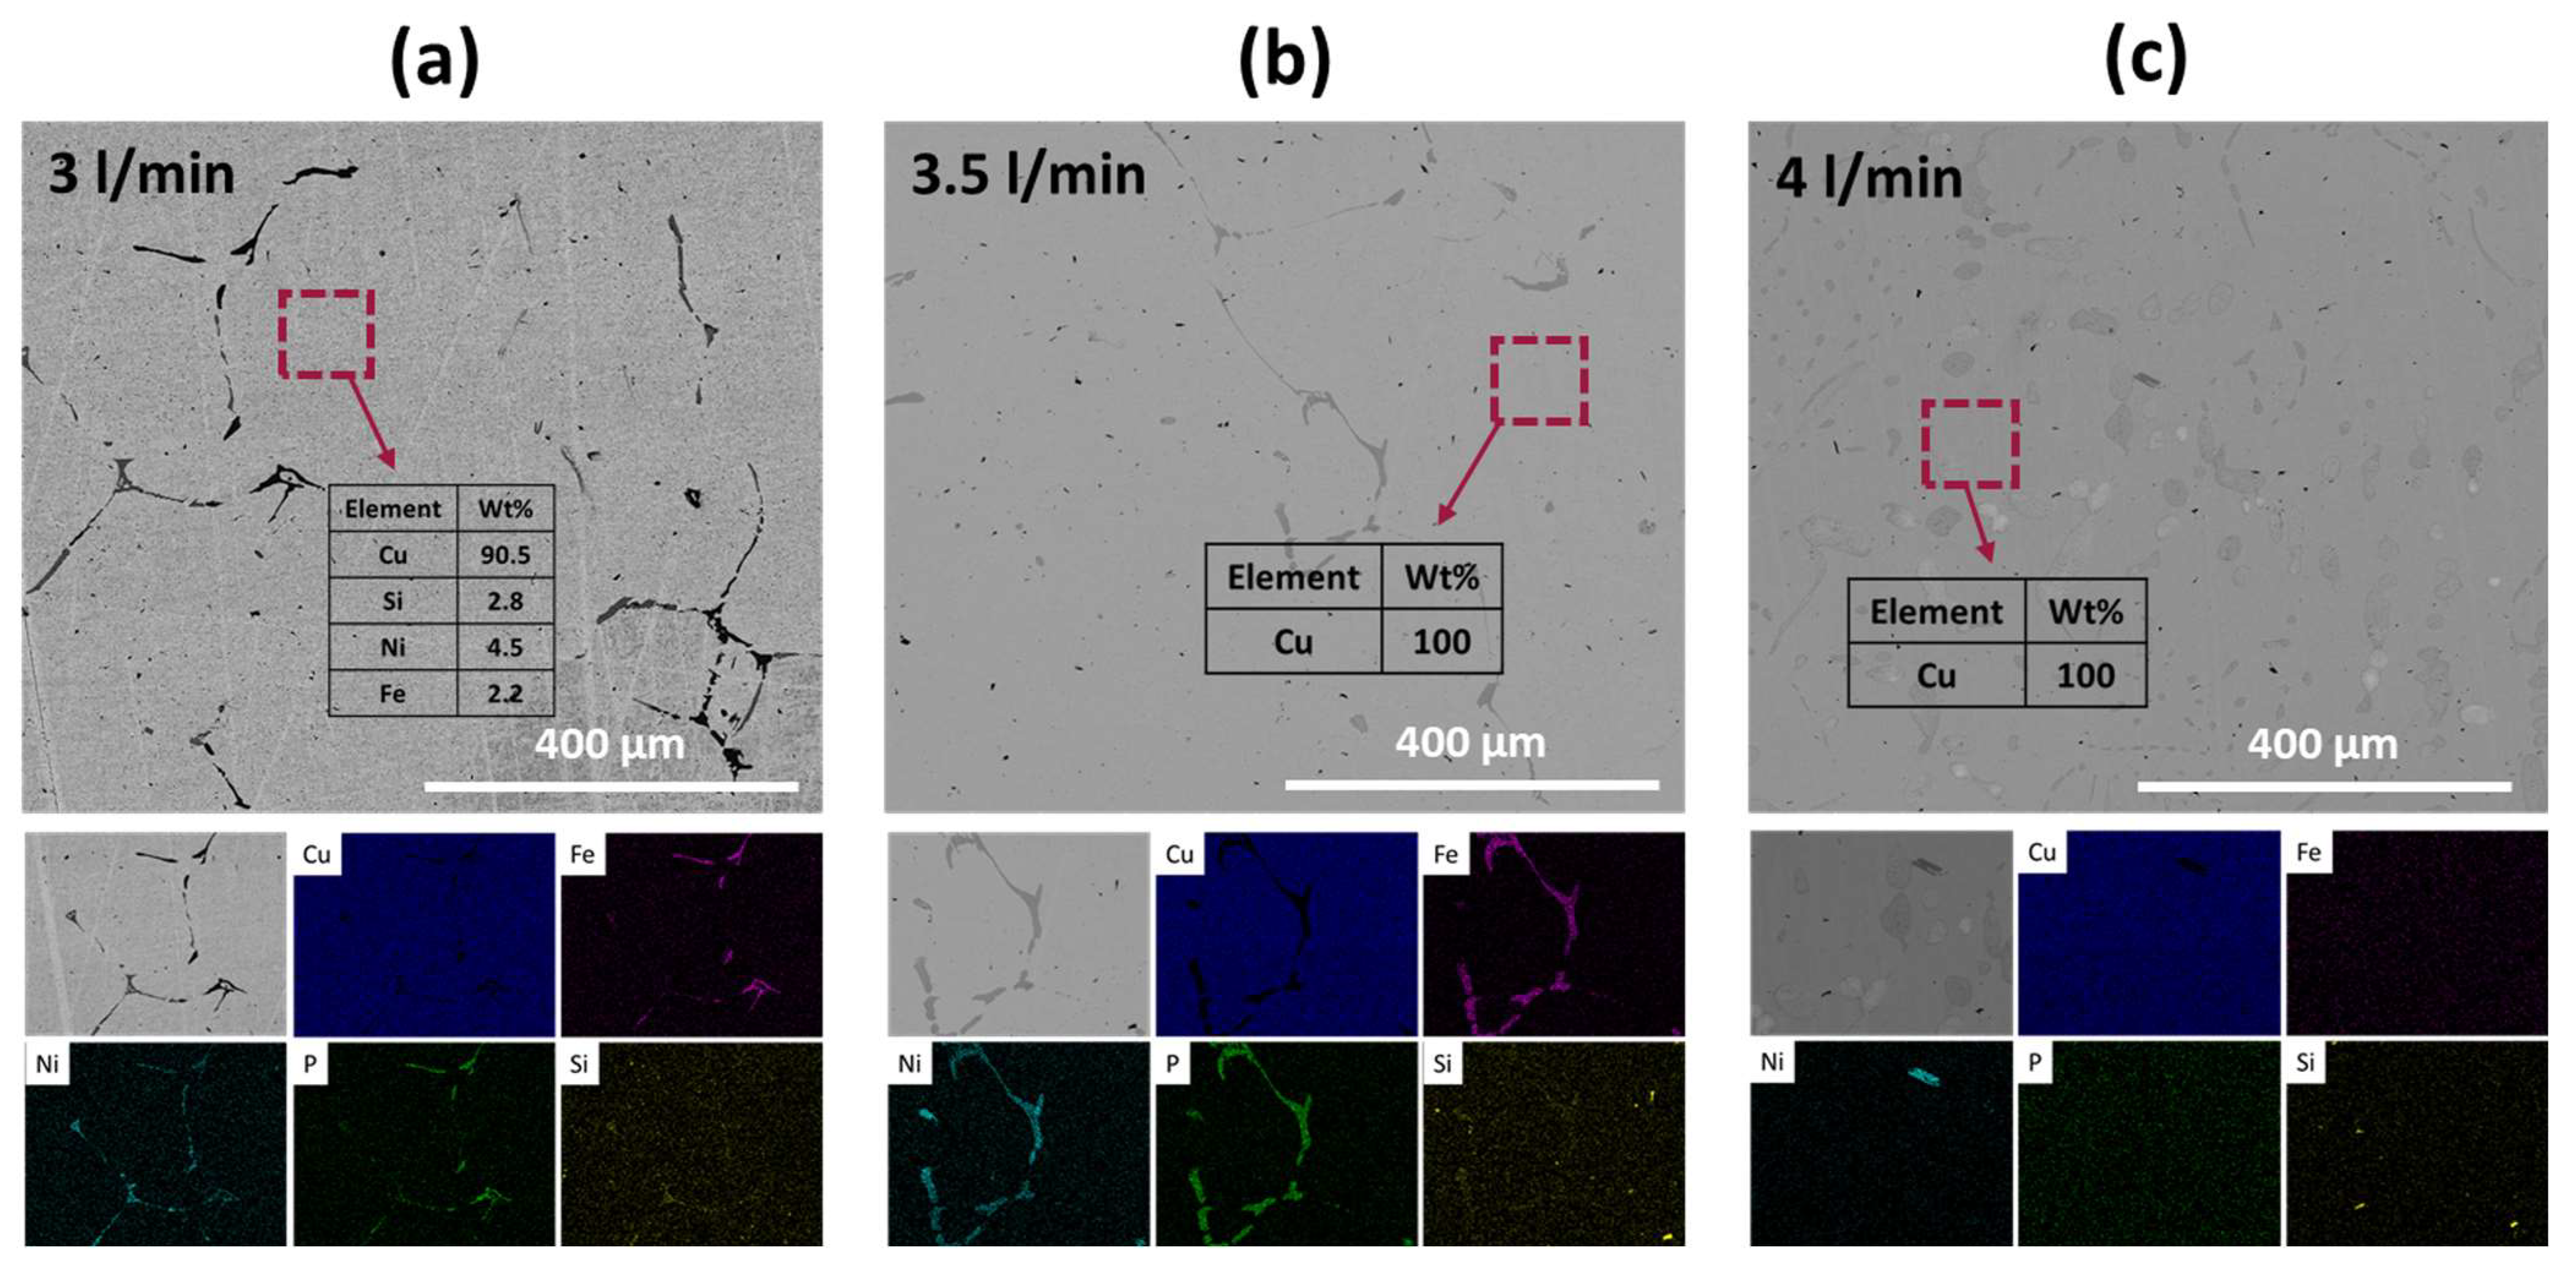
The micrographs and EDX results of the refined metals are presented in
Figure 6. In
Figure 6a, which corresponds to the metals refined with a gas flow rate of 3 L/min, similar observations to those discussed in
Figure 4 were made. Black and dark gray phases, indicative of Fe-rich and Ni-rich phases, respectively, were observed along the Cu grains. Additionally, the Cu grains contained small amounts of impurities such as Si, Ni, and Fe. Conversely, in the sample refined with a gas flow rate of 3.5 L/min, no other elements were detected within the Cu grains. The volume fractions of Fe-rich and Ni-rich phases along the Cu grains were significantly reduced, with no distinct separation between the two phases. Furthermore, when the total flow rate was increased to 4 L/min, Fe-rich or Ni-rich phases were barely observed, and no impurities were detected within the Cu grains. Therefore, the increase in gas injection pressure effectively decreased impurities such as Fe, Ni, Si, and P.
The compositions of the metal and slag obtained from the refining process were analyzed using WD-XRF analysis, as shown in
Figure 7a,b, respectively. With an increase in the total gas flow rate, the Cu content in the metal significantly increased. Conversely, the contents of Si, Ni, Fe, and P decreased. For the sample refined with a total gas flow rate of 4 L/min, the impurity contents were greatly reduced to below 1 wt.%, and some impurities such as Fe, P, Pb, Al, and Sn were not detected at all. In the slags, the CuO content did not show significant changes with an increase in the total gas flow rate. However, the contents of Fe
2O
3, NiO, and P
2O
5 gradually increased as the total gas flow rate increased. In conclusion, as the total gas flow rate increased, impurities such as Fe, Ni, and P were selectively oxidized and transferred from the metal layer to the slag layer.
Figure 7c illustrates the XRD patterns of the slag obtained from the refining process. All obtained slags exhibited prominent peaks corresponding to the Cu
2O phase, indicating its predominant formation. Additionally, diffraction peaks corresponding to CuO, SiO
2, and Fe
2SiO
4 were observed. In the sample refined with a total gas flow rate of 4 L/min, diffraction peaks of Fe
3O
4 were also detected. These findings suggest that during the early stages of the refining process, Fe and Si were oxidized, leading to the formation of an Fe
2SiO
4 composite. It can be assumed that the oxidation of Fe facilitated the removal of Si from the metal layer and the subsequent formation of the Fe
2SiO
4 phase, as reported by Uchikoshi et al. [
28]. As the process progressed, the remaining Fe underwent further oxidation, resulting in the formation of Fe
3O
4. Therefore, supplying the injected gas at a high pressure is necessary to achieve complete oxidation of the Fe element.
Increased gas pressure accelerated the refining process. This improvement was due to the enhanced distribution of the mixed O2/N2 gas within the melt at higher pressures, leading to accelerated oxidation reactions. The higher gas pressure promotes a more efficient removal of impurities, such as Ni, P, Si, and Fe, resulting in a more refined and purified metal product.
3.4. Effect of Oxidative Refining Process Temperature
In the previous sections, influences of the refining process time and total gas pressure were clarified. However, the concentration of precious metals was not significantly increased. Further study of temperature control was necessary, as this might reduce the viscosity of Cu melt, which renders easier movement of precious metals between molten slag and liquid metal [
29]. The process temperature was increased from 1300 °C to 1400 °C, but the process time and total gas pressure were maintained as 40 min and 4 L/min, respectively.
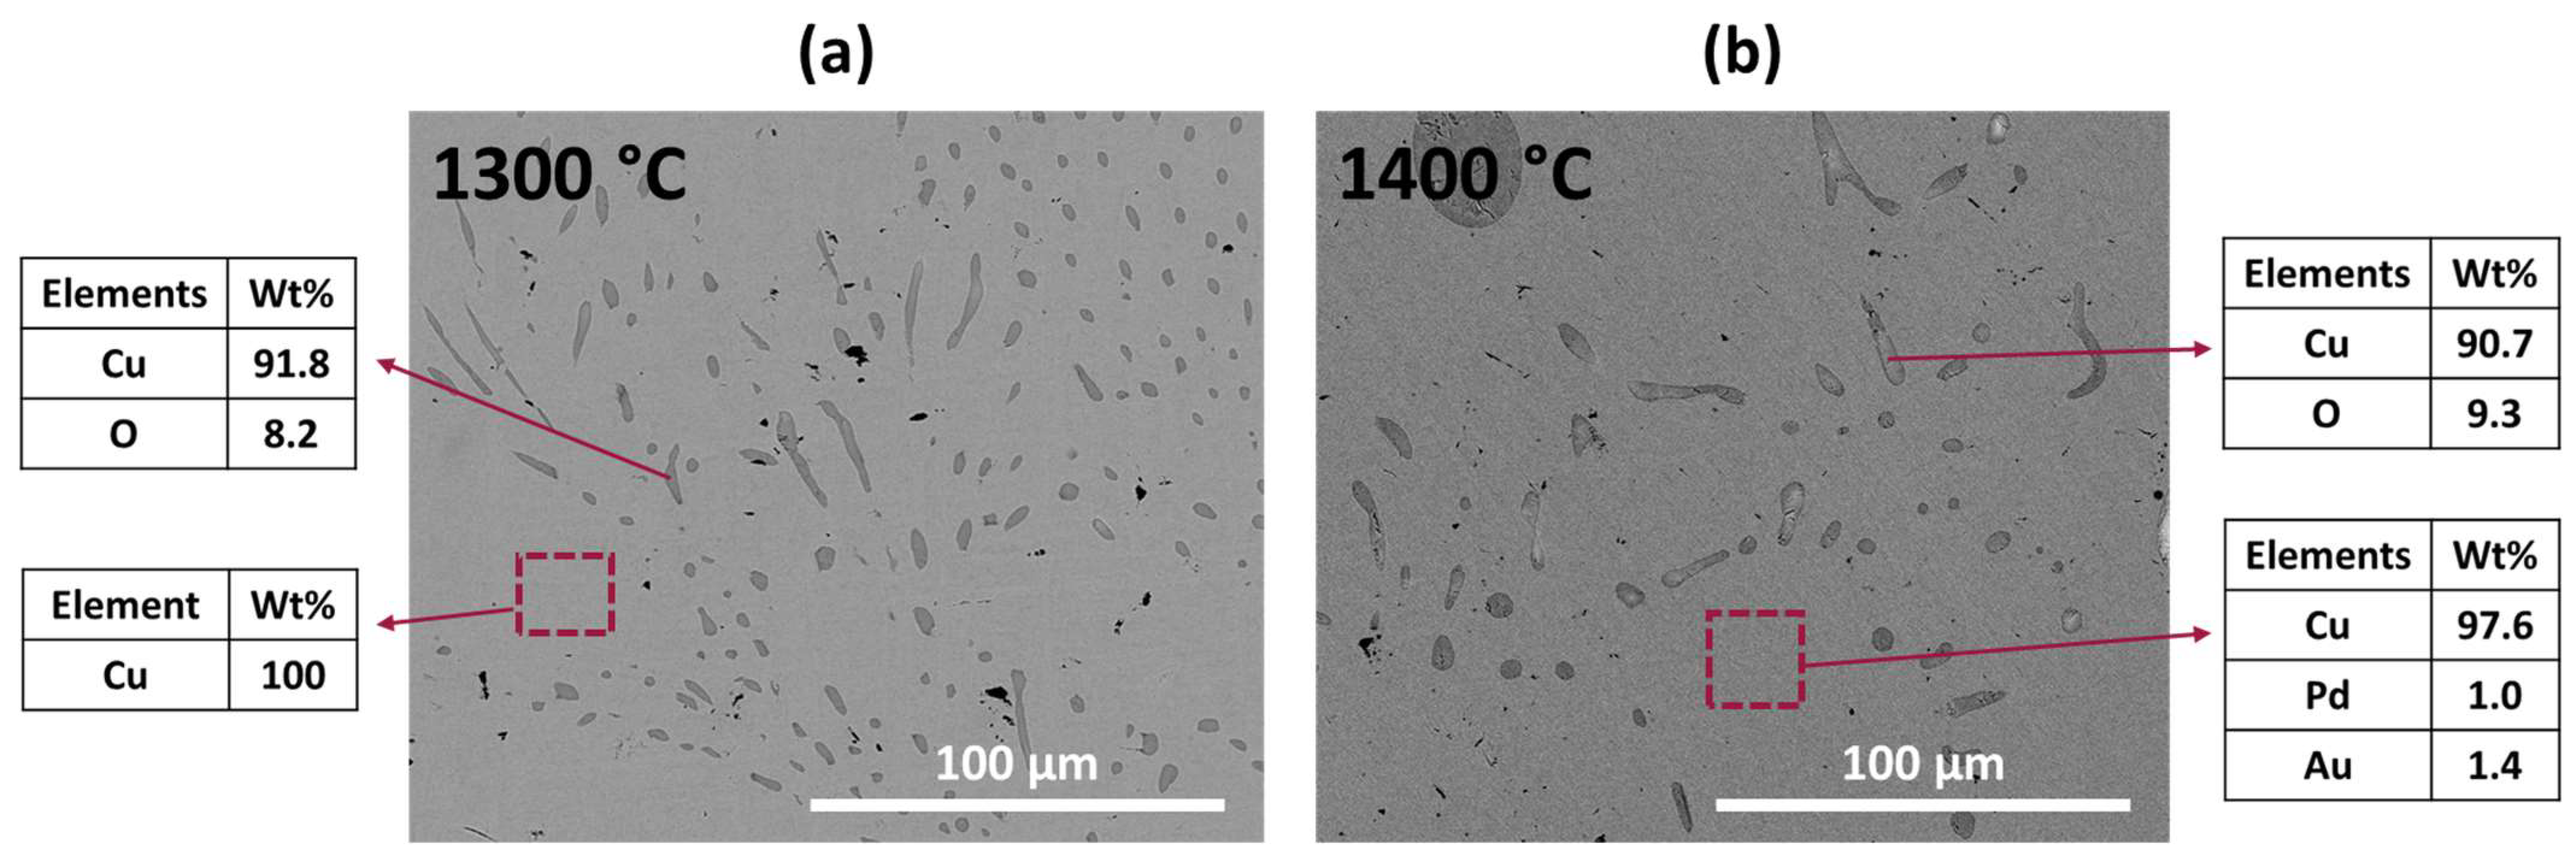
The microstructure and EDX results of the recovered metals are presented in
Figure 8. As shown in
Figure 8a, the EDX measurement detected only Cu in the recovered metal after refining at 1300 °C. However, for the recovered metal refined at 1400 °C, in addition to Cu, significant amounts of Pd and Au were observed through EDX analysis, as shown in
Figure 8b, indicating the remarkable concentration of precious metals within the recovered metal. This observation highlights the effectiveness of the refining process at 1400 °C in enriching the recovered metal with valuable Pd and Au. No other phases, such as Fe-rich or Ni-rich phases, were observed, while Cu oxides were formed and distributed within the Cu matrix phase.
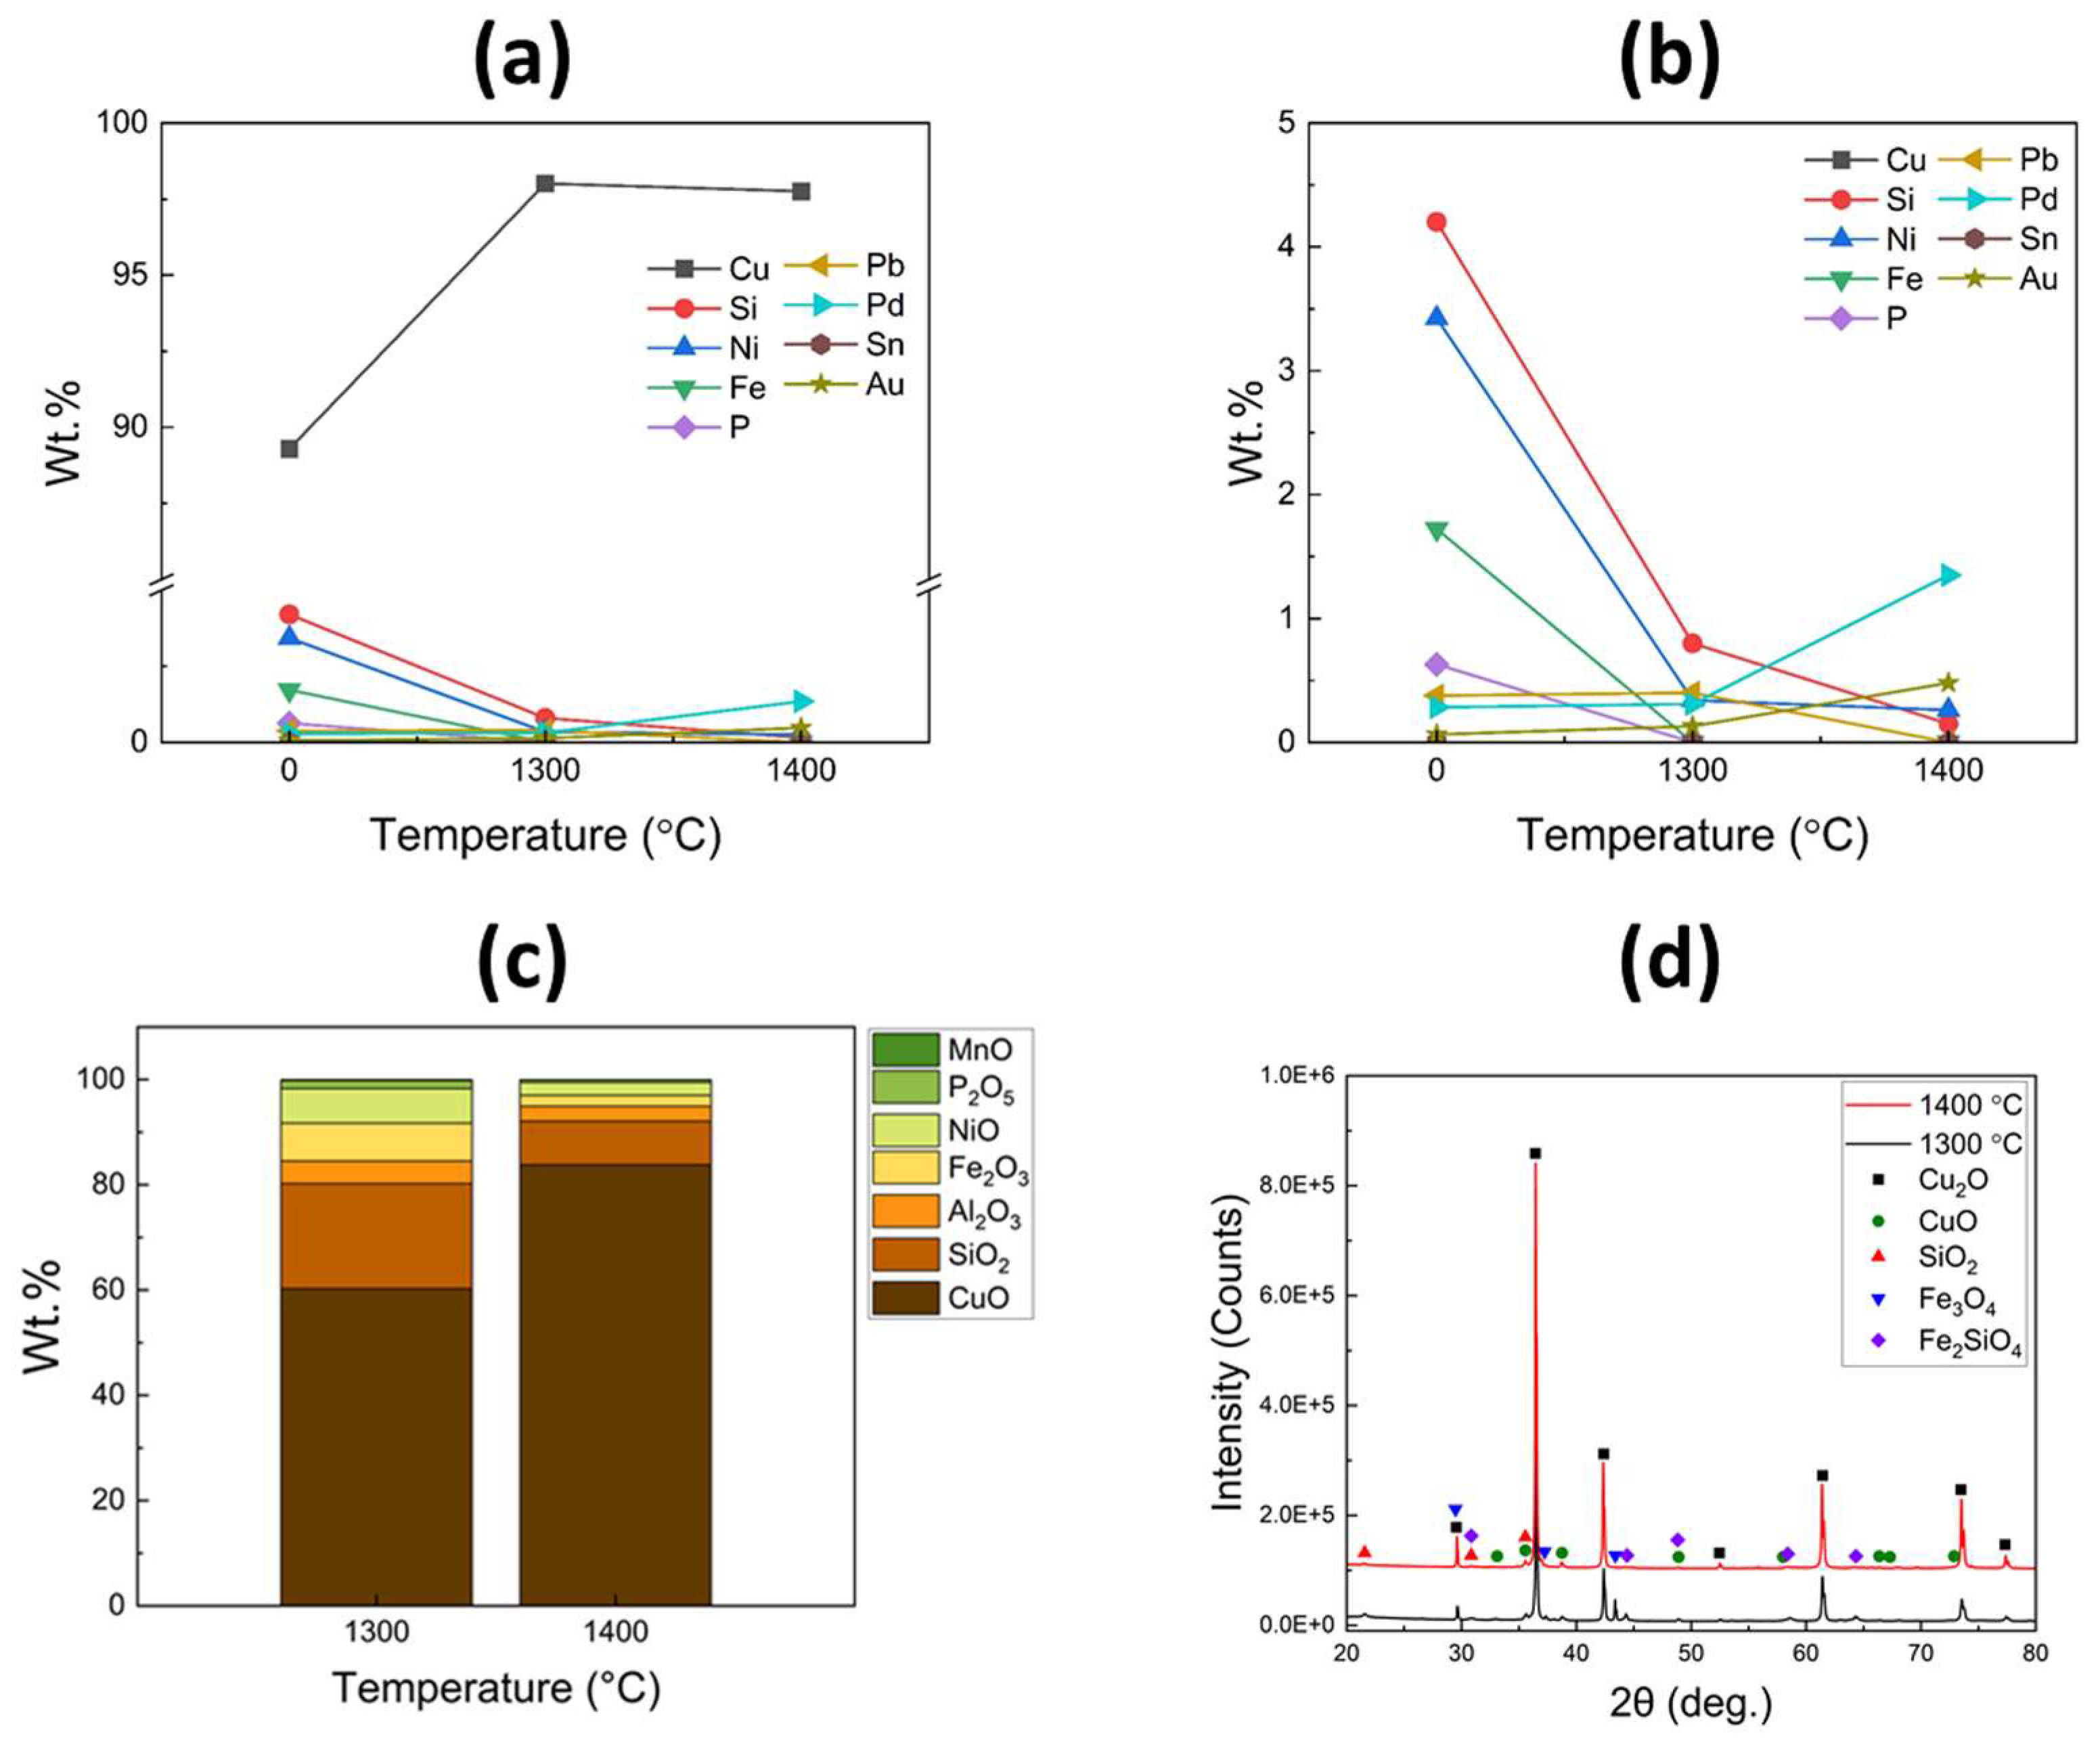
Figure 9a presents the XRF analysis results of the recovered metals from the refining process, while an enlarged image is displayed in
Figure 9b. Upon refining at 1300 °C, a significant increase in Cu content was observed, indicating successful reduction in impurities such as Fe, Si, Ni, P, and Pb, which oxidized and were separated into the slag layer. Furthermore, there was a slight increase in the contents of Pd and Au, from 0.28 to 0.31 wt.% and from 0.06 to 0.13 wt.%, respectively. When the refining process was conducted at 1400 °C, the impurity levels were further reduced and nearly eliminated, reaching below 0.5 wt.%. In contrast, the contents of Pd and Au exhibited substantial increases, reaching 1.35 and 0.48 wt.%, respectively. In the slag layer, the content of Cu oxides significantly increased after the refining process at 1400 °C, as shown in
Figure 9c. This finding is consistent with the XRD results presented in
Figure 9d, which indicate the predominant development of diffraction peaks corresponding to the Cu
2O phase with high intensities. Consequently, these results support the conclusion that the Cu melt at higher temperatures can undergo facile oxidation due to its lower viscosity.
3.5. Concentration Behavior of Precious Metals
ICP analysis was performed to quantitatively determine the precious metal contents, and the results are presented in
Figure 10. A 1 g sample was extracted from the recovered metal alloy and then dissolved in a prepared aqua regia solution (HCl:HNO
3 in a 3:1 ratio). Prior to the measurements, standard Pd and Au samples were analyzed for reference purposes. Prior to the refining process, the master alloy contained 0.19 wt.% of Pd and 0.05 wt.% of Au.
Figure 10a depicts the normalized concentration of Pd and Au as a function of the process duration, indicating that their concentrations remained relatively stable with increasing process time. However, when the gas injection pressure was increased, a slight increase in the concentrations of Pd and Au was observed, reaching 0.23 wt.% and 0.08 wt.%, respectively, as shown in
Figure 10b. The influence of process temperature on the concentration of Pd and Au is presented in
Figure 10c. Following the refining process at 1300 °C, the concentrations of Pd and Au exhibited an increase. Subsequently, after refining at 1400 °C, their concentrations were further elevated, reaching 0.57 wt.% and 0.22 wt.%, respectively. These results demonstrate the successful concentration of Pd and Au elements through the oxidative refining process at 1400 °C.
4. Conclusions
In conclusion, this study provides valuable insights into the oxidative refining process applied to metals recovered from waste PCBs and lead frames. The results demonstrate the significant impact of various parameters on the efficiency and effectiveness of this refining technique. First and foremost, our study uniquely utilized real electronic scraps, including PCBs and lead frames, providing a direct representation of practical recycling scenarios. This authentic input material enhances the relevance and applicability of our findings in the field of electronic waste recycling.
Importantly, the results showcase that the refining efficiency significantly improves with an increase in the total gas pressure. This observation underscores the critical role of gas distribution within the melt for accelerating oxidation reactions, which is a key insight derived from our study. Furthermore, our comprehensive analysis, including XRD and XRF, reveals the formation of copper oxides in the slag and the selective oxidation of impurities such as Fe, Ni, Si, and P. Most notably, our study successfully achieved the concentration of precious metals, namely Pd and Au, through the refining process, particularly at a higher temperature of 1400 °C.
In summary, this work not only contributes to the understanding of oxidative refining processes but also presents a practical and scalable approach to electronic waste recycling. The optimized refining conditions defined in this study, namely, an oxidative refining process with a N2/O2 mixed gas pressure of 4 L/min (with 2.5 L/min and 1.5 L/min of O2 and N2, respectively), a process time of 40 min, and a temperature of 1400 °C, hold great promise for reducing impurities and concentrating precious elements. The merits of our work lie in its real-world applicability and holistic approach to electronic waste recycling, making it a valuable contribution to the field.
Author Contributions
Conceptualization, Y.-H.K.; methodology, E.P. and M.-W.P.; investigation, E.P., M.K. and M.-W.P.; data curation, E.P., M.K. and M.-W.P.; writing—original draft preparation, E.P.; writing—review and editing, H.P.; visualization, E.P.; supervision, Y.-H.K.; project administration, Y.-H.K.; funding acquisition, Y.-H.K. All authors have read and agreed to the published version of the manuscript.
Funding
This research received no external funding.
Data Availability Statement
The data that support the findings of this study are available from the corresponding author upon reasonable request.
Acknowledgments
This work was supported by the Korea Institute of Energy Technology Evaluation and Planning (KETEP) grant funded by the Korea government (MOTIE) (20217510100080, Development of critical metal recovery technologies (capacity of 200 kg/day) from low grade solid wastes for the foundation of open access recycling platform).
Conflicts of Interest
The authors declare no conflict of interest.
Appendix A
The patterns of EDX analysis were presented.
Figure A1.
Patterns of the EDX results of the master alloy shown in
Figure 2. (
a) Inside of Cu grain, (
b,
c) grain boundaries.
Figure A1.
Patterns of the EDX results of the master alloy shown in
Figure 2. (
a) Inside of Cu grain, (
b,
c) grain boundaries.
Figure A2.
Patterns of the EDX results of refined metals depending on the refining process time, shown in
Figure 4. (
a) 10 min, (
b) 30 min, and (
c) 40 min.
Figure A2.
Patterns of the EDX results of refined metals depending on the refining process time, shown in
Figure 4. (
a) 10 min, (
b) 30 min, and (
c) 40 min.
Figure A3.
Patterns of the EDX results of recovered metals after refining process, shown in
Figure 6. (
a) 3 L/min, (
b) 3.5 L/min, and (
c) 4 L/min of total gas pressure.
Figure A3.
Patterns of the EDX results of recovered metals after refining process, shown in
Figure 6. (
a) 3 L/min, (
b) 3.5 L/min, and (
c) 4 L/min of total gas pressure.
Figure A4.
Patterns of the EDX results of the recovered metals after refining process at (
a) 1300 °C and (
b) 1400 °C, shown in
Figure 6.
Figure A4.
Patterns of the EDX results of the recovered metals after refining process at (
a) 1300 °C and (
b) 1400 °C, shown in
Figure 6.
References
- Cucchiella, F.; D’Adamo, I.; Lenny Koh, S.C.; Rosa, P. Recycling of WEEEs: An economic assessment of present and future e-waste streams. Renew. Sustain. Energy Rev. 2015, 51, 263–272. [Google Scholar]
- Cui, J.; Zhang, L. Metallurgical recovery of metals from electronic waste: A review. J. Hazard. Mater. 2008, 158, 228–256. [Google Scholar] [CrossRef] [PubMed]
- Tabelin, C.B.; Park, I.; Phengsaart, T.; Jeon, S.; Villacorte-Tabelin, M.; Alonzo, D.; Yoo, K.; Ito, M.; Hiroyoshi, N. Copper and critical metals production from porphyry ores and E-wastes: A review of resource availability, processing/recycling challenges, socio-environmental aspects, and sustainability issues. Resour. Conserv. Recycl. 2021, 170, 105610. [Google Scholar]
- Stratiotou Efstratiadis, V.; Michailidis, N. Sustainable Recovery, Recycle of Critical Metals and Rare Earth Elements from Waste Electric and Electronic Equipment (Circuits, Solar, Wind) and Their Reusability in Additive Manufacturing Applications: A Review. Metals 2022, 12, 794. [Google Scholar]
- Kiddee, P.; Naidu, R.; Wong, M.H. Electronic waste management approaches: An overview. Waste Manag. 2013, 33, 1237–1250. [Google Scholar] [PubMed]
- Kumari, R.; Samadder, S.R. A critical review of the pre-processing and metals recovery methods from e-wastes. J. Environ. Manag. 2022, 320, 115887. [Google Scholar]
- Xiao, Q.; Wang, H. Prediction of WEEE Recycling in China Based on an Improved Grey Prediction Model. Sustainability 2022, 14, 6789. [Google Scholar] [CrossRef]
- Forti, V.; Balde, C.P.; Kuehr, R.; Bel, G. The Global E-waste Monitor 2020: Quantities, Flows and the Circular Economy Potential; United Nations University/United Nations Institute for Training and Research: Bonn, Germany; International Telecommunication Union: Geneva, Switzerland; International Solid Waste Association: Rotterdam, The Netherlands, 2020. [Google Scholar]
- Baldé, C.P.; D’Angelo, E.; Deubzer, V.L.O.; Kuehr, R. Global Transboundary E-waste Flows Monitor—2022; United Nations Institute for Training and Research (UNITAR): Geneva, Switzerland, 2022. [Google Scholar]
- Ikhlayel, M. Environmental impacts and benefits of state-of-the-art technologies for E-waste management. Waste Manag. 2017, 68, 458–474. [Google Scholar] [CrossRef]
- Ciacci, L.; Vassura, I.; Passarini, F. Urban Mines of Copper: Size and Potential for Recycling in the EU. Resources 2017, 6, 6. [Google Scholar] [CrossRef]
- Gorewoda, T.; Eschen, M.; Charasińska, J.; Knapik, M.; Kozłowicz, S.; Anyszkiewicz, J.; Jadwiński, M.; Potempa, M.; Gawliczek, M.; Chmielarz, A.; et al. Determination of Metals’ Content in Components Mounted on Printed Circuit Boards from End-of-Life Mobile Phones. Recycling 2020, 5, 20. [Google Scholar] [CrossRef]
- Martinez-Ballesteros, G.; Valenzuela-García, J.L.; Gómez-Alvarez, A.; Encinas-Romero, M.A.; Mejía-Zamudio, F.A.; Rosas-Durazo, A.d.J.; Valenzuela-Frisby, R. Recovery of Ag, Au, and Pt from Printed Circuit Boards by Pressure Leaching. Recycling 2021, 6, 67. [Google Scholar]
- Petter, P.M.H.; Veit, H.M.; Bernardes, A.M. Evaluation of gold and silver leaching from printed circuit board of cellphones. Waste Manag. 2014, 34, 475–482. [Google Scholar] [CrossRef] [PubMed]
- Bidini, G.; Fantozzi, F.; Bartocci, P.; D‘Alessandro, B.; D‘Amico, M.; Laranci, P.; Scozza, E.; Zagaroli, M. Recovery of precious metals from scrap printed circuit boards through pyrolysis. J. Anal. Appl. Pyrolysis 2015, 111, 140–147. [Google Scholar]
- Wang, H.; Zhang, S.; Li, B.; Pan, D.a.; Wu, Y.; Zuo, T. Recovery of waste printed circuit boards through pyrometallurgical processing: A review. Resour. Conserv. Recycl. 2017, 126, 209–218. [Google Scholar]
- Ebin, B.; Isik, M.I. Chapter 5—Pyrometallurgical Processes for the Recovery of Metals from WEEE. In WEEE Recycling; Chagnes, A., Cote, G., Ekberg, C., Nilsson, M., Retegan, T., Eds.; Elsevier: Amsterdam, The Netherlands, 2016; pp. 107–137. [Google Scholar]
- Harvey, J.-P.; Courchesne, W.; Vo, M.D.; Oishi, K.; Robelin, C.; Mahue, U.; Leclerc, P.; Al-Haiek, A. Greener reactants, renewable energies and environmental impact mitigation strategies in pyrometallurgical processes: A review. MRS Energy Sustain. 2022, 9, 212–247. [Google Scholar]
- Han, C.; Kim, Y.H.; Kim, D.G.; Lee, M.S. Effect of flux on the Recovery Behavior of valuable Metals during the Melting Process of Aluminum Can Scrap. Arch. Metall. Mater. 2021, 66, 1023–1027. [Google Scholar]
- Moon, T.B.; Han, C.; Hyun, S.-K.; Park, S.C.; Son, S.H.; Lee, M.S.; Kim, Y.H. Study on Recovery of valuable Metals in Spent Lithium-ion Batteries by Al2O3-SiO2-CaO-Fe2O3 Slag System. Arch. Metall. Mater. 2021, 66, 983–986. [Google Scholar]
- Khaliq, A.; Rhamdhani, M.A.; Brooks, G.; Masood, S. Metal Extraction Processes for Electronic Waste and Existing Industrial Routes: A Review and Australian Perspective. Resources 2014, 3, 152–179. [Google Scholar] [CrossRef]
- Chen, M.; Avarmaa, K.; Klemettinen, L.; O’Brien, H.; Shi, J.; Taskinen, P.; Lindberg, D.; Jokilaakso, A. Precious Metal Distributions Between Copper Matte and Slag at High PSO2 in WEEE Reprocessing. Metall. Mater. Trans. B 2021, 52, 871–882. [Google Scholar] [CrossRef]
- Avarmaa, K.; O’Brien, H.; Klemettinen, L.; Taskinen, P. Precious metal recoveries in secondary copper smelting with high-alumina slags. J. Mater. Cycles Waste Manag. 2020, 22, 642–655. [Google Scholar]
- Avarmaa, K.; Johto, H.; Taskinen, P. Distribution of Precious Metals (Ag, Au, Pd, Pt, and Rh) Between Copper Matte and Iron Silicate Slag. Metall. Mater. Trans. B 2016, 47, 244–255. [Google Scholar] [CrossRef]
- You, B.-D.; Park, K.-Y.; Pak, J.-J.; Han, J.-W. Oxygen refining of molten high-carbon ferromanganese. Met. Mater. 1999, 5, 395–399. [Google Scholar] [CrossRef]
- Ellingham, H.J. Reducibility of oxides and sulphides in metallurgical processes. J. Soc. Chem. Ind 1944, 63, 125–160. [Google Scholar]
- Rom’an-Moguel, G.J.; Olvera, F.; Aguirre, S.; S’anchez, B. Refining Copper Scrap by Gas Injection. JOM 1988, 40, 38–40. [Google Scholar] [CrossRef]
- Uchikoshi, M.; Imai, K.; Mimura, K.; Isshiki, M. Oxidation refining of iron using plasma-arc melting. J. Mater. Sci. 2008, 43, 5430–5435. [Google Scholar] [CrossRef]
- Konstantinova, N.Y.; Popel’, P.S.; Yagodin, D.A. The kinematic viscosity of liquid copper-aluminum alloys. High Temp. 2009, 47, 336–341. [Google Scholar] [CrossRef]
| Disclaimer/Publisher’s Note: The statements, opinions and data contained in all publications are solely those of the individual author(s) and contributor(s) and not of MDPI and/or the editor(s). MDPI and/or the editor(s) disclaim responsibility for any injury to people or property resulting from any ideas, methods, instructions or products referred to in the content. |
© 2023 by the authors. Licensee MDPI, Basel, Switzerland. This article is an open access article distributed under the terms and conditions of the Creative Commons Attribution (CC BY) license (https://creativecommons.org/licenses/by/4.0/).


