Abstract
Circular economy is currently characterized by various definitions, measurement approaches, and critical analyses thereof coexisting alongside each other. Whether the concept eventually prevails or collapses will depend to some extent on our success in harmonizing assessment methods among public, scientific, and private institutions, as well as across different materials and scales. Therefore, in this article, we present a generic material flow analysis framework that might serve as a common basis for circularity assessment, and test it by means of three case studies. It proved impossible to eliminate all subjective assumptions when transforming a real complex system into the generic framework, especially regarding the definition of by-products. However, by introducing subsystems it is at least possible to make such assumptions transparent. Therefore, adequate comparability across regions, materials, and scales is provided. Moreover, the generic system allows for coupled analysis of multiple materials simultaneously so that interactions between them can be studied, as well and a deeper insight into overall sustainability of the system can be gained.
1. Introduction
To date, circular economy (CE) perfectly complies with the characteristics of an umbrella concept which is in the stage of validity challenge [1]. Some praise its potential to reduce the environmental impacts of consumption processes [2], spur the economy [3], and significantly contribute to the achievement of global sustainability [4]. On the other hand, others regard it mainly as a relabeling of long existing practices and/or criticize its failure to account for rebound effects (e.g., when increased recycling reduces production costs and thus spurs consumption), quality rather than quantity of recycling, thermodynamic entropy, and market mechanisms [5,6,7,8]. The main advantage of the concept is its broad applicability on variable scales (from global economy-wide to single firm assessment), in different contexts, and for numerous materials and products. However, this is also its main drawback, because it has led to the coexistence of a wide range of definitions of the terms and indicators for its assessment. Different institutions and academic bodies have sometimes even assigned the same name to differently measured indicators or designated identical measures differently. For instance, the ratio of recycled end of life waste to total material demand is termed α by Cullen [6], and use rate of recovered used products by Hashimoto et al. [9]. Recycling rates, on the other hand, may mean something different for different materials, even if reported by the same institution [10]. This situation might tempt businesses and public organizations to “cherry-pick” weak indicators purporting great progress on CE without requiring real structural changes [8,11], eventually causing the collapse of the concept.
Consequently, increased efforts to classify and harmonize definitions [12,13,14,15,16,17] and indicators [18,19,20,21] surrounding CE have recently been observed in the scientific community. Given the multitude of contexts under which CE can be studied, most authors recommend a dashboard, from which indicators can be selected according to purpose, rather than a one size fits all solution, especially for the micro level [18,20,21,22]. However, real systems are complex and specific, whereas, usually indicators are generally defined, even under similar circumstances, and therefore room for interpretation remains or slight adjustments have to be made. For instance, when calculating the cyclical use rate for the Czech Republic, an indicator developed by the Japanese government for CE assessment [23], Kovanda [24] had to undergo several alterations to the original definition in order to ensure compatibility with local conditions. Nuñez-Cacho et al. [25] recently developed a model for the transition of family businesses to CE, which proves that even differences in factors not predominately associated with CE, such as the ownership structure of a business, may be highly relevant for the outcome of a CE study. Avdiushchenko [22] found that the CE monitoring framework of the European Union, which was developed for implementation at the member states level, was inappropriate for capturing CE effects at the regional and local level. Likewise, problems were noted when transferring monitoring frameworks between China and the EU and also between different regions within the EU, due to different perceptions of CE priorities and indicators which are highly adapted to local geographic, environmental, economic, and social circumstances. Ordóñez et al. [26] encountered similar problems on a micro level, noting that “the lack of comparable inventory systems of all included (urban reuse and remanufacture) initiatives limited the ability to quantitatively analyze environmental impact and economic viability”. Rahman et al. [27] identified variable system boundaries and levels of detail, due to different management regimes and data availability, as a main challenge when comparing phosphorus recycling efficiency in the waste sector of different countries. Therefore, common reference frameworks are essential for the comparability of CE indicators under different circumstances.
With regard to the physical component of CE, material flow analysis (MFA) provides a good basis for such a reference framework. MFA has established itself as one of the main tools in industrial ecology [14,28,29] in global [30,31], national [32,33], sectoral [34,35], and product [36,37] studies, and it is also an essential part of most CE assessments [23,38,39]. In addition, MFA Sankey diagrams have proven particularly effective for public communications [40], which is a crucial feature because CE strategies involve a multitude of stakeholders, including private consumers [13]. If mass flows of a system are organized in a common structure, CE indicators can be defined specifically with regard to these flows. For economy-wide MFA, such schemes and indicator definitions have been available and developed for a long time [30,39,41,42,43], and recently, Pauliuk [20] has proposed a general MFA system at the organizational and product life cycle level. Because they depict the system at a very coarse level, fitting complex systems to this structure remains difficult. On the other hand, comprehensive templates for substance flow analysis (SFA) have, among others, been developed for national phosphorus balances [44,45,46]. Rahman et al. [27] also solved the problem of heterogeneous definitions of the waste sector by aggregating flows and processes to a baseline/standard system. However, when calculating one of the more general CE indicators for such a system, it was not always clear what flows it should be referred to. Moreover, the importance of resource interactions for the achievement of holistic sustainable solutions is increasingly recognized [47,48,49] so that assessment frameworks that are applicable to a multitude of substances are gaining in importance.
To overcome drawbacks of both broad and substance- or sector-specific MFA schemes, a generic, universally applicable structure could be combined with flexible subsystems. Apart from ensuring comparability across substances, regions, and scales, a common reference system may facilitate the development of universally applicable indicators, increase understanding with political and economic decision makers, and therefore strengthen the concept of CE as a whole. Moreover, if CE assessments are based on a common framework, differences in focus become more visible so that mutual learning and broadening of perceptions is encouraged. In this study we analyze such a framework with respect to the depiction of complex systems and its advantages and limits in terms of supporting CE assessment.
2. Materials and Methods
The aim of the generic MFA system described in this study was to provide a common reference for studies on various substances and materials, spatial scales, and regions on the basis of which indicators for CE assessment, as well as for related concepts such as resource efficiency, can be calculated. The characteristics that the framework should exhibit are similar to the ones described by Saidani et al. [50], i.e., systemic, yet adaptive and flexible design, intuitive user interface, and use of a commonly available software. However, while the guidelines for CE frameworks suggested by Saidani and colleagues apply for the assessment of product performance in the context of the three pillars of sustainable development (economic, environmental, and social), the present framework was solemnly based on MFA. Not all of the aspects of sustainability are contained in the concept of CE and not all aspects of CE can be covered by MFA, as will be further discussed in Section 4. Therefore, we regard MFA-based indicators as an integral, yet not sufficient part of a holistic sustainability assessment.
The generic MFA system presented in Section 3 is the optimal variant of an iterative process of transforming three heterogeneous, real MFA systems into a common framework. The system was built in the freeware STAN [51], a balancing and visualization tool for material flow analysis of goods, substances, and energy, which considered data uncertainties through error propagation, data reconciliation, and gross error detection. STAN can be used for both static- and quasi-dynamic analysis and allows studying a system on several levels of detail via the introduction of subsystems. A previous work on the Austrian P-N system 2010–2015 [52] was used as the main case study due to the profound knowledge on the sustainability of current management, its development over time, and potentials for improvement already available. Additional case studies were selected through a literature research using “material flow analysis” and “case study” as search terms. The criteria for selection were treatment of a different material, region and scale other than the case studies already selected, authorship outside the working environment of the authors of the present study, actuality and availability of a closed mass balance depicted in a MFA scheme or sufficient data in tables and/or the main text to compile such a scheme. All case studies are described in more detail in the following sections.
2.1. Austrian P-N System 2010–2015
Apart from the reasons stated above, the Austrian P-N system was selected as a case study because the model entails many of the challenges for transformation into a generic structure described in Section 1. With 194 stocks and 866 flows it is particularly complex, and the management and consumption patterns differ in several ways from the “classical” extraction-manufacture-use-disposal scheme.
Nitrogen (N) and phosphorus (P) are essential nutrients for all living organisms, and therefore the socioeconomic P-N system predominately revolves around the fertilizer and food industries. Unlike most other resources, the majority of N is found in the atmosphere, which is why mining activities are usually negligible. On the other hand, exchanges with natural compartments play an important role in the N system because N takes up multiple chemical forms as it circles through air, water, and terrestrial ecosystems, some of which act as pollutants and/or greenhouse gases [53]. Phosphate rock minerals are the only significant virgin P supply. However, as Austria, like Europe in general (except for Finland), does not dispose of any resources, it has to rely on imports. The declining quality of the mined material and volatile prices have spurred discussion on P scarcity, but excess discharge of P to water bodies and subsequent eutrophication are also looked at with concern [54]. Nonetheless, P- and N-rich flows, such as manure, show high potentials for recovery of energy, water, and biofertilizer, and therefore can be considered as technological nutrients [55].
Figure 1 and Figure 2 depict the initial structure of the system for the year 2015 for P and N, respectively. Note that not all flows and processes of the system are visible in the figures, as they are contained in subsystems.
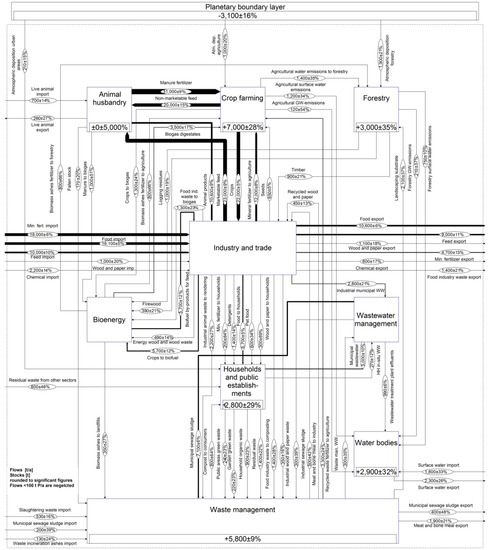
Figure 1.
The Austrian P system 2015.
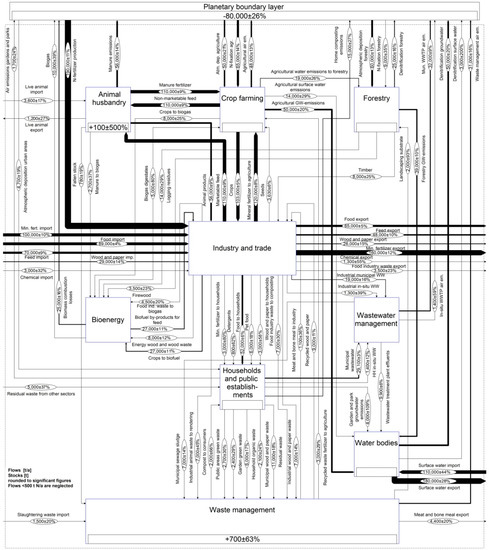
Figure 2.
The Austrian N system 2015.
2.2. European Copper System 2014
The study on copper (Cu) flows in the EU 28 [56] constituted a representation of a “classical” MFA of a highly-recyclable metal resource on a super-national level. Figure 3 shows the MFA flow chart as depicted by Soulier et al. [56].

Figure 3.
Copper stocks and flows in the EU 28 2014 [56].
2.3. Energy Analysis of Karlskoga Combined Heat and Power Plant in Sweden 2016
To further test universal applicability of the generic structure, a plant-scale analysis of energy flows in a Swedish combined heat and power plant (CHP) was chosen as the third case study [57]. The structure of this system is shown in Figure 4. As the mass balance was incomplete, only energy flows were further considered in the present study. When compiling the generic system, numbers given in Figure 4 were supplemented with information from the main text of the article.
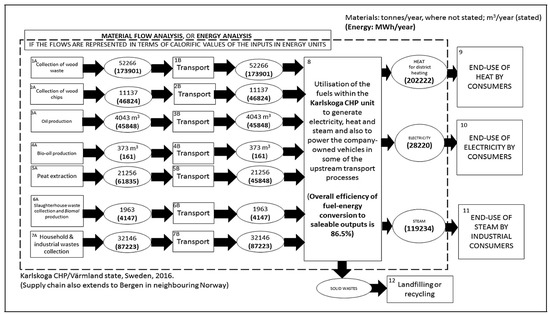
Figure 4.
Material and energy flows of Karlskoga combined heat and power plant 2016 [57].
3. Results
3.1. The Generic Material Flow Analysis Structure
Figure 5 shows the generic structure of a resource system that evolved from the present work. It consists of five processes (one of them situated outside the system boundaries) and 14 flows.
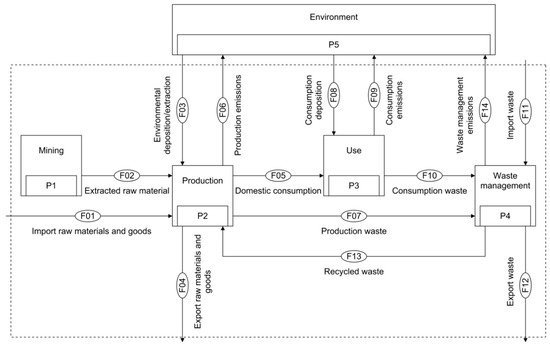
Figure 5.
Generic MFA system. The dashed line marks the system boundaries.
Material can enter the system either through imports (F01, F11) or deposition from the environment (F03, F08). F01 includes the import of raw material, semi-finished products, and goods ready for consumption. However, a distinction with respect to the import of waste material from outside the system (F11) is made as the latter does not enter the production process, unless it is recycled. Input to the production (F03) and use processes (F08) can, for instance, occur in the form of atmospheric deposition or freshwater abstraction. The process “environment” (P5) includes the atmosphere, biosphere, hydrosphere and pedosphere. P5 is situated outside the system boundaries because, while the magnitude of emissions to the environment from production (F06), consumption (F09), and waste management processes (F14) is an essential characteristic of a resource management system, these emissions are commonly regarded as losses or even act as pollutants in the compartment they enter. Furthermore, exchanges of air and water masses across system boundaries are usually difficult to quantify, but only play a minor role for the purpose of the analysis. Although the lithosphere can be regarded as part of the environment, geological reserves are considered separately in P1. This accounts for their importance for the management of resources.
Each process contains a stock (SPx) representing, e.g., geological deposits in P1, production storage in P2 or landfills in P4. During each period of analysis material can either be extracted from the stock () or deposited to the stock ().
The production sector P2 comprises all production steps such as primary production, manufacture, and trade so that “use” in P3 should be considered as end-use only. Hence, F09 and F10 only refer to emissions and wastes that occur during or after, but not prior to consumption. Apart from being consumed, products can be exported to sectors or regions outside the system boundaries. Again, a distinction is made between the export of raw materials and semi-finished and finished goods (F04) and the export of waste (F12). In the case of F04, export, or rather the value created from it, is an explicit reason for production, whereas waste export is mainly a way of disposal. A special case occurs if products or material stemming from recycling are exported. In this case they should first be directed to the production process, where trade is located, as part of F13 and subsequently included in F04. This has for instance been done for wood-, slaughterhouse-, household- and industrial-waste entering the power plant in the Karlskoga case study. It should be noted that depending on the purpose of the study output products may not always be visible in the MFA. This would, for instance, apply to energy and heat production in a mass-based MFA, or in the case of SFA, to any product not containing the substance analyzed.
Disposal in landfills is represented in the stock of the waste management process P4. It is assumed that all recycling takes place in P4, and therefore even if production step B makes direct use of waste from production step A, this waste should both be included in F07 and F13. Similarly, secondhand consumer products are taken into account in F10, F13, and F05.
For example, the aforementioned cyclical use rate, as a CE indicator that could be derived from the generic system, is defined as the amount of cyclical use divided by the sum of cyclical use and natural resources input and could be calculated as in Equation (1).
where Fx and correspond to the mass flows and stock extractions as depicted in Figure 5 (depositions to stocks are regarded as system outputs, and therefore not included in the total mass input). Similarly, socioeconomic cycling rates, quantifying the share of secondary material at system input (ISCr) and system output (OSCr), respectively [43], could be applied as in Equations (2) and (3).
A “classical” recycling rate could be defined as
The idea behind the generic system is that the structure depicted in Figure 5 forms the topmost level, on which comparisons across materials, regions, and scales can be undertaken, whereas, detailed study-specific flows and processes are included as subsystems. An example of such a cascade of subsystems for the Austrian P system is depicted in Figure 6.
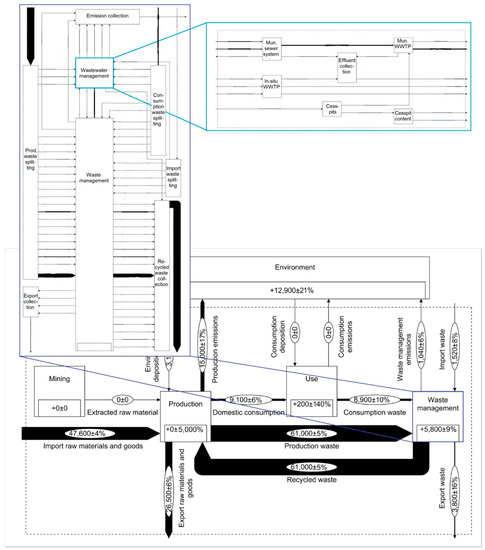
Figure 6.
Cascade of subsystems. Example from the Austrian P system 2015.
3.2. Results of Case Study Transformation
Results of the transformation of the three case studies described in Section 2 into the generic system can be found in Figure 7. A full inventory of subsystems is provided in Appendix A. The schemes depicted in Figure 7 already reveal some of the particularities and management problems of a specific material or setting. For instance, the biomass dominated P-N system is characterized by high exchanges and the environment and recycling seems to play an even larger role than for Cu, which is considered one of the most recycled metals [58]. On the other hand, production appears not to be very efficient as only a small part of input P/N ends up in F05 (domestic consumption). The system boundary in Figure 7d is the Karlskoga plant, thus all electricity, heat, and steam produced leave the system as export, and the use sector is virtually inexistent. According to Karlsson et al. [57], part of the electricity produced is used to power company-owned vehicles, and therefore could be regarded as end-use consumption. However, as no further information on the magnitude and nature of this flow is given, it was neglected in the current study.
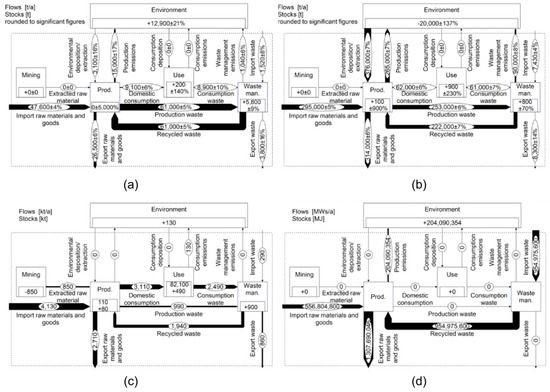
Figure 7.
Generic MFA system of the three case studies: (a) Austrian P-N system–P; (b) Austrian P-N system–N; (c) EU28 copper system; (d) Energy flows in Karlskoga heat and power plant.
4. Discussion
4.1. Transformation Challenges
Although all three case studies could be transformed successfully, flow allocation to one of the aggregate flows of the generic system was not always straightforward and it became clear that to some extent results will always depend on subjective judgments. Therefore, Figure 7 only represents one out of several possible outcomes. The main challenges encountered are described below.
4.1.1. Definition of By-Products
The distinctions among products, by-products, and waste are an issue which is much discussed in MFA. Hashimoto et al. [9] define by-products as “outputs other than the main product, which are produced during the course of producing the main product, …, regardless of their value or of whether they are solid, liquid, or gaseous.” However, they noted that several high-value products can emerge from a production process, which should then be called co-products. The boundary between by-products and co-products is not always clear, especially if the outputs of one process are directly used as input to another production process. Moreover, if recovered products are used within the same production process, they may not be disclosed as separate flows, but “hidden” in improved process efficiency.
Another approach is to differentiate between waste and products according to economic value. However, if waste is perceived as a resource for material or energy and traded on recycling markets, it has an economic value and the distinction becomes once again unclear [7].
For the purpose of the present study, we distinguish between co-products and products, which constitute the reason a production process is undertaken, emissions which are directly discarded to the environment, and waste. Therefore, all by-products are included first in F07 (production waste) and subsequently F13 (recycled waste), even if they are directly utilized in the same or a subsequent production process without physically entering the waste sector. However, the problem of ambiguity between co-products and by-products remains.
This is especially relevant for studies in which biomass flows play an important role, such as manure in the Austrian P-N system. On the one hand, manure constitutes a waste product in animal husbandry which has as its main outputs meat, dairy, and eggs and is considered as recycled waste in this study, according to the assumptions outlined above. On the other hand, due to its widespread use as agricultural fertilizer, and to a lesser extent for biogas production, it may also be classified as a co-product. To complicate matters in the absence of legislative regulation excess manure is often “dumped” on fields irrespective of fertilization needs [59], which may even justify regarding it as an emission to agricultural soil. The high share of recycling in the Austrian P-N system in Figure 7a,b can mainly be attributed to manure classification, as manure makes up half of the mass of F13 for both substances. This may prove problematic because it might conceal the effect of measures to improve nutrient management. For instance, even if the P-recovery from meat and bone meal was raised from a current level of 26% to 100% and a total of 3000 t, which is equivalent to approximately 25% of the current mineral fertilizer demand [52], F13 would merely increase by 5%. Similarly, Kovanda [24] yielded a cyclical use rate for the Czech Republic of 9% if manure was considered in the recycling flow, but only 5% if it was not considered in the recycling flow. This may explain why several authors decided to exclude manure from recycling [27,39,41,60]. If manure was defined as a co-product, it would only be featured on the subsystem level of the generic structure, as can be seen in Figure 8.
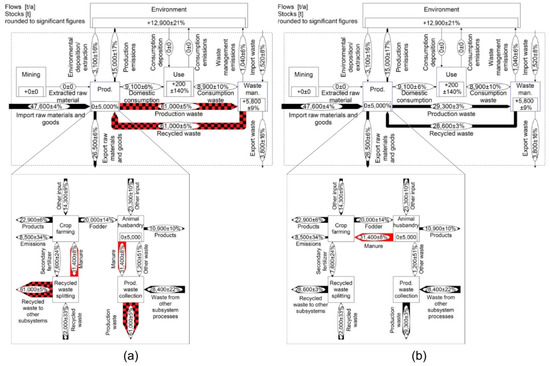
Figure 8.
Comparison of alternate forms of manure definition in the Austrian P system 2015. Generic topmost layer and schematic detail of the subsystem production if (a) manure is defined as recycled waste and (b) as a co-product. Manure flows are marked in red and checkered pattern indicates inclusion of manure.
Although manure is clearly the most relevant example in the present study, room for interpretation in the distinction between co-products and recycled waste also occurs for parts of the output flows from the timber and food industries, such as logging residues and wood chips burned for energy production, whey fed on-farm to cattle, and offal used for pet food production. Like manure, pet excrements on public areas can be regarded as fertilizer and thus recycled waste, which is the perception adopted in the present study. However, as the application is unintentional, they may also be viewed as an emission to soil.
Following a definition by Braungart et al. [61], the UNEP even suggested that all biological nutrients are per se circular flows [62]. Actually, emissions of N2, which constitute the vast majority of atmospheric N emissions, could be viewed as a way of replenishing stocks for future (natural or technical) N-fixation. On the other hand, N and P emitted to water bodies are not readily re-extractable and may even cause severe damage in the form of eutrophication. Thus, substance specification and location within the environment is particularly important for flows of biological nutrients. Differentiating emissions, waste, and recycling can partly reflect this, even if environmental impacts are not explicitly accounted for.
4.1.2. Allocation of Processes to Subsystems
Aggregation ambiguities do not only apply to flows but also to processes of the generic system. For example, the generation of district heat is regarded as a side effect of waste incineration (the main purpose of the process being the disposal of waste), and therefore was included in the waste management sector, while energy production in biomass plants was included in the production sector. However, from a plant perspective, energy generation in the Karlskoga CHP, which is powered by both primary fuels and waste, is regarded as a production process. Similarly, the use of meat and bone meal and sewage sludge as additives in cement and brick production could be considered as recycling from a goods perspective. Nevertheless, this application is treated as an endpoint of waste, similar to landfills, in the case study on the Austrian P-N system, because P incorporated in construction material cannot fulfill its purpose as a nutrient any longer (N is mainly emitted into the atmosphere during the combustion process).
Furthermore, the EU 28 copper system includes a short-term scrap stock, which could alternately be located in the production or the waste management sector. We decided to include it in the production sector, thus regarding recycling as completed when copper enters the short-term scrap stock. This influences C in a temporal manner. In the present case, recycling is higher in the years when material is added to the stock and amounts to 27% of the total material input, whereas, if the scrap stock was considered as a part of the waste management sector, recycling would be higher when material leaves the stock, and in 2014 it would only be 26%.
Once again, allocation proves particularly challenging with regards to biomass flows. Soils used for food and timber production can be regarded either as a production stock, where nutrients are stored for subsequent growing seasons, or as an environmental compartment. The latter view was adopted in the case study on the Austrian P-N system, because the time series of P flows revealed a long-term accumulation in soil [63], which points to a storage in forms that are to a large extent unavailable to plants [64]. If soils were regarded as a stock in the production sector, a considerable shift of 13,000 t P from F06 (production emissions) to SP2 (production stock) would occur. The N system does not change because soil stocks of N are neglected in this study. Private gardens and public parks form a part of the production process in the Austrian P-N system, the main output being home-grown vegetables. However, nowadays vegetable production constitutes only a minor purpose in gardens and parks, and therefore it may also be allocated to the consumption sector. This would entail a shift of mass from F03, F06, and F07 (deposition, emissions, and waste of the production sector) to F08, F09, and F10 (deposition, emissions, and waste of the consumption sector).
4.1.3. Insufficient Flow Definition
Although the generic system was formulated in a very general and coarse way, sometimes information given in the case studies was not detailed enough to allocate flows properly. For instance, in the European copper system Soulier et al. [56] do not differentiate between environmental emissions and landfilled waste. Therefore, additional information had to be obtained from other sources. Bertram et al. [65] estimated that less than 0.5% of copper entering the waste system was lost to the environment, and therefore it was assumed that all losses, except for the flow named “dissipation/abandoned in place” which corresponded to F09, ended up in landfills. Likewise, further information on the source and nature of the flow of wood chips in the Karlskoga CHP [57] might have facilitated the decision whether it should be considered as a primary fuel or waste input. Moreover, in this study, mass flows had to be excluded altogether from the analysis, as they were insufficiently defined.
4.1.4. Implications of Allocation Choices
The significant influence that different interpretations of flow and process allocation have on CE assessment results is demonstrated by the wide range of values that the circularity indicators mentioned in Section 3.1 may take (see Table 1). This is especially true for the Austrian P-N system, where, on the one hand, greater flow differentiation allows for a wider variety of combinations, and on the other hand, large mass flows (i.e., manure and environmental emissions) are particularly ambivalent. By considering all types of soil as part of the environment and consequently inputs to soil as emissions the lowest values of circularity are produced, while at the opposite end of the range all environmental emissions are considered to be a form of recycling. The lower bound in the column “range under common assumption” refers to a case where process allocation is not changed with respect to the assumptions described in Section 3, but where only flows that physically enter the waste management sector are regarded as recycling. In the European copper system, circularity is lower if fabrication scrap is regarded as a co-product, and to a lesser extent, if the scrap stock is located in the waste management sector. High values of circularity result if all flows indicated as “losses” in the paper by Soulier et al. [56] were allocated to emissions, a perception which is mentioned in Section 4.1.3, however, this is not very likely to reflect reality. For the Karlskoga CHP, room for interpretation was only encountered for the input of wood chips, which could either be regarded as product or waste import, and for steam, which could alternately be defined as a co-product or a (recycled) by-product.

Table 1.
Range under all potential and under commonly made assumptions as well as results for the assumptions made in the present analysis for the circularity indicators cyclical use rate (CUR), input socioeconomic cycling rate (ISCr), output socioeconomic cycling rate (OSCr), and recycling rate (RR). Indicator definitions according to Equations (1)–(4).
Table 1 also empahsizes the importance of careful indicator definitions. Although all four indicators measure circularity, in terms of the degree to which the system can be considered to be a closed loop, results vary considerably, depending on whether the mass of recycled materials is related to input of virgin material, waste and emission output, or total system material throughput, as well as whether gross or net inputs are considered. As stated in Section 1, the informative value of an indicator may vary in different circumstances. For instance, in a system where products are quickly transformed into waste, such as the Austrian P-N system, differentiation between CUR and OSCr may be less important than in a system with a considerable buildup of consumption stock. At the level of a production site, where hardly any consumption within the system boundaries occurs, subtraction of export flows, as is the case for ISCr, may not seem reasonable, and for energy flows in incineration plants, where energy is dissipated to the environment rather than collected by the waste system, the calculation of RR is not expedient. Nevertheless, in order to facilitate communication of the CE concept to a broader public, circularity indicators should be harmonized as much as possible. Efforts to improve the meaningfulness of CE indicators are ongoing [8,9,10] and should be continued in the future. However, they will not be explored further in the current study as the focus is on comparability rather than harmonization.
4.2. Advantages of the Generic Structure
The ability to refer complex, differently constructed systems to a common structure facilitates comparability of MFA-based indicators and may thus contribute to clarifying the definition of the CE concept.
Experience gained in the course of this study has shown that each system comes with specific predicaments, and therefore it is deemed impossible to formulate a generic structure that fits all and that eliminates the need for any subjective assumptions. Even if all potential ambiguities could be envisioned in advance, it is not desirable to base assessment on a rather arbitrary selection of one out of several equally valid conventions. This is not only a problem pertaining to material flow analysis. Due to its high computational and data demand, life cycle assessment is often applied in a simplified manner. Simplifications, however, are unique to each situation and need to be based on assumptions. The weighting of different goals against each other is another highly subjective matter [66]. Similarly, Saidani et al. [50] observed that users of CE tools tend to favor middle options in trinary-based questionnaires, while binary scoring systems are often too reductive to represent system complexity adequately. In fact, finding the one “true” model may not even be necessary. As Ashby previously pointed out in 1958 information quantities in complex systems may exceed human capacity [67]. However, even when a system is not fully understood, valuable conclusions can be drawn from its study, if scientists accept that solutions are never final, and only valid until they become obsolete. Under such circumstances it is clear that the transparency of subjective choices is crucial to ensure system comparability. The indicator values in Table 1 do not disclose the assumptions taken to produce them and require further explanation. However, intuitive understanding of whether a flow should be regarded as a co-product or a by-product or where to place a certain process in the generic system often exists, and therefore authors might be tempted to not explicitly state what seems obvious to them. Nevertheless, as Korhonen et al. [7] pointed out, perceptions as to the point at which material with economic value becomes waste with no or negative economic value vary, depending on culture, society, community, history, and level of societal development, and may change over time. Here, the concept of a common structural basis and specification in subsystems, where aggregation choices are automatically disclosed, provides a clear advantage. An account of the underlying system structures, for the numbers shown in Table S1, is given in the Supplementary Material online.
Arguably, transparency of choices could also be achieved by the meticulous documentation of all calculation and aggregation steps, for instance, as has been done by Mayer et al. [43]. However, a multilevel structure is preferable because it facilitates uncertainty assessment. STAN, the software applied in the present study, uses weighted least square minimization for data reconciliation and error propagation [68], which means that flows of the balanced system, respectively their uncertainties, are correlated [69]. Therefore, propagation of data uncertainties for manual flow aggregation is very complex, as Equation (5), where sagg. and si stand for the standard uncertainties of the aggregated, and individual flows, respectively, is only applicable to independent values of si.
This problem can be avoided if calculation, data reconciliation, and flow aggregation are performed in a single step, as is the case for the generic system. To illustrate this, Table 2 summarizes independent input data and reconciled values for F03 “environmental deposition/extraction” of the Austrian N system in two circumstances. In the first, reconciled flows are manually aggregated from the original structure [52], using Equation 5 as a proxy for the standard uncertainty, whereas, in the second the generic structure and subsystems are applied. As both systems use the same input data, results after data reconciliation for individual flows are identical. However, manual flow aggregation overestimates true uncertainty of F03.
Table 2.
Input data and reconciled values for environmental deposition/extraction in the Austrian N system when manually aggregating individual flows, using Equation 5 as a proxy for standard uncertainty and when computing value and uncertainty of the aggregated flow in the generic structure using subsystems.
The importance of resource interactions is increasingly recognized in the scientific community [47,48,49]. The study of such interactions is encouraged in the system structure presented here since goods and multiple substances can be added as different layers of the same system and balanced simultaneously. Therefore, co-benefits and trade-offs can be directly accounted for. Contrary to economy-wide MFA, where resource differentiation is usually carried out at a rather coarse level, such as that of biomass, metals, construction minerals, and fossil fuels [43,70,71], the generic system described here enables the study of total mass as well as a focus on individual resources of particular interest.
Furthermore, awareness for the necessity of an integrated supply chain management, and therefore joint consideration of product, process, and system level over multiple life cycles is growing [66]. Both these aspects are supported by the multilevel structure of the generic framework and the possibility for multiyear assessment, respectively.
Finally, the consistent application of a common reference framework during the system design may help to avoid incomplete balances, as was the case for mass flows in the Karlskoga CHP.
4.3. Limitations
As previously mentioned in Section 2, the generic MFA structure presented in this study is intended to support CE, resource efficiency, and sustainability assessment, while it cannot fully abolish the need to take other factors into account.
CE indicators increasingly recognize aspects of product lifetime and environmental impacts [72,73,74], especially at a product and company level. Mayer et al. [43] argue that strategies like extended product lifetime, reuse, and sharing find expression in lower in-use stock growth and are thus indirectly measurable by means of MFA. Similarly, MFA-based extended statistical entropy analysis can provide insights into the environmental impacts of emissions of different materials [75]. Nevertheless, both in-use stock growth and statistical entropy should only be used as the first estimates on the basis of which further assessment for in-depth understanding may be conducted.
Other issues that are currently much discussed in CE are entropy and rebound effects. Recycling technologies may require high input of energy so that the environmental net benefits of material recovery may be low [7]. For example, 1.1% of global energy use can be attributed to technical N-fixation via the Haber–Bosch process [76], which should be taken into consideration if atmospheric N2 emissions were to be regarded as a form of circular use. Moreover, cheap secondary materials may increase demand for materials not covered by the analysis or in regions outside its system boundaries or lead to decreased recycling of such materials or in such regions. Market mechanisms play another crucial role, particularly in scenario analysis, because they define the degree to which recycled material is actually used to decrease primary input [5,8]. Furthermore, spatial planning and consideration of transitional costs, such as sinking employment rates in industries that find themselves in competition with CE-based alternatives, are essential for successful CE implementation [22]. These aspects are currently not reflected in MFA.
5. Conclusions and Outlook
In the present study, we tried to circumvent the problem of finding a universal CE indicator that respects the broad applicability of the concept using a MFA structure that could serve as a common reference framework at the topmost level, while enabling consideration of case-specific flows and processes in subsystems. Consistent implementation of a generic framework like the one presented in this study is highly valuable for a meaningful use of circularity indicators. As heterogeneous, complex systems will always leave room for interpretation during flow aggregation and process allocation, the transparent nature of the system turned out to be the main advantage of the generic system. By enhancing comparability of existing CE assessments across regions, materials, and scales, the framework may contribute to their eventual harmonization, and thus to the strengthening of the concept. Irrespective of this, it is evident that other factors apart from MFA, such as value durability, rebound effects, and economic market mechanisms, have to be taken into account for a comprehensive understanding of overall system sustainability.
Therefore, further work could focus on integrating the generic MFA structure into more holistic CE frameworks like the one developed by Cavaleiro de Ferreira and Fuso-Nerini for the city level [77], or on the level of businesses, the sustainability assessment scheme over different dimensions of capital by Van Deventer and Snyman [78], and the concept of technical exchange capacity in an industrial symbiosis network described by Fraccascia et al. [79]. Moreover, the potential of possibly using the coupled resource analysis within the generic MFA framework for ensuring comparability of CE indicators that cut across materials and substances, such as applied by [55,80], could be explored.
Supplementary Materials
The following are available online at https://www.mdpi.com/2313-4321/4/2/23/s1, Table S1: Results for circularity indicators under different assumptions regarding flow allocation in the generic system.
Author Contributions
Conceptualization, J.T. and H.R.; methodology, J.T. and H.R.; validation, J.T. and H.R.; formal analysis, J.T.; investigation, J.T.; resources, H.R.; writing—original draft preparation, J.T.; writing—review and editing, J.T. and H.R.; visualization, J.T.; supervision, H.R.; project administration, H.R.; funding acquisition, H.R.
Funding
This research was funded by the Austrian Science Funds (FWF) as part of the Vienna Doctoral Programme on Water Resource Systems, grant number DK-plus W1219-N22.
Conflicts of Interest
The authors declare no conflict of interest.
Appendix A
Figure A1, Figure A2, Figure A3, Figure A4, Figure A5, Figure A6, Figure A7, Figure A8, Figure A9 and Figure A10 show the subsystems of the generic system for all three case studies.

Figure A1.
Austrian P system 2015, subsystem production.

Figure A2.
Austrian P system 2015, subsystem use.

Figure A3.
Austrian P system 2015, subsystem waste management.

Figure A4.
Austrian N system 2015, subsystem production.

Figure A5.
Austrian N system 2015, subsystem use.

Figure A6.
Austrian N system 2015, subsystem waste management.

Figure A7.
EU 28 Cu system 2014, subsystem production.

Figure A8.
EU 28 Cu system 2014, subsystem waste management.

Figure A9.
Energy flows of Karlskoga combined heat and power plant, subsystem production.

Figure A10.
Energy flows of Karlskoga combined heat and power plant, subsystem waste management.
References
- Blomsma, F.; Brennan, G. The Emergence of Circular Economy: A New Framing Around Prolonging Resource Productivity. J. Ind. Ecol. 2017, 21, 603–614. [Google Scholar] [CrossRef]
- Blok, K.; Hoogzaad, J.; Ramkumar, S.; Ridley, A.; Srivastav, P.; Tan, I.; Terlouw, W.; de Wit, M. Implementing Circular Economy Globally Makes Paris Targets Achievable; Ecofys & Circle Economy: Utrecht, The Netherlands, 2016. [Google Scholar]
- Beasley, J.; Georgeson, R. Advancing Resource Efficiency in Europe: Indicators and Waste Policy Scenarios to Deliver a Resource Efficient and Sustainable Europe; Arditi, S., Ed.; European Environmental Bureau, Seacourt: Brussels, Belgium, 2014. [Google Scholar]
- Schroeder, P.; Anggraeni, K.; Weber, U. The Relevance of Circular Economy Practices to the Sustainable Development Goals. J. Ind. Ecol. 2018, 23, 77–95. [Google Scholar] [CrossRef]
- Zink, T.; Geyer, R. Circular Economy Rebound. J. Ind. Ecol. 2017, 21, 593–602. [Google Scholar] [CrossRef]
- Cullen, J.M. Circular Economy: Theoretical Benchmark or Perpetual Motion Machine? J. Ind. Ecol. 2017, 21, 483–486. [Google Scholar] [CrossRef]
- Korhonen, J.; Honkasalo, A.; Seppälä, J. Circular Economy: The Concept and its Limitations. Ecol. Econ. 2018, 143, 37–46. [Google Scholar] [CrossRef]
- Geyer, R.; Kuczenski, B.; Zink, T.; Henderson, A. Common Misconceptions about Recycling. J. Ind. Ecol. 2016, 20, 1010–1017. [Google Scholar] [CrossRef]
- Hashimoto, S.; Moriguchi, Y. Proposal of six indicators of material cycles for describing society’s metabolism: From the viewpoint of material flow analysis. Resour. Conserv. Recycl. 2004, 40, 185–200. [Google Scholar] [CrossRef]
- Haupt, M.; Vadenbo, C.; Hellweg, S. Do We Have the Right Performance Indicators for the Circular Economy?: Insight into the Swiss Waste Management System. J. Ind. Ecol. 2017, 21, 615–627. [Google Scholar] [CrossRef]
- Bocken, N.M.P.; Ritala, P.; Huotari, P. The Circular Economy: Exploring the Introduction of the Concept Among S&P 500 Firms. J. Ind. Ecol. 2017, 21, 487–490. [Google Scholar]
- Geissdoerfer, M.; Savaget, P.; Bocken, N.M.P.; Hultink, E.J. The Circular Economy – A new sustainability paradigm? J. Clean. Prod. 2017, 143, 757–768. [Google Scholar] [CrossRef]
- Ghisellini, P.; Cialani, C.; Ulgiati, S. A review on circular economy: The expected transition to a balanced interplay of environmental and economic systems. J. Clean. Prod. 2016, 114, 11–32. [Google Scholar] [CrossRef]
- Kalmykova, Y.; Sadagopan, M.; Rosado, L. Circular economy - From review of theories and practices to development of implementation tools. Resour. Conserv. Recycl. 2018, 135, 190–201. [Google Scholar] [CrossRef]
- Kirchherr, J.; Reike, D.; Hekkert, M. Conceptualizing the circular economy: An analysis of 114 definitions. Resour. Conserv. Recycl. 2017, 127, 221–232. [Google Scholar] [CrossRef]
- Merli, R.; Preziosi, M.; Acampora, A. How do scholars approach the circular economy? A systematic literature review. J. Clean. Prod. 2018, 178, 703–722. [Google Scholar] [CrossRef]
- Murray, A.; Skene, K.; Haynes, K. The Circular Economy: An Interdisciplinary Exploration of the Concept and Application in a Global Context. J. Bus. Ethics 2017, 140, 369–380. [Google Scholar] [CrossRef]
- Elia, V.; Gnoni, M.G.; Tornese, F. Measuring circular economy strategies through index methods: A critical analysis. J. Clean. Prod. 2017, 142, 2741–2751. [Google Scholar] [CrossRef]
- Parchomenko, A.; Nelen, D.; Gillabel, J.; Rechberger, H. Measuring the circular economy - A Multiple Correspondence Analysis of 63 metrics. J. Clean. Prod. 2019, 210, 200–216. [Google Scholar] [CrossRef]
- Pauliuk, S. Critical appraisal of the circular economy standard BS 8001:2017 and a dashboard of quantitative system indicators for its implementation in organizations. Resour. Conserv. Recycl. 2018, 129, 81–92. [Google Scholar] [CrossRef]
- Saidani, M.; Yannou, B.; Leroy, Y.; Cluzel, F.; Kendall, A. A taxonomy of circular economy indicators. J. Clean. Prod. 2019, 207, 542–559. [Google Scholar] [CrossRef]
- Avdiushchenko, A. Toward a circular economy regional monitoring framework for European regions: Conceptual approach. Sustainability 2018, 10, 4398. [Google Scholar] [CrossRef]
- Government of Japan. Fundamental Plan for Establishing a Sound Material-Cycle Society; Ministry of the Environment Government of Japan: Tokyo, Japan, 2013.
- Kovanda, J. Incorporation of recycling flows into economy-wide material flow accounting and analysis: A case study for the Czech Republic. Resour. Conserv. Recycl. 2014, 92, 78–84. [Google Scholar] [CrossRef]
- Núñez-Cacho, P.; Molina-Moreno, V.; Corpas-Iglesias, F.A.; Cortés-García, F.J. Family businesses transitioning to a circular economy model: The case of “Mercadona”. Sustainability 2018, 10, 538. [Google Scholar] [CrossRef]
- Ordóñez, I.; Rexfelt, O.; Hagy, S.; Unkrig, L. Designing Away Waste: A Comparative Analysis of Urban Reuse and Remanufacture Initiatives. Recycling 2019, 4, 15. [Google Scholar] [CrossRef]
- Rahman, S.; Chowdhury, R.B.; D’Costa, N.G.; Milne, N.; Bhuiyan, M.; Sujauddin, M. Determining the potential role of the waste sector in decoupling of phosphorus: A comprehensive review of national scale substance flow analyses. Resour. Conserv. Recycl. 2019, 144, 144–157. [Google Scholar] [CrossRef]
- Geng, Y.; Fu, J.; Sarkis, J.; Xue, B. Towards a national circular economy indicator system in China: An evaluation and critical analysis. J. Clean. Prod. 2012, 23, 216–224. [Google Scholar] [CrossRef]
- Linder, M.; Sarasini, S.; van Loon, P. A Metric for Quantifying Product-Level Circularity. J. Ind. Ecol. 2017, 21, 545–558. [Google Scholar] [CrossRef]
- Fischer-Kowalski, M.; Krausmann, F.; Giljum, S.; Lutter, S.; Mayer, A.; Bringezu, S.; Moriguchi, Y.; Schütz, H.; Schandl, H.; Weisz, H. Methodology and indicators of economy-wide material flow accounting: State of the art and reliability across sources. J. Ind. Ecol. 2011, 15, 855–876. [Google Scholar] [CrossRef]
- Licht, C.; Peiró, L.T.; Villalba, G. Global substance flow analysis of gallium, germanium, and indium: Quantification of extraction, uses, and dissipative losses within their anthropogenic cycles. J. Ind. Ecol. 2015, 19, 890–903. [Google Scholar] [CrossRef]
- Chen, P.C.; Su, H.J.; Ma, H.W. Trace anthropogenic arsenic in Taiwan-substance flow analysis as a tool for environmental risk management. J. Clean. Prod. 2013, 53, 13–21. [Google Scholar] [CrossRef]
- Soulier, M.; Pfaff, M.; Goldmann, D.; Walz, R.; Geng, Y.; Zhang, L.; Tercero Espinoza, L.A. The Chinese copper cycle: Tracing copper through the economy with dynamic substance flow and input-output analysis. J. Clean. Prod. 2018, 195, 435–447. [Google Scholar] [CrossRef]
- Antikainen, R.; Haapanen, R.; Rekolainen, S. Flows of nitrogen and phosphorus in Finland - The forest industry and use of wood fuels. J. Clean. Prod. 2004, 12, 919–934. [Google Scholar] [CrossRef]
- Allesch, A.; Brunner, P.H. Material flow analysis as a decision support tool for waste management: A literature review. J. Ind. Ecol. 2015, 19, 753–764. [Google Scholar] [CrossRef]
- Mathieux, F.; Brissaud, D. End-of-life product-specific material flow analysis. Application to aluminum coming from end-of-life commercial vehicles in Europe. Resour. Conserv. Recycl. 2010, 55, 92–105. [Google Scholar] [CrossRef]
- Habib, K.; Schibye, P.K.; Vestbø, A.P.; Dall, O.; Wenzel, H. Material flow analysis of ndfeb magnets for denmark: A comprehensive waste flow sampling and analysis approach. Environ. Sci. Technol. 2014, 48, 12229–12237. [Google Scholar] [CrossRef] [PubMed]
- Eckelman, M.J.; Daigo, I. Markov chain modeling of the global technological lifetime of copper. Ecol. Econ. 2008, 67, 265–273. [Google Scholar] [CrossRef]
- Haas, W.; Krausmann, F.; Wiedenhofer, D.; Heinz, M. How circular is the global economy?: An assessment of material flows, waste production, and recycling in the European union and the world in 2005. J. Ind. Ecol. 2015, 19, 765–777. [Google Scholar] [CrossRef]
- European Academies Science Advisory Council. Circular Economy: A Commentary from the Perspectives of the Natural and Social Sciences; European Academies Science Advisory Council: Halle (Saale), Germany, 2015. [Google Scholar]
- Matthews, E.; Amann, C.; Bringezu, S.; Fischer-Kowalski, M.; Hüttler, W.; Kleijn, R.; Moriguchi, Y.; Ottke, C.; Rodenburg, E.; Rogich, D.; et al. The Weight of Nations: Material Outflows from Industrial Economies; Hutter, C., Ed.; World Resources Institute: Washington, DC, USA, 2000; ISBN 1569734399. [Google Scholar]
- Eurostat. Economy-Wide Material Flow Accounts and Derived Indicators. A Methodological Guide; Office for Official Publications of the European Communities: Luxembourg, 2001; ISBN 9289404590. [Google Scholar]
- Mayer, A.; Haas, W.; Wiedenhofer, D.; Krausmann, F.; Nuss, P.; Blengini, G.A. Measuring Progress towards a Circular Economy: A Monitoring Framework for Economy-wide Material Loop Closing in the EU28. J. Ind. Ecol. 2018, 23, 62–76. [Google Scholar] [CrossRef] [PubMed]
- Seyhan, D. Country-scale phosphorus balancing as a base for resources conservation. Resour. Conserv. Recycl. 2009, 53, 698–709. [Google Scholar] [CrossRef]
- Chowdhury, R.B.; Moore, G.A.; Weatherley, A.J.; Arora, M. A review of recent substance flow analyses of phosphorus to identify priority management areas at different geographical scales. Resour. Conserv. Recycl. 2014, 83, 213–228. [Google Scholar] [CrossRef]
- Jedelhauser, M.; Binder, C.R. Losses and efficiencies of phosphorus on a national level – A comparison of European substance flow analyses. Resour. Conserv. Recycl. 2015, 105, 294–310. [Google Scholar] [CrossRef]
- Giurco, D.; McLellan, B.; Franks, D.M.; Nansai, K.; Prior, T. Responsible mineral and energy futures: Views at the nexus. J. Clean. Prod. 2014, 84, 322–338. [Google Scholar] [CrossRef]
- Font Vivanco, D.; Wang, R.; Hertwich, E. Nexus Strength: A Novel Metric for Assessing the Global Resource Nexus. J. Ind. Ecol. 2018, 22, 1473–1486. [Google Scholar] [CrossRef]
- Liang, S.; Qu, S.; Zhao, Q.; Zhang, X.; Daigger, G.T.; Newell, J.P.; Miller, S.A.; Johnson, J.X.; Love, N.G.; Zhang, L.; et al. Quantifying the Urban Food-Energy-Water Nexus: The Case of the Detroit Metropolitan Area. Environ. Sci. Technol. 2019, 53, 779–788. [Google Scholar] [CrossRef] [PubMed]
- Saidani, M.; Yannou, B.; Leroy, Y.; Cluzel, F. How to Assess Product Performance in the Circular Economy? Proposed Requirements for the Design of a Circularity Measurement Framework. Recycling 2017, 2, 6. [Google Scholar] [CrossRef]
- Cencic, O.; Kelly, J.D.; Kovacs, A. STAN (2.6 2017). TU Wien, Institute for Water Quality, Resource and Waste Management: Vienna, Austria, 2017. [Google Scholar]
- Tanzer, J.; Zoboli, O.; Zessner, M.; Rechberger, H. Filling two needs with one deed: Potentials to simultaneously improve phosphorus and nitrogen management in Austria as an example for coupled resource management systems. Sci. Total Environ. 2018, 640–641, 640–641. [Google Scholar] [CrossRef]
- Sutton, M.A.; Oenema, O.; Erisman, J.W.; Leip, A.; van Grinsven, H.; Winiwarter, W. Too much of a good thing (Commentary). Nature 2011, 472, 159–161. [Google Scholar] [CrossRef] [PubMed]
- European Commission. Study on the Review of the List of Critical Raw Materials. Critical Raw Materials Factsheets; Publications Office of the European Union: Luxembourg city, Luxembourg, 2017. [Google Scholar]
- Molina-Moreno, V.; Leyva-Díaz, J.C.; Llorens-Montes, F.J.; Cortés-García, F.J. Design of indicators of circular economy as instruments for the evaluation of sustainability and efficiency in wastewater from pig farming industry. Water 2017, 9, 653. [Google Scholar] [CrossRef]
- Soulier, M.; Glöser-Chahoud, S.; Goldmann, D.; Tercero Espinoza, L.A. Dynamic analysis of European copper flows. Resour. Conserv. Recycl. 2018, 129, 143–152. [Google Scholar] [CrossRef]
- Karlsson, J.; Brunzell, L.; Venkatesh, G. Material-flow analysis, energy analysis, and partial environmental-LCA of a district-heating combined heat and power plant in Sweden. Energy 2018, 144, 31–40. [Google Scholar] [CrossRef]
- International Copper Study Group. The World Copper Factbook 2018; International Copper Study Group: Lisbon, Portugal, 2018. [Google Scholar]
- Melse, R.W.; Timmerman, M. Sustainable intensive livestock production demands manure and exhaust air treatment technologies. Bioresour. Technol. 2009, 100, 5506–5511. [Google Scholar] [CrossRef]
- Mehr, J.; Jedelhauser, M.; Binder, C. Transition of the Swiss Phosphorus System towards a Circular Economy—Part 1: Current State and Historical Developments. Sustainability 2018, 10, 1479. [Google Scholar] [CrossRef]
- Braungart, M.; McDonough, W.; Bollinger, A. Cradle-to-cradle design: creating healthy emissions - a strategy for eco-effective product and system design. J. Clean. Prod. 2007, 15, 1337–1348. [Google Scholar] [CrossRef]
- Ajero, M.A.; Armenteras, D.; Barr, J.; Barra, R.; Baste, I.; Dobrowolski, J.; Dronin, N.; El-Sammak, A.; Evans, T.P.; Finlayson, C.M.; et al. GEO5 Global Environment Outlook: Environment for the Future We Want; United Nations Environment Programme, Ed.; Progress Press Ltd: Valletta, Malta, 2012; ISBN 978-92-807-3177-4. [Google Scholar]
- Zoboli, O.; Laner, D.; Zessner, M.; Rechberger, H. Added Values of Time Series in Material Flow Analysis: The Austrian Phosphorus Budget from 1990 to 2011. J. Ind. Ecol. 2015, 20, 1334–1348. [Google Scholar] [CrossRef] [PubMed]
- Hamilton, H.A.; Brod, E.; Hanserud, O.; Müller, D.B.; Brattebø, H.; Haraldsen, T.K. Recycling potential of secondary phosphorus resources as assessed by integrating substance flow analysis and plant-availability. Sci. Total Environ. 2017, 575, 1546–1555. [Google Scholar] [CrossRef] [PubMed]
- Bertram, M.; Graedel, T.E.; Rechberger, H.; Spatari, S. The contemporary European copper cycle: waste management subsystem. Ecol. Econ. 2002, 42, 43–57. [Google Scholar] [CrossRef]
- Jayal, A.D.; Badurdeen, F.; Dillon, O.W.; Jawahir, I.S. Sustainable manufacturing: Modeling and optimization challenges at the product, process and system levels. CIRP J. Manuf. Sci. Technol. 2010, 2, 144–152. [Google Scholar] [CrossRef]
- Ashby, W.R. Requisite Variety and Its Implications for the Control of Complex Systems. Cybernetica 1958, 1, 83–99. [Google Scholar]
- Cencic, O. User Manual STAN Version 2.6; TU Wien, Institute for Water Quality, Resource and Waste Management: Vienna, Austria, 2017. [Google Scholar]
- Cencic, O. Nonlinear data reconciliation in material flow analysis with software STAN. Sustain. Environ. Res. 2016, 26, 291–298. [Google Scholar] [CrossRef]
- Kovanda, J.; Van De Sand, I.; Schütz, H.; Bringezu, S. Economy-wide material flow indicators: Overall framework, purposes and uses and comparison of material use and resource intensity of the Czech Republic, Germany and the EU-15. Ecol. Indic. 2012, 17, 88–98. [Google Scholar] [CrossRef]
- Raupova, O.; Kamahara, H.; Goto, N. Assessment of physical economy through economy-wide material flow analysis in developing Uzbekistan. Resour. Conserv. Recycl. 2014, 89, 76–85. [Google Scholar] [CrossRef]
- Ellen MacArthur Foundation; Granta Design. Circularity Indicators. An Approach to Measuring Circularity. Methodology; Ellen MacArthur Foundation: Cowes, Isle of Wight, UK, 2015. [Google Scholar]
- Figge, F.; Thorpe, A.S.; Givry, P.; Canning, L.; Franklin-Johnson, E. Longevity and Circularity as Indicators of Eco-Efficient Resource Use in the Circular Economy. Ecol. Econ. 2018, 150, 297–306. [Google Scholar] [CrossRef]
- Huysman, S.; De Schaepmeester, J.; Ragaert, K.; Dewulf, J.; De Meester, S. Performance indicators for a circular economy: A case study on post-industrial plastic waste. Resour. Conserv. Recycl. 2017, 120, 46–54. [Google Scholar] [CrossRef]
- Sobańtka, A.; Zessner, M.; Rechberger, H. The Extension of Statistical Entropy Analysis to Chemical Compounds. Entropy 2012, 14, 2413–2426. [Google Scholar] [CrossRef]
- Dawson, C.J.; Hilton, J. Fertiliser availability in a resource-limited world: Production and recycling of nitrogen and phosphorus. Food Policy 2011, 36, S14–S22. [Google Scholar] [CrossRef]
- Cavaleiro de Ferreira, A.; Fuso-Nerini, F. A Framework for Implementing and Tracking Circular Economy in Cities: The Case of Porto. Sustainability 2019, 11, 1813. [Google Scholar] [CrossRef]
- Van Deventer, M.J.; Snyman, R. Measuring for sustainability: A multidimensional measurement framework for library and information services. Libri 2004, 54, 1–8. [Google Scholar] [CrossRef]
- Fraccascia, L.; Albino, V.; Garavelli, C.A. Technical efficiency measures of industrial symbiosis networks using enterprise input-output analysis. Int. J. Prod. Econ. 2017, 183, 273–286. [Google Scholar] [CrossRef]
- Molina-Sánchez, E.; Leyva-Díaz, J.C.; Cortés-García, F.J.; Molina-Moreno, V. Proposal of sustainability indicators for the waste management from the paper industry within the circular economy model. Water 2018, 10, 1014. [Google Scholar] [CrossRef]
© 2019 by the authors. Licensee MDPI, Basel, Switzerland. This article is an open access article distributed under the terms and conditions of the Creative Commons Attribution (CC BY) license (http://creativecommons.org/licenses/by/4.0/).