Abstract
In the field of energy transformation, the application of batteries is widening. To address the challenge of health state estimation of energy storage batteries with multiple operating conditions, this study analyzes the aging cycle operation data of lithium-ion batteries and develops a scheme to extract a number of raw features and their corresponding health status labels. Multidimensional candidate feature sets that capture aging information under different conditions are constructed. Subsequently, a three-stage feature selection strategy, including Pearson and Spearman correlation analysis, hierarchical redundancy elimination, and minimum redundancy maximum relevance, was applied to screen the candidate feature set of each condition, resulting in customized feature sets with condition adaptability. By analyzing the occurrence frequency and mean absolute correlation coefficient of each feature within the custom feature set, a comprehensive feature set with multi-condition adaptability was screened and determined. On this basis, by integrating temporal sequence information and operating condition information, a dual-path fusion estimation model with attention mechanism and condition modulation was established. The validation results of the lithium-ion battery multi-condition cycling aging dataset demonstrate that the model achieves accurate health state estimation, with mean absolute error and root mean square error of 0.8281% and 0.9835%, respectively. Finally, comparisons with other methods were conducted in terms of feature selection strategies and model estimation performance. The results demonstrate that the proposed approach achieves superior estimation accuracy and enhanced interpretability.
1. Introduction
As the main consumption source of fossil energy, industries and transportation are significant sources of world carbon emissions [1]. With the proposal of China’s carbon peak and carbon neutrality goals, the energy supply model for motor vehicles is undergoing a historic transformation. Lithium-ion batteries (LIBs) are widely used in the field of power batteries because of their high energy density and extended cycle life. However, the nonlinear and time-varying nature of their degradation processes severely hampers accurate real-time reliability assessment [2,3]. Under the current standard, storage batteries are deemed to have reached end-of-life (EOL) when their state of health (SOH) falls below 80%, and the potential safety hazards such as thermal runaway will increase with the degree of aging [4,5]. Therefore, achieving accurate SOH estimation under complex operating conditions is crucial for enhancing the safety and reliability of new energy products.
SOH cannot be measured directly, current mainstream SOH estimation methods predominantly rely on support vector machines (SVMs), random forest, and neural networks. These approaches can process labeled datasets, train on historical data to establish relationships between input features and target variables, estimate key battery parameters, and predict future performance and degradation trends [6]. Therefore, accurate estimation of SOH using measurable parameters has become a multidisciplinary research hotspot [7]. For this reason, scholars both domestically and internationally have conducted detailed analyses of measurable battery operating parameters, aiming to extract characteristic parameters related to SOH changes. At present, there are two different paths: the automatic feature extraction methods based on the neural network which extract the aging features by inputting the parameters in the battery operation [8], and the manual feature extraction methods based on expert knowledge which extract the aging features by manually analyzing the battery operating data. Qian et al. [9] input voltage and current data from battery constant current (CC) charging curves into a convolutional neural network (CNN) model for feature extraction and SOH estimation. Lin et al. [10] proposed an SOH estimation method based on multi-feature and multi-model fusion. They extracted seven aging features from voltage, temperature, and capacity increment curves, generated preliminary predictions using multiple linear regression, supported vector regression, and Gaussian process regression, and finally fused the results through random forest regression. Yang et al. [11] proposed a multi-feature collaborative analysis method to obtain multiple battery aging features, selecting features highly correlated with SOH through Pearson correlation analysis. The above methods enable SOH estimation based on their respective datasets. However, external factors such as ambient temperature, charge/discharge rate, and depth of discharge (DOD) and so on significantly impact the SOH of LIBs [12,13,14]. Relying solely on simple extraction of aging features under different operating conditions for estimation may overlook the synergistic effects of multiple operating factors, resulting in limited accuracy and generalization capability of the SOH estimation model. Li et al. [15] proposes a physics-informed machine learning (PIML) method for accurate SOH estimation of LIBs varied operating conditions. Lin et al. [16] proposes an online SOH tag generation model based on constant-current charging time (CCCT), combining multi-dimensional features with the WOA-LightGBM architecture for estimation, offering a novel approach for deployment in practical BMS systems. The automatic feature extraction methods based on deep learning models can uncover complex associative patterns in raw data that differ from human subjective reasoning. However, they cannot provide reasonable explanations for model predictions, posing a significant obstacle in safety-critical domains. These methods also demand high data quality and quantity, making them prone to overfitting risks. The manual feature extraction methods based on expert knowledge offer better interpretability of the relationship between features and battery aging, providing superior physical meaning. However, the efficiency of feature extraction for large-scale data in complex energy storage battery application scenarios remains an urgent issue to address.
To solve the above issues, this study introduces a programmatic feature extraction strategy that adapts to operating conditions. Firstly, the battery operational data is comprehensively analyzed to construct an initial pool of candidate aging features. Subsequently, significant features are selected from this feature pool for each independent operating condition, forming a series of condition-customized feature subsets. Finally, through a fusion decision process, an optimal feature combination with high commonality and stable representational capability is determined based on the features’ prevalence across subsets and their strength of correlation with health status. Different from existing automated feature extraction methods characterized by abstraction and a lack of traceability, this strategy is essentially a fusion of manual feature extraction and automatic feature extraction. The selected features originate from parameters in battery operational data that are directly linked to aging mechanisms. Among these, the peak and peak position of the incremental capacity (IC) curve, the characteristics and trends of voltage/current curves during charge–discharge cycles, and the shape of capacity and energy curves are directly associated with the internal degradation of electrode materials, increased polarization, and rising internal resistance during battery aging, with clear significance and traceability. In terms of cross condition capability, the strategy’s unique advantage lies in its generalization logic. The main reasons for lithium-ion cell aging are high total strain energy density in electrode particles, solid electrolyte interface (SEI) film, and lithium metal deposition (lithium plating), the essence of aging remains consistent across different operating conditions, differing only in manifestation and rate [17]. However, most of the existing automatic feature extraction methods are generalizations based on statistical coverage. By covering a sufficiently diverse range of operating conditions in the training data, they depend on the completeness of the data distribution. When encountering new operating conditions with significantly different distributions, the mapping relationships learned internally by the model may face failure issues. In addition, the feature extraction process of this strategy is computationally efficient. The extracted features are not complete waveforms of voltage and current over time, but rather aggregated characteristics derived from each cycle. Only a few statistical values per cycle need to be stored for input to the estimation model. Consequently, the resulting estimated model is relatively lightweight, saving computational resources and time compared to existing automatic feature extraction methods. This strategy can automatically process large-scale data under multiple operating conditions, extract the aging features strongly related to SOH as the model input, and use the LSTM network combined with condition modulation and attention mechanism proposed in this paper to build a normalized estimation model under multiple operating conditions, to achieve the purpose of high-precision estimation of SOH under different operating conditions.
2. Data Introduction and Analysis
2.1. Data Sources and Introduction
This study is based on the UofM pouch cell voltage and expansion cyclic aging experimental dataset from the University of Michigan Battery Laboratory, available in the data repository released by Sandia National Laboratories [18] (raw data accessible via www.batteryarchive.org, accessed on 23 March 2025). The data covers operating conditions across three distinct dimensions: temperature, charge/discharge rate, and DOD. Experiments were conducted using NMC111 pouch cells (UMBL, University of Michigan, Ann Arbor, MI, USA) with a nominal capacity of 5 Ah. The charging cutoff voltage for this battery is 4.2 V, and the discharging cutoff voltage is 3.0 V. Throughout the experiments, the control protocol remained consistent despite battery degradation, employing a fixed voltage window (3.0 V–4.2 V). “100% SOC” consistently corresponds to “the fully charged state achieved by charging from 3.0 V to 4.2 V under the current state of health.” This approach simulates the voltage-based cutoff condition typically employed by real BMS systems using constant current/constant voltage charging strategies, while ensuring consistency in safety constraints for charge/discharge experiments and SOH calculation benchmarks. The experimental procedure included: first, performing an initial capacity calibration test on all cells prior to the aging test commencement; subsequently, conducting a capacity calibration test after each aging cycle corresponding to a projected 5% capacity loss. Detailed experimental conditions are presented in Table 1. Before initiating the cycle test, set the oven temperature to the target value and allow the battery to rest for 3 h to ensure thermal equilibrium. For cycle tests with DOD ranging from 0% to 100%, the charging phase employs constant current charging until the voltage reaches 4.2 V, then transitions to constant voltage (CV) charging at 4.2 V until the current falls below C/50. The discharging phase uses constant current discharge until the voltage reaches 3.0 V. For DOD 50–100% cycles, the charging phase employs the same constant current-constant voltage (CC-CV) method. The discharging phase consistently references the nominal capacity, discharging 2.5 Ah to simulate a 50% DOD.

Table 1.
Aging cycle test conditions.
2.2. Data Analysis
This study defines battery SOH degradation to 80% as reaching EOL. Electric vehicle power batteries typically need to be retired when their State of Health (SOH) drops to around 80%. Grid energy storage systems can tolerate lower thresholds, while high-reliability applications such as drones may require SOH levels above 90%. This threshold comprehensively considers the performance requirements of ternary lithium energy storage batteries in target application scenarios such as residential and commercial energy storage systems, as well as the feasibility of secondary utilization [19]. Based on this EOL criterion and experimental data obtained from 12 cycling conditions, the battery aging curve is plotted as shown in Figure 1. Figure 1 clearly demonstrates the significant impact of different operating conditions on the battery aging pathway. While maintaining consistent charge/discharge rate and DOD, ambient temperature emerges as the key factor driving variations in aging rates. Specifically, batteries exposed to 45 °C high temperatures require significantly fewer cycles to reach EOL SOH degradation compared to those at 25 °C room temperature or −5 °C low temperatures. This indicates that elevated temperatures substantially accelerate irreversible aging processes within the battery. Secondly, DOD also significantly impacts cycle life. Comparing conditions 1–6 at 100% DOD with conditions 7–12 at 50% DOD reveals that, under identical temperature and rate conditions, batteries operating at 50% DOD exhibit longer cycle life and a more gradual aging trajectory.
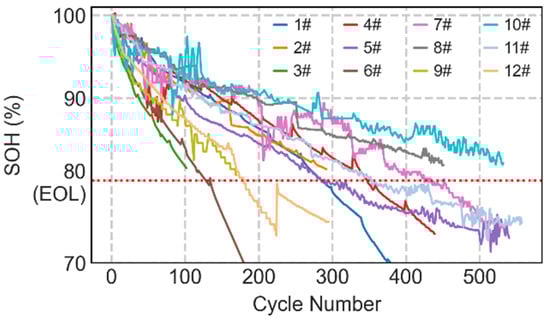
Figure 1.
Battery aging curve under 12 operating conditions. (The red dashed line represents EOL).
To more precisely quantify battery aging rates under different operating conditions, key performance metrics were further calculated and plotted. These include the average capacity loss per 100 cycles and the number of cycles to EOL for each battery under 12 operating conditions, as shown in Figure 2a,b, respectively. For individual operating conditions where experiments did not reach EOL, their terminated SOH is annotated in Figure 2b. As illustrated, the aging rate under high-temperature conditions reached 2 to 3 times that under room-temperature and low-temperature conditions. The disparity in aging rates between room-temperature and low-temperature conditions increased with rising charge/discharge rates, exhibiting minimal difference at low rates but significant divergence at high rates. This indicates a nonlinear synergistic interaction between charge/discharge rates and temperature, where high rates amplify the impact of temperature differences on battery aging rates.
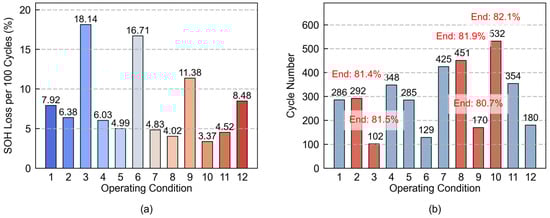
Figure 2.
Quantitative diagram of battery aging rate under 12 operating conditions: (a) SOH decay rate of 100 cycles (b) number of cycles in which SOH declines to 80%.
The analysis of experimental data systematically elucidates the significant impact of external operating conditions on LIBs aging rates. Ambient temperature, charge/discharge rate, and DOD are all critical stress factors influencing battery aging rates. These factors do not act independently but exhibit complex coupling effects or synergistic interactions, making it difficult to precisely decouple and quantify the contribution of any single factor to aging. To achieve a more universal estimation of battery aging behavior and to quantify the synergistic influence mechanisms of multiple external stresses on the aging process, this study will construct a multi-condition normalized battery aging estimation model based on this representative dataset of 12 operating conditions covering the key stress ranges. The core objective of this model is to capture and integrate the interactions among these complex factors, enabling precise estimation of SOH under various operating conditions. This provides a theoretical foundation for assessing the lifespan and optimizing the management of energy storage systems.
3. Feature Extraction for Multi-Condition
3.1. Establishing a Candidate Feature Set
The charging and discharging processes of batteries yield extensive operational data, including voltage and current, as well as capacity and energy values that can be calculated. Capacity is calculated as shown in Equation (1), while energy is calculated as shown in Equation (2). Based on this operational data, characteristic parameters highly correlated with battery aging can be obtained, indirectly reflecting internal microscopic changes. These aging characteristic parameters then enable the prediction and estimation of battery aging pathways.
In the equation, Q and E represent the cumulative charge or discharge capacity and energy, respectively. t0 denotes the start time, t denotes the end time, i is the instantaneous current, and u is the instantaneous voltage.
The experiment employed a CC-CV charging method and a CC discharging method. The charging and discharging data from each cycle test were plotted as curves, shown in Figure 3 and Figure 4, respectively. Figure 3 depicts the charging segment: (a) shows the charge voltage-time curve, which gradually shifts upward and to the left with increasing cycle numbers, indicating that the time required for the battery to reach the same voltage threshold progressively shortens; (b) represents the charge current-time curve, exhibiting a leftward shift trend as cycle numbers increase, signifying that the CC phase charging time gradually decreases, allowing the battery to enter the CV charging phase earlier; and (c) and (d) depict the charge capacity and energy variation curves. Both curves shift downward and to the left in the latter half of the cycle. This shift is notably reflected in the mean, variance, and quantiles of the curves. For example, the mean of the curve in Figure 3c decreases from 2.5453 to 1.8143, representing a reduction of 28.72%. Figure 4 depicts the discharge segment. (a) shows the discharge voltage-time curve, which gradually shifts downward and to the left with an increasing cycle count. The voltage plateau exhibits a decreasing trend over cycles, with the battery reaching the discharge cut-off voltage earlier. (b) to (c) depict the capacity and energy curves during discharge. As cycle numbers increase, the curve trends resemble those in the charging phase. For instance, the average curve value in Figure 4b decreased from 2.4395 to 1.7244, representing a 29.31% reduction.
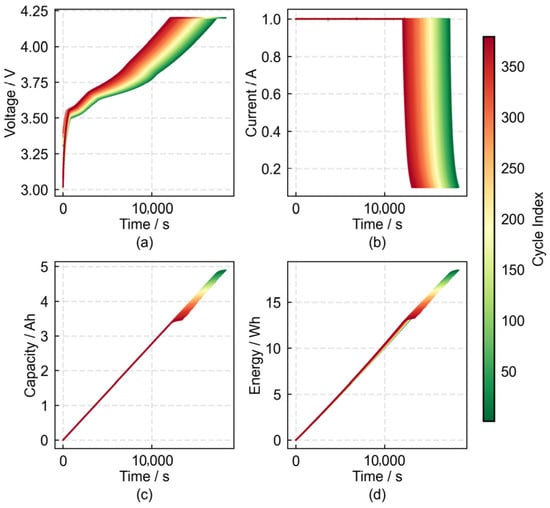
Figure 3.
Parameters-time curve at charging stage: (a) voltage-time curve; (b) current-time curve; (c,d) capacity, energy-time curve.

Figure 4.
Parameters-time curve at discharging stage: (a) voltage-time curve; (b,c) capacity, energy-time curve.
Ternary lithium energy storage batteries are predominantly used in residential and commercial energy storage systems. Their discharge rates during actual operation exhibit complex variability. This study introduces the incremental capacity (IC) curve to enhance dimensionality, thereby improving feature representation capability and robustness. The IC curve transforms voltage plateaus into more observable peaks [20]. These peaks correspond to electrochemical reactions and phase transitions within the battery, exhibiting strong correlation with battery aging. The calculation method is shown in Equation (3).
In the equation, Q represents the discharge capacity and V represents the voltage.
The voltage data from each discharge cycle phase serves as the horizontal coordinate, with 500 equidistant points obtained via linear interpolation. The capacity data calculated using Equation (1) and the IC curve vertical coordinate data derived from Equation (3) were processed using a Savitzky–Golay filter with a window length of 31 and order 3 to generate the IC curve shown in Figure 5. The peak and peak position of the IC curve correspond to the internal aging-related chemical reactions within the battery and their associated thermodynamic and kinetic characteristics. As the number of cycles increases, the characteristic peak of the IC curve exhibits a noticeable shift, with the peak height gradually decreasing and the peak position shifting toward higher voltages.
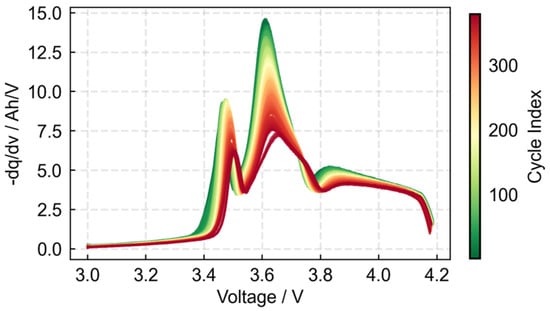
Figure 5.
IC curve at discharge stage.
Based on the above analysis, a multidimensional aging feature set capable of reflecting battery aging information is established and designated as the candidate feature set. The composition of the 47 aging features is shown in Table 2, where the “Statistical Method” column indicates the various statistical methods used to perform feature expression on the data in the “Feature Data Type” column. The complete table can be found in Table S1. The method for extracting IC curve characteristics involves local maximum detection. The formulas for calculating the mean and variance are shown in Equations (4) and (5), respectively. Quantiles are obtained by extracting the corresponding positional values.
Table 2.
Multidimensional aging feature set.
3.2. Screening of Aging Features Under Operational Conditions
In LIBs SOH estimation models, the selection of aging features is a key factor influencing model performance. The input to deep learning models is not fixed. While ensuring that the input feature parameters maintain a certain correlation with the target variable, the number of features must be appropriately balanced. An excessive number of irrelevant aging features may lead to model overfitting [21]. Therefore, prior to constructing the estimation model, the 47 features in the candidate feature set were first screened. Given the complex and diverse operating conditions of energy storage batteries, batteries exhibit different aging paths under different conditions. Relying solely on simple screening to identify common features may compromise estimation accuracy. Therefore, this study captures the characteristics of each operating condition, selecting customized features more relevant to battery aging under specific conditions. Subsequently, a comprehensive feature set is extracted to achieve a high-precision estimation of battery SOH across different operating conditions. The flowchart of the multi-condition feature selection strategy is shown in Figure 6.

Figure 6.
Flowchart of multi-condition feature selection strategy.
First, the absolute values of the Pearson correlation coefficient and Spearman correlation coefficient between the 47 features in the original candidate feature set and the target variable under this operating condition are calculated. In statistics, 0.5 is defined as moderate correlation. To filter out features with weak relationships to the target variable during the initial stage, those with absolute values of both correlation coefficients below 0.5 are discarded. Then, sort the features satisfying the correlation constraint by the mean value of both correlation coefficients. Calculate the correlation matrix between each feature and the remaining features sequentially. The variance inflation factor at a correlation coefficient of 0.95 is approximately 10.26. A value greater than or equal to 10 indicates severe multicollinearity. Therefore, the redundancy threshold is set to 0.95. Features with correlations exceeding this threshold are deemed redundant and removed. This process is iterated on the remaining features until no redundancy exists for any feature. Finally, each feature is scored using the minimum redundancy maximum relevance (mRMR) algorithm, and the top 10 features are retained as the customized feature set for this operating condition. The mRMR variant used was MIQ, employing k-NN for mutual information estimation with a k-NN parameter of 3. For 12 operating conditions, 12 customized feature sets were obtained using the aforementioned method. Features appearing with a frequency greater than 50% are summarized in Table 3.
Table 3.
High-frequency feature information statistics.
Table 3 lists the aging characteristics with higher frequencies across 12 customized feature sets. Pearson_Avg denotes the average Pearson correlation coefficient, while Spearman_Avg represents the average Spearman correlation coefficient. IC_V denotes the peak voltage value of the IC curve, I-T_CV_var represents the variance of the current-time curve during the CV charging phase, V-T_DC_var indicates the variance of the voltage-time curve during the CC discharge phase, V-T_CC_quantile_1-4 signifies the quartile points of the voltage-time curve during the CC charging phase, V-T_CC_var denotes the variance of the voltage-time curve during CC charging, I-T_CV_quantile_3-4 represents the third quartile of the current-time curve during CV charging, and I-T_CV_quantile_1-2 indicates the first quartile of the current-time curve during CV charging. The first three features exhibit frequencies exceeding two-thirds, indicating high operating condition stability. The last four features share the same frequency but exhibit moderate stability under operating condition variations. However, their correlation with SOH varies significantly: V-T_CC_quantile_1-4 and I-T_CV_quantile_3-4 show markedly higher SOH correlations than the other two. This relative correlation order remains consistent regardless of adjustments to the weights of Pearson and Spearman correlation coefficients. Balancing operational stability and SOH correlation, we selected three features with high operational stability combined with two features from the group with moderate stability but higher SOH correlation, forming a comprehensive feature set of five elements adaptable to diverse operating conditions.
To validate the rationality and effectiveness of the selected feature set, two comparative feature sets were designed for ablation experiments: Control Feature Set 1, comprising the top three high-frequency features, and Control Feature Set 2, comprising all seven features listed in Table 3. Additionally, to ensure the stability of the feature selection process, multiple feature selection tests were conducted. Analysis of feature occurrence frequency and correlation with SOH revealed that the five features retained in each selection remained virtually unchanged, demonstrating the robust stability of this feature selection method.
Based on the effective extraction of aging features reflecting battery health status, the efficiency of feature extraction is also crucial. Compared to common CNN-based automatic feature extraction methods in practical applications, the total time consumed by this study’s approach—from feature extraction initiation to feature selection completion—was 73.54 s, with a peak memory usage of 330.32 Mb. In contrast, the CNN-based automatic feature extraction method took 161.12 s and consumed 602.34 Mb of peak memory. The comparison demonstrates that the feature extraction process in this study exhibits excellent operational efficiency and minimal memory consumption.
Cheng et al. [22] calculated a relevance score for each input feature to quantify its “importance,” then weighted the original features using these scores. The weighted features were used to drive the model, yielding an interpretable prediction result. The feature engineering in this study achieves high efficiency while inheriting the interpretability of expert-knowledge-based feature extraction. The five features ultimately retained from feature engineering originated from the feature extraction work in Section 2.1. Battery aging degrades internal kinetics, requiring higher potentials to drive the same reactions. This is associated with a rightward-downward shift in the main peak in the IC curve, characterized by an increase in the main peak voltage value. During the SOH degradation from 100% to 69.98%, IC_V gradually changed from 3.6076 to 3.6573. Battery aging is accompanied by thickening of the SEI film, obstructing and unevenly distributing lithium-ion diffusion pathways. This manifests as increased fluctuations in the current decay curve during the CV charging phase, a slower decay rate, and a slight upward shift in the tail of the current curve. As SOH degraded from 100% to 69.98%, I-T_CV_var gradually changed from 0.0461 to 0.0541, while I-T_CV_quantile_3-4 gradually changed from 0.408 to 0.4483. As battery aging increases internal resistance, voltage curve sensitivity decreases. The voltage curve shifts overall upward and to the left during the CC charging phase. During the SOH decay from 100% to 69.98%, V-T_DC_var changes from 0.0502 to 0.0497, and V-T_CC_quantile_1-4 changes from 3.638 to 3.681. These characteristics exhibit a monotonic trend highly consistent with SOH degradation and are correlated with aging mechanisms. Compared to other approaches, this method more intuitively translates SOH decline into the evolution of interpretable physical quantities.
4. Multi-Condition Normalized Estimation Model
To investigate the impact of different operating conditions on battery aging rates and to achieve precise estimation of SOH for energy storage batteries in diverse and complex real-world applications, the preceding section completed a critical step: customizing the extraction, selection, and integration of features for each specific operating condition to form a comprehensive feature set capable of characterizing battery aging states. Next, a deep learning model is employed to establish the relationship between features and battery SOH. Figure 7 illustrates the model architecture. This model fully utilizes aging information corresponding to different feature types as inputs to construct a multi-condition normalized estimation model.

Figure 7.
Structure diagram of multi-condition normalized estimation model.
Considering the time-series characteristics of battery aging, long short-term memory (LSTM), which is sensitive to time-series tasks, is selected as the basic structure of the model. To address the challenge of battery aging data distribution shifts caused by varying operating conditions, this study introduces an operating-condition-driven feature modulation mechanism. The core concept of this mechanism involves converting operating condition information into dynamic weight signals to calibrate temporal features, enabling the model to adaptively adjust based on input conditions. Building upon the feature representations modulated by operating conditions, we incorporate a multi-head self-attention mechanism. This aims to enable the model to focus on the global dependencies among the most relevant temporal segments for the current operating condition, as amplified by the modulated signals. During the model input and preprocessing stage, input features are categorized into two types: time-series features and operating condition features. Time-series features include five battery operational features from the comprehensive feature set, along with one feature derived from dynamic enhancement of time series—the SOH differential feature. This feature captures the smoothing trend of capacity decay while suppressing noise. The SOH differential feature solely reflects historical degradation dynamics, calculated using SOHt−1, SOHt−2, and SOHt−3. It utilizes only historical data and contains no future SOH information. The features of operating conditions include temperature, upper DOD limit, lower DOD limit, charging rate, and discharging rate. These aid the model in identifying data distribution variations caused by differing operating conditions. Within the same experimental sequence, operating conditions remain constant. Therefore, when constructing samples, they are extended to all time steps and repeated at each time step. Before entering the network, the two types of features are globally Z-score standardized, and the training samples are constructed from the long sequence through the sliding window, so as to obtain the time series input X and the operating condition input C. The sliding window strategy converts continuous battery aging data into supervised learning samples, with a window length of five, a stride of one, and an 80% window overlap rate. The prediction target y represents the SOH for the next cycle within the window. Input features span t − 5 to t − 1, while the output is the SOH value at time t. Predictions rely solely on historical data, strictly preserving temporal causality. Data from aging cycles are isolated based on operational conditions. Independent windowing is applied to each trajectory, accommodating varying lengths while preventing cross-contamination of operational information during training, validation, and testing. The model is a dual path structure, with time series branch processing X and operating condition branch processing C. the time series branch first extracts the short-term and long-term time series dependencies through a 256-unit bidirectional LSTM layer, and obtains the hidden state H1 through layer normalization, with an output dimension of 512. The operating condition branch pools the features of the operating condition in the time dimension, and enhances the semantics through a two-layer fully connected network containing 128 and 256 units to obtain the deep operating condition representation. In order to achieve cross condition adaptation, the model introduces the condition driven feature modulation mechanism: the condition representation is generated through a 512-unit sigmoid full connection layer to generate a modulation signal, which is extended in the time dimension and multiplied by the time series feature H1 element by element to obtain the condition weighted time series representation H1′. This mechanism enables the model to dynamically adjust its attention to historical features according to the operating conditions. On the modulated timing representation H1′, the model introduces the self-attention mechanism of 8 heads with each head dimension of 64 to obtain H2′, and then obtains H2′ through residual connection and layer normalization and stability training. Then, the second 256-unit bidirectional LSTM layer further aggregates timing information and outputs a 512-dimensional final timing global representation. In the feature fusion stage, the two paths interaction is realized through the splicing operation, that is, after the global degradation feature is extracted from the time series branch, the fusion feature Z is obtained by explicit fusion with the semantics of the operating condition branch. The fusion feature Z is dimensionally reduced and regularized through two full connection layers of 512 units and 256 units, in which the activation functions are swish, dropout is 0.5 and 0.4, respectively, and finally the estimated value of SOH is output.
The model is trained using a comprehensive feature set adapted to multiple operating conditions as input, through the aforementioned method combining LSTM with operating condition modulation and attention mechanisms. During model training and testing, the Huber loss function and Adam optimizer were employed. The learning rate was continuously adjusted with early stopping, training a unified model in the space containing all operating conditions data. This enabled the model to learn cross-condition variations through the operating condition feature C, preserving the optimal model configuration adapted to multiple conditions. The result is a multi-condition normalized SOH estimation model with high precision. The core of “multi-condition normalization” in this model is not traditional data standardization, but rather a dynamic feature modulation mechanism based on operating conditions. Its design aims to address data distribution shifts caused by varying operational states, achieving a parameterized domain adaptation.
5. Model Results and Analysis
5.1. Model Performance Evaluation Metrics
To evaluate the performance of a model, standardized metrics must be employed. This study utilizes Mean Absolute Error (MAE) and Root Mean Square Error (RMSE) as evaluation indicators to quantify the deviation between the model’s estimated values and actual values. MAE represents the average of the absolute differences between all estimated values and their corresponding true values, reflecting the average deviation of estimates from actual values. Its calculation formula is given by Equation (6). RMSE is the square root of the average of the squared errors between estimated and actual values, making it more sensitive to large errors. Its calculation formula is given by Equation (7).
In the equation, ytrue represents the actual value, ypre denotes the estimated value, and n indicates the number of estimated data points.
5.2. Model Results
Based on actual SOH estimation requirements, this study estimates later-stage SOH using early-stage data from identical operating conditions. It then predicts full-lifecycle degradation paths for other operating conditions using comprehensive data from partial operating conditions. Furthermore, comparisons were conducted with other methods regarding model architecture and feature dimensions.
When estimating later-stage SOH using early-stage data from identical operating conditions, within the EOL, data from each operating condition is divided based on SOH values, with the top 80% serving as the training set and the bottom 20% as the test set. First, collect the training data for all 12 operating conditions uniformly. Then, perform independent standardized transformations on each set of operating condition data based solely on the training samples to prevent information leakage. The trained model is applied to estimate values for the test sets of all 12 operating conditions. Estimation performance is visualized by plotting comparison curves between estimated and actual values, along with error distribution curves, as shown in Figure 8. The left vertical axis represents SOH, while the right vertical axis shows the absolute value of the error. The results demonstrate good consistency between estimated and actual values across all operating conditions, accurately reflecting the trend of actual values without significant abnormal errors.

Figure 8.
Rendering of each operating condition model: (a–l) represent operating conditions 1 to 12, respectively.
Table 4 details the error statistics for SOH estimation under each operating condition using the model proposed in this study. The MAE ranges from 0.4024% to 1.6037%, with an average MAE of 0.8281%. The RMSE ranges from 0.4644% to 1.4649%, with an average RMSE of 0.9835%. The average MAE under low-temperature, ambient-temperature, and high-temperature conditions was 0.8276%, 0.838%, and 0.8188%, respectively, with minimal variation. However, the standard deviation of MAE under low-temperature conditions was 0.463%, significantly higher than that under ambient and high-temperature conditions. The low-temperature condition exhibited the greatest fluctuation in error, while the high-temperature condition showed relatively stable error, indicating that the model’s ability to identify internal aging mechanisms in batteries under different conditions is weaker at lower ambient temperatures. The average MAE for the 0–100% DOD condition was 0.6733%, while the average MAE for the 50–100% DOD condition was 0.983%. The larger error in the latter condition may stem from the narrower voltage plateau range, resulting in weaker characterization of capacity decay features. The average MAE for low-rate and high-rate conditions was 0.8161% and 0.8101%, respectively, showing nearly identical errors. However, the standard deviations of MAE were 0.409% and 0.3%, respectively. This indicates greater individual variation in high-rate conditions, suggesting the model inadequately learned capacity decay patterns under high-stress conditions.
Table 4.
SOH estimation error under various operating conditions.
The model employs an LSTM network incorporating operating condition modulation and attention mechanisms to estimate battery SOH under multiple operating conditions. To validate the superiority of this model architecture, it was compared with several deep learning approaches, including LSTM-only, RNN-only, and a variant where the LSTM in this method was replaced with an RNN. The average estimation errors across 12 operating conditions for each method are shown in Table 5. Compared to the LSTM-only approach, our method reduces the average MAE by 1.9428% and the average RMSE by 1.9818%. Compared to the RNN-only approach, it reduces the average MAE by 1.4222% and the average RMSE by 1.5013%. Furthermore, compared to replacing the LSTM in this study with an RNN, the average MAE of this study’s method decreased by 1.5214%, and the average MRSE decreased by 1.5682. The above comparison demonstrates that the model structure employed in this study exhibits significant accuracy advantages in multi-condition SOH estimation. It also proves that the importance of operating condition modulation and attention mechanisms in enhancing estimation accuracy under multi-condition scenarios.
Table 5.
Comparison of estimation errors with other methods.
Plotting the estimation errors of the four methods under 12 operating conditions yields the curves shown in Figure 9, where Curve1–4 correspond to the proposed method, the proposed method with RNN replacing LSTM, RNN-only, and LSTM-only, respectively. The figures clearly reveal distinct peaks in Curve2–4, indicating significant estimation errors under certain operating conditions. In contrast, Curve1 maintains consistently low error levels with a generally smoother trajectory. This demonstrates that the proposed method achieves high estimation accuracy across diverse operating conditions, exhibiting excellent adaptability and generalization capabilities.
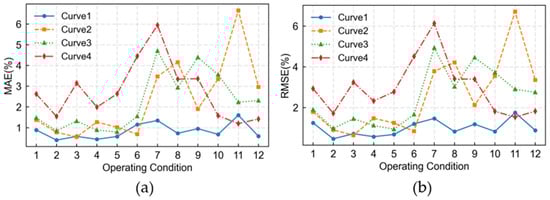
Figure 9.
Error curves for four methods under various operating conditions: (a) represents the MAE curve; (b) represents the RMSE curve.
Building upon the established superiority of the model structure, this study proposes a feature selection strategy. Through systematic feature engineering, the initial 47 aging features were refined into 5 key aging features. To validate the feasibility of this strategy, this study designed ablation experiments targeting the number of retained features, establishing two control groups with three and seven retained features, respectively. And compares the 47 aging features as the input of the model for SOH estimation, with results shown in Table 6. The average MAE for the two ablation experiments was 4.8227% and 2.8135%, respectively, while the average RMSE was 4.9809% and 3.0199%, confirming the validity of the feature retention strategy. The version with all 47 features achieved an average MAE of 2.09% and an average RMSE of 2.2528%. Specifically, the estimation error of nine working conditions after feature selection is less than 1%, and the average error is more than 1% lower than that of the model before feature selection. While the original 47-feature version performed well under certain simple conditions, it demonstrated significant instability across multiple operating conditions. The results indicate that the feature-screened model exhibits higher estimation accuracy and improved operational stability.
Table 6.
Performance comparison of models with different feature counts.
Beyond model architecture and feature count, model performance may vary across different SOH intervals. This study selected EOL = 80% SOH. To validate the impact of different EOL thresholds on SOH estimation performance, corresponding sensitivity analyses were conducted. When EOL = 85% SOH was chosen, the model achieved an average MAE of 0.616% and an average RMSE of 0.7068%. When EOL = 70% SOH was selected, the model’s average MAE was 1.7734%, and the average RMSE was 1.9946%. Errors were minimal during the early stage (SOH ≥ 85%), where capacity degradation was slow and relatively stable, offering strong predictability. Errors increased slightly during the mid-stage (SOH ≥ 80%) compared to the early stage, indicating accelerated capacity degradation and increased prediction difficulty. In the late stage (SOH ≥ 70%), errors increase significantly, corresponding to highly nonlinear capacity degradation. Furthermore, the absence of SOH data below 80% for certain operating conditions in the dataset, coupled with insufficient training data, significantly contributes to the error.
Furthermore, to evaluate the model’s robustness under multiple operating conditions and validate its generalization capability and universality for novel scenarios, this study selected 10 operating conditions from the 12 available as the training set and reserved 2 conditions as the test set for predicting the full life cycle degradation path of a new operating condition. The test set data remained completely invisible to the model during the training phase. Under this configuration, the model’s task is to predict the complete SOH trajectory of a battery in an entirely new operating condition—from its initial life stage to its end—based solely on degradation data from other operating conditions. This setup simulates the most realistic application scenario: deploying a trained model to a new battery operating under conditions (temperature, charge/discharge rate, DOD) that are not identical to the training data. The prediction results are illustrated in Figure 10. The model achieved average Mean Absolute Error (MAE) values of 1.1505% and 1.1026% for the two operating conditions, with corresponding Mean Root Mean Square Error (RMSE) values of 1.4075% and 1.2667%.

Figure 10.
New operating condition full life cycle SOH estimation curves: (a,b) represent two new operating conditions, respectively.
6. Conclusions
Aiming at the problem of SOH estimation of energy storage battery under complex operating conditions, a programmed feature extraction method for multiple operating conditions is proposed, and a normalized SOH estimation model for multiple operating conditions was built. To address the vast operational data generated by batteries under multiple conditions, a feature selection strategy was introduced during the feature extraction phase: a large number of original candidate features were extracted based on the operating data, and then the customized feature set suitable for this operating condition was obtained by feature selection for each operating condition. Then, according to the frequency of each feature in all customized feature sets, combined with the correlation analysis with SOH, the features with high correlation, low redundancy, and strong stability of operating conditions were retained to form a comprehensive feature set, which realizes the fusion of manual feature extraction based on expert knowledge and programmed automatic feature extraction, and retains the interpretability of the features in physical meaning to a certain extent. Compared with the automatic feature extraction method based on CNN, the feature extraction method in this study has a shorter running time and smaller peak memory occupation, which provides the possibility of deployment to BMS. In the multi condition normalized SOH estimation model part, this paper combines the LSTM network with the condition modulation and attention mechanism to build a SOH estimation model with both accuracy and condition stability. The two baseline models of estimating the late SOH through early data and estimating the new condition life cycle SOH through known condition data show good estimation performance. In addition, the comparative analysis of the model architecture, the number of features and SOH interval proves the rationality and feasibility of the feature extraction and model construction in this study. At the same time, the sensitivity analysis of SOH estimation for different EOL thresholds reveals that the prediction difficulty of battery aging process is a gradient distribution, the early capacity degradation has high predictability, and the uncertainty in the later stage is significantly enhanced. The error analysis for different working conditions reflects the nonlinear effects of temperature, charge/discharge rates and DOD on SOH estimation accuracy to a certain extent, which provides a reference for the actual BMS design. This study provides an effective cross-operating-condition SOH estimation solution for battery management systems. Future work will focus on optimizing estimation performance under extreme operating conditions through transfer learning and will consider the boundary drift problem to further improve the model’s accuracy, robustness, and generalization capabilities.
Supplementary Materials
The following supporting information can be downloaded at: https://www.mdpi.com/article/10.3390/batteries12010034/s1, Table S1: List of 47 Aging Feature.
Author Contributions
Conceptualization, W.T.; methodology, W.T., X.L. (Xun Liu) and X.L. (Xiaohang Li); software, X.L. (Xun Liu) and J.S.; validation, W.T.; formal analysis, X.L. (Xun Liu) and J.S.; investigation, X.L. (Xiaohang Li); resources, Z.L. and M.G.; data curation, W.T.; writing—original draft preparation, X.L. (Xun Liu), X.L. (Xiaohang Li) and J.S.; writing—review and editing, Z.L. and M.G.; visualization, X.L. (Xun Liu) supervision, Z.L. and M.G.; project administration, M.G.; funding acquisition, Z.L. All authors have read and agreed to the published version of the manuscript.
Funding
This research was funded by the open project fund of The State Key Laboratory of Heavy-duty and Express High-power Electric Locomotive, grant number QZKFKT2024-014.
Data Availability Statement
The raw data can be obtained from the database at Sandia National Laboratories (www.batteryarchive.org, accessed on 23 March 2025).
Conflicts of Interest
Authors Wentao Tang, Xiaohang Li and Zhiyuan Liao are employed by the CRRC Zhuzhou Locomotive Co., Ltd. The remaining authors declare that the research was conducted in the absence of any commercial or financial relationships that could be construed as a potential conflict of interest.
References
- Vaishnavi, B.; Reddy, V.S.S.; Deepa, K.; Sailaja, V. Assessing CO2 gas emission in residential areas: Implications for sustainable urban development. In Proceedings of the 2024 5th International Conference on Smart Electronics and Communication (ICOSEC), Trichy, India, 18–20 September 2024; IEEE: New York, NY, USA, 2024; pp. 302–307. [Google Scholar] [CrossRef]
- Yang, B.; Huang, L.; Wei, K.; Shu, X.; Li, Y.; Ren, B.; Tan, L. Research on degradation characteristics and real-time reliability assessment of lithium-ion batteries. J. Electrochem. Soc. 2025, 172, 60519. [Google Scholar] [CrossRef]
- Yan, L. Recent Progress in Li2FeSiO4 Cathode Materials. In Proceedings of the 2022 Power System and Green Energy Conference (PSGEC), Shanghai, China, 25–27 August 2022; IEEE: New York, NY, USA, 2022; pp. 452–456. [Google Scholar] [CrossRef]
- Zhang, T.; Ye, S.; Xi, H.; An, D. A two-stage data-driven temperature prediction method considering battery aging for retired batteries and validation of preemptive thermal control. Appl. Therm. Eng. 2025, 281, 128666. [Google Scholar] [CrossRef]
- Song, L.; Zheng, Y.; Xiao, Z.; Wang, C.; Long, T. Review on thermal runaway of lithium-ion batteries for electric vehicles. J. Electron. Mater. 2022, 51, 30–46. [Google Scholar] [CrossRef]
- Bello, I.T.; Raza, H.; Michael, A.T.; Muneeswara, M.; Tewari, N.; Bingsen, W.; Cheung, Y.N.; Choi, Z.; Boles, S.T. Charging ahead: The evolution and reliability of nickel-zinc battery solutions. EcoMat 2025, 7, e12505. [Google Scholar] [CrossRef]
- Yang, G.; Ma, Q.; Sun, H.; Zhang, X. State of health estimation based on GAN-LSTM-TL for lithium-ion batteries. Int. J. Electrochem. Sci. 2022, 17, 221128. [Google Scholar] [CrossRef]
- Sui, X.; He, S.; Vilsen, S.B.; Meng, J.; Teodorescu, R.; Stroe, D.I. A review of non-probabilistic machine learning-based state of health estimation techniques for lithium-ion battery. Appl. Energy 2021, 300, 117346. [Google Scholar] [CrossRef]
- Qian, C.; Xu, B.; Chang, L.; Sun, B.; Feng, Q.; Yang, D.; Ren, Y.; Wang, Z. Convolutional neural network based capacity estimation using random segments of the charging curves for lithium-ion batteries. Energy 2021, 227, 120333. [Google Scholar] [CrossRef]
- Lin, M.; Wu, D.; Meng, J.; Wu, J.; Wu, H. A multi-feature-based multi-model fusion method for state of health estimation of lithium-ion batteries. J. Power Sources 2022, 518, 230774. [Google Scholar] [CrossRef]
- Yang, X.; Ma, B.; Xie, H.; Wang, W.; Zou, B.; Liang, F.; Hua, X.; Liu, X.; Chen, S. Lithium-ion battery state of health estimation with multi-feature collaborative analysis and deep learning method. Batteries 2023, 9, 120. [Google Scholar] [CrossRef]
- Guan, T.; Sun, S.; Gao, Y.; Du, C.; Zuo, P.; Cui, Y.; Zhang, L.; Yin, G. The effect of elevated temperature on the accelerated aging of LiCoO2/mesocarbon microbeads batteries. Appl. Energy 2016, 177, 1–10. [Google Scholar] [CrossRef]
- Fleischhammer, M.; Waldmann, T.; Bisle, G.; Hogg, B.I.; Wohlfahrt-Mehrens, M. Interaction of cyclic ageing at high-rate and low temperatures and safety in lithium-ion batteries. J. Power Sources 2015, 274, 432–439. [Google Scholar] [CrossRef]
- Zhang, G.; Wei, X.; Chen, D.; Wang, X.; Chen, S.; Zhu, J.; Dai, H. Thermal characteristic evolution of lithium-ion batteries during the whole lifecycle. J. Energy Chem. 2024, 92, 534–547. [Google Scholar] [CrossRef]
- Li, H.; Wang, S.; Yang, L.; Zhou, Z.; Meng, Y.; Zhang, W.; Shuan, Z.; Li, Y.; Lv, F. SOH estimation method for lithium-ion battery packs under real-world operating conditions based on a new attenuated model without additional experiments. Energy 2025, 330, 136802. [Google Scholar] [CrossRef]
- Lin, C.; Tuo, X.; Wu, L.; Zhang, G.; Lyu, Z.; Zeng, X. Physics-informed machine learning for accurate SOH estimation of lithium-ion batteries considering various temperatures and operating conditions. Energy 2025, 318, 134937. [Google Scholar] [CrossRef]
- Yuan, X.-D.; Qian, D.-M.; Wang, X.-Y.; Tang, C.-Y.; Hu, S.; Cui, T.; Yuan, W.-J. Numerical research on electrochemical behavior, thermal characteristics, and aging formation of lithium-ion cell at different ambient temperatures and charge/discharge rates. Energy Fuels 2024, 38, 21554–21574. [Google Scholar] [CrossRef]
- Mohtat, P.; Siegel, J.B.; Stefanopoulou, A.G.; Lee, S. UofM Pouch Cell Voltage and Expansion Cyclic Aging Dataset [Data Set]; Deep Blue Data; University of Michigan: Ann Arbor, MI, USA, 2021. [Google Scholar] [CrossRef]
- Jingyi, W.; Yijing, H.; Song, H. Current situation analysis of echelon utilization of traction battery for new energy vehicle industry. In Proceedings of the 2022 IEEE International Conference on Electrical Engineering, Big Data and Algorithms (EEBDA), Changchun, China, 25–27 February 2022; IEEE: New York, NY, USA, 2022; pp. 693–696. [Google Scholar] [CrossRef]
- Li, S.; Fu, Z.; Zhu, J.; Yuan, Y. Estimation of state-of-health for lithium-ion battery based on increment capacity analysis method and long short-term memory neural network. In Proceedings of the 2023 IEEE/IAS Industrial and Commercial Power System Asia (I&CPS Asia), Chongqing, China, 7–9 July 2023; IEEE: New York, NY, USA, 2023; pp. 1818–1823. [Google Scholar] [CrossRef]
- Mohammed, M.A.; El-Feky, S.F. An enhanced filter-based approach for feature selection. In Proceedings of the 2025 Intelligent Methods, Systems, and Applications (IMSA), Giza, Egypt, 12–13 July 2025; IEEE: New York, NY, USA, 2025; pp. 539–543. [Google Scholar] [CrossRef]
- Cheng, X.; Gao, X.; Ma, F.; Wang, Y. State of health estimation of lithium-ion batteries with feature interpretability based on partial charge curves. J. Electrochem. Soc. 2025, 172, 030509. [Google Scholar] [CrossRef]
Disclaimer/Publisher’s Note: The statements, opinions and data contained in all publications are solely those of the individual author(s) and contributor(s) and not of MDPI and/or the editor(s). MDPI and/or the editor(s) disclaim responsibility for any injury to people or property resulting from any ideas, methods, instructions or products referred to in the content. |
© 2026 by the authors. Licensee MDPI, Basel, Switzerland. This article is an open access article distributed under the terms and conditions of the Creative Commons Attribution (CC BY) license.