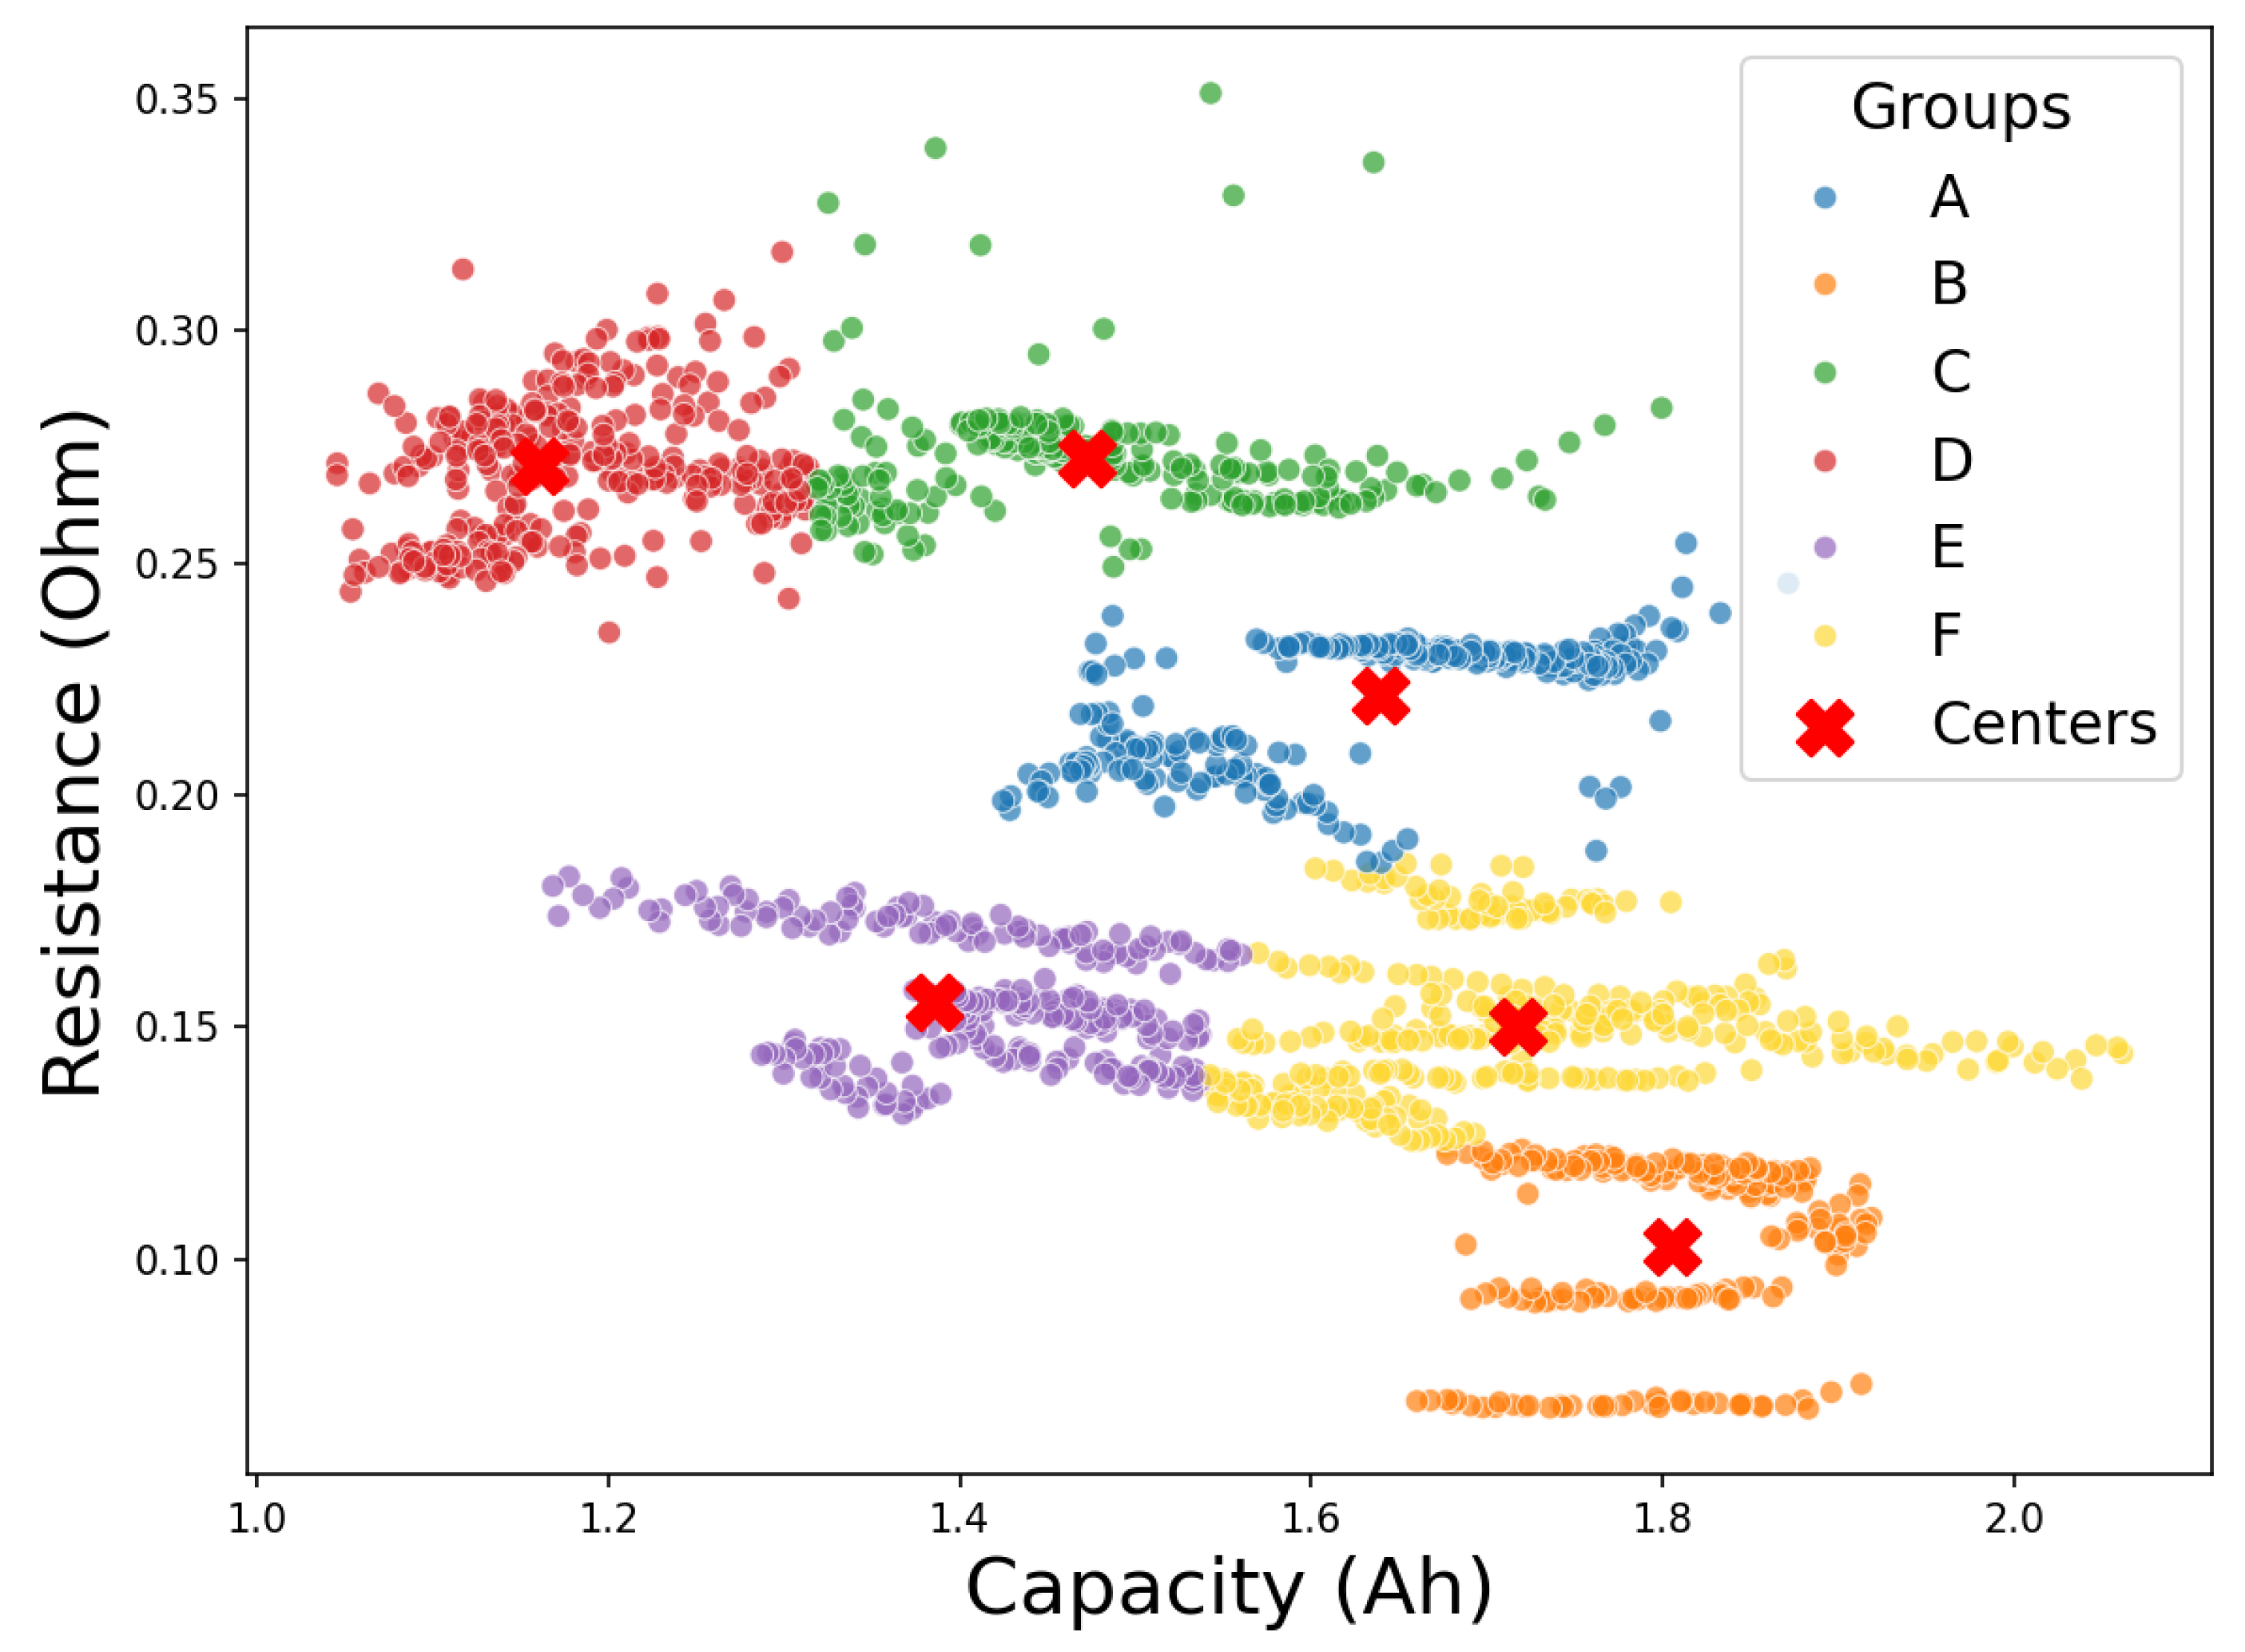
3.3.1. Practical Application
The procedure proposed in this study can be integrated into the industrial workflow for the evaluation and reallocation of batteries for second-life applications. In a practical scenario, the company responsible for this process would first conduct controlled capacity and internal resistance tests on a representative set of batteries sourced from different electric vehicle models. These tests would be carried out at various temperatures and under full charge–discharge profiles, with the objective of training and validating the predictive models for capacity and internal resistance. Including data from different operating temperatures, currents, and depths of discharge (DoDs) allows the model to account for the influence of a battery’s typical operating environment on its degradation profile. In fact, for precise classification, it is necessary to know at least the average operating temperature, current, and DoD of the battery during its first life so that these can be incorporated as input features for capacity and resistance estimation. If these values are highly variable over the first life, then a more detailed characterization would be required, ideally including full charge–discharge curves under representative conditions, to enable a more accurate aging assessment.
This initial phase also involves applying the K-means algorithm to the test cell dataset in order to define the cluster structure in the capacity–resistance plane, thus establishing reference groupings for subsequent classification.
Once the clusters have been defined and the predictive models validated for each cell type (brand, model, and chemistry), the classification of an individual user battery involves performing a limited number of or standardized charge–discharge cycles under controlled temperature and current conditions, to minimize additional aging. From the recorded voltage, current, and temperature signals, the required features would be extracted and fed into the corresponding deep neural network (DNN) model to estimate the current capacity and internal resistance. These values would then be used to position the battery within the pre-established K-means clustering space, assigning it to the group that best represents its health profile.
To verify the robustness of the classification, at least one additional standardized cycle should be performed, confirming that the cell remains within the same cluster despite minor variations in the test procedure. The resulting classification would enable the preliminary allocation of the battery to power-oriented or energy-oriented applications or, alternatively, to recycling if its parameters fail to meet the minimum thresholds. Prior to integration into a new battery pack, an additional quality control stage would be required, including performance testing under real operating conditions, the verification of homogeneity between cells, and safety parameter checks. These measures would ensure the electrical and thermal compatibility of the assembled pack and mitigate the risk of accelerated degradation or premature failure during its second-life operation.
This methodology does not require access to the historical data or cycling records of a battery throughout its first life, and it is scalable and transferable to different battery models. It only requires the cycling of a representative set of test cells, the building of the predictive model, and the generation of the classification maps. In cases where the specific battery or vehicle model is not available, an approximation could be made by leveraging data from multiple battery types that share similar cell chemistries, electrode materials, or design characteristics. Such flexibility broadens the applicability of the proposed framework to a wide range of electric vehicle batteries, supporting second-life decision-making even in the absence of model-specific datasets.
In this study, the classification maps were generated from multiple charge–discharge cycles performed under different operating conditions on a common battery type, as used in the NASA experiments. These maps define the reference structure in the capacity–resistance plane shown in
Figure 6. Consequently, if a battery with an unknown operational background becomes available, its aging characteristics can be determined by measuring a set of key parameters and performing a small number of complete charge–discharge tests. The resulting capacity and internal resistance values would allow its direct positioning within the classification map, thus enabling the identification of the most suitable second-life application for this battery.
3.3.2. Influence of Operating Conditions on Battery Health
Following the execution of the clustering algorithm, it is essential to carry out a detailed interpretation of the resulting groupings and their physical relevance, with a particular emphasis on the variables that influence battery aging. Analyzing the structure and composition of the clusters is key to determining whether all critical features have been appropriately captured in the classification process and whether these groupings provide meaningful insights into the second-life potential of each battery.
This section focuses on the temperature, discharge current, and depth of discharge (DoD), which are also included as input features in the proposed model. These parameters are widely recognized as the primary external drivers of lithium-ion battery degradation, owing to their direct impacts on ion transport, interfacial reaction rates, and mechanical stresses within the electrode structure [
17,
34,
39]. By examining their effects on both the capacity and internal resistance, the observed cluster trajectories can be physically interpreted in terms of the dominant aging mechanisms activated under different operating regimes.
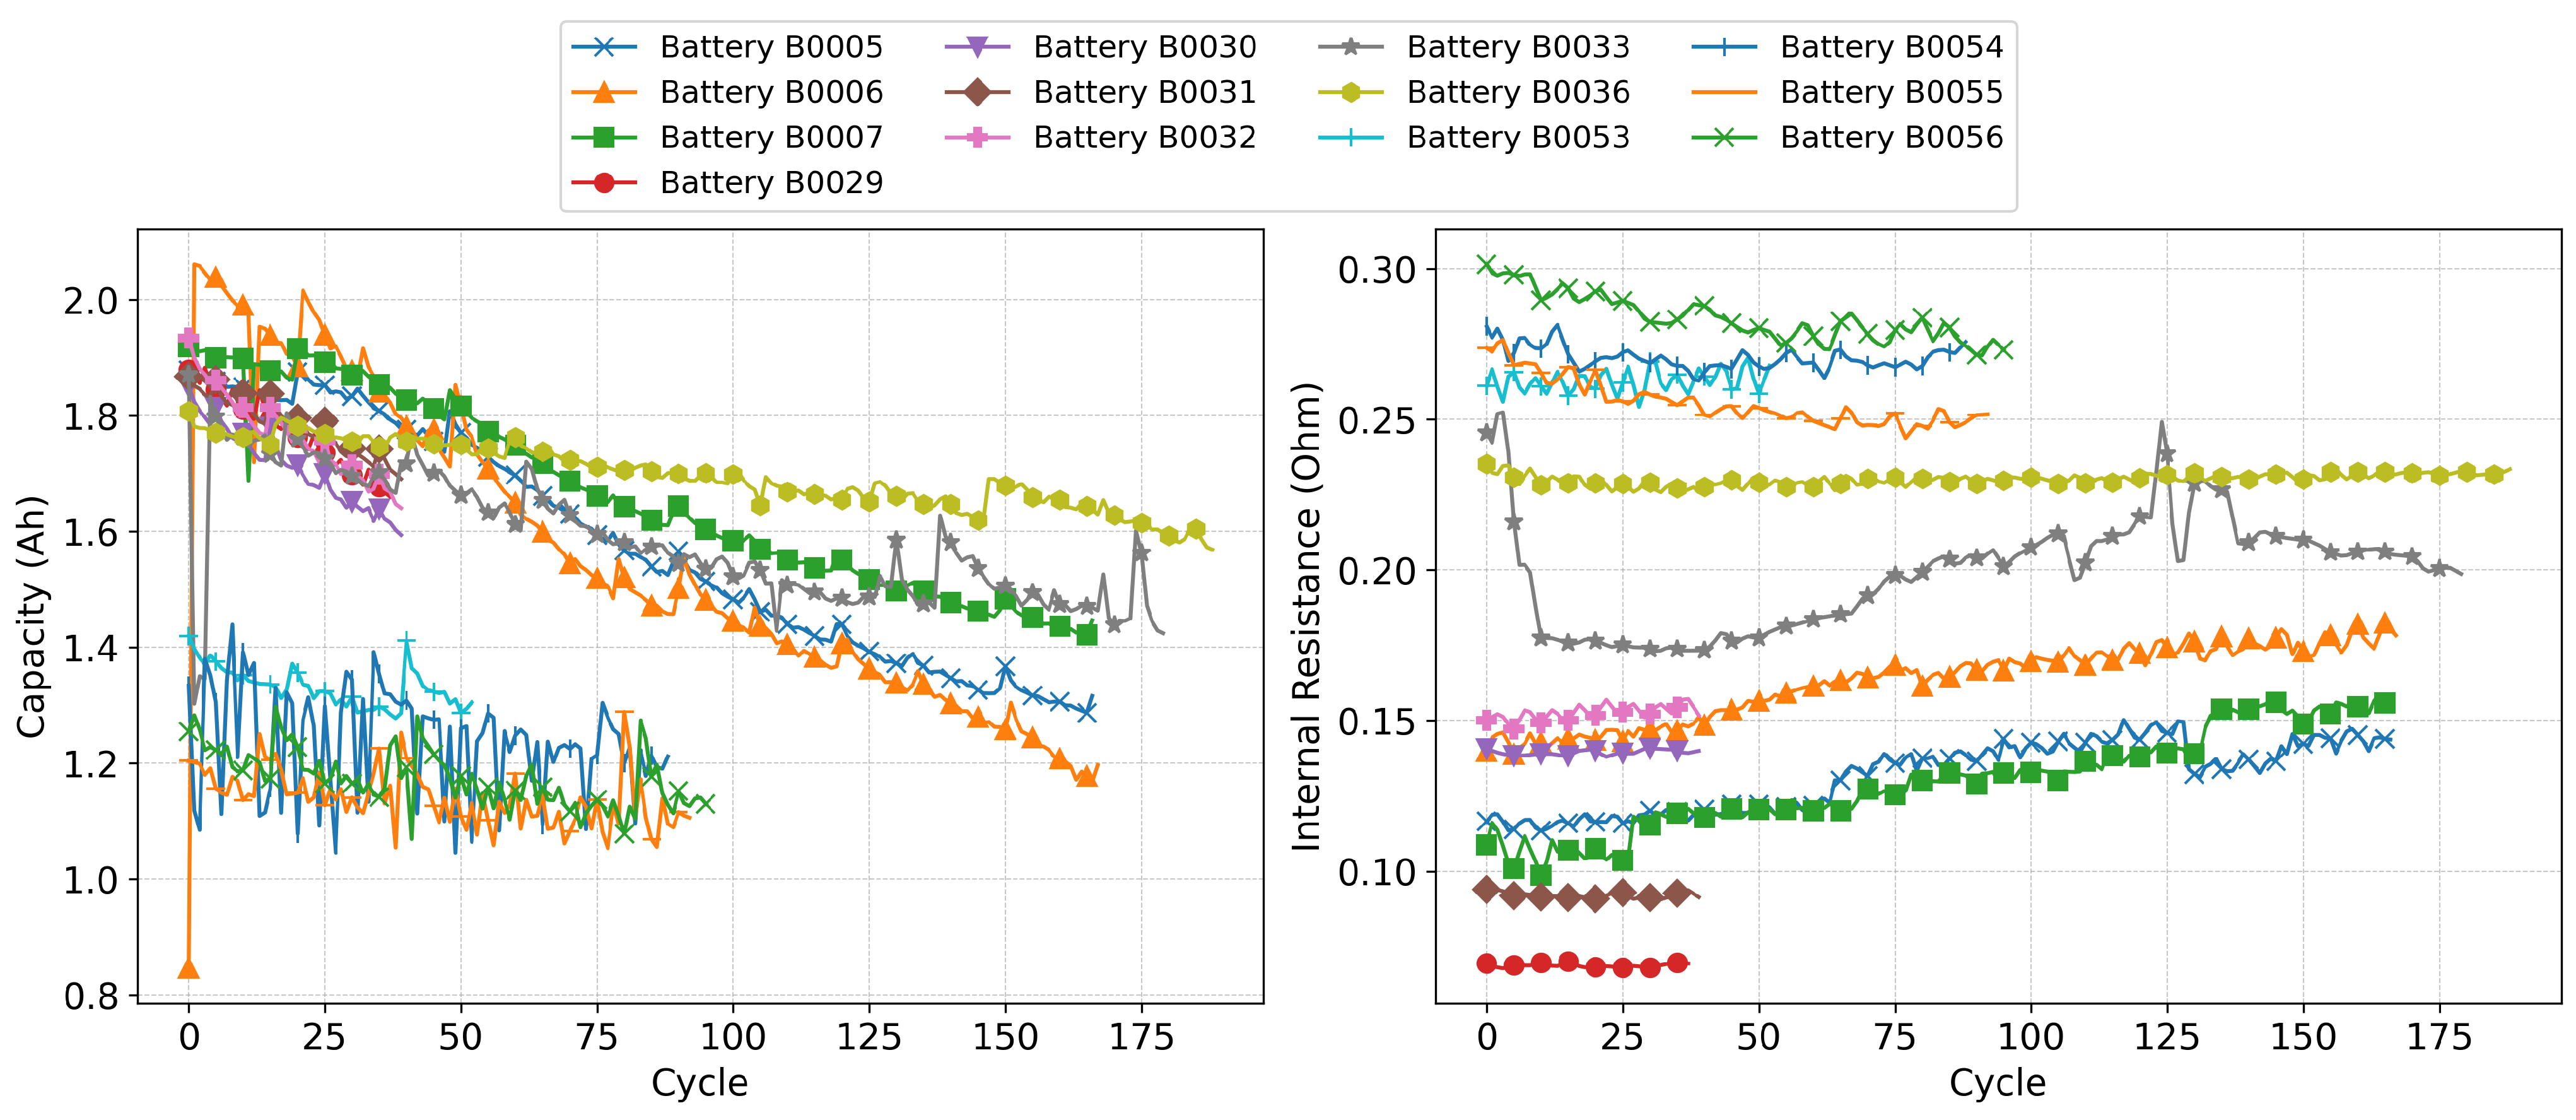
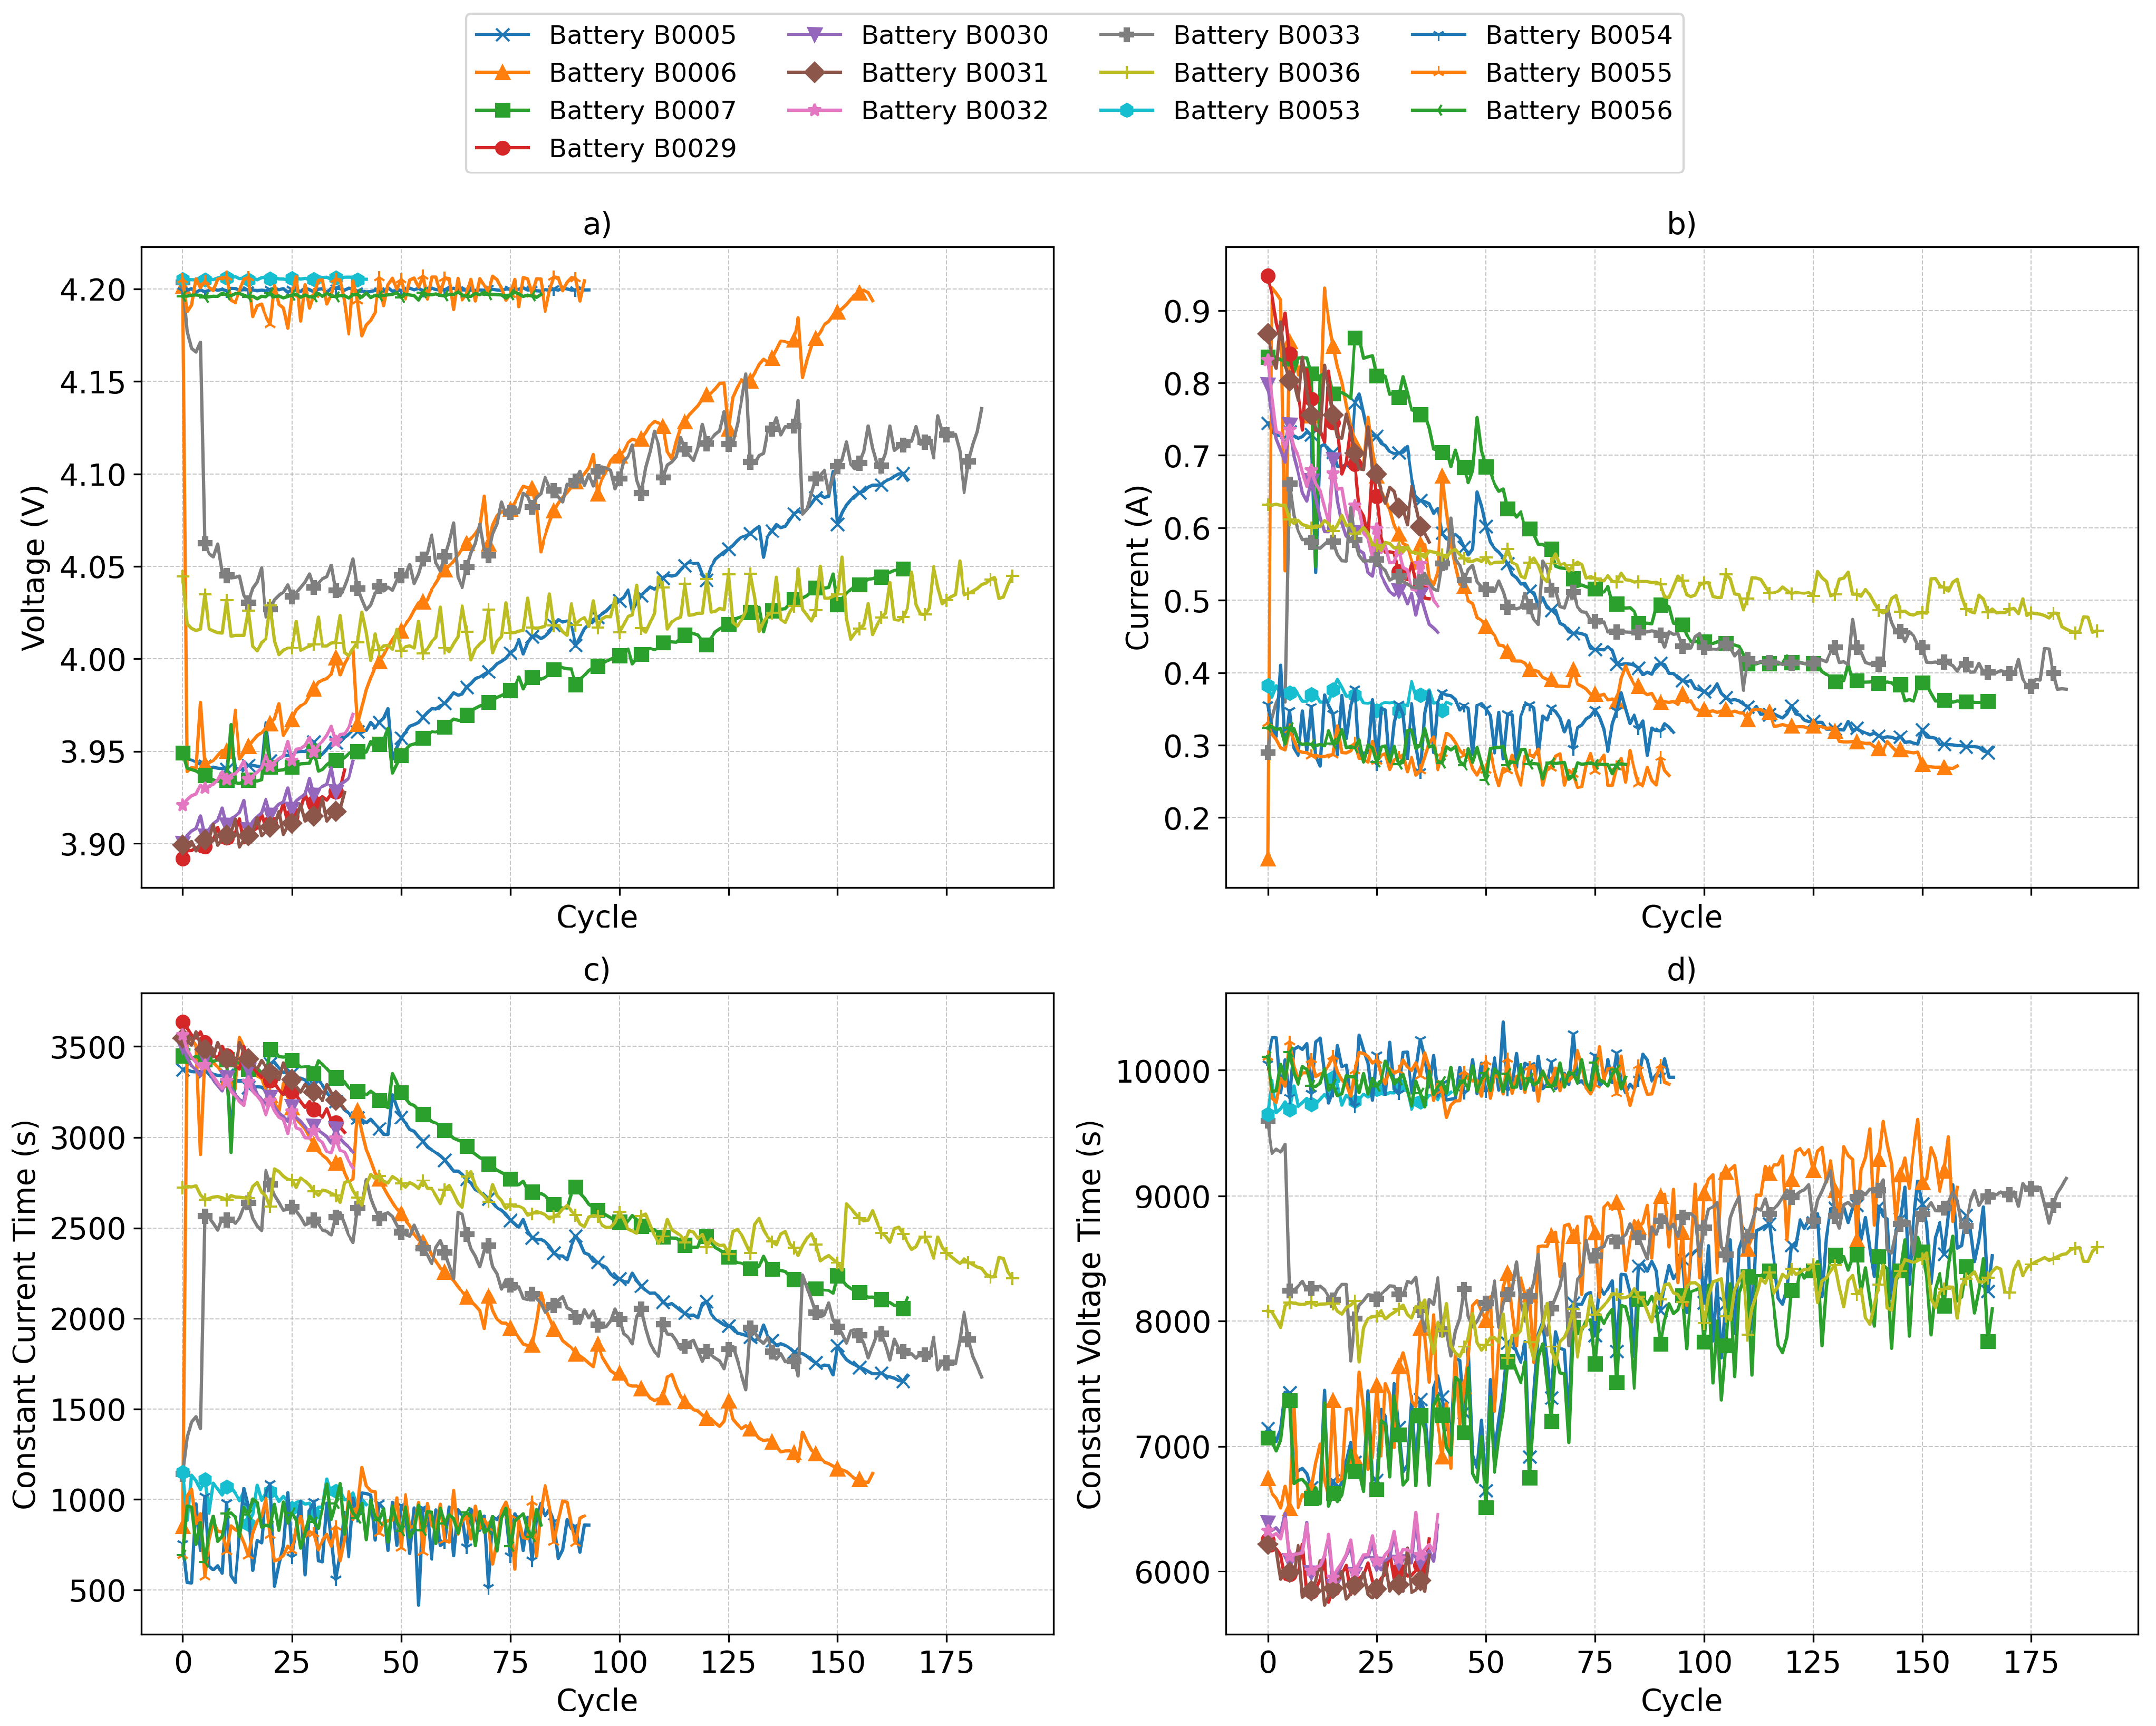
The NASA Battery Aging Datasets offer valuable context for this analysis. Specifically, the batteries numbered 5, 6, 7, 53, 54, 55, and 56 underwent charge–discharge cycling until their capacities dropped below 30% of the initial values recorded during the first cycle. This extended testing period may explain why these batteries appear with a higher number of data points. In contrast, batteries 29 to 34 and battery 36 were only tested until a 20% capacity drop was observed, which could account for their lower representation in the dataset.
To explore the underlying patterns in the dataset, a clustering analysis was performed using estimated health parameters, including the capacity and internal resistance. When the batteries are visualized according to the environmental and operational conditions that were initially considered as classification features—specifically, the temperature, discharge current, and depth of discharge—distinct patterns emerge. As shown in
Figure 7, certain clusters align with specific ranges of these variables, suggesting that external stress factors play a significant role in determining the trajectory of battery degradation. In all three subfigures, a color gradient is used to represent battery cycling progression: lighter tones correspond to early cycles, while darker, more intense tones indicate later cycles. Across the plots, a subtle shift is noticeable toward the upper-left quadrant, reflecting a general trend of increasing internal resistance and decreasing capacity as the number of cycles grows. This allows one to trace the evolution of the capacity and resistance depending on different variables. This plot is particularly interesting as, typically, only the capacity or resistance evolution is plotted. However, the combined plot provides additional insight into the battery life and its degradation.
Figure 7a displays the temperatures at which the charge–discharge cycles were performed, as indicated in the legend. A noticeable pattern can be observed: the internal resistance increases and the capacity decreases at lower operating temperatures [
17]. This phenomenon can be attributed to the reduction in ionic conductivity and the increase in electrolyte viscosity at low temperatures, which hinder lithium-ion transport and elevate the overpotential. Such conditions promote lithium plating during charging and accelerate impedance growth, leading to the combined loss of usable capacity and increased resistance [
17,
40].
Figure 7b uses a similar color scheme, where blue corresponds to a lower discharge current of 2 A and black to a higher current of 4 A. At first glance, one might infer a significant reduction in capacity at lower current levels; however, a more detailed analysis is required, especially considering the number of cycles performed for each battery.Higher discharge currents increase the cell polarization and overpotential, intensifying side reactions such as SEI growth and, under low-temperature conditions, lithium plating. At moderate temperatures, high C-rates tend to accelerate the mechanical degradation of electrodes and loss of active material, often causing capacity fade without a proportional resistance rise [
17,
39].
Figure 7c illustrates the final discharge voltage for each battery, represented through a color-coded scale. Contrary to the trends observed in
Figure 7a,b, this parameter does not reveal any evident pattern in terms of correlating with either capacity degradation or an internal resistance increase. This observation aligns with prior findings that indicate that the discharge voltage alone is not always a reliable indicator of battery aging, especially when considered independently of other parameters, such as resistance or impedance evolution [
39].
To better understand how batteries are affected by the depth of discharge—particularly through a more in-depth examination of
Figure 7—the batteries were grouped according to the discharge current and temperature conditions applied during cycling. A similar methodological approach has been applied in prior research to analyze the impact of varying thermal and electrical profiles on degradation behavior, allowing for the identification of distinct aging pathways across groups [
12]. These groupings are consistent with the dataset’s own classification under the term ‘Experiments’, as detailed in
Table 7. As a result,
Figure 6 is subdivided as in
Figure 8, which displays these experiments along with their corresponding current and temperature values.
Figure 8 illustrates how the battery distributions vary depending on their depth of discharge under experimental conditions with a fixed current and temperature. In Experiment 4, where both the current and temperature were high, there was a clear trend showing that batteries subjected to lower depths of discharge exhibit reduced internal resistance. This observation aligns with previous studies, which have shown that lower depths of discharge can mitigate internal resistance growth when the current and thermal conditions are kept constant [
39]. A similar pattern could be observed in Experiment 3. Notably, although battery 6 displayed the highest depth of discharge and occupied an intermediate position in terms of internal resistance, it is still grouped under this experiment in the dataset. This intermediate behavior could potentially be explained by the lower discharge current used during its cycling, despite its classification alongside batteries tested under more demanding conditions.
In contrast, Experiments 1 and 2 did not exhibit any clearly recognizable pattern in the variation in internal resistance with respect to the depth of discharge. This observation suggests that the depth of discharge may be a secondary factor in determining the internal resistance, particularly under discharge currents exceeding 1C, where the resistance tends to increase as the depth of discharge decreases.The depth of discharge affects both the fraction of active material utilized and the magnitude of volumetric strain experienced during cycling. A high DoD increases SEI turnover and the mechanical stress on electrodes, accelerating particle cracking and contact loss. Conversely, a moderate DoD under stable thermal and current conditions can mitigate impedance growth, which is consistent with the clustering trends observed in this study [
9,
34].
Beyond the previously discussed findings, and based on the graphical information and the known characterization process of each battery, several insights can be drawn regarding the classifications produced by the algorithm. Firstly, batteries grouped into Classes B, E, and F correspond primarily to cells cycled under Experiment 1 and Experiment 4. Although the batteries in Experiment 4 experienced severe capacity degradation within just 40 cycles, they maintained remarkably low internal resistance. This trait makes them promising candidates for power-oriented applications—an aspect that could be overlooked if the classification was based solely on the capacity. This distinction between capacity and resistance is consistent with recent findings that emphasize the importance of using both parameters to accurately evaluate the suitability of aged batteries for second-life applications [
34].
Batteries categorized as ’Void’, corresponding to Classes C and D, belong largely to subsets of Experiment 1 and to Experiment 3. The latter involved very low-temperature conditions. While the rate of capacity fade was slower than in batteries tested at higher temperatures, factors such as electrolyte freezing may have caused a significant loss of capacity—up to 30% of the expected nominal value—starting from the very first cycle. This behavior is consistent with studies indicating that low temperatures can trigger immediate and substantial capacity loss due to phenomena like lithium plating and electrolyte solidification, even in the early stages of cycling [
12,
17].
Most batteries from Experiment 3 were associated with energy-oriented applications. Despite being subjected to high discharge currents, the ambient temperature remained stable at 24 °C. This moderate thermal environment played a key role in reducing the rate of capacity degradation, as temperatures close to room temperature are known to mitigate stress-induced side reactions within the cell, even under elevated C-rates. Recent studies, such as the work by Waldmann et al. [
41], have demonstrated that the aging rate of lithium-ion batteries is minimal at temperatures around 25 °C, highlighting the importance of maintaining optimal thermal conditions during operation. As a result, it was possible to collect a substantial number of valid samples during the experimental campaign.
Standard operating conditions, as represented in Experiment 1, suggest that elevated temperatures accelerate electrochemical reactions within the battery, resulting in lower internal resistance. This is consistent with previous findings showing that higher temperatures enhance ionic mobility and interfacial kinetics, leading to reduced impedance during operation [
42]. However, when these thermal conditions are combined with high discharge currents, the cumulative stress accelerates capacity fade due to side reactions such as SEI growth or the loss of active material, without a proportional increase in internal resistance. In contrast, lower temperatures lead to faster equilibrium stabilization, which mitigates aging effects but increases the internal resistance and reduces the usable capacity—likely due to hindered lithium-ion transport and increased electrolyte viscosity [
40].
Finally, batteries exposed to high currents under standard temperatures exhibited mixed behaviors. These cells degraded more slowly than those tested under elevated temperatures, while also maintaining intermediate values in terms of both capacity and resistance. This hybrid behavior reinforces the complex interplay between thermal and electrical stress factors in shaping battery aging trajectories. This observation is supported by recent findings that emphasize how battery degradation is governed by a coupled mechanism involving both electrochemical and thermal factors, rather than by either variable in isolation [
32].
To deepen the interpretation of the battery degradation dynamics, a vector field analysis was introduced to track the average direction and intensity of aging progression in the SoH-R plane. These flow fields were computed by aggregating intercycle transitions among the SoH and R and segmented according to key operational variables.
Figure 9 illustrates the vector field resulting from ambient temperature conditions. Notably, it shows a clear trend: at low temperatures (4 °C), the aging vectors point sharply toward higher internal resistance, with relatively modest SoH loss, indicating impedance-dominated degradation. At moderate temperatures (24 °C), the transitions are more evenly balanced, while, at high temperatures (43 °C), the capacity degrades rapidly, with a minimal increase in R, confirming that elevated thermal conditions favor the kinetic acceleration of side reactions without significantly worsening the internal resistance. These graphical observations align strongly with the previous conclusions regarding Experiments 2 and 4 and reinforce the role of the temperature as a primary aging determinant.
