Article

Electro-Thermal Modeling and Parameter Identification of an EV Battery Pack Using Drive Cycle Data

1
The Department of Mechanical Engineering, University of Michigan-Dearborn, Dearborn, MI 48128, USA
2
Hyundai America Technical Center Incorporated, Ann Arbor, MI 48198, USA
*
Authors to whom correspondence should be addressed.
Batteries 2025, 11(9), 319; https://doi.org/10.3390/batteries11090319 (registering DOI)
Submission received: 1 July 2025 / Revised: 18 August 2025 / Accepted: 22 August 2025 / Published: 27 August 2025

Abstract

This paper presents a novel electro-thermal modeling approach for a lithium-ion battery pack in an electric vehicle (EV), along with parameter identification using controller area network (CAN) data collected from chassis dynamometer and real-world driving tests. The proposed electro-thermal model consists of a first-order equivalent circuit model (ECM) and a lumped-parameter thermal network in considering a simplified cooling circuit layout and temperature distributions across four distinct zones within the battery pack. This model captures the nonuniform heat transfer between the pack modules and the coolant, as well as variations in coolant temperature and flow rates. Model parameters are identified directly from vehicle-level test data without relying on laboratory-level measurements. Validation results demonstrate that the model can predict terminal voltage with an RMSE of less than 6 V (normalized root mean square error of less than 2%), and battery module surface temperatures with root mean square errors of less than 2 °C for over 90% of the test cases. The proposed approach provides a cost-effective and accurate solution for predicting electro-thermal behavior of EV battery systems, making it a valuable tool for battery design and management to optimize performance and ensure the safety of EVs.

1. Introduction

The rapid growth of electric vehicle (EV) adoption has greatly increased the demand for efficient and reliable energy storage systems. Among the various available technologies, lithium-ion (Li-ion) batteries have emerged as the leading choice due to their high energy density, relatively long cycle life, and dependable performance across diverse operating conditions [1]. To fully realize the potential of Li-ion batteries, accurate modeling is essential for battery design and management, leading to enhanced performance, longevity, and safety. In particular, electro-thermal models, which integrate both electrical and thermal behaviors, play a crucial role by enabling predictive simulations of battery behavior in real-world scenarios, and by supporting the design, control, and optimization of EV powertrains [2,3].
Significant research has focused on developing battery models that predict the electrical and thermal behavior of battery cells, which are generally classified as either physics-based or phenomenological models [4,5]. Physics-based models, often formulated using partial differential equations, provide detailed insight into internal battery states but require a large number of parameters and states. This complexity makes parameter identification particularly challenging without access to high-quality laboratory data [6,7,8]. In contrast, phenomenological models, such as equivalent circuit models (ECMs) and lumped parameter thermal network models (LPTNMs), are based on simplified yet reasonable assumptions and involve far fewer parameters. Despite their simplicity, these models are widely recognized in the literature for offering a good balance of accuracy and computational efficiency [9,10].
Recent efforts have focused on applying phenomenological models to vehicle-level simulations [11,12]. However, replicating laboratory-specific battery tests—such as hybrid pulse power characterization—under real-world driving conditions is nearly impossible. Consequently, model parameters must be identified using data collected from vehicle testing, and several studies have attempted to address this challenge. Kim et al. [13] identified the ECM parameters of a Li-ion battery pack model using chassis dynamometer test data, but did not incorporate thermal dynamics. Similarly, Shin et al. [14] developed a vehicle-level Li-ion battery model using chassis dynamometer test data to construct both pack- and cell-level models, but omitted thermal dynamics and focused on a narrow temperature range (20 °C to 30 °C). These limited operating conditions restrict its applicability in capturing thermal behavior under various real-world conditions.
It is challenging to accurately model the thermal behavior of a battery pack at the vehicle level due to its complex design and associated heat transfer characteristics. Some researchers have attempted to develop pack-level battery thermal models by scaling up cell-level models or by utilizing measurement data from actual vehicle tests [14]. In [15], Lin et al. introduced an online parametrization method for a single cylindrical cell and extended it to a battery cluster under the assumption of uniform air cooling. While their work provides valuable insights into core–surface temperature estimation and sensor placement strategies, the model simplifies internal resistance and cooling conditions, overlooking the heterogeneous flow and thermal pathways typical in production EVs. In [16], Samad et al. integrated a distributed ECM with a finite element flow model for prismatic cells to improve spatial accuracy, albeit at a higher computational cost. In [17], Park and Jung investigated the influence of cell arrangement, inter-cell spacing, and cooling media (air vs. liquid) on heat transfer and parasitic power consumption. However, their primary static analysis did not account for temperature extremes (−10 °C to 50 °C) and the dynamic drive-cycle variations in real-world EV operation. Additionally, many of these models have not explicitly incorporated detailed coolant-circuit layouts, such as cooling plates located beneath the battery pack.
Despite these contributions, there remains a critical need for a comprehensive electro-thermal model that accounts for coolant circuit layouts and spatial temperature distributions in production EV battery packs using real-world vehicle data. An integrated modeling framework is proposed in this work to capture both the electrical and thermal behaviors, including the influence of coolant flow beneath the battery modules. The proposed model combines a first-order ECM with a lumped parameter thermal network model. Particularly, the thermal model divides the pack into four zones and incorporates a simplified coolant circuit layout and heat transfer pathways. Model parameters are identified using drive-cycle CAN data collected from both chassis dynamometer and on-road testing, eliminating dependence on costly laboratory experiments. The resulting model is validated with the datasets, demonstrating its effectiveness in predicting terminal voltage and temperatures.
This study addresses a documented gap in the literature—the absence of vehicle-level electro-thermal models that employ multiple temperature nodes within both the battery pack and coolant passages, and that can be parameterized using real driving data. A MATLAB-implementable framework is presented that (i) identifies electrical and thermal parameters solely from readily available CAN data across wide SOC and ambient-temperature ranges; (ii) couples a first-order ECM with a four-zone lumped thermal network that explicitly represents the pack’s physical layout; and (iii) maintains real-time applicability with a modest parameter count. Relative to vehicle-level ECM approaches that omit thermal dynamics or are validated over narrow temperature bands [13,14], the model yields reliable pack-temperature prediction under asymmetric, liquid-cooled conditions. Compared with cell-scale up models that require controlled laboratory testing and incur higher computational cost [15], it provides a production-oriented, data-efficient alternative that bridges ECM-only vehicle-level models and high-fidelity thermal simulations, enabling parameterization from real-world driving without costly laboratory tests.
The remainder of this paper is organized as follows: Section 2 describes the vehicle-level test data used for model development and validation. Section 3 details the configuration of the electro-thermal model, including the electrical and thermal components as well as the considered heat generation. Section 4 presents the parameter identification process and how real-world driving data was used. Section 5 provides validation results and a discussion about the performance of the parametrized electro-thermal model. Finally, Section 6 concludes with key findings and outlines potential directions for future research.

2. Vehicle Test Data

To develop and validate the proposed electro-thermal model, a comprehensive set of vehicle-level test data was collected from a production electric vehicle equipped with a Li-ion battery pack. The pack consists of 30 modules, arranged in a four-row layout. The pouch cells use nickel–manganese–cobalt (NMC) chemistry for the cathode and graphite for the anode, and the pack has a nominal capacity of 73 kWh. For thermal management, the battery pack integrates a cooling system located beneath the modules, utilizing a cold plate with embedded coolant passages to facilitate forced cooling and heating, thereby maintaining the battery within safe operating temperatures.
The test data were collected under various operating conditions, including both controlled climatic chassis dynamometer tests and real-world on-road driving tests. Table 1 summarizes the characteristics of the test data used for this study, including the SOC range and the ambient temperature. Chassis dynamometer tests include standardized driving cycles such as WLTC, US06, and FTP-75. In addition, several datasets from the test vehicle manufacturer are included. On-road tests such as Test4, Test5, and Test6 captured representative real-world driving conditions and vehicle settings. The total number of test data used for this study is 31. While tests were conducted at a wide range of ambient temperatures from −10 °C to 45 °C, the datasets utilized in this study are weighted toward mid-temperature, mid- to high-SOC operation. Specifically, more than 80% of the drive-cycle segments were recorded while the pack surface temperature ranged from 15 °C to 40 °C, whereas less than 20% corresponded to cold-temperature conditions below 10 °C. A similar concentration is observed in the state-of-charge (SOC) domain—over 80% of the samples fall within a SOC window of 40–90%.
Vehicle CAN signals were recorded and supplemented with external instrumentation to acquire additional measurements beyond those available from the battery management system. The data acquisition system recorded signals at frequencies ranging from 1 Hz to 100 Hz. Each dataset is a time series containing battery pack current, terminal voltage, SOC, battery pack surface temperature at eight different locations, coolant inlet and outlet temperatures, ambient temperature, coolant flow rate, and chassis temperature. These signals served as essential inputs for developing and validating the electro-thermal model, ensuring its performance in capturing the coupled electrical and thermal behaviors of the battery pack.

3. Configuration of the Electro-Thermal Model

This section describes the structure of the coupled electro-thermal model developed for the EV battery pack. The model is designed to capture the dynamic relationship between electrical parameters with temperature and SOC, enabling accurate estimation of battery surface temperatures across four distinct zones within the pack. The overall structure of the model is shown in Figure 1. The electrical and thermal components are coupled through heat generation and temperature feedback mechanisms to capture interactions.

3.1. Electrical Model

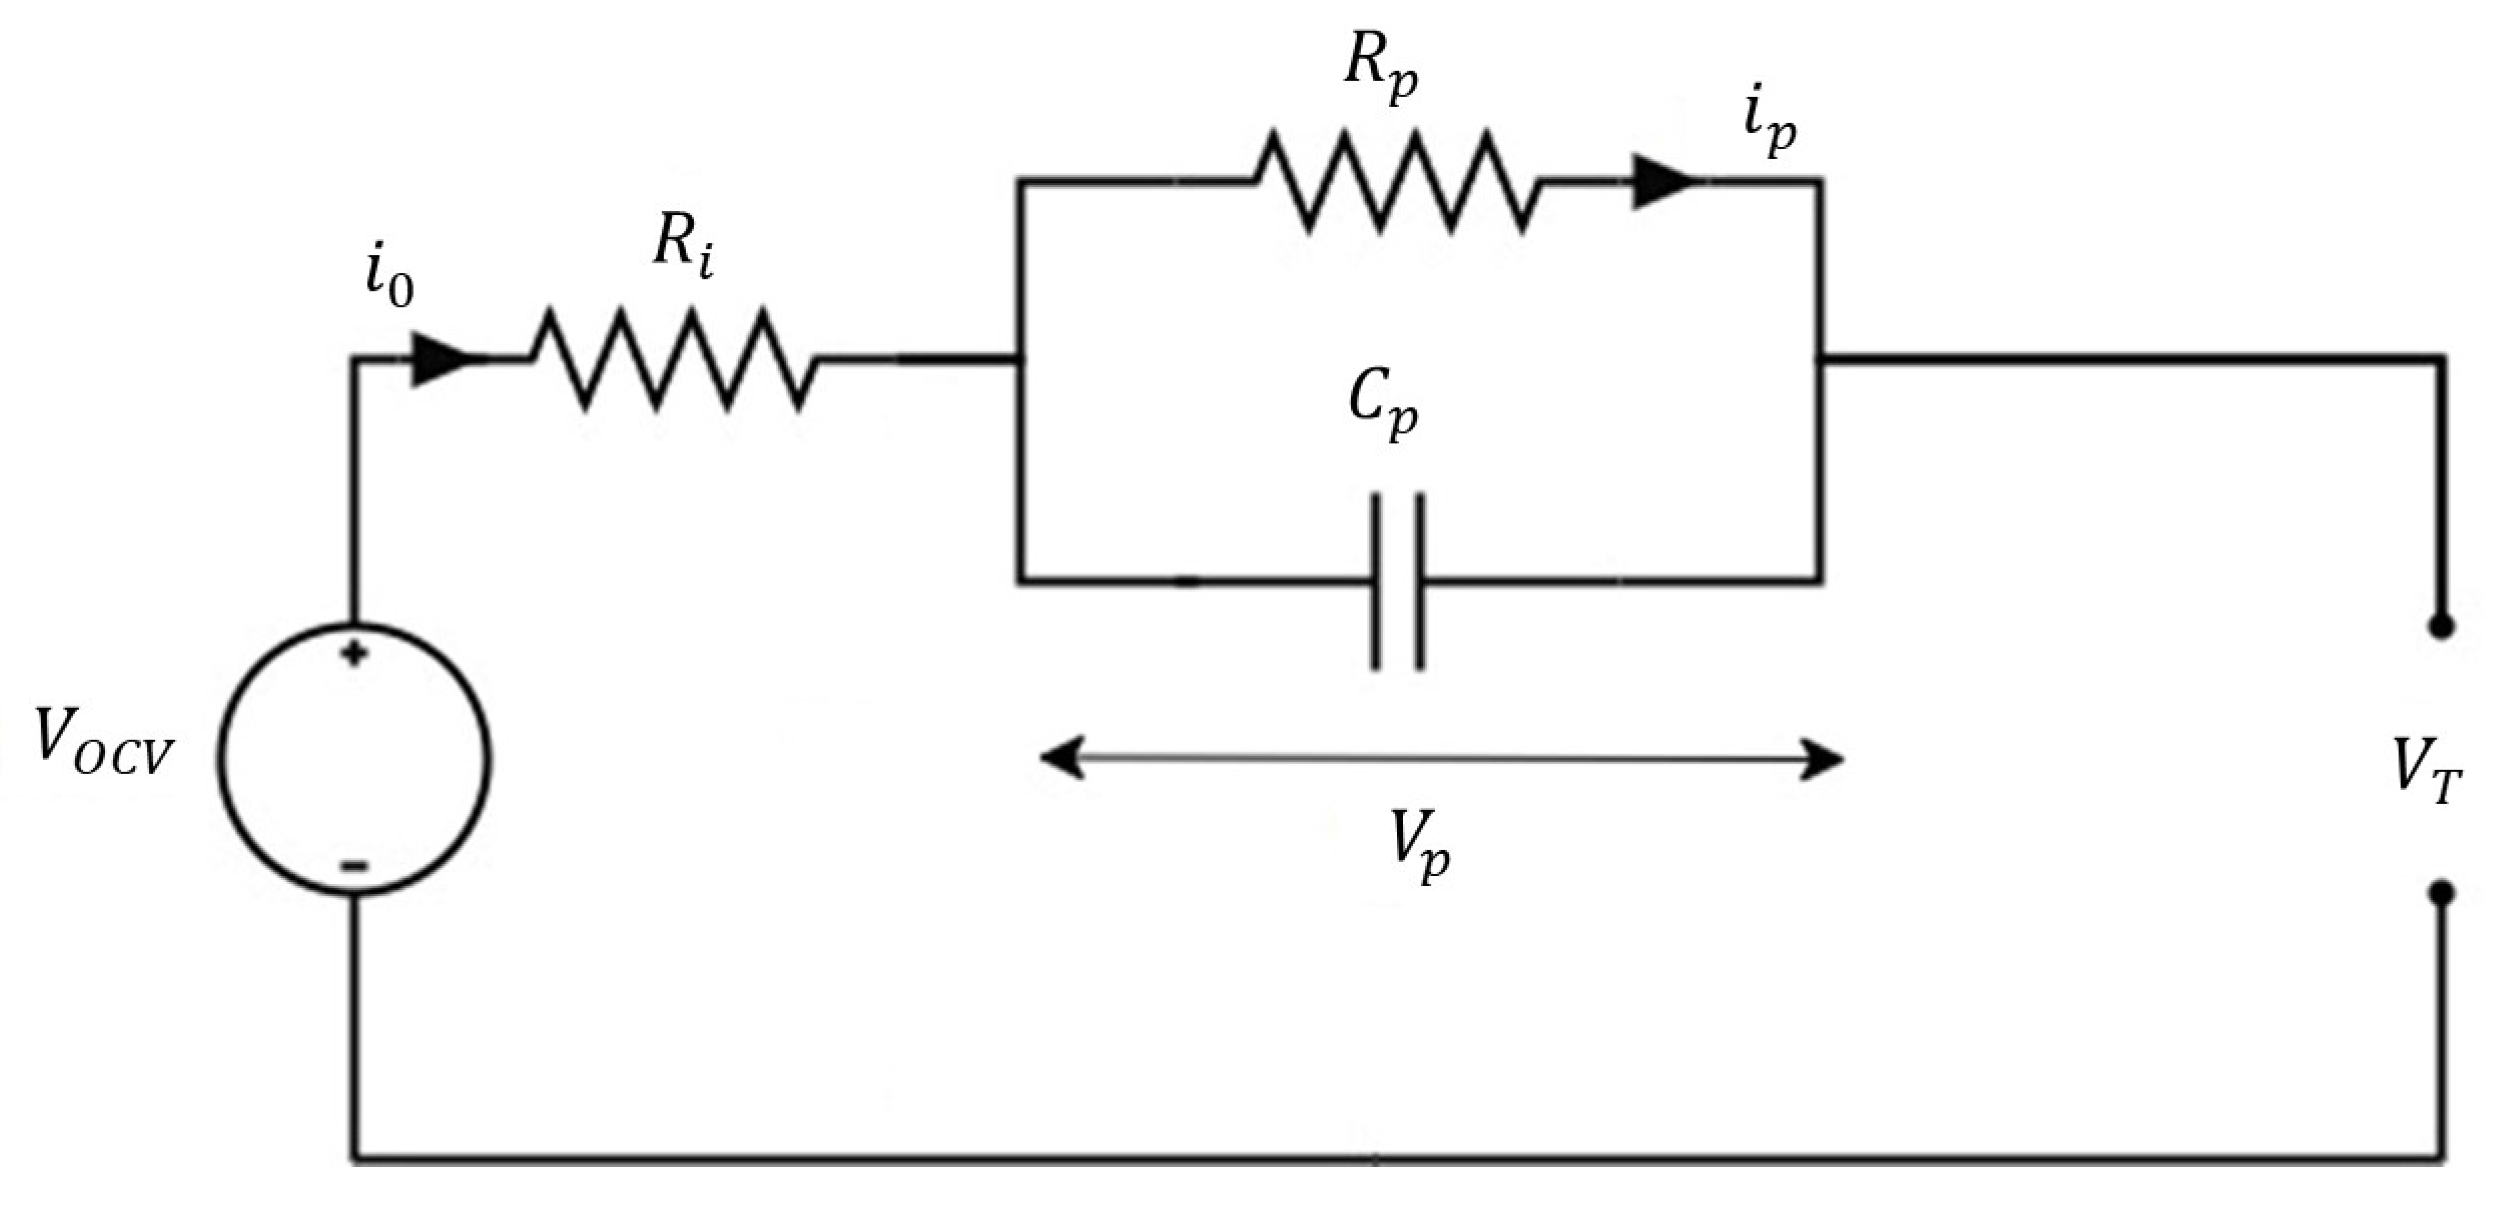
Given that previous studies have demonstrated that a first-order ECM achieves a commendable balance between accuracy and complexity [9,18,19,20], a first-order ECM is adopted in this study for the electrical component of the coupled battery model. Figure 2 illustrates the schematic of the first-order ECM, which consists of an open-circuit voltage ( V O C V ), an internal resistance ( R i ), a parallel RC pair characterized by a polarization resistance ( R p ), and a polarization capacitance ( C p ). The electrical parameters are typically modeled as functions of battery SOC and temperature.
The battery electrical dynamics are captured by the following equations:
d S O C d t = 1 C bat i 0
     d V p d t = V p R p C p + 1 C p i 0
      V T = V O C V V p i 0 R i
where C bat is the battery pack capacity, i 0 is the battery current (positive during discharge), V p is the polarization voltage, and V T is the terminal voltage. The open-circuit voltage ( V O C V )—the battery terminal voltage when no current is drawn—is modeled as a nonlinear function of SOC. Due to a lack of sufficient data points across a broad temperature range, no clear temperature dependency could be identified. Therefore, in this study, OCV is assumed to depend solely on SOC. By adopting the assumptions suggested in [13]—namely, that ECM parameters change slowly with respect to time and that the influence of short-term changes in SOC and temperature is negligible—Equation (4) can be derived using Equations (2) and (3).
V T ( t ) = V O C V V p ( 0 ) exp 1 C p R p t 0 t exp 1 C p R p t τ 1 C p i 0 ( τ ) d τ i 0 ( t ) R i .

3.2. Thermal Model

The thermal model is developed based on a lumped parameter network model that captures heat transfer pathways between the battery modules, coolant, and chassis [15,21]. As discussed in Section 2, the entire battery pack comprises 30 modules connected in series in two parallel lines. Beneath the battery cells is a cold plate featuring a unique coolant flow path that passes through the battery modules. The entire assembly is enclosed in an aluminum casing that also holds the harnesses and control modules.
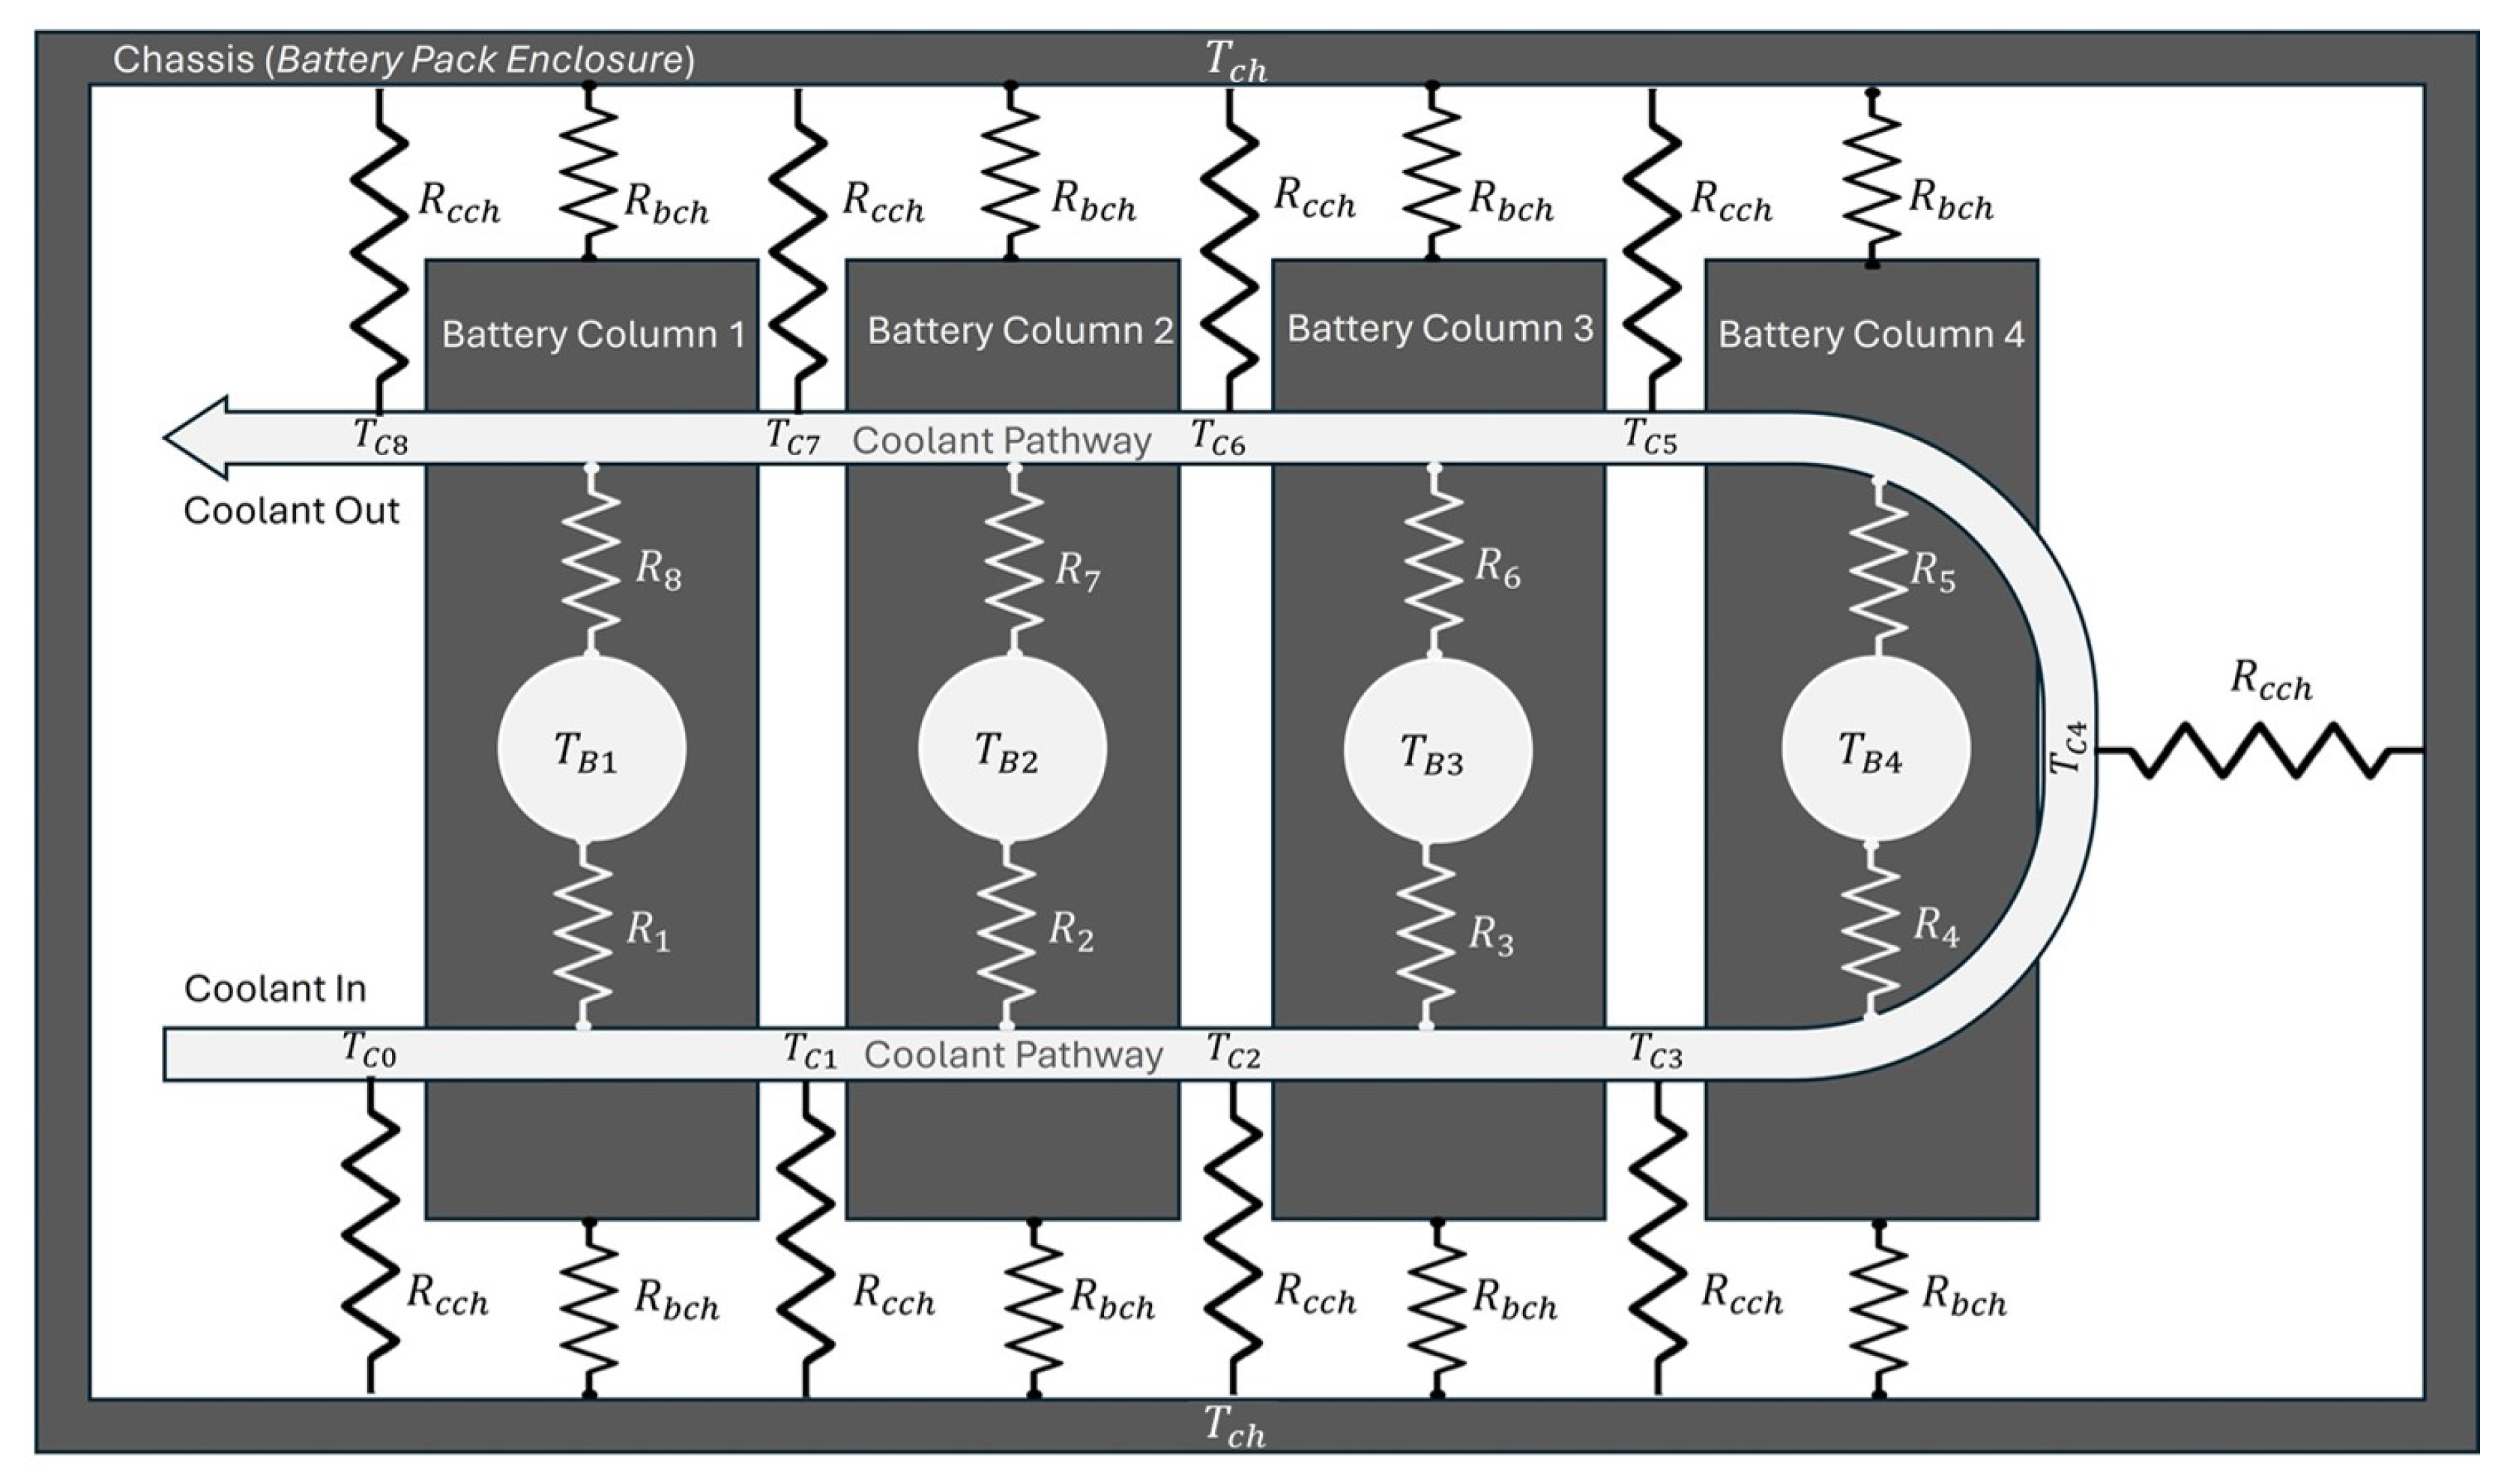
Based on the actual configuration, a thermal resistance network model is configured as shown in Figure 3. A primary heat transfer path from the battery to the coolant flow was considered. Additionally, because the battery modules are in direct contact with the aluminum chassis at certain locations, a secondary conductive heat transfer path from the battery to the chassis was included. A tertiary heat transfer path from the chassis to the coolant was also considered, allowing the coolant to absorb heat from both the battery modules and the chassis.
The battery pack is divided into four thermal masses, and coolant temperature is tracked at nine points along the flow path. This approach is essential because the performance of the coolant system can create significant temperature gradients within the pack. The division of the battery pack into four zones is based on its physical layout, which comprises battery modules arranged in four columns. Each column is thermally coupled to a dedicated section of the cold plate. Thus, using four battery nodes was a reasonable simplification of the system, with each node representing the aggregated thermal response of the modules within a given column.
In this approach, the model calculates the coolant-out temperature T C , 8 by accounting for the heat transfer processes within the pack. In addition to enhancing predictive capability, this calculation allows the coolant-out temperature to be utilized in the cost function during the thermal parameter identification process. Also, by modeling these zones separately rather than relying on an average pack temperature, the model can precisely capture the thermal behavior of the battery system and the gradual change in coolant temperature inside the cooling circuit, with minimal increase in model complexity.
The battery zone temperature at column n = 1 , 2 , 3 , 4 is modeled as follows:
[ M C p ] n d T B , n d t = q total , n + T C , n T B , n R n + T C , 9 n T B , n R 9 n + T ch T B , n R b c h ,
where M C p is the thermal mass of the zone (mass times specific heat capacity), T B , n is the battery column surface temperature, q total is the total heat generation for the battery column, T C , n and T C , 9 n are coolant temperatures at the nth column location, R n and R 9 n are the thermal resistances between the nth battery module and coolant, T Ch is the chassis temperature, and R b c h is the thermal resistance between the battery module and chassis.
The battery total heat generation is computed as follows:
Q total = Q irr + Q rev .
The first, irreversible heat generation, arises from resistive losses such as ohmic drops in current collectors, contact resistances between active particles, and limitations in ion transport within both the electrolyte and solid active materials [22], and is computed from the electrical model using the following equation:
Q irr = i 0 2 R i + i p 2 R p .
When analyzing experimental data, however, the irreversible heat generation is estimated using Equation (8) as presented in [23];
Q irr = i 0 V ocv V T .
The second component, reversible heat generation, is associated with entropy changes during electrochemical reactions [22,24,25], and is given by,
Q rev = i 0 T V ocv T .
The reversible heat is influenced by several factors, including battery SOC, cell chemistry, operating temperature, and current. According to the literature, particularly at low C rates (≤1C), reversible heat can account for approximately 26% of irreversible heat generation in the exothermic region and up to 62 % of the irreversible losses in the endothermic region [25]. Although this proportion varies depending on cell-specific characteristics, given that electric vehicles typically operate at C rates below 1C. During normal driving cycles, it is essential to incorporate both irreversible and reversible heat generation into the thermal model.
Evaluation of the reversible heat term in Equation (6) requires the entropic coefficient values, which are generally a non-linear function of state of charge for NMC pouch cells [25]. In principle, entropic coefficient values are obtained by mapping OCV (SOC, T) over a broad temperature window and differentiating with respect to T at fixed SOC. However, as discussed in Section 3.2, the OCV data acquired in this study do not span a sufficiently broad temperature range; consequently, the entropic coefficient could not be determined directly from the test data. As reversible heat contributes significantly to the total heat generation, the entropic coefficient values reported in [25] for a chemically and geometrically similar NMC-type pouch cell were used to compute the reversible heat-generation term. The tabulated coefficients were interpolated to the SOC grid, and reversible heat generation was computed according to Equation (9).
Because the thermal model is formulated column-wise, the total heat generation is allocated to the four battery columns in proportion to the number of cells in each column, as given by
Q total = n = 1 4 q total , n .
The total heat transfer coefficient between the battery columns and the coolant, denoted as u n , is modeled as a function of the coolant flow rate expressed by
u n = a · ( Coolant Flow Rate ) b + C = 1 R n · A n
where a, b, and C are constants to be estimated, and A n is the contact surface area of the battery column with the cooling plate. This area is calculated from the surface in contact between the coolant circuit and the battery modules. This relationship accounts for the variation in heat transfer coefficient resulting from changes in coolant flow rate, which affects the Reynolds number and flow regime (laminar or turbulent).
The coolant temperature T C , k along the coolant passage can be expressed as follows:
T C , k = T C , k 1 + T B , n T C , k 1 R n · C f + T ch T C , k 1 R cch · C f ,
where
n = k , for k = 1 , 2 , 3 , 4 9 k , for k = 5 , 6 , 7 , 8 .
Here, T C , k is the coolant temperature at segment k, C f is the coolant flow capacity (mass flow rate times specific heat capacity), and R c c h is the thermal resistance between the chassis and coolant.

4. Parameter Identification

This section presents the methodology to identify the parameters of the coupled electro-thermal model using the vehicle-level test data.

4.1. Electrical Parameter Identification

Using a methodology similar to the one shown in [13], several parameters in the electrical model were determined, including the polarization time constant, internal resistance, OCV, polarization resistance, and capacitance. For this process, the driving cycle test data summarized in Section 2 is utilized.

4.1.1. Polarization Time Constant

The time constant, τ , characterizes the rate at which the polarization voltage decays following a sudden change in current. In this study, τ was estimated by analyzing drive cycle events where the output current dropped sharply to near zero, such as during aggressive regenerative braking followed by a complete stop. In these instances, the terminal voltage approaches the open-circuit voltage exponentially. This behavior is modeled by the following exponential decay function:
V T ( t ) + i 0 ( t ) R i = V b ( t ) = V O C V V p ( 0 ) exp t τ ,
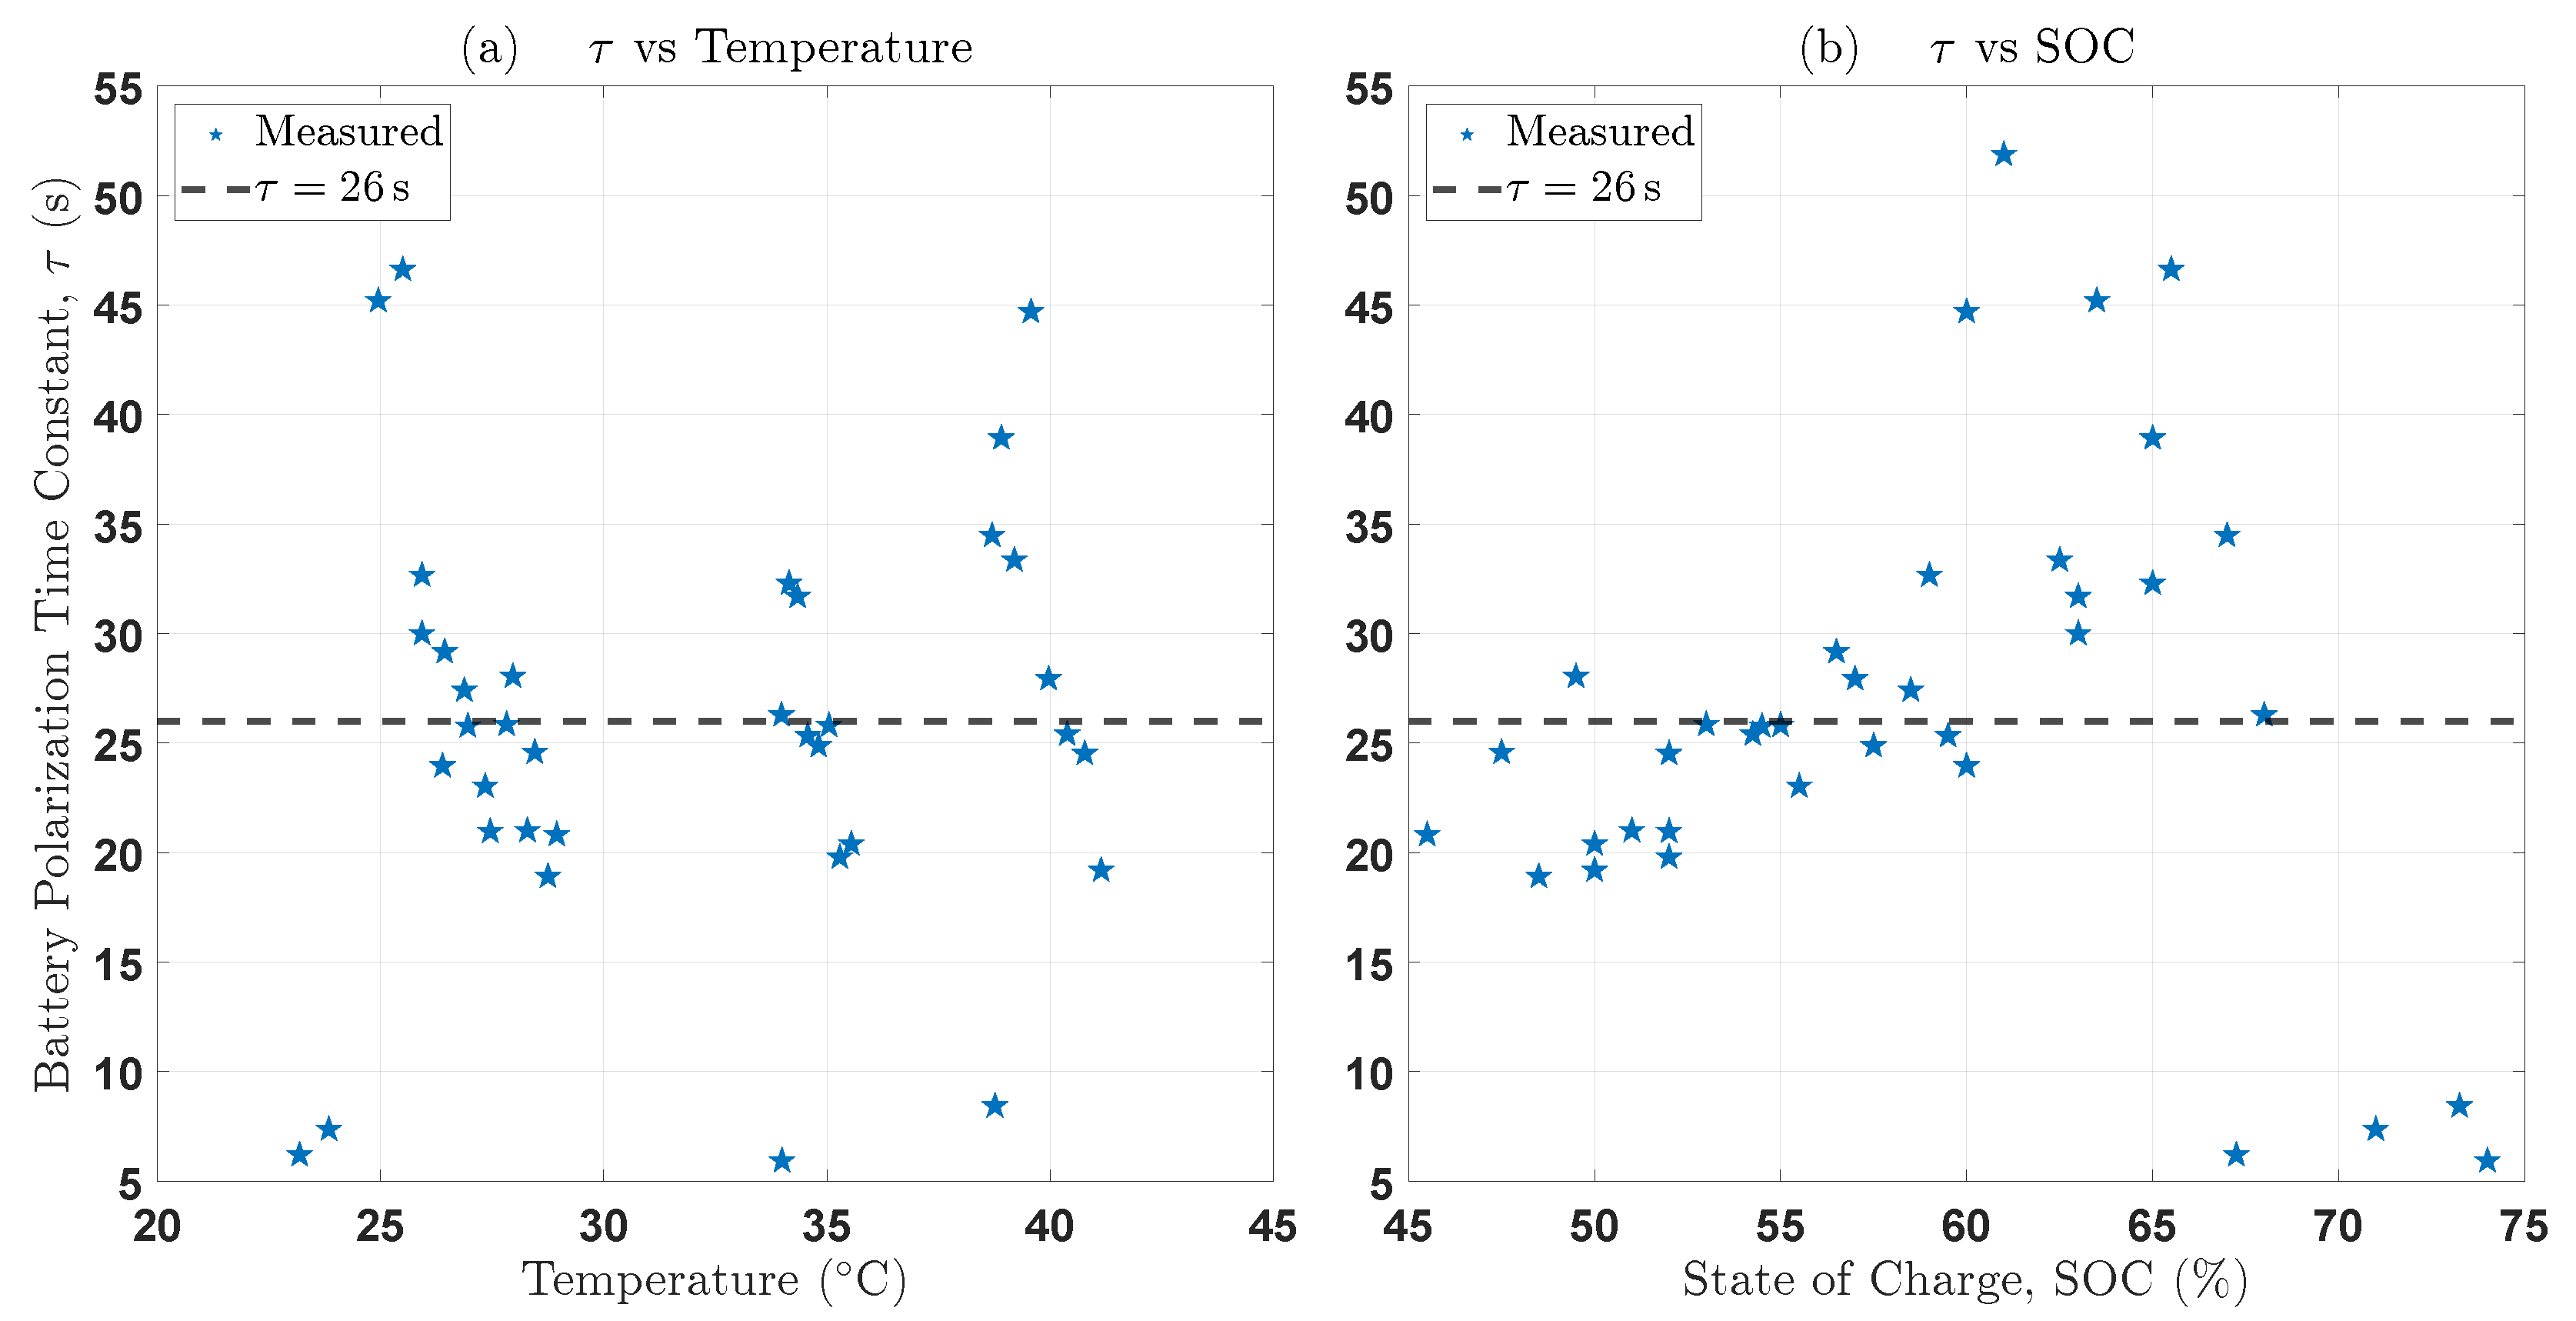
where V p ( 0 ) represents the initial polarization voltage at time t = 0 . Note that t = 0 does not correspond to the start of a drive cycle or test, but rather to the instant when the external current step ends and the battery is effectively in open-circuit (near-zero current) conditions; i.e., the starting point of the voltage-relaxation period. By fitting this model to measured terminal voltage data using non-linear least squares optimization, time constant values were identified across different SOC levels and temperatures. As shown in Figure 4, no clear trend or reliable correlation among the time constant, SOC, and temperature could be established. These results are due to the limited data involving aggressive braking and complete stop conditions, as well as the quality of the CAN signals. Consequently, an average polarization time constant of 26 s is used for the model. Figure 5 compares the polarization voltage decay calculated with τ = 26 to the experimentally measured voltage. As shown in Figure 5, the estimated voltage decay agrees well with the experimental data across a wide range of SOC and temperature conditions. It is worth noting that similar results are reported in [13], where the polarization time constant is assumed to be constant and nearly independent of SOC and temperature.

4.1.2. Internal Resistance

In this study, the method for characterizing internal resistance R i as a function of SOC and temperature is based on the approach presented in [13], with modifications to further refine the data. The core idea is that when the battery voltage is plotted against the current, the slopes near zero current points remain relatively constant at similar battery temperatures. Although the slope represents the equivalent impedance Z e q , it closely approximates R i when the frequency of the current ω is sufficiently high, as indicated by the following equation:
Z e q = R i + R P 1 + j ω C P R P
In this study, R i is identified by selecting data points where the time derivative of the current exceeds a threshold and the current is near zero. Therefore, the internal resistance is simply the ratio of the change in voltage to the change in current, as described by
R i = Δ V T Δ i 0 .
In this study, data are filtered using three criteria: (i) the time derivative of the current greater than 20 A/s, (ii) zero or near-zero current conditions, and (iii) a current drop of at least 20 A.
As the data were collected through the CAN interface, any calculations based on the signals could be susceptible to noise. Moreover, since the internal resistance data points are extracted from multiple datasets, slight deviations or small margins of error between the points are to be expected. To address this issue, outlier detection-elimination and statistical analyses are performed; that is, only the mean R i ¯ of the data points within two standard deviations ( ± 2 σ ) of the local mean ( R i , k ¯ taken at each corresponding S O C k , T k ) is considered. This approach retains approximately 95% of the identified data points, which are then used to fit a surface map as a function of SOC and temperature. The resulting surface, shown in Figure 6, clearly indicates that the internal resistance increases at low SOC and temperatures, as expected. It is also noted that the data points are denser near 20 °C, most of which are from RealDriving datasets. Note that the RealDriving datasets are significantly larger than other cycles, as noted in Section 2. The internal resistance surface shown in Figure 6 is implemented in the model as a lookup table.

4.1.3. Open-Circuit Voltage

The open-circuit voltage, denoted by V O C V , represents the equilibrium voltage of the battery under zero-current conditions. In this study, V O C V was estimated by identifying instances within the drive cycle data where the polarization current, defined as i p = V p / R p , approached zero. It is noted that the dynamic behavior of i p is described by the input current and time constant. These conditions typically occur when the vehicle comes to rest following a regenerative braking event [13]. Whenever i p remained below a low threshold (e.g., 0.5 A), V T was assumed to be sufficiently close to V O C V .
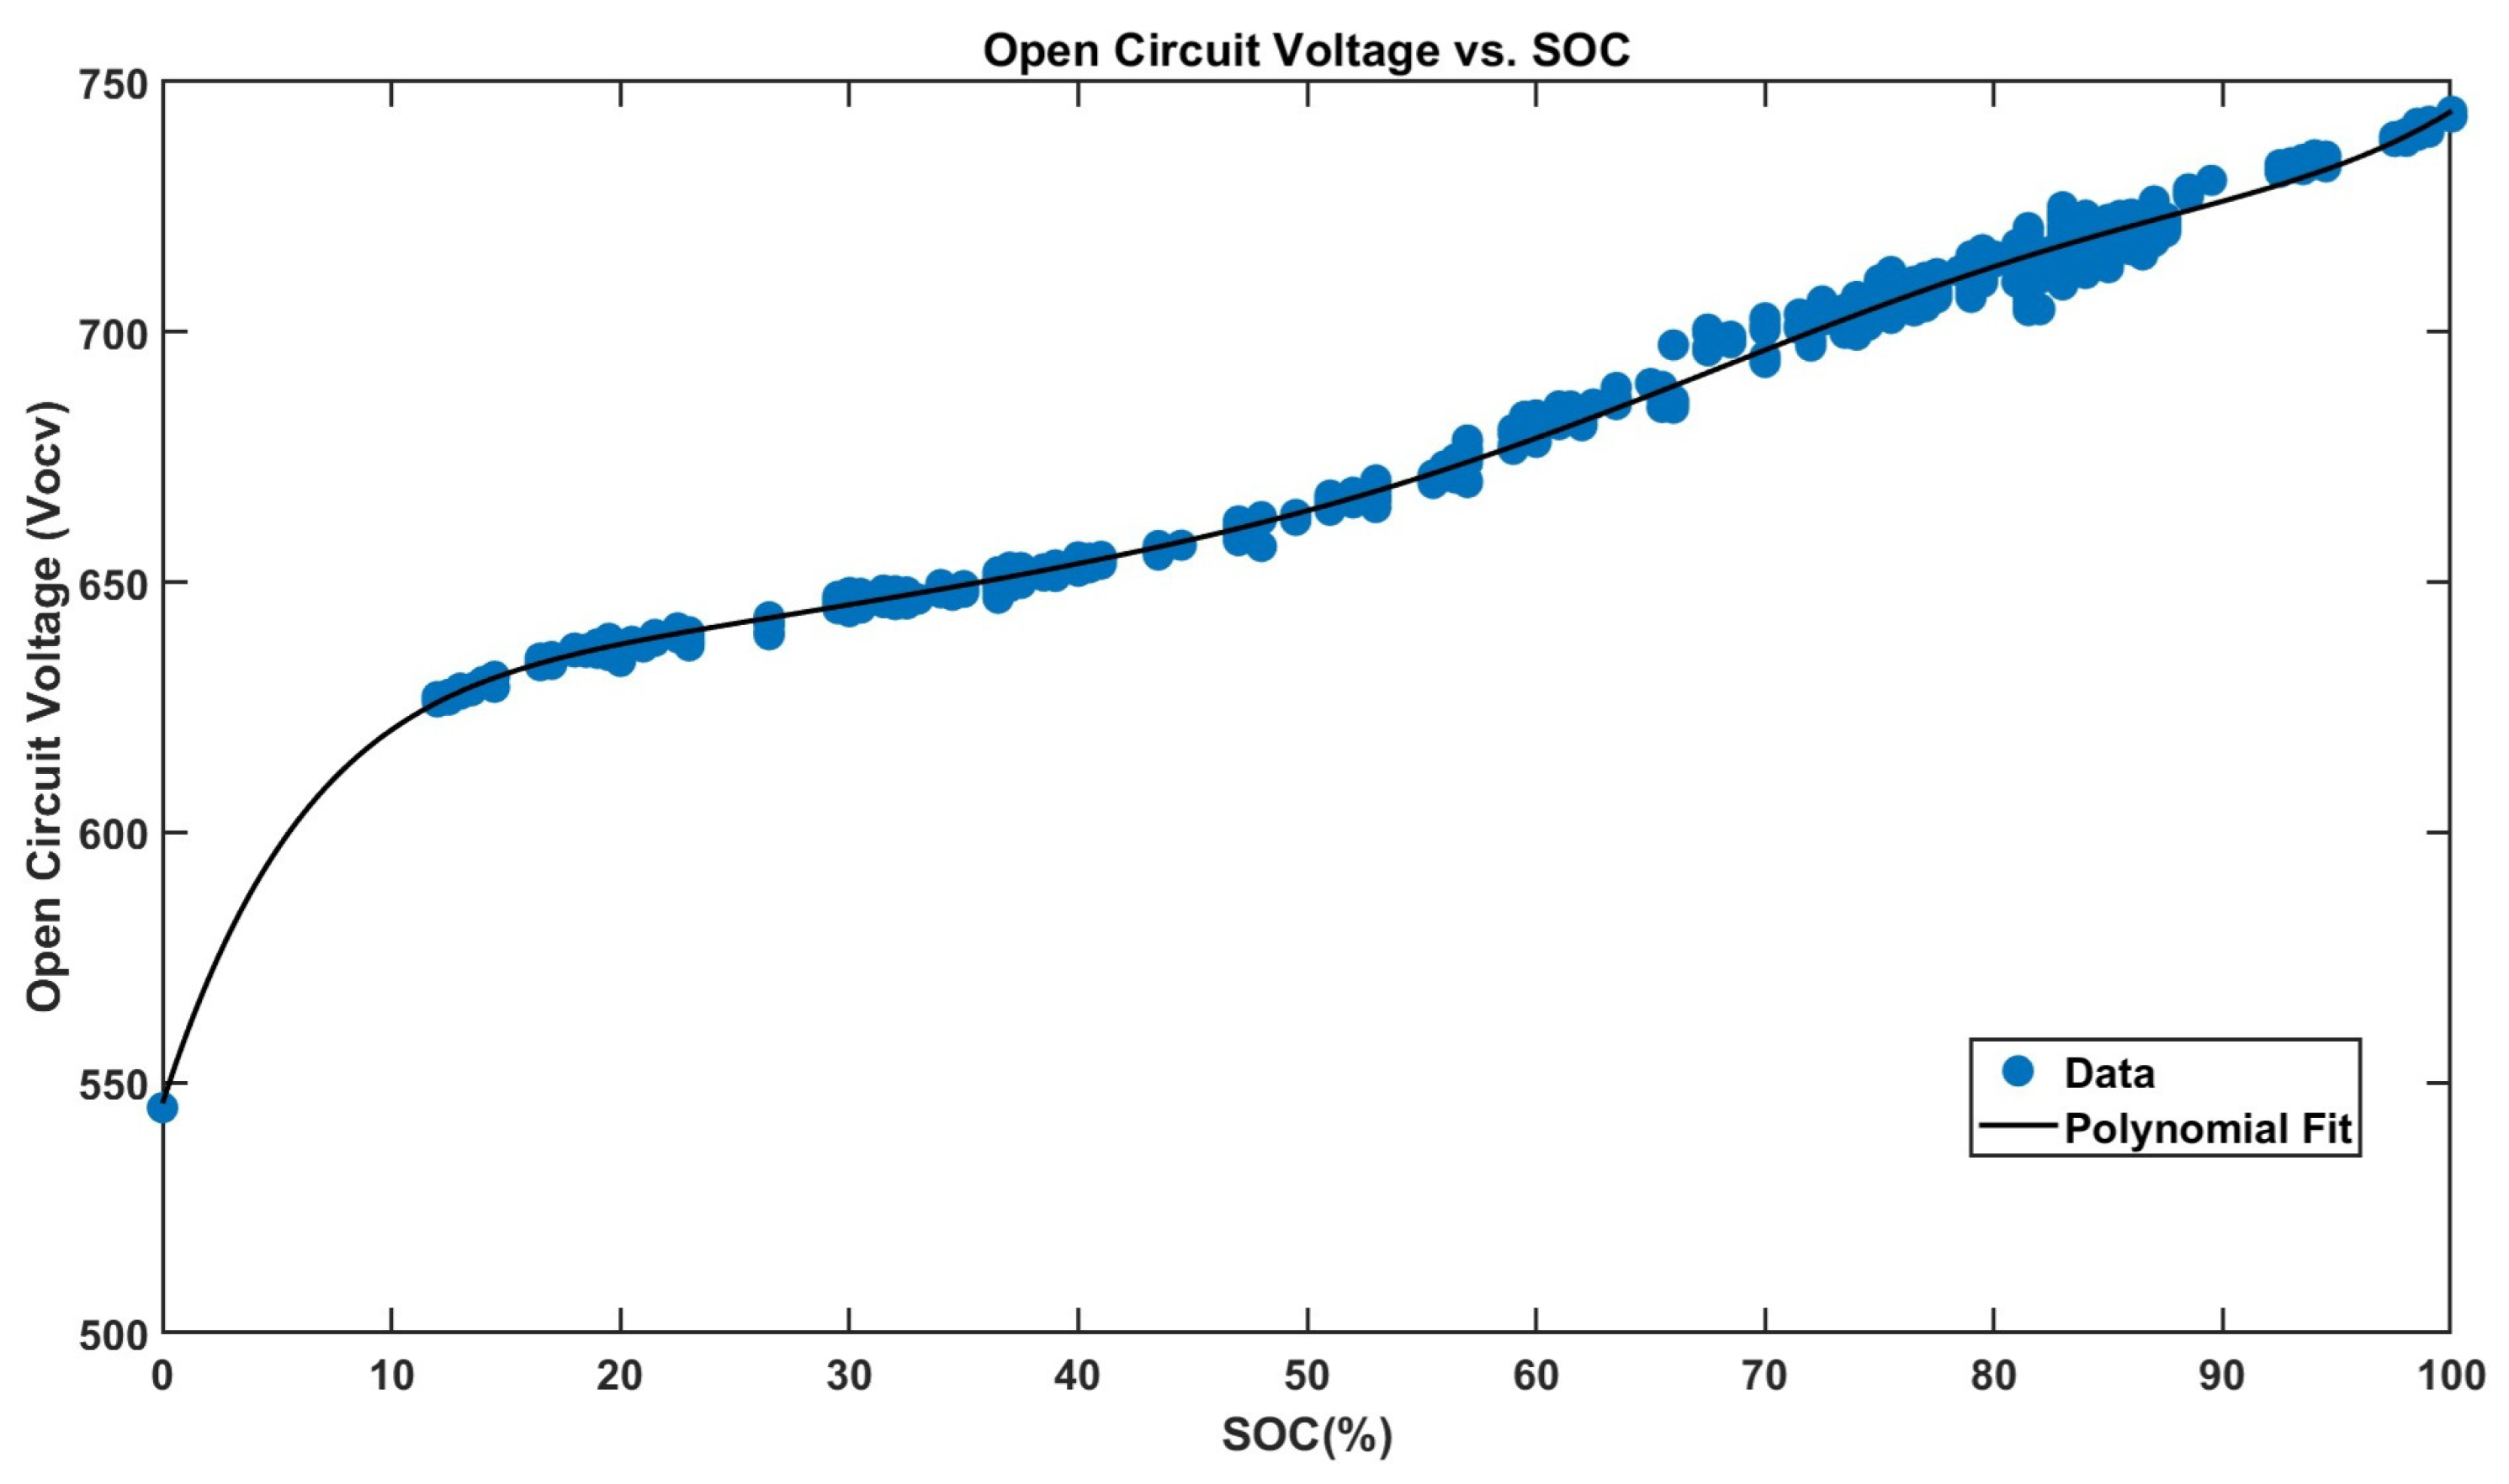
While OCV is a function of SOC as well as battery temperature, it was challenging to observe the relationship between OCV and temperature due to the limitations in the dataset. Since battery temperature significantly fluctuates in real driving scenarios, unlike controlled laboratory environments, the temperature dependence of the OCV could not be reliably captured in the dataset. Also, at low battery pack temperature, only a small number of feasible data points existed for OCV estimation. A dataset for V O C V –SOC was constructed by collecting near-equilibrium voltage measurements across different SOC levels. An eighth-order polynomial was then fitted to this dataset to capture the non-linear dependence of V O C V on SOC, as shown in Figure 7, and was implemented within the model for OCV estimation.

4.1.4. Polarization Resistance and Capacitance

In this study, polarization resistance R p was determined by reconciling polarization voltages derived from two distinct approaches. First, the polarization voltage ( V p ) can be calculated directly from measured data using the terminal voltage, open-circuit voltage, current, and internal resistance as follows:
V p = V T ( V O C V + i 0 · R i ) .
Alternatively, V p can be expressed using i p and R p as follows:
V p = i p · R p .
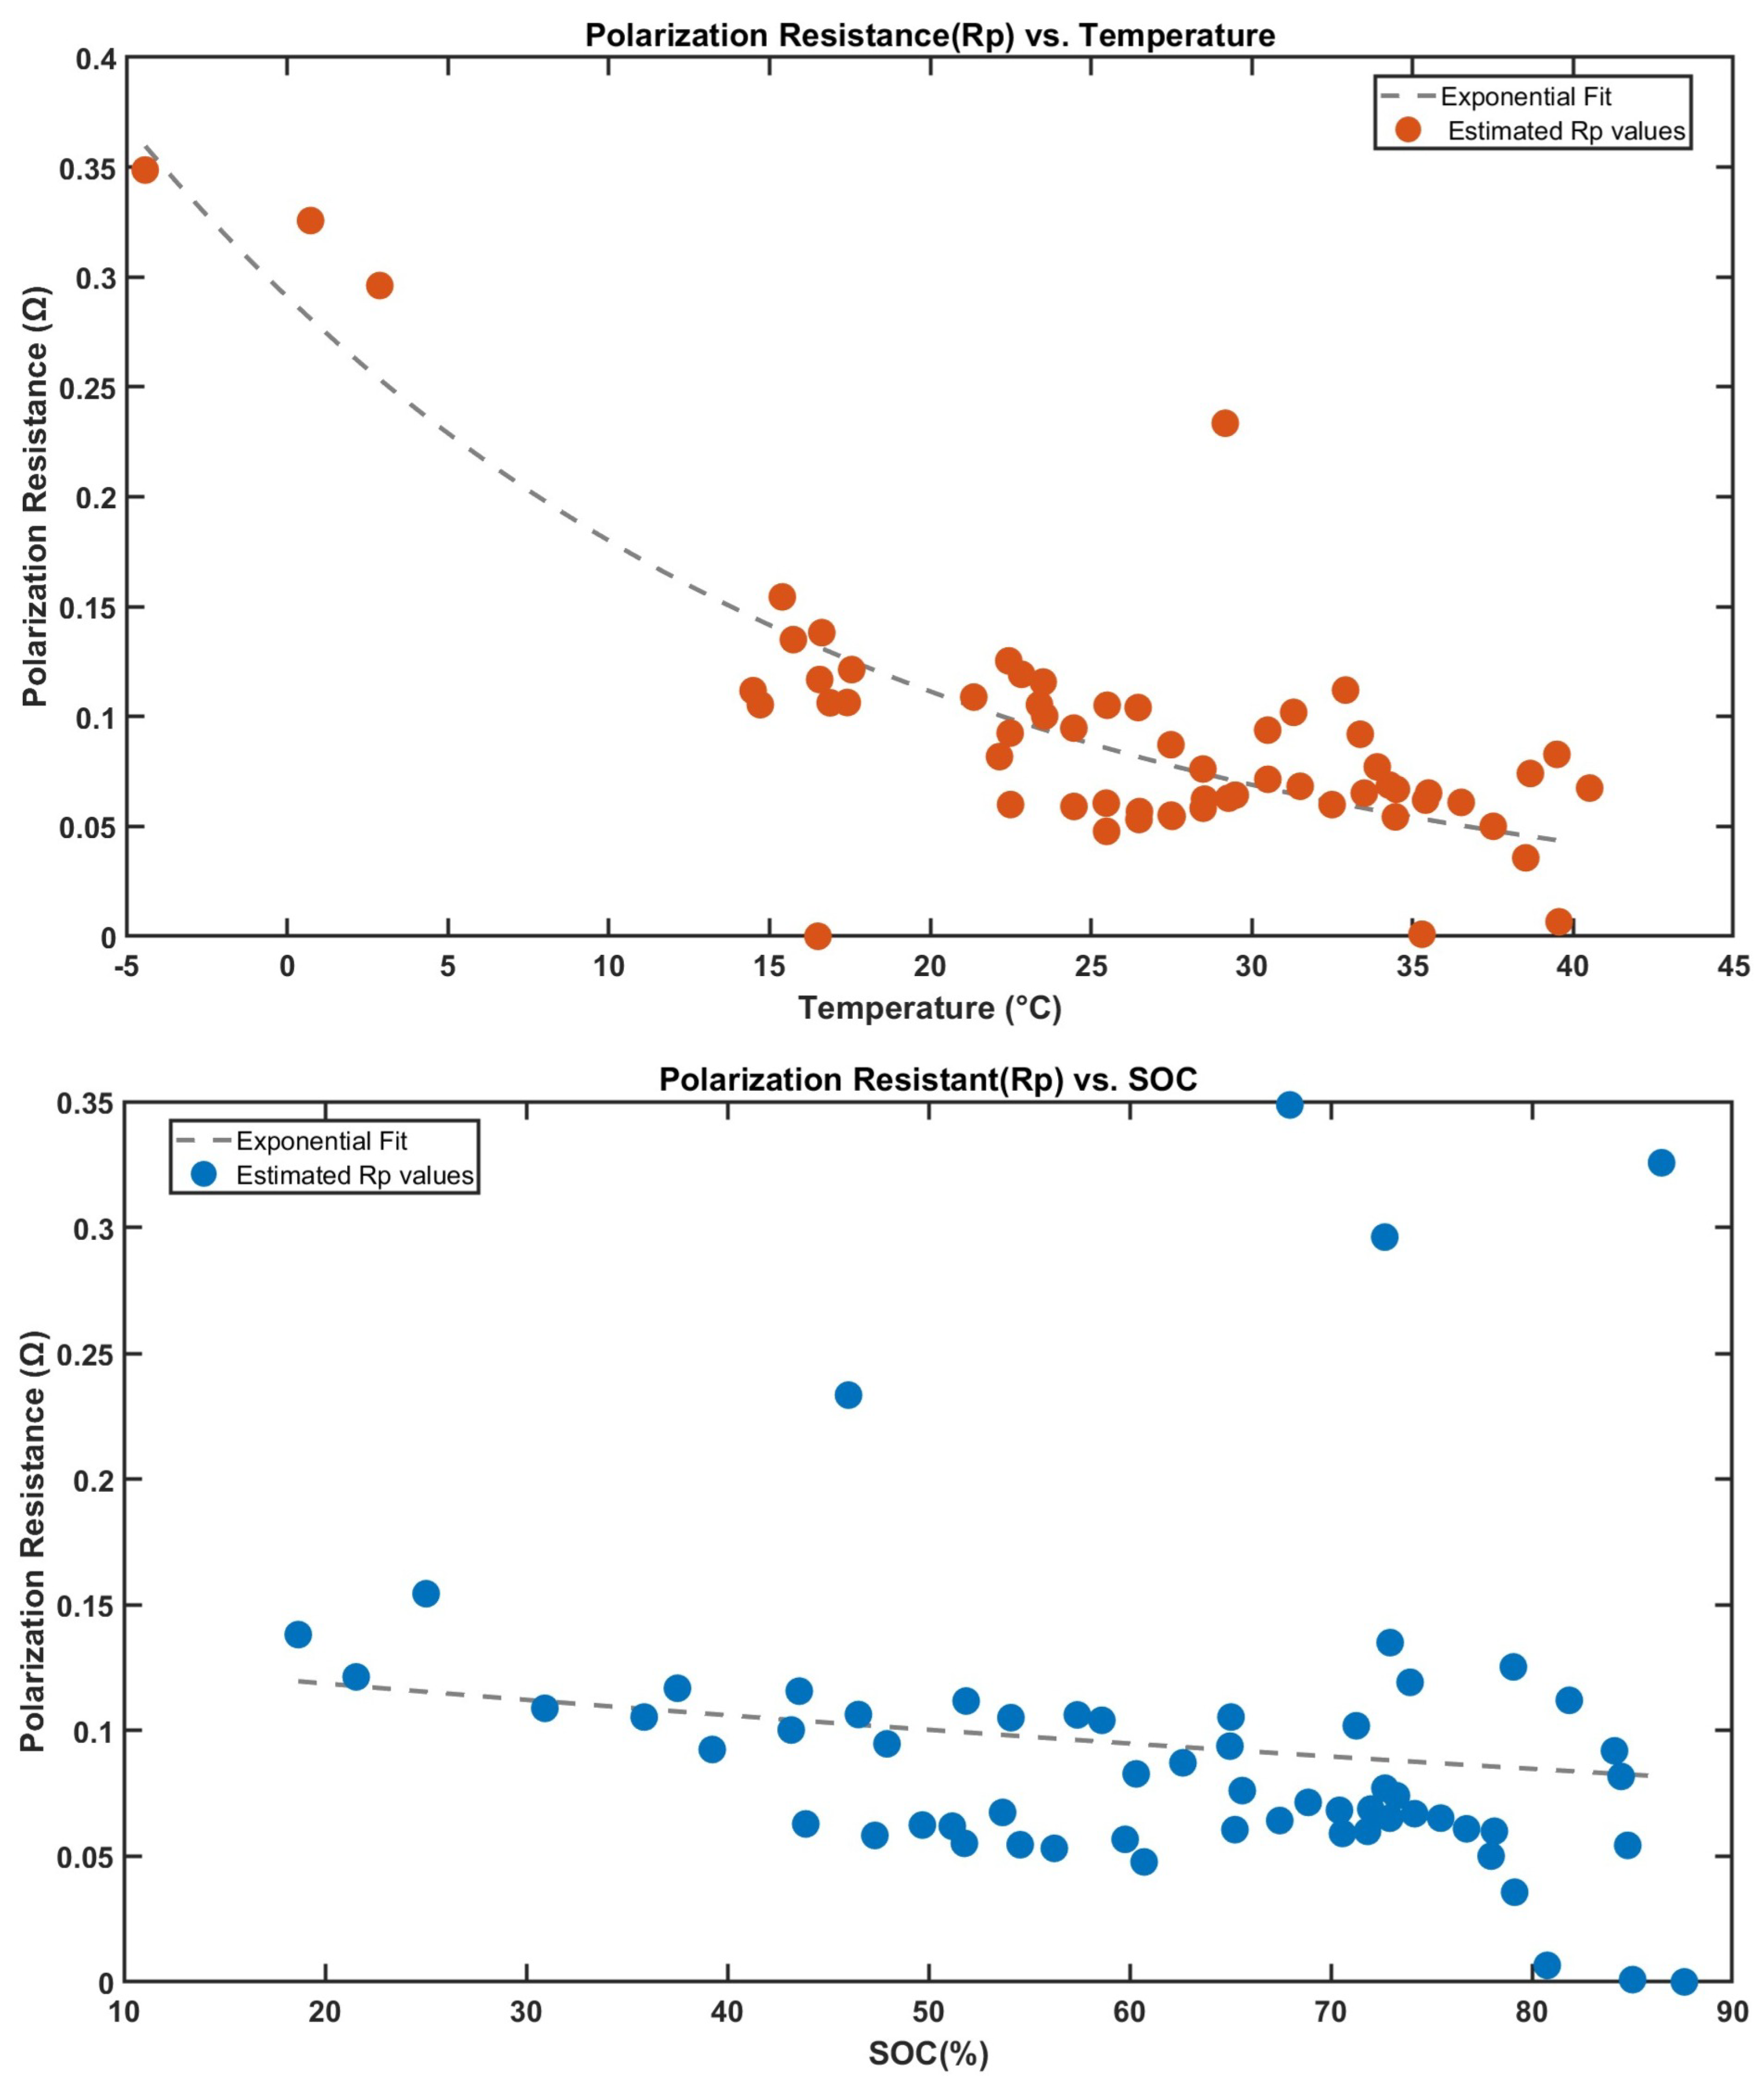
To identify R p , an optimization problem was considered to minimize the discrepancy between the polarization voltages computed from the two methods. Specifically, particle swarm optimization (PSO) was selected for this optimization for its robustness in handling complex, non-linear parameter spaces and its insensitivity to initial parameter guesses. To ensure accurate characterization, the dataset was segmented into subsets based on narrow intervals of SOC and similar average battery surface temperatures. Each subset was independently processed through the optimization routine, yielding SOC- and temperature-dependent polarization resistance values. These R p values were then fit with an exponential model to describe their combined SOC-temperature dependence. As can be seen from Figure 8, polarization resistance decreases consistently with increasing battery surface temperature, consistent with the expected electrochemical behavior where high temperatures enhance ionic transport and reduce resistive losses. Moreover, a mild decrease in polarization resistance with increasing SOC is observed.
Having identified R p as a function of SOC and temperature, and determined τ to be approximately 26 s, the polarization capacitance was calculated using the following relationship:
C p = τ R p .

4.2. Thermal Parameter Identification

To estimate the thermal parameters such as M C p , R n , R b c h , R c c h , and heat transfer coefficients, a cost function is defined to quantify the discrepancy between the predicted and measured temperatures at the battery modules and coolant outlet, given by the following:
J = i = 1 4 RMSE T B , i T ^ B , i + λ · RMSE T C , 8 T ^ C , 8
where T B , i and T ^ B , i represent the measured and predicted battery module surface temperatures. Similarly, T C , 8 and T ^ C , 8 denote the measured and predicted coolant outlet temperatures. The weighting factor λ is set to 1 in this study, indicating that all temperature measurements are treated with equal importance. PSO is employed to identify the thermal parameters by minimizing the defined cost function. The thermal parameters are identified by minimizing this cost function using the particle swarm optimization (PSO) algorithm implemented in MATLAB 2023. The search space for the six decision variables is limited to physically plausible bounds. A swarm size of 50 particles is employed, with a hybrid local search based on fmincon to refine and identify the optimal parameters of the thermal model.
The training datasets used for optimization were carefully selected by including only data with uniform coolant flow rates. In addition, the selected datasets span a wide range of operating conditions, such as various SOC, battery surface temperatures, and coolant flow rates, which enhances the robustness of the model prediction performance.
Table 2 summarizes the values of the identified thermal parameters. As discussed in Section 3.2, the total heat transfer coefficient between the battery and the coolant is modeled as Equation (11). Despite the heat transfer coefficient modeled as a power-law function of the coolant mass-flow rate, the value found for b by optimization is 0, indicating that across the tested range of flow rates, variations in coolant mass-flow rate have no significant impact on the total heat transfer coefficient. Two factors are believed to contribute to this result. First, the Reynolds number (Re) for the coolant flow is expected to be quite low due to the small height of the coolant channel. According to classical heat transfer theory for internal flow, when the flow is laminar and fully developed, the Nusselt number (Nu) remains constant and is independent of both Re and the mass flow rate ( m ˙ ) [26]. In contrast, for turbulent flow, Nu becomes a function of Re. This suggests that the characteristics of the coolant flow and the resulting convective heat transfer are likely close to those of laminar flow. Second, the heat transfer from the battery to the coolant involves not only convection but also conduction—both within the cell and through the coolant channel wall. Since conduction is unaffected by variations in flow rate, the overall heat transfer coefficient is found to be relatively insensitive to changes in coolant flow rate.
The parameter estimation yielded a column-level thermal capacitance of [ M . C p ] n = 100,262 J K 1 (see Table 2), which scales to a pack-level value of [ M . C p ] pack = 375,982 J K 1 when all four columns are considered. Given an estimated total pack mass of M pack 330 kg , the implied bulk specific heat capacity is as follows:
C p , eff = [ M . C p ] pack M pack = 375 , 982 J K 1 330 kg = 1140 J kg 1 K 1 .
This value falls within the reported range of 840–1138 J kg 1 K 1 for graphite–NMC cells at room temperature [27,28]. The slight upward deviation can be readily explained by the additional heat capacity of non-electrochemical constituents—aluminum end-plates, steel fasteners, thermally conductive potting, and high-voltage harnesses—that are lumped into the pack model but absent from cell-level measurements. Consequently, the identified thermal-mass values are consistent with the literature data and physically reasonable for the assembled module.
These parameters enable the thermal model to accurately predict temperature profiles within the battery pack as well as the coolant outlet temperature under various operational scenarios. This performance provides a robust foundation for developing subsequent thermal management strategies and analyzing vehicle performance.

5. Model Validation and Discussion

5.1. Electro-Thermal Model Validation

The coupled electro-thermal model of the battery pack, developed in this study with parameters identified in the previous section, was validated against experimental data. As mentioned previously, the model predicts values for state of charge (SOC), terminal voltage, battery temperature, and coolant outlet temperature. Therefore, validation involved comparing these predicted values with experimentally measured ones. Deviations from the measured values for 31 datasets represented by RMSE are summarized in Table 3.
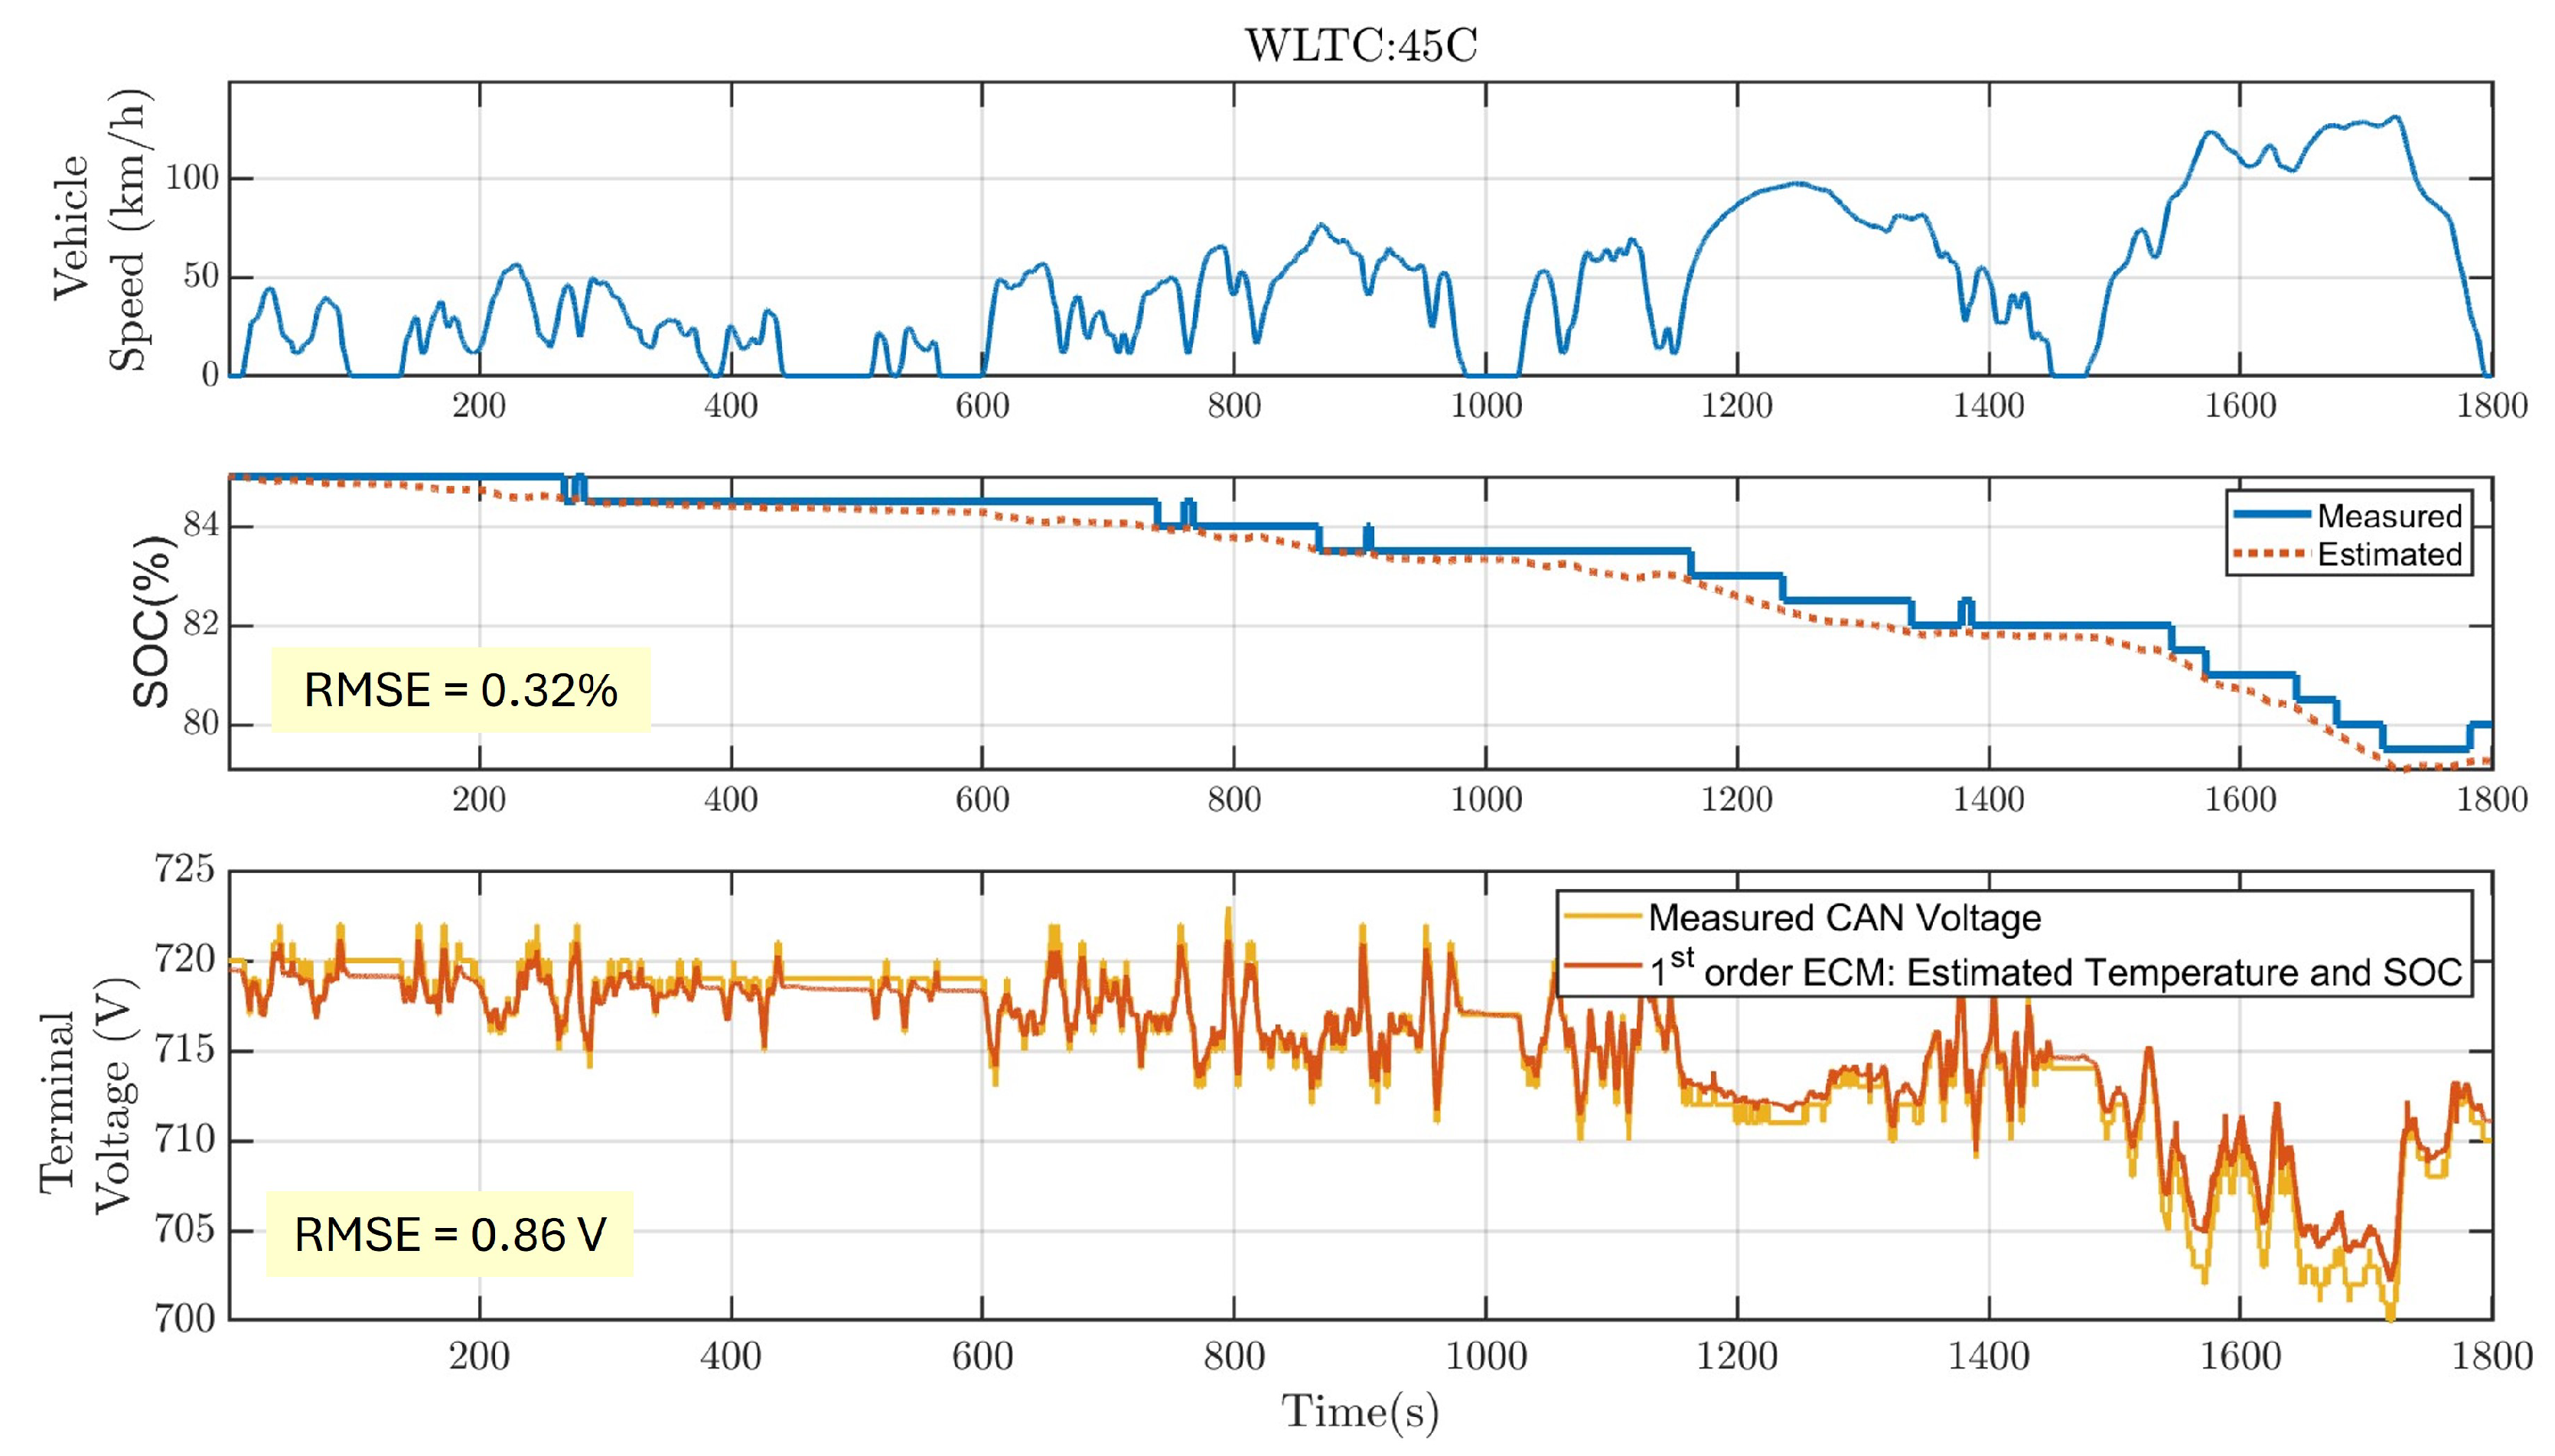
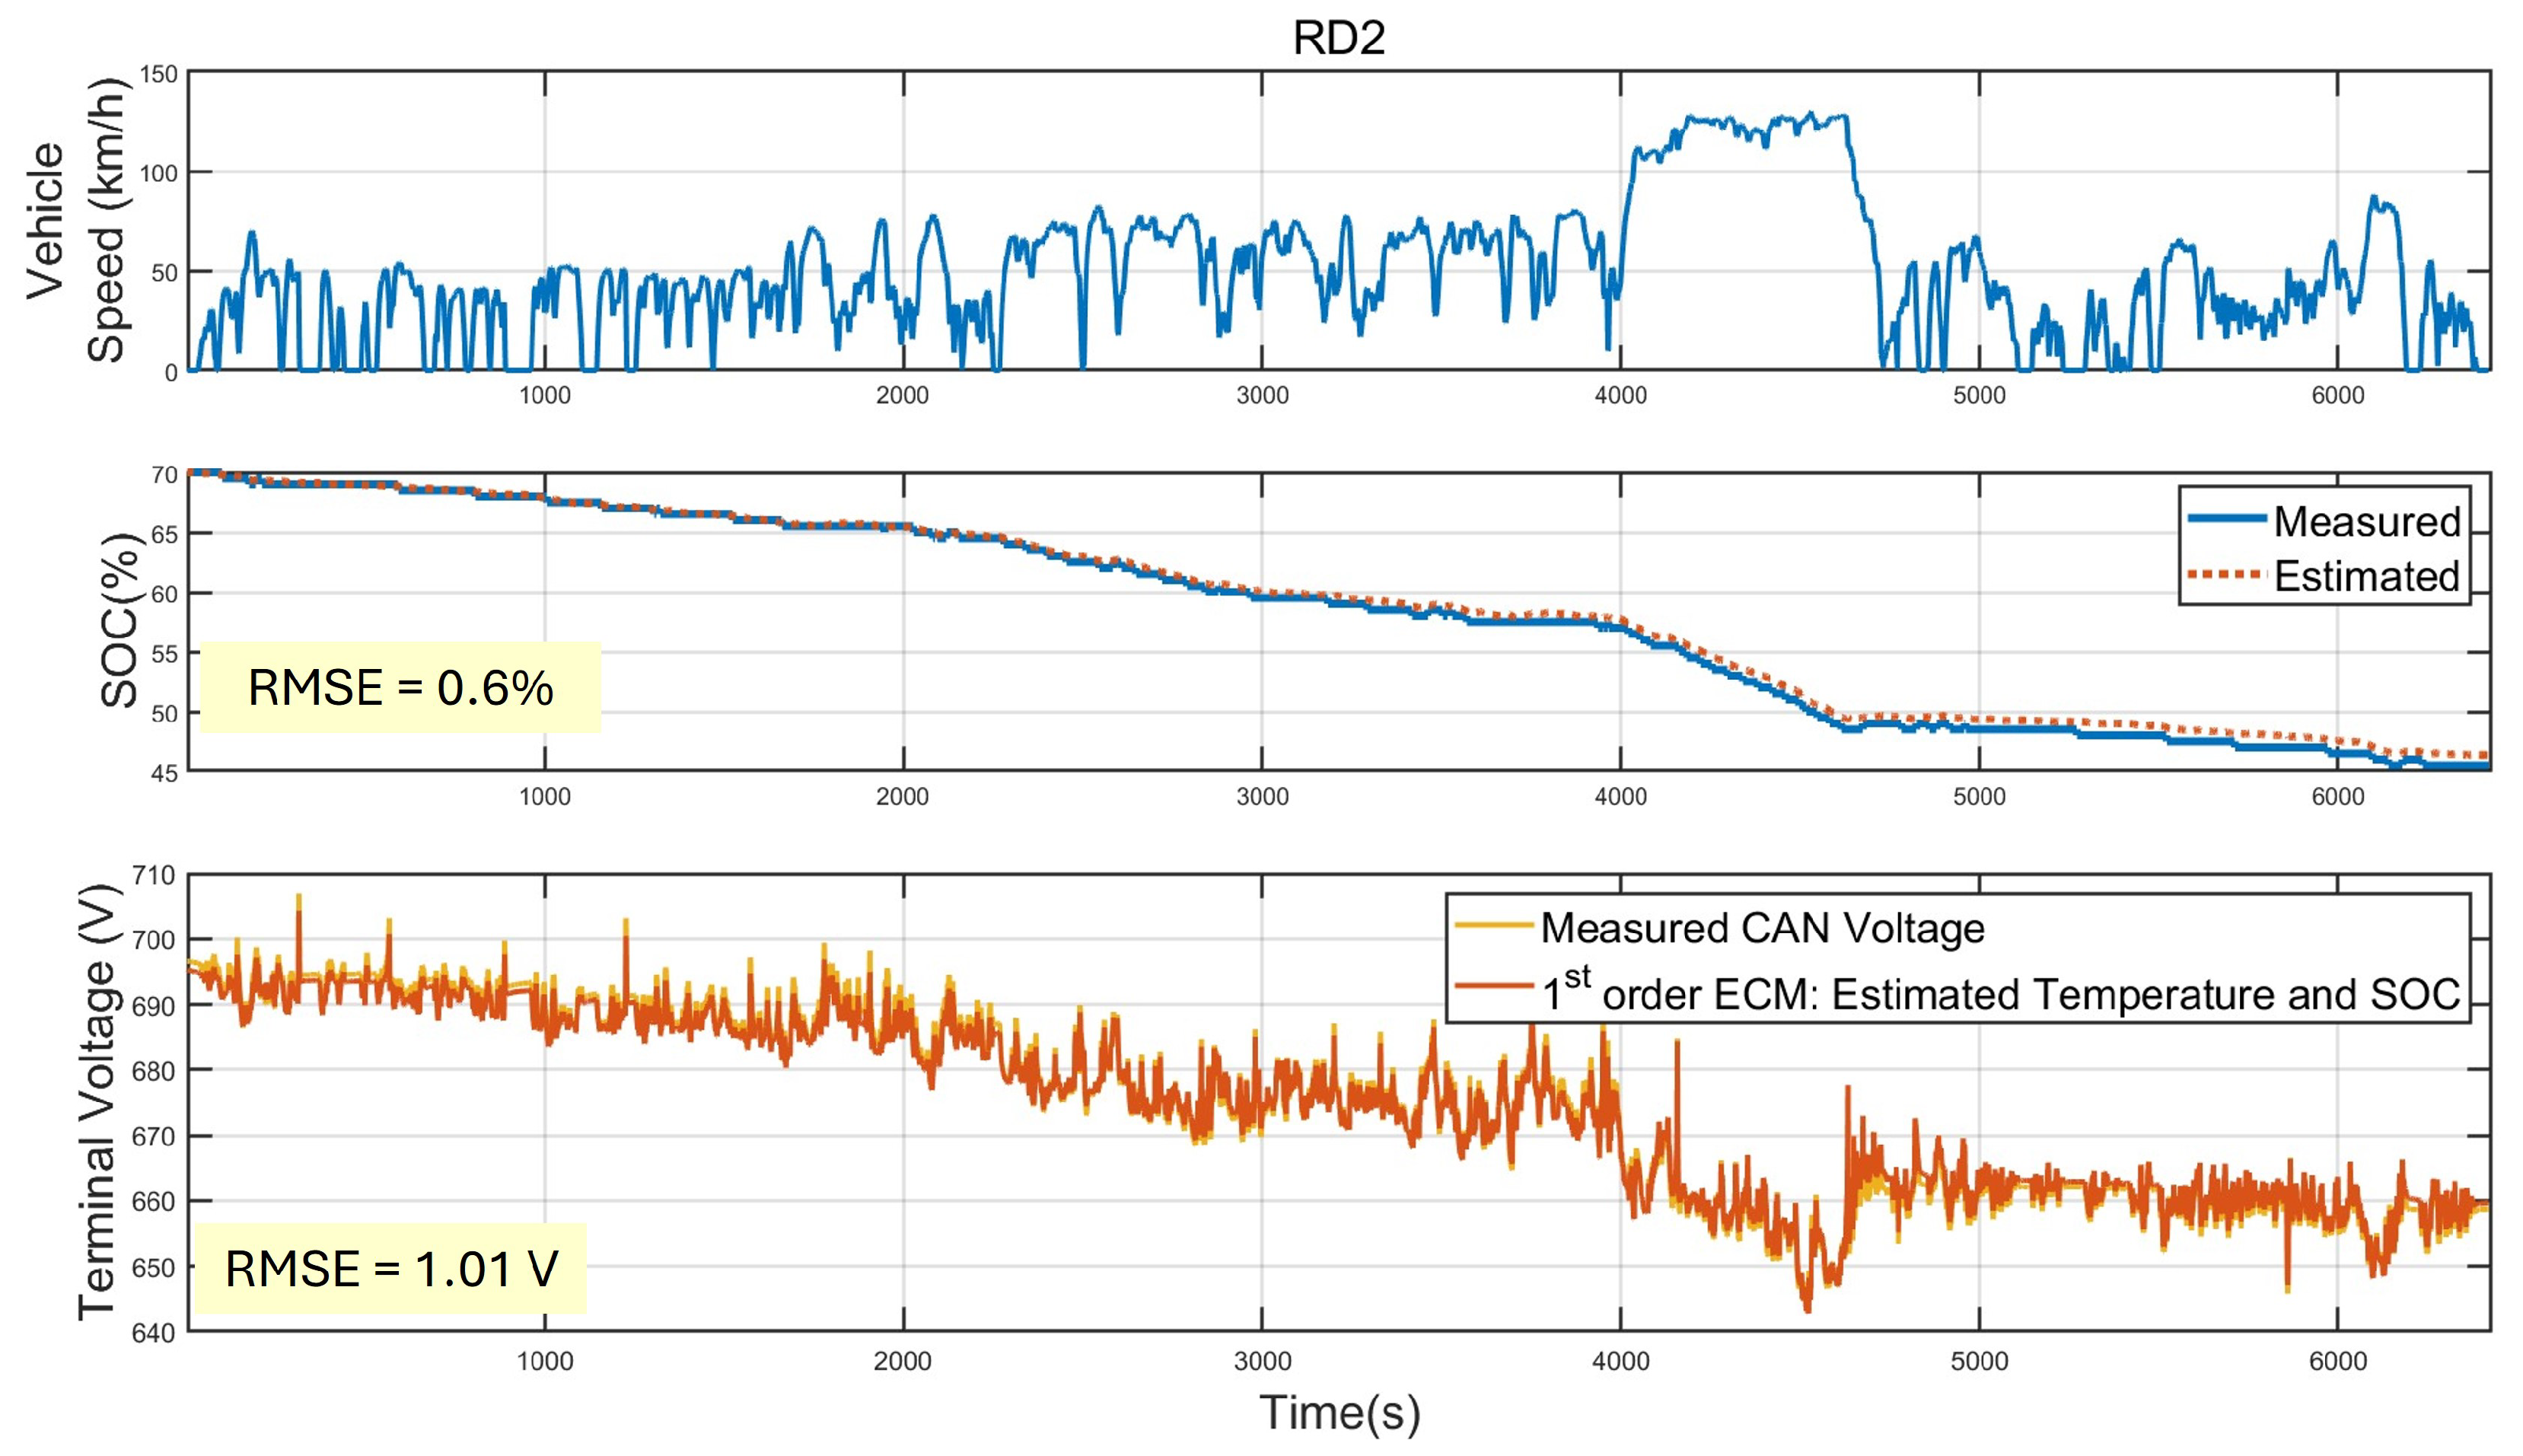
The SOC is estimated via a Coulomb counting method using the current of the battery pack and the initial SOC as input. As shown in Table 3, the model yielded an average RMSE of 0.7% across 31 test datasets, with errors ranging from 0.18% to 3.7%. Detailed results of three cases are shown in Figure 9, Figure 10 and Figure 11. Although the predicted SOC values are in good agreement with the measured values in all three cases, the accuracy of the Coulomb counting method may degrade over time because of cumulative errors and current measurement noise.
The electrical model utilizes input from the SOC estimation, pack current, and battery surface temperatures predicted by the thermal model, and estimates the terminal voltage of the battery pack. Comparison against measured terminal voltage data is shown in Table 3. The model achieved a mean RMSE of 2.8 V over an ambient temperature range of −10 °C to 45 °C, with errors spanning from 0.86 V to 6.67 V. Time series variation of terminal voltage for three driving cycles is presented in detail in Figure 9, Figure 10 and Figure 11. Collectively, these results demonstrate that the calibrated first-order ECM maintains good predictive fidelity across a broad thermal window and diverse real-world driving conditions.
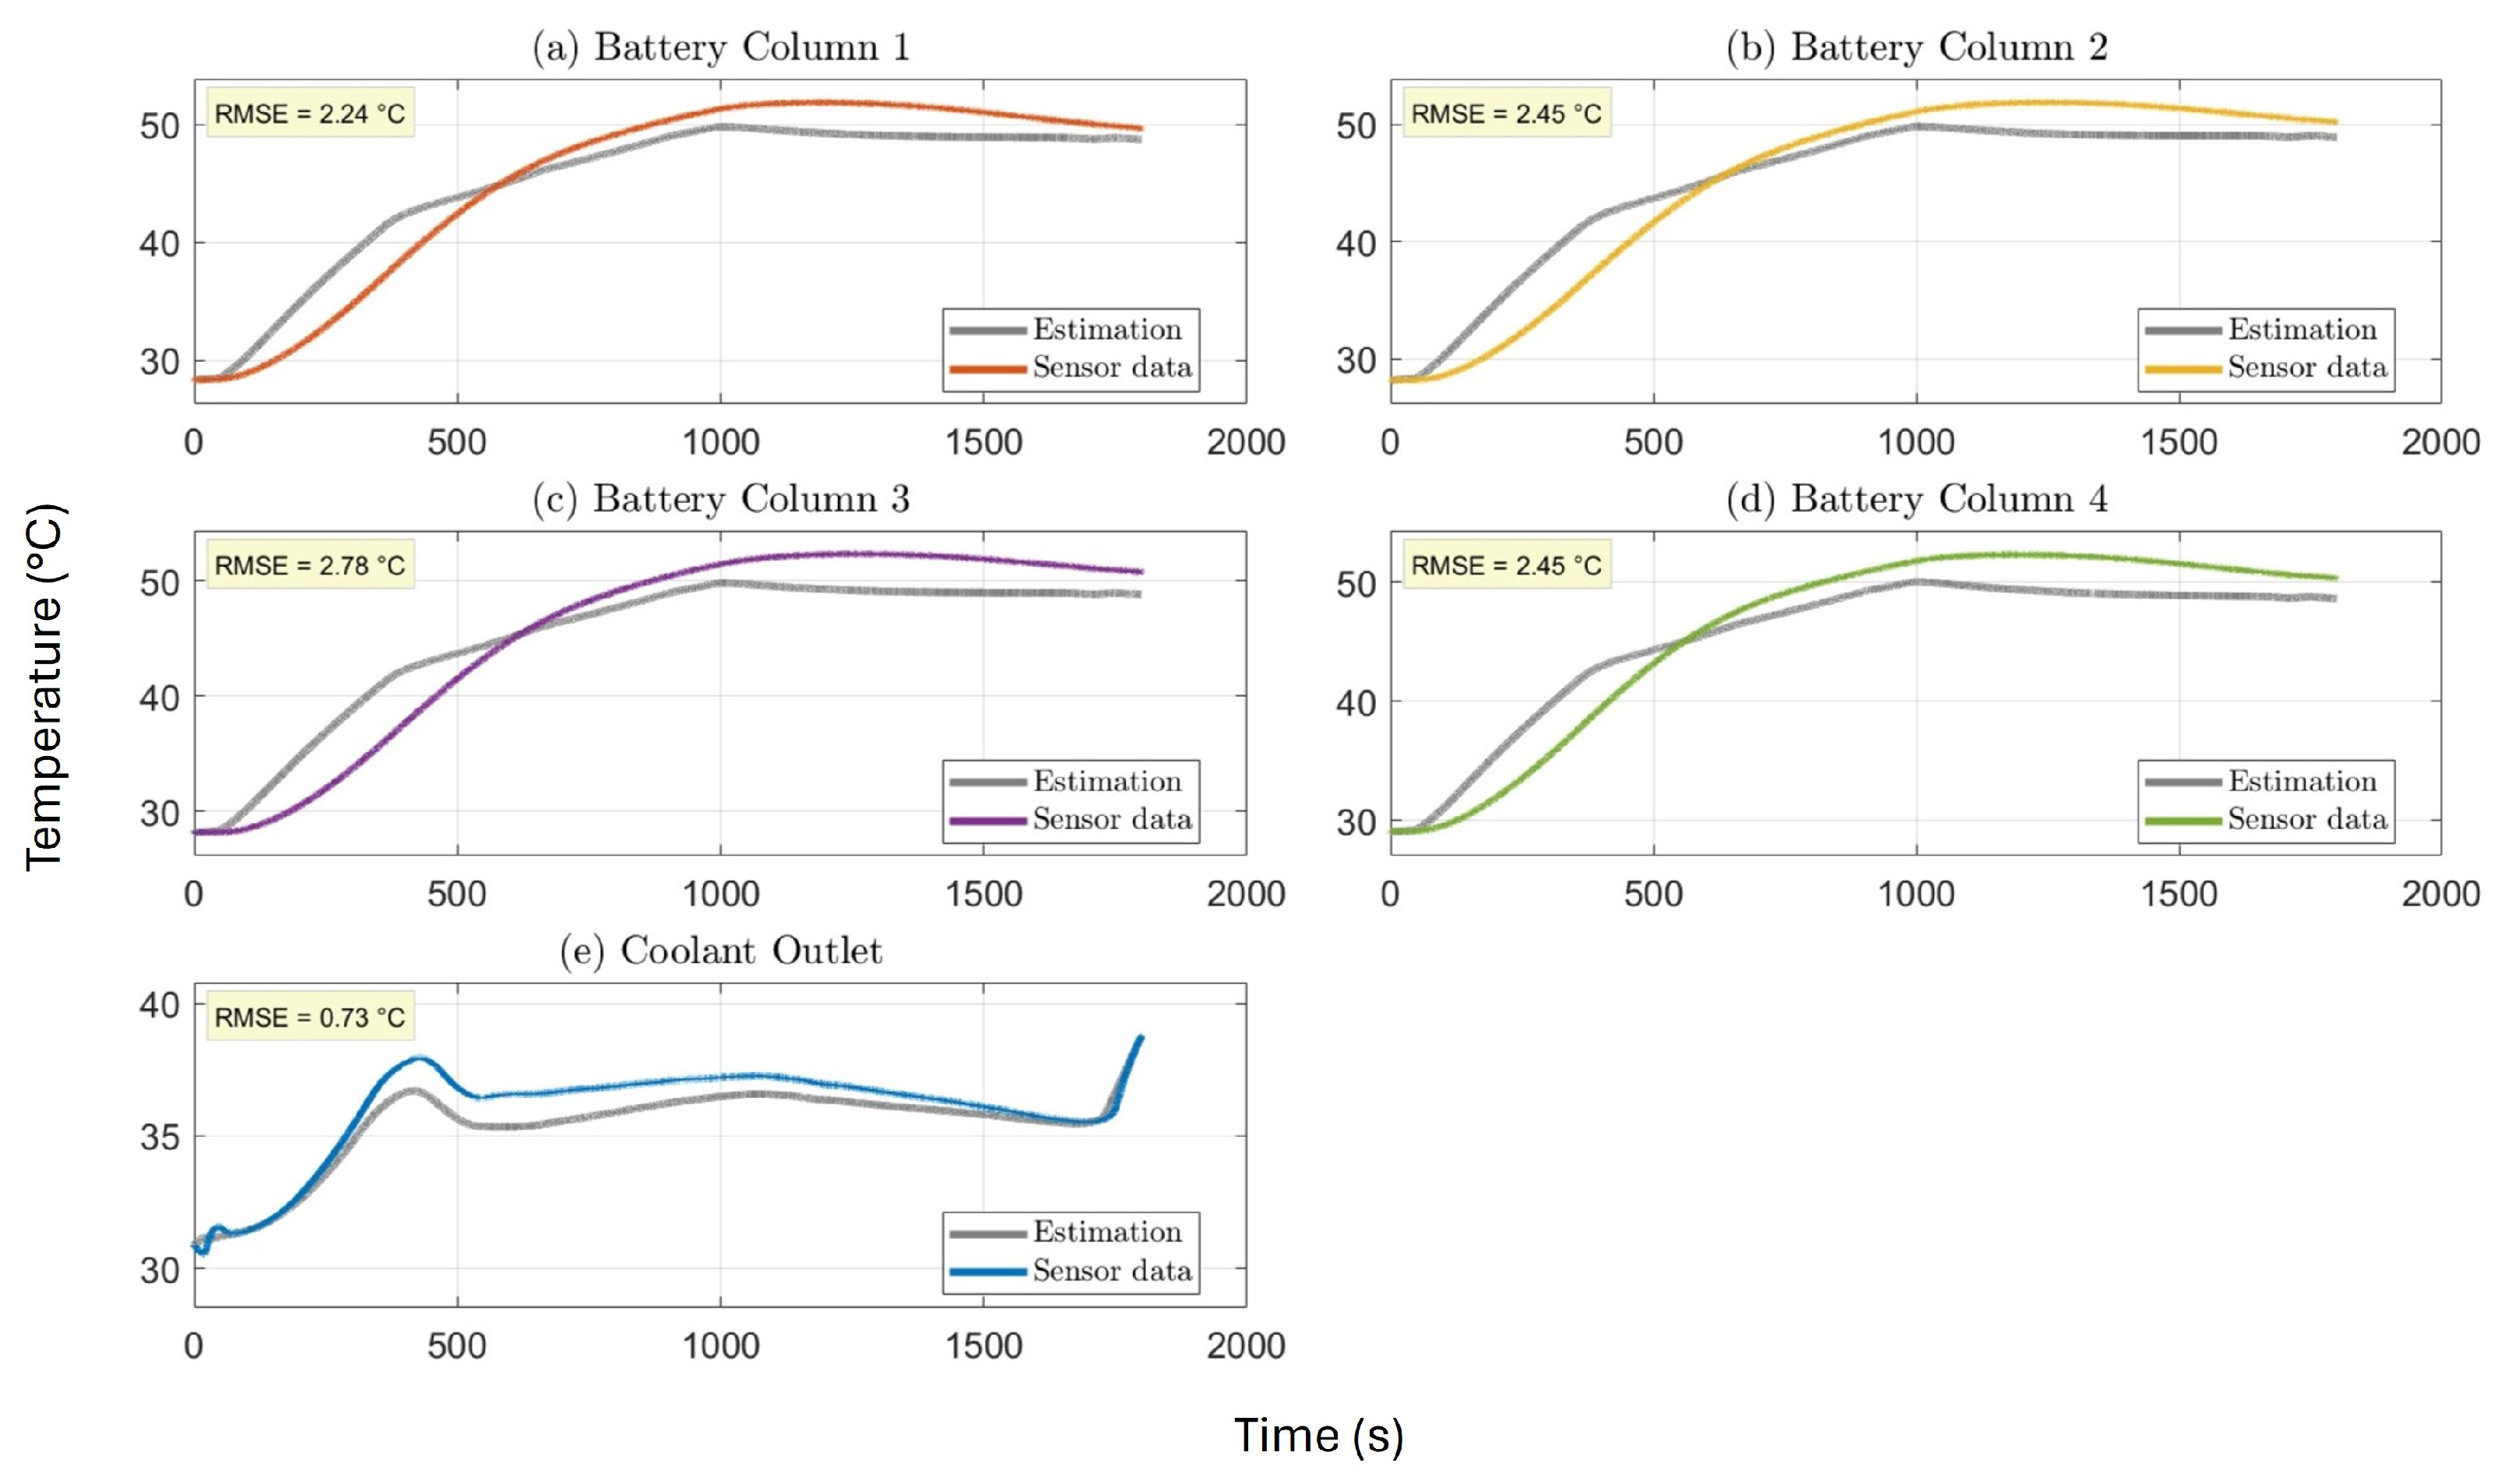
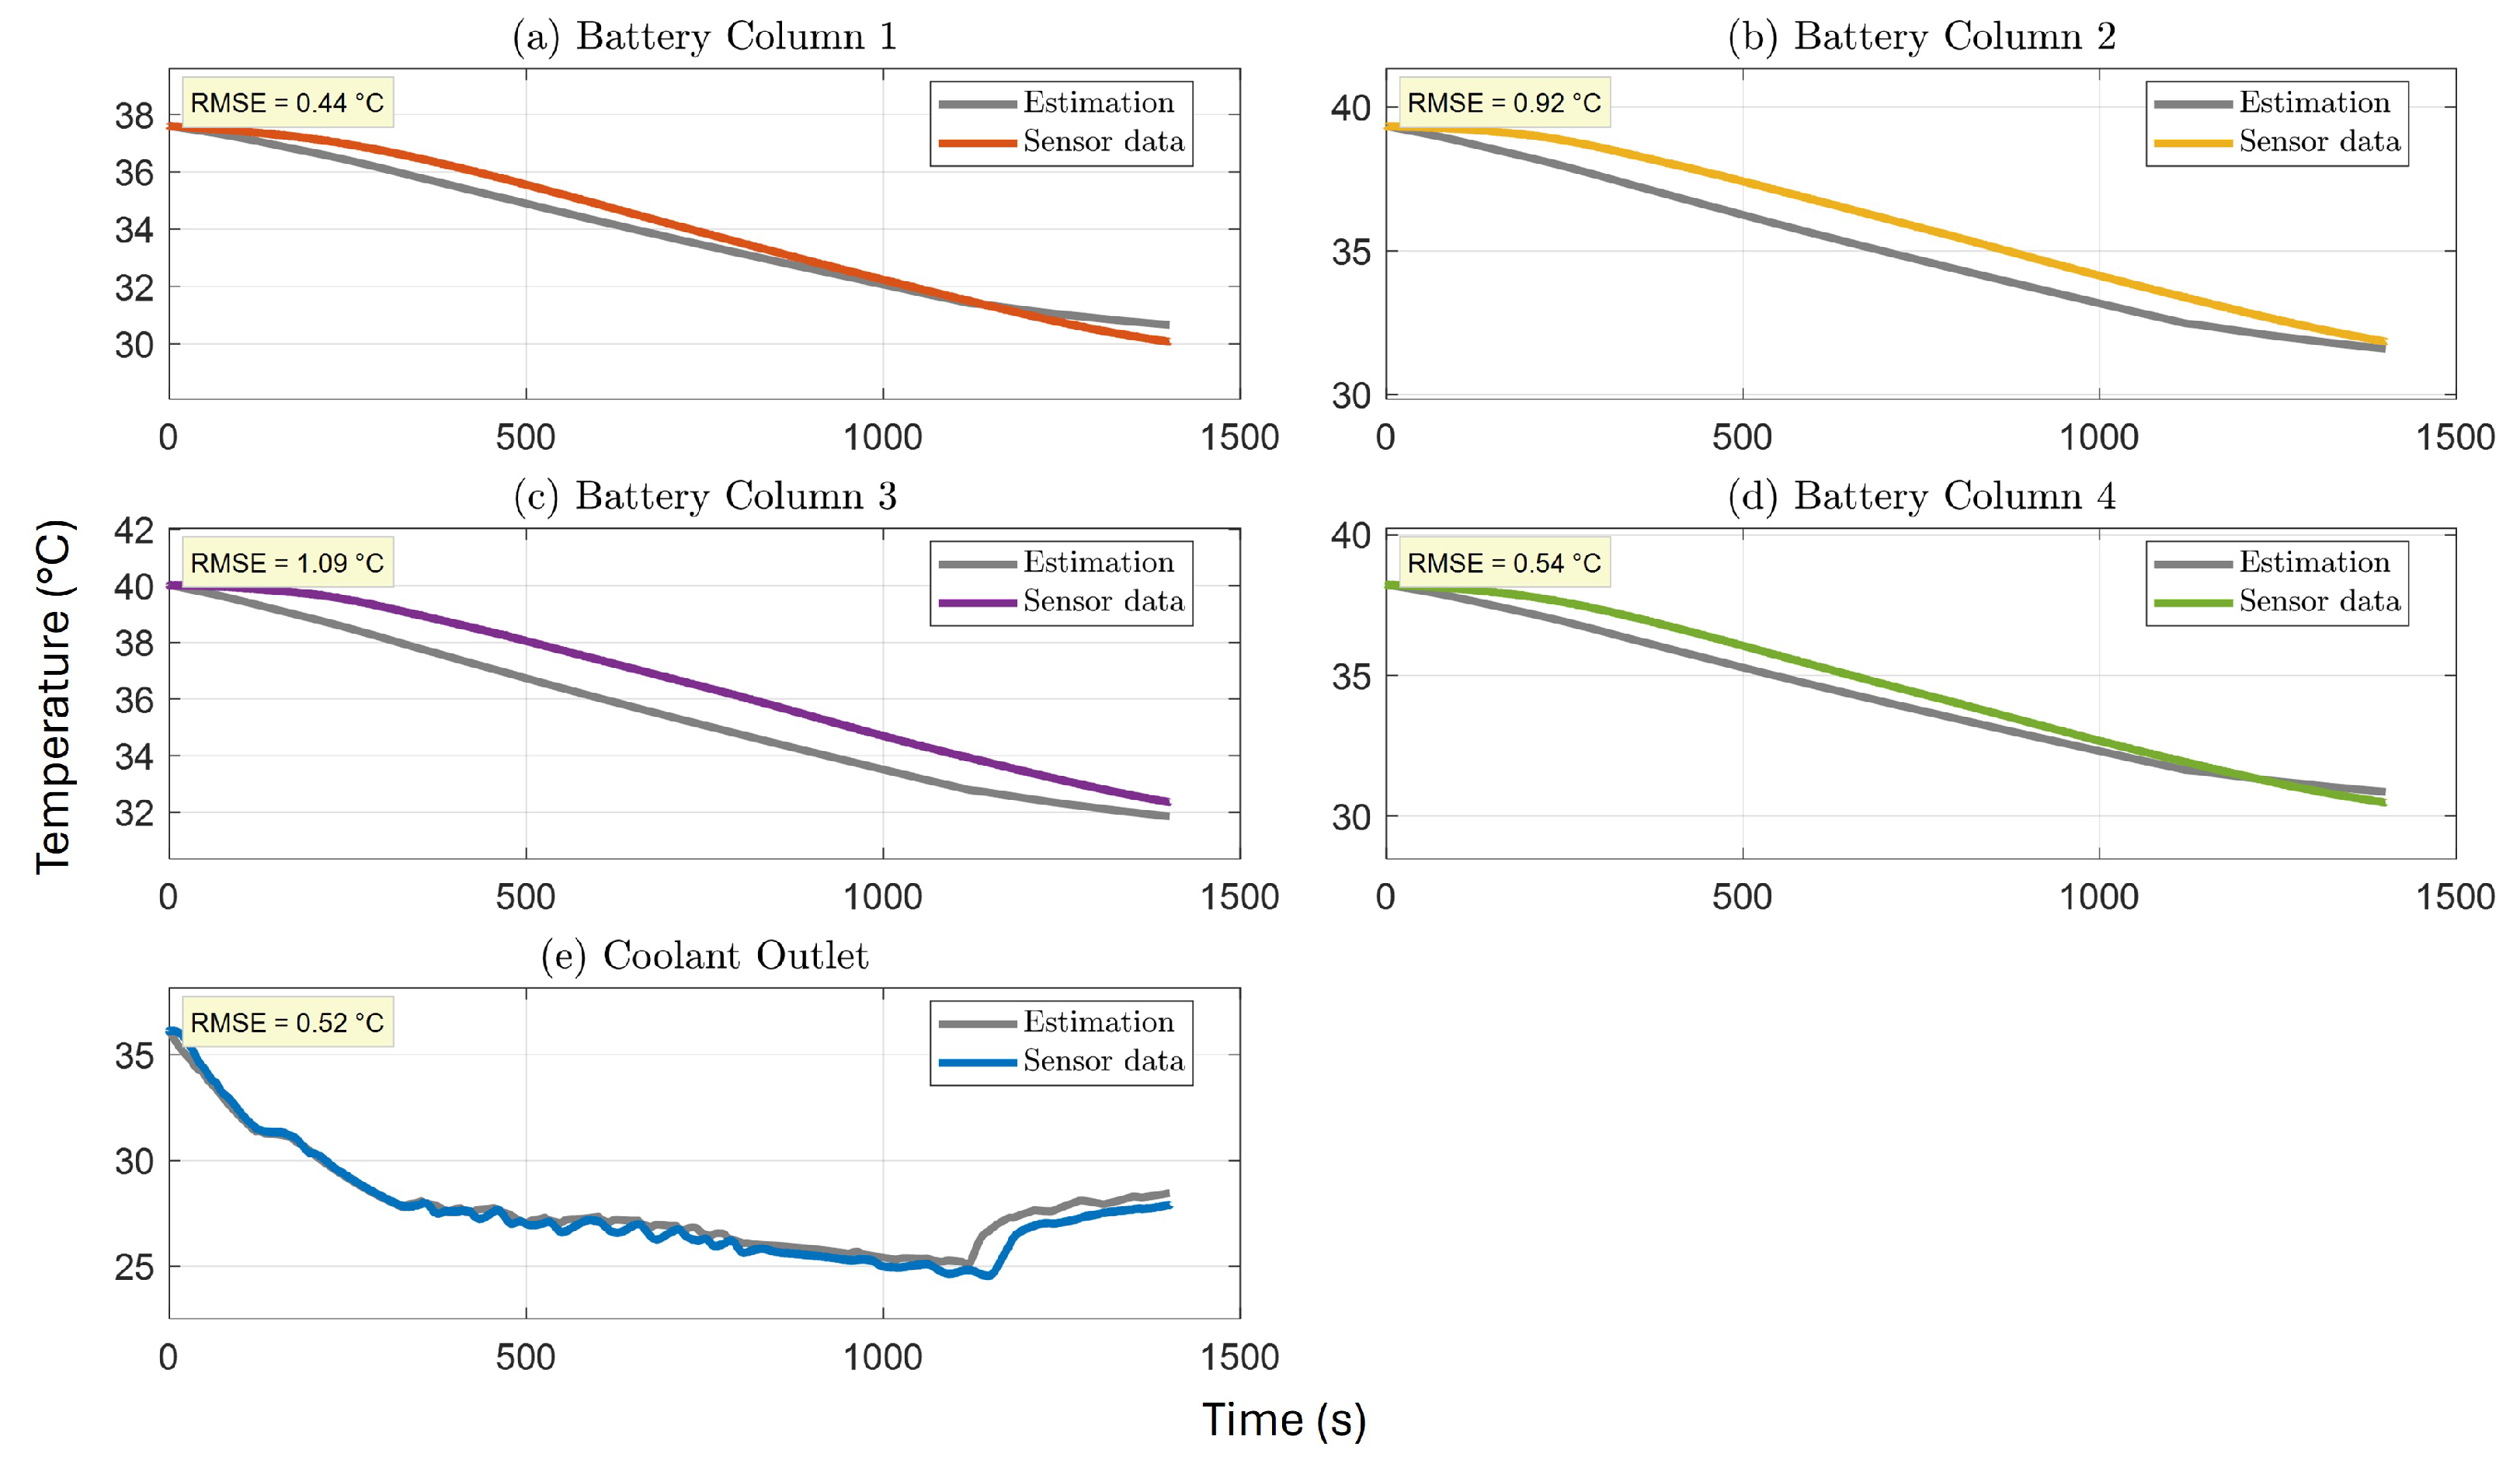
The thermal model receives the calculated heat generation from the parameters of the electrical model using Equation (7), along with additional inputs such as the coolant inlet temperature, coolant flow rate, and chassis temperature. The model predicts the surface temperatures of the battery pack at four different locations as well as the coolant outlet temperature. The general agreements for battery and coolant temperatures are shown in Table 3. The average RMSE for the battery surface temperatures is 0.6 °C, with deviations ranging from 0.06 °C to 2.78 °C. The estimated and measured temperatures for different driving cycles are presented in detail in Figure 12, Figure 13 and Figure 14. These figures demonstrate that the predicted temperature profiles closely follow the measured data. While some discrepancies in absolute temperature are observed, the general trends in temperature changes within the battery modules and the dynamic behavior of the coolant temperature in response to variations in thermal load are successfully captured. In addition, the predicted temperatures are fed back into the electrical model to update its parameters, reinforcing the robustness of the overall coupled model. Overall, the electro-thermal integrated model of the battery pack developed in this study shows strong agreement with the experimental results. Outputs from both the electrical model and the thermal model successfully captured the important characteristics observed from the datasets from the actual vehicle.

5.2. Discussion

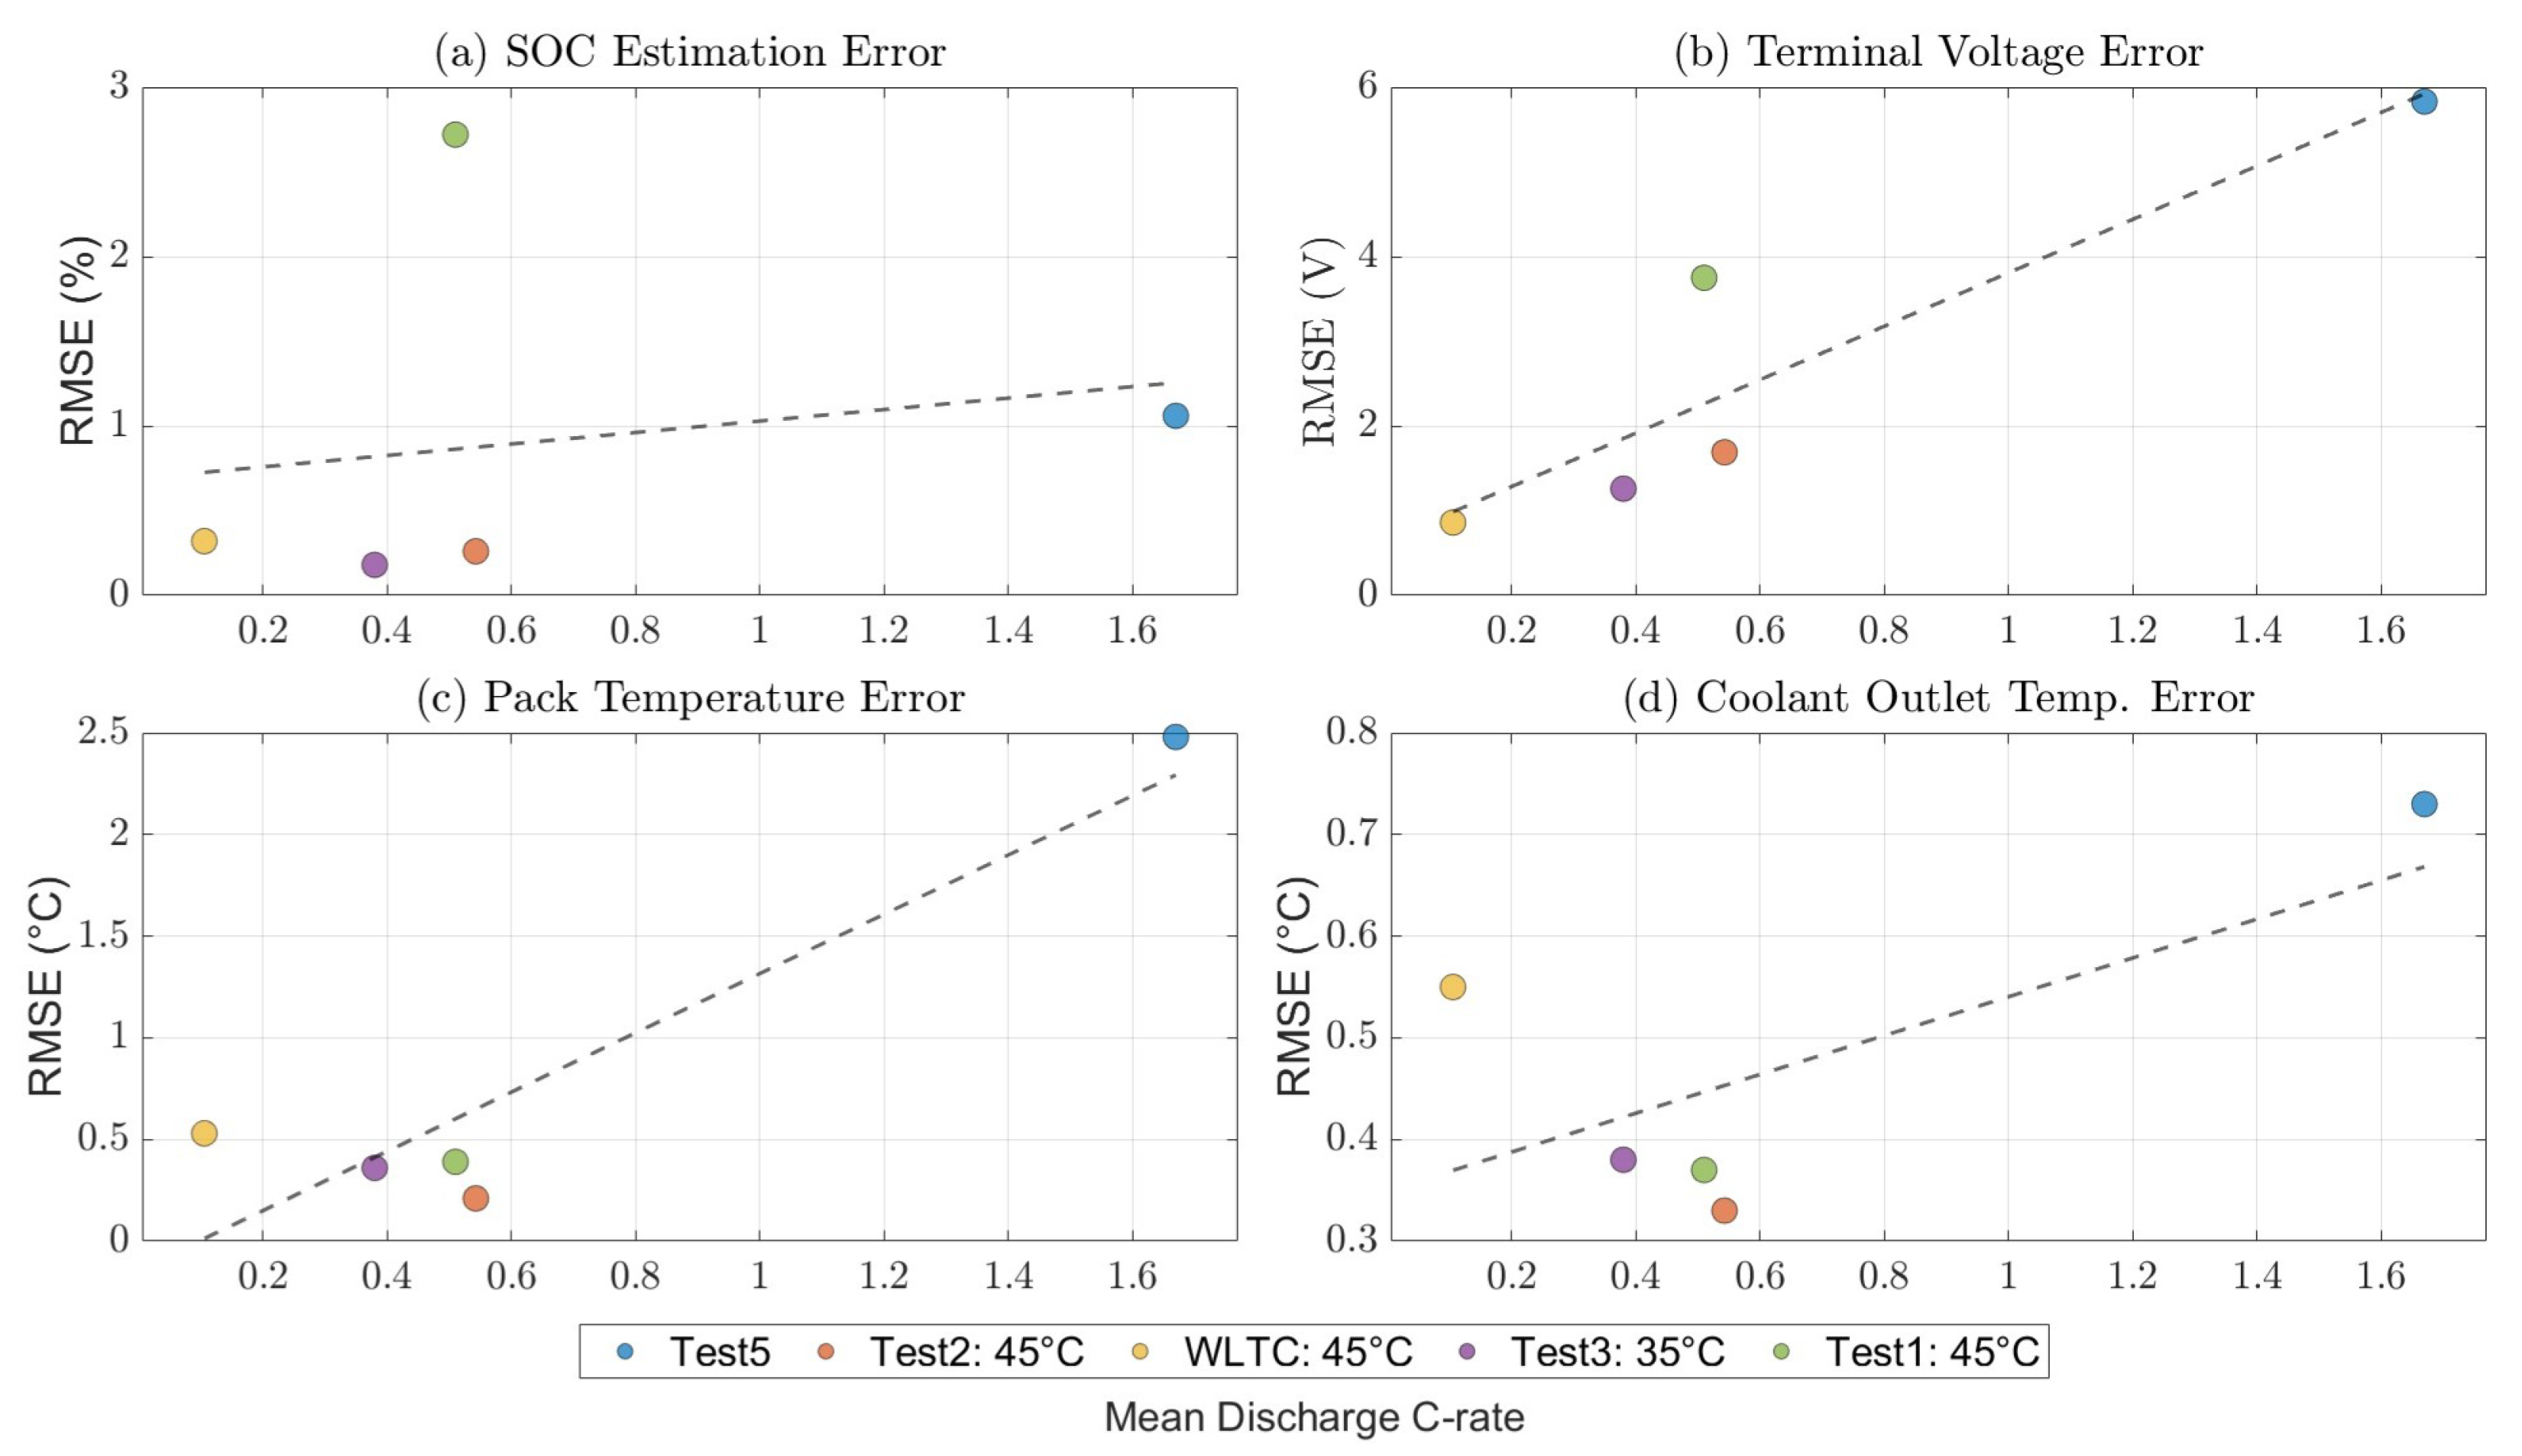
The performance of the electro-thermal coupled model has been extensively evaluated in diverse operating conditions, characterized by varying SOC levels, ambient temperatures, driving profiles, and current dynamics. Notably, the influence of the C-rate on the model’s estimation accuracy is significant, especially in datasets with higher mean C-rates.
For example, in the Test5 dataset, which had a mean C-rate exceeding 1.6 C, the estimation of the average battery temperature, computed as the mean of the temperatures from columns 1 through 4, showed higher errors than other cases, with RMSE values reaching up to 2.5 °C as shown in Figure 15. This increased error is primarily attributed to the thermal model’s dependence on joule (irreversible) heat generation as an input, calculated from electrical parameters multiplied by the square of the current as in Equation (7). Consequently, inaccuracies in the estimation of heat generation become magnified at higher C rates, directly affecting the predictive accuracy of the model. At high C-rates, the model’s prediction error increases due to several factors. First, although the entropy change values of the considered Li-ion batteries reported in the literature typically show reasonable consistency, a detailed composition of the electrode chemistries is not available. As a result, even though entropic heat generation usually makes only a minor contribution to the total heat generation, the lack of precise electrode information can still lead to increased prediction errors. In addition, the considered model employs a single RC ECM, which generally provides good predictive performance under dynamic vehicle and battery operating conditions. Nevertheless, during continuous charging and discharging operations, long-term polarization effects may become significant. The influence of these long-term polarization processes on the total heat generation could be better captured by incorporating additional RC pairs. However, identifying the parameters of these additional RC pairs is challenging when relying on CAN signals collected from vehicle testing, as their quality is limited compared to laboratory-level measurements. This limitation highlights an open research question and suggests a promising direction for future studies. Figure 15 also shows that the RMSE of both SOC and terminal voltage estimates increases systematically with the dataset’s mean discharge C rate. Two mechanisms can account for this trend. First, because the pack-current sensor has a fixed percentage accuracy, the absolute integration error accumulated in Coulomb counting grows in direct proportion to current magnitude, leading to larger SOC deviations at higher C rates. Second, terminal-voltage RMSE rises further because any error in the identified ohmic and polarization resistances is multiplied by the higher current, amplifying the voltage-prediction error. To isolate the effect of C-rate from temperature influences, only drive cycles with nearly constant mean battery pack surface temperatures were used.
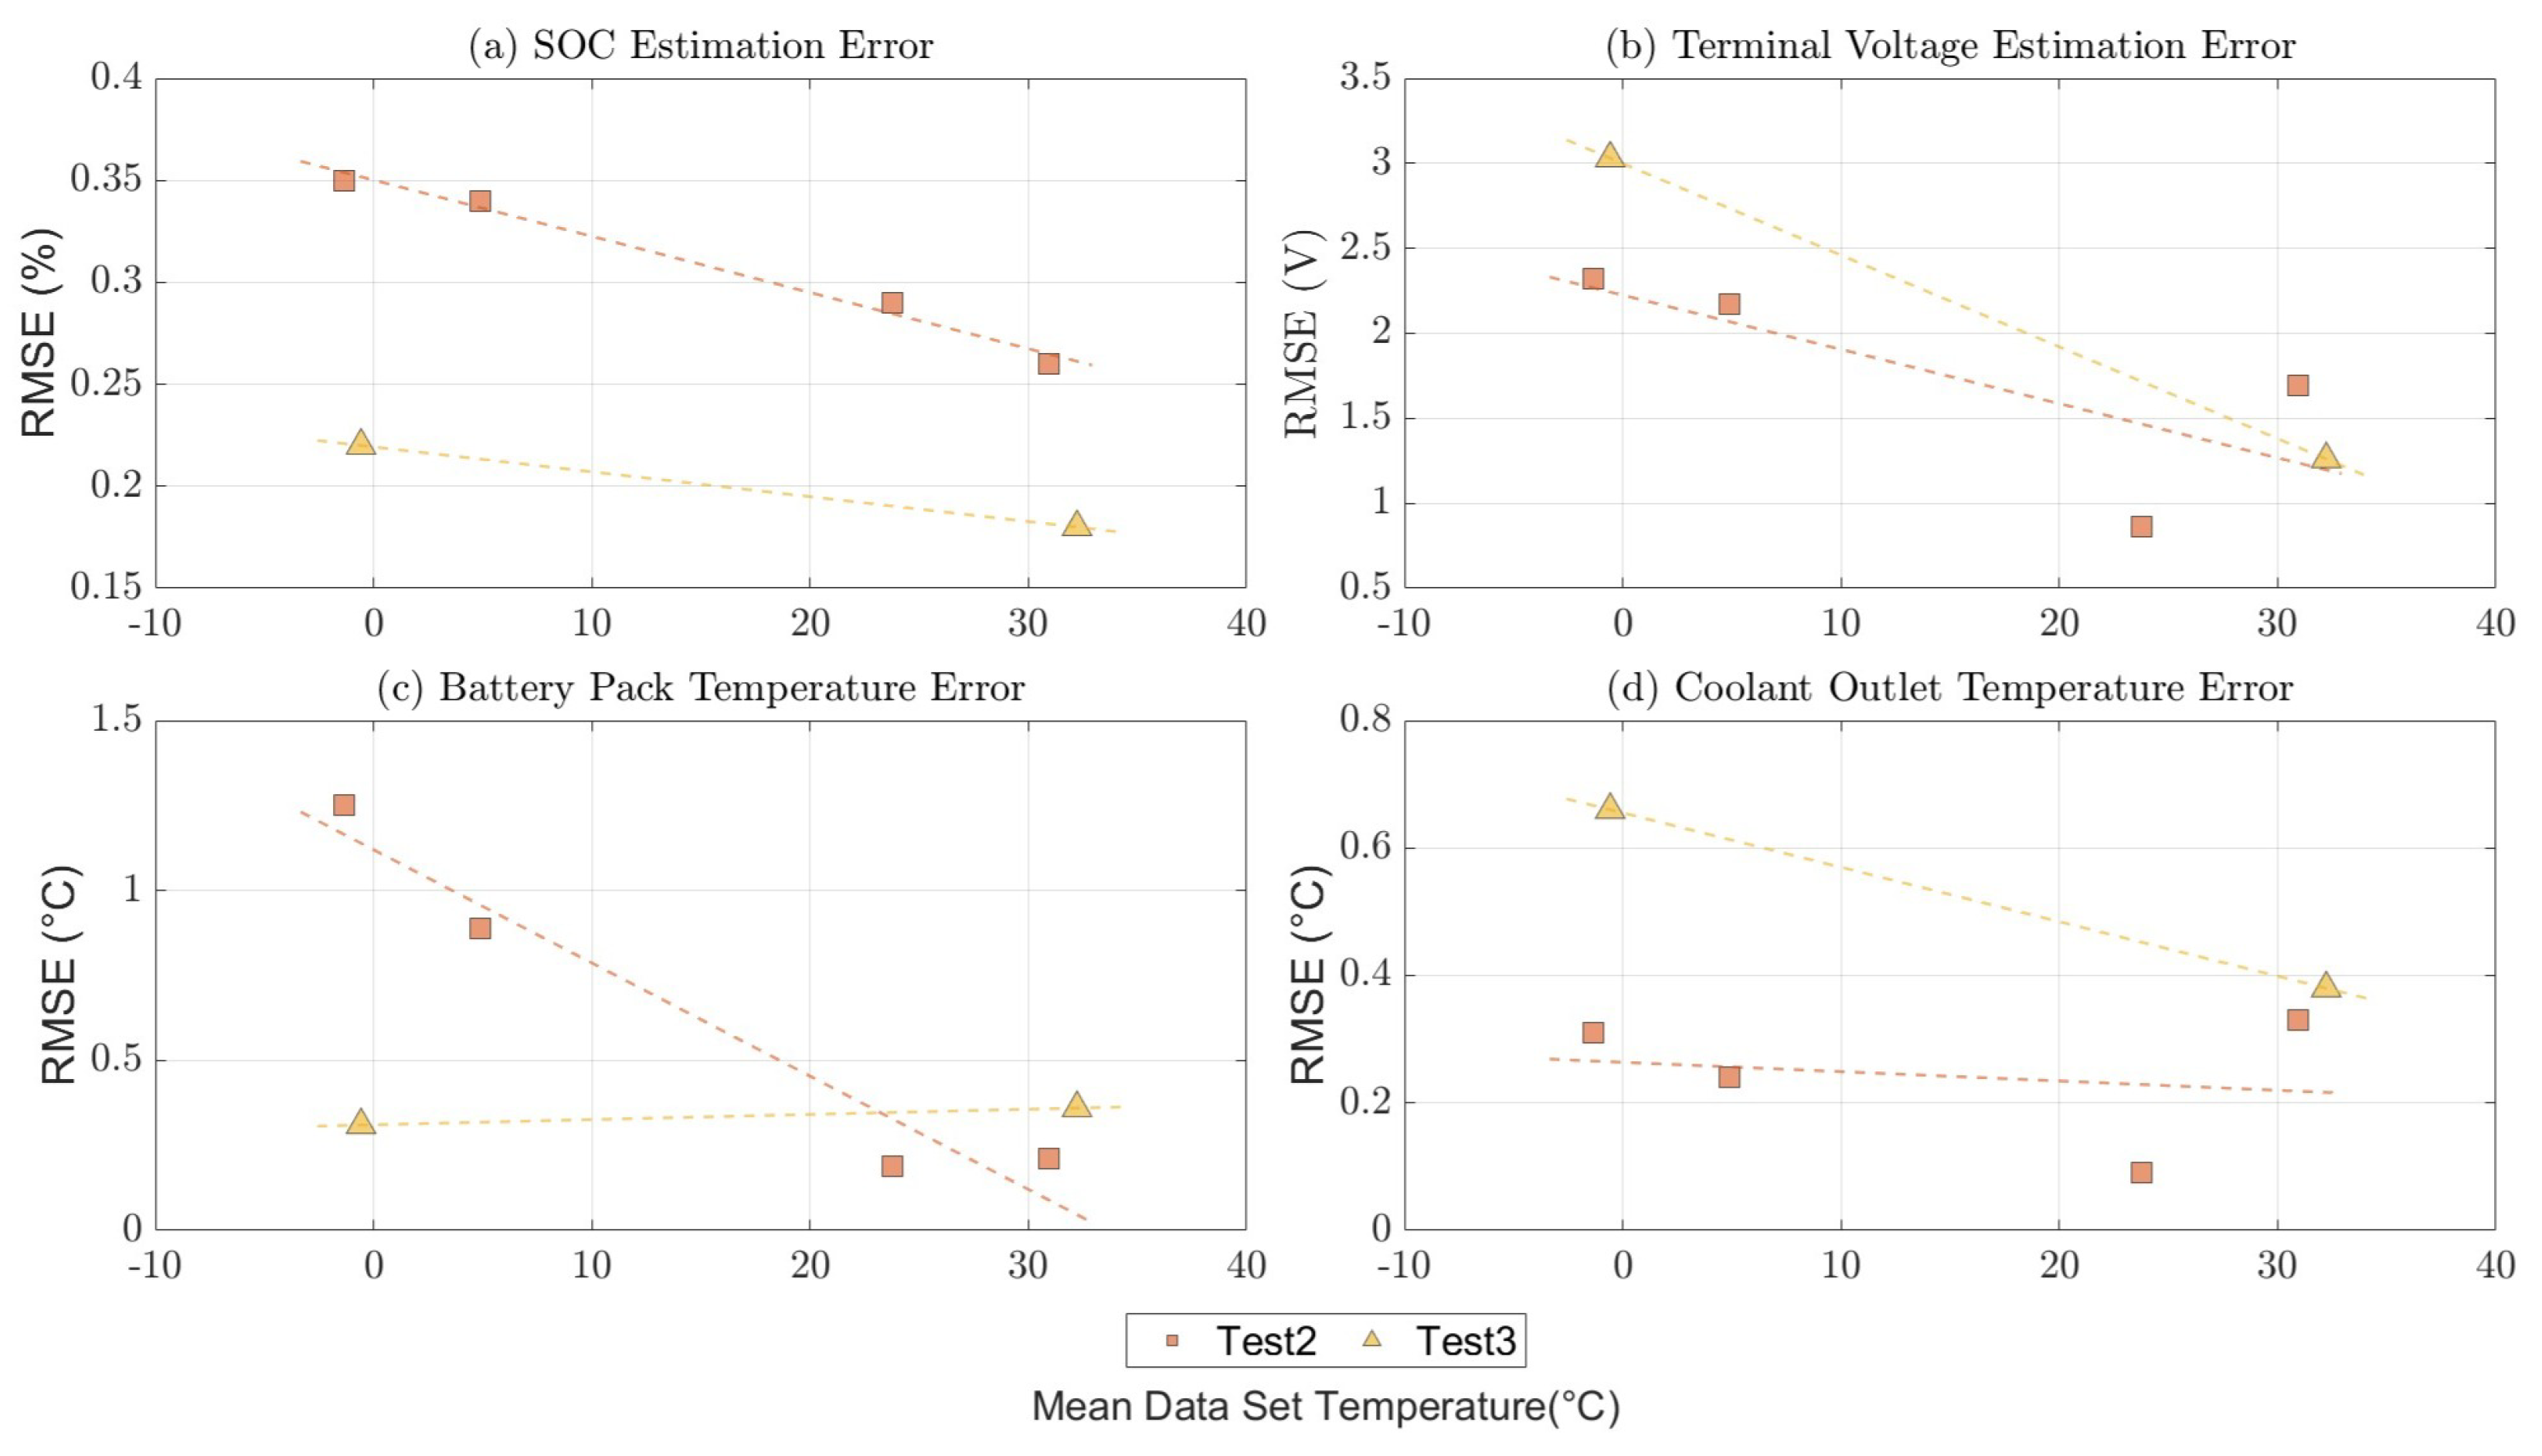
However, when datasets are analyzed at different average pack temperatures but similar driving conditions, such as Test1 and Test3, the model consistently exhibits lower errors at higher temperatures compared to lower temperatures, as illustrated in Figure 16. This behavior could be primarily due to the availability of a higher number of training datasets in medium/high temperature regions, as discussed in Section 2. However, the increase in RMSE at lower temperatures is relatively modest, indicating robust model performance across a broad temperature spectrum.
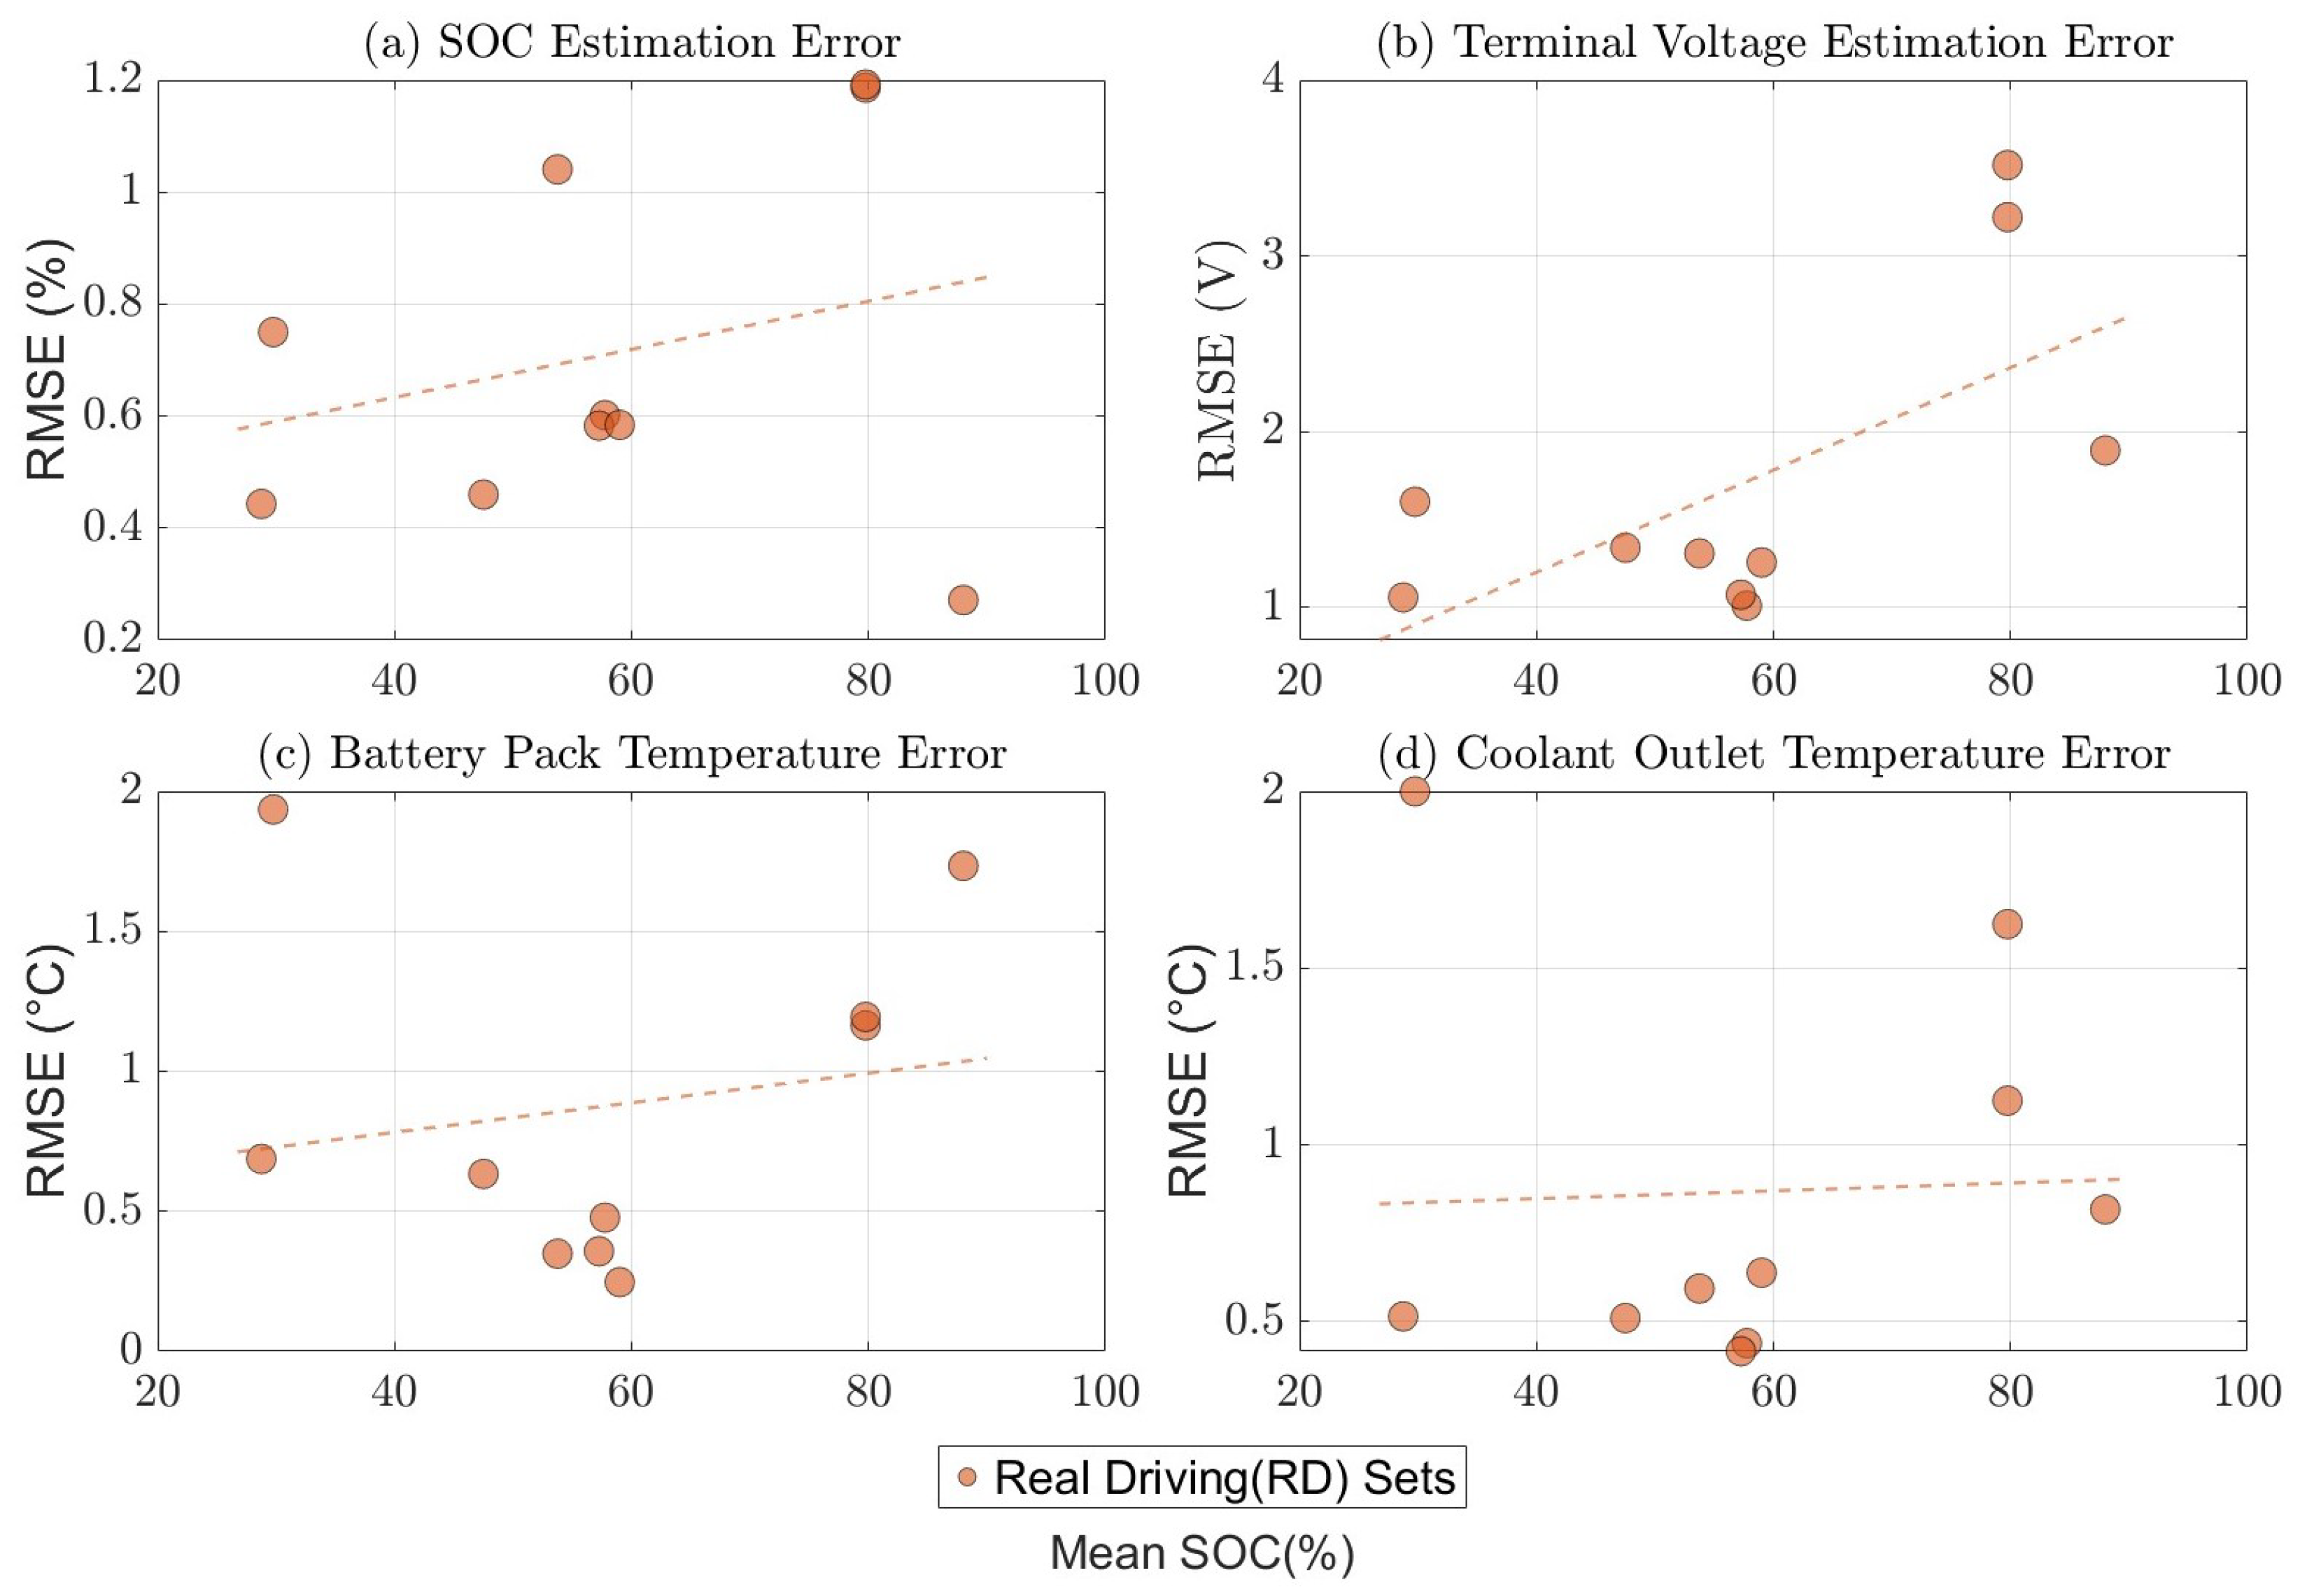
Figure 17 shows RMSE of the state-of-charge, terminal voltage, and pack temperature predictions as a function of the average SOC of each validation set. Datasets whose mean SOC lies in the mid-range (≈20–60%) deliver the lowest errors, whereas sets centered above 80 % SOC exhibit noticeably larger RMSE values. This behavior mirrors the composition of the training data. The majority of drive-cycle segments used for parameter identification were recorded in the mid-SOC window, and only a small fraction captured high-SOC operation. Similarly, the limited availability of training data in low SOC and low-temperature regimes may affect the model’s generalizability, which could influence prediction accuracy in these less-sampled conditions. Augmenting the training set with additional cycles above 80 % SOC should therefore lower the estimation error in that region and improve overall model accuracy in higher SOC regions.
Further analysis of datasets characterized by high current dynamics but relatively lower average C rates, such as RD and WLTC, highlights the model’s proficiency in accurately capturing rapid transient current behaviors. Despite the dynamic nature of these driving profiles, the RMSE values remain comparatively low, demonstrating the model’s ability to effectively track rapid current fluctuations, this behavior is highlighted in Figure 10 and Figure 11. Similar predictive accuracy is also observed in datasets with slower dynamics, such as Test3 with mostly constant speed cruising, underscoring the model’s versatility across both dynamic and steady-state operational conditions.
In general, the analysis suggests that the primary factor that influences the accuracy of the estimate is the magnitude of the C rate, rather than the temperature variations or the dynamic nature of the driving cycles alone. Higher current magnitudes inherently amplify errors in heat generation estimation due to the quadratic dependence of Joule heating on current. Furthermore, extended-duration datasets exhibited higher RMSE values for SOC estimation, primarily due to cumulative errors associated with the coulomb counting method. These errors can potentially be mitigated through the adoption of Kalman-filter-based SOC estimation approaches. Therefore, future improvements should focus on improving the accuracy of the joule heat generation calculation at high C rates and refining the identification of electrical parameters to reduce the model’s sensitivity to higher current conditions.

6. Conclusions

This study presents a comprehensive and practical electro-thermal modeling approach for a lithium-ion battery pack used in electric vehicles, leveraging data from both chassis dynamometer and real-world driving tests. The proposed model integrates a first-order equivalent circuit model (ECM) with a lumped-parameter thermal network, accurately capturing spatial thermal variations within the battery pack. In contrast to previous studies, which often assume uniform heat transfer or simplify thermal boundary conditions, this work explicitly accounts for the effects of coolant flow beneath the battery modules, which is an essential factor for achieving accurate thermal modeling.
All model parameters are identified from vehicle-level CAN data without relying on laboratory-level measurements, making the approach cost-effective and simple. Validation across 31 diverse test datasets shows that the model can predict terminal voltage with an RMSE of less than 6 V (normalized RMSE below 2%), and battery module surface temperatures with RMSEs below 2 °C in more than 90% of test cases. However, it should be noted that over 80% of the test data fall within the temperature range of 15–40 °C and SOC range of 40–90%, with less than 20% representing more extreme conditions (T < 15 °C or >40 °C, SOC < 40% or >90%). As such, model performance under highly extreme temperatures and SOC levels is less comprehensively validated, and further studies will be needed to establish robustness in these regimes. Moreover, the analysis reveals that model accuracy is influenced by the magnitude of the C rate, with higher errors observed at elevated C rates, while the accuracy of the SOC estimation is notably affected by the size of the dataset due to cumulative errors associated with the Coulomb counting method.
Given its demonstrated performance, the developed model offers a valuable tool for enhancing real-time battery performance prediction, optimizing thermal management strategies, and ultimately improving vehicle efficiency and battery longevity in practical electric vehicle applications.
Future improvements to the model could focus on enhancing accuracy under high C-rate conditions by incorporating long-term polarization effects associated with extended battery operation and by refining the thermal boundary conditions. These enhancements are particularly important for more accurately representing battery behavior during fast charging and aggressive driving scenarios. Moreover, expanding the training dataset to include more measurements at low SOC and low-temperature conditions could help improve the model’s generalizability and prediction accuracy under these less-represented operating regimes.

Author Contributions

V.M.: conceptualization, methodology, investigation, formal analysis, validation, software, writing—original draft, investigation, and data curation; L.C.G.: conceptualization, methodology, investigation, formal analysis, validation, software, and data curation; R.Z.: conceptualization, methodology, investigation, formal analysis, validation, software, and data curation; D.K.: conceptualization, methodology, software, validation, formal analysis, investigation, resources, writing—review and editing, supervision, project administration, funding acquisition; Y.K.: conceptualization, methodology, software, validation, formal analysis, investigation, resources, writing—review and editing, supervision, project administration, funding acquisition; A.U.: visualization, supervision, project administration, resources, funding acquisition; S.Z.: visualization, supervision, project administration, resources, funding acquisition; K.P.H.: visualization, resources, supervision, project administration, funding acquisition. All authors have read and agreed to the published version of the manuscript.

Funding

This research was funded by Hyundai America Technical Center, Inc.

Data Availability Statement

The data presented in this study include proprietary information provided by the vehicle manufacturer and are, therefore, not publicly available. Data may be available from the corresponding author upon reasonable request and with permission from the manufacturer.

Acknowledgments

The authors from the University of Michigan-Dearborn would like to acknowledge the financial and technical support from Hyundai America Technical Center, Inc.

Conflicts of Interest

Authors Ankith Ullal, Shengrong Zhu and Kyoung Pyo Ha were employed by the company Hyundai America Technical Center Incorporated. The remaining authors declare that the research was conducted in the absence of any commercial or financial relationships that could be construed as a potential conflict of interest.

Abbreviations

The following abbreviations and symbols are used in this manuscript:
V T Terminal Voltage (V)
V ocv Open Circuit Voltage (V)
R i Internal Resistance ( Ω )
i 0 Battery Pack Current (A)
V p Polarization Voltage (V)
i p Polarization Current (A)
R p Polarization Resistance ( Ω )
C p Polarization Capacitance (F)
S O C State of Charge (%)
E C M Equivalent Circuit Model
τ Polarization Time Constant (s)
E V Electric Vehicle
C A N Control Area Network
N M C Nickel Manganese Cobalt
R D Real Driving
[ M C p ] n Thermal Mass of n Battery Column (J  K 1 )
[ M C p ] p a c k Thermal Mass of the Battery Pack (J  K 1 )
W L T C Worldwide Harmonized Light vehicle Test Cycles
F T P Federal Test Procedure
C b a t t Battery Pack Capacity (Ah)
T c h Chassis/Battery Enclosure Temperature (°C)
R c c h Thermal Resistance Between the Chassis and Coolant (K/W)
R b c h Thermal Resistance Between the Battery and Chassis (K/W)
R n Thermal Resistance Between the Battery Module and Coolant (K/W)
T C , k Coolant Temperature at Location k (°C)
T B , n Battery Column n Temperature (°C)
q t o t a l , n Bulk Heat Generation in Battery Column n (Watt)
Q t o t a l Bulk Heat Generation in Battery Pack (Watt)
Q i r r Irreversible Heat Generation in the Battery Pack (Watt)
Q r e v Reversible Heat Generation in the Battery Pack (Watt)
u n Convective Heat Transfer Coefficient ( W m 2 K 1 )
A n Contact Surface Area of Battery Column n and Coolant Plate (m2)
C f Coolant Flow Capacity ( J K 1 s 1 )
O C V Open Circuit Voltage (V)
V b Base Voltage at Zero Output Current (V)
Z e q Equivalent Impedance ( Ω )
ω Frequency of Current (Hz)
P S O Particle Swarm Optimization
N u Nusselt Number
R e Reynolds Number
m ˙ Mass Flow Rate ( kg s 1 )
TBattery Pack Surface Temperature (°C)
T a v g Average Battery Pack Surface Temperature (°C)
C p , e f f Specific Heat Capacity ( J kg 1 K 1 )

References

  1. Nitta, N.; Wu, F.; Lee, J.T.; Yushin, G. Li-ion battery materials: Present and future. Mater. Today 2015, 18, 252–264. [Google Scholar] [CrossRef]
  2. Berecibar, M.; Gandiaga, I.; Villarreal, I.; Omar, N.; Van Mierlo, J.; Van den Bossche, P. Critical review of state of health estimation methods of Li-ion batteries for real applications. Renew. Sustain. Energy Rev. 2016, 56, 572–587. [Google Scholar] [CrossRef]
  3. Hoke, A.; Brissette, A.; Smith, K.; Pratt, A.; Maksimovic, D. Accounting for Lithium-Ion Battery Degradation in Electric Vehicle Charging Optimization. IEEE J. Emerg. Sel. Top. Power Electron. 2014, 2, 691–700. [Google Scholar] [CrossRef]
  4. Wang, Y.; Tian, J.; Sun, Z.; Wang, L.; Xu, R.; Li, M.; Chen, Z. A comprehensive review of battery modeling and state estimation approaches for advanced battery management systems. Renew. Sustain. Energy Rev. 2020, 131, 110015. [Google Scholar] [CrossRef]
  5. Zhang, C.; Li, K.; McLoone, S.; Yang, Z. Battery modelling methods for electric vehicles—A review. In Proceedings of the 2014 European Control Conference (ECC), Strasbourg, France, 24–27 June 2014; pp. 2673–2678. [Google Scholar] [CrossRef]
  6. Moura, S.J.; Argomedo, F.B.; Klein, R.; Mirtabatabaei, A.; Krstic, M. Battery State Estimation for a Single Particle Model with Electrolyte Dynamics. IEEE Trans. Control Syst. Technol. 2017, 25, 453–468. [Google Scholar] [CrossRef]
  7. Deng, Z.; Yang, L.; Deng, H.; Cai, Y.; Li, D. Polynomial approximation pseudo-two-dimensional battery model for online application in embedded battery management system. Energy 2018, 142, 838–850. [Google Scholar] [CrossRef]
  8. Oyewole, I.; Kwak, K.H.; Kim, Y.; Lin, X. Optimal Discretization Approach to the Enhanced Single-Particle Model for Li-Ion Batteries. IEEE Trans. Transp. Electrif. 2021, 7, 369–381. [Google Scholar] [CrossRef]
  9. Hu, X.; Li, S.; Peng, H. A comparative study of equivalent circuit models for Li-ion batteries. J. Power Sources 2012, 198, 359–367. [Google Scholar] [CrossRef]
  10. Madani, S.S.; Ziebert, C.; Marzband, M. Thermal Behavior Modeling of Lithium-Ion Batteries: A Comprehensive Review. Symmetry 2023, 15, 1597. [Google Scholar] [CrossRef]
  11. Tekin, M.; Karamangil, M.İ. Comparative analysis of equivalent circuit battery models for electric vehicle battery management systems. J. Energy Storage 2024, 86, 111327. [Google Scholar] [CrossRef]
  12. Zhang, H.; Deng, C.; Zong, Y.; Zuo, Q.; Guo, H.; Song, S.; Jiang, L. Effect of Sample Interval on the Parameter Identification Results of RC Equivalent Circuit Models of Li-ion Battery: An Investigation Based on HPPC Test Data. Batteries 2023, 9, 1. [Google Scholar] [CrossRef]
  13. Kim, N.; Rousseau, A.; Rask, E. Parameter Estimation for a Lithium-Ion Battery from Chassis Dynamometer Tests. IEEE Trans. Veh. Technol. 2016, 65, 4393–4400. [Google Scholar] [CrossRef]
  14. Shin, J.; Kim, W.; Yoo, K.; Kim, H.; Han, M. Vehicular level battery modeling and its application to battery electric vehicle simulation. J. Power Sources 2023, 556, 232531. [Google Scholar] [CrossRef]
  15. Lin, X.; Fu, H.; Perez, H.E.; Siege, J.B.; Stefanopoulou, A.G.; Ding, Y.; Castanier, M.P. Parameterization and Observability Analysis of Scalable Battery Clusters for Onboard Thermal Management. Oil Gas Sci. Technol.-Rev. IFP Energies Nouv. 2013, 68, 165–178. [Google Scholar] [CrossRef]
  16. Samad, N.A.; Wang, B.; Siegel, J.B.; Stefanopoulou, A.G. Parameterization of Battery Electrothermal Models Coupled with Finite Element Flow Models for Cooling. J. Dyn. Syst. Meas. Control 2017, 139, 071003. [Google Scholar] [CrossRef]
  17. Park, S.; Jung, D. Battery cell arrangement and heat transfer fluid effects on the parasitic power consumption and the cell temperature distribution in a hybrid electric vehicle. J. Power Sources 2013, 227, 191–198. [Google Scholar] [CrossRef]
  18. Chiang, Y.-H.; Sean, W.-Y.; Ke, J.-C. Online estimation of internal resistance and open-circuit voltage of lithium-ion batteries in electric vehicles. J. Power Sources 2011, 196, 3921–3932. [Google Scholar] [CrossRef]
  19. Dubarry, M.; Vuillaume, N.; Liaw, B.Y. From Li-ion single cell model to battery pack simulation. In Proceedings of the 2008 IEEE International Conference on Control Applications, San Antonio, TX, USA, 3–5 September 2008; pp. 708–713. [Google Scholar] [CrossRef]
  20. Liaw, B.Y.; Nagasubramanian, G.; Jungst, R.G.; Doughty, D.H. Modeling of lithium ion cells—A simple equivalent-circuit model approach. Solid State Ion. 2004, 175, 835–839. [Google Scholar] [CrossRef]
  21. Lucero, J.N.E.; Sujan, V.A.; Onori, S. An Experimentally Validated Electro-Thermal EV Battery Pack Model Incorporating Cycle-Life Aging and Cell-to-Cell Variations. IEEE Trans. Transp. Electrif. 2024, 10, 8122–8136. [Google Scholar] [CrossRef]
  22. Geng, Z.; Groot, J.; Thiringer, T. A Time- and Cost-Effective Method for Entropic Coefficient Determination of a Large Commercial Battery Cell. IEEE Trans. Transp. Electrif. 2020, 6, 257–266. [Google Scholar] [CrossRef]
  23. Bernardi, D.; Pawlikowski, E.; Newman, J. A General Energy Balance for Battery Systems. J. Electrochem. Soc. 1985, 132, 5. [Google Scholar] [CrossRef]
  24. Han, U.; Choi, H.; Lee, H.; Lee, H. Inverse Heat Transfer Analysis Method to Determine the Entropic Coefficient of Reversible Heat in Lithium-Ion Battery. Int. J. Energy Res. 2023, 2023, 9929496. [Google Scholar] [CrossRef]
  25. Lempert, J.; Kollmeyer, P.; Malysz, P.; Gross, O.; Cotton, J.; Emadi, A. Battery Entropic Heating Coefficient Testing and Use in Cell-Level Loss Modeling for Extreme Fast Charging. SAE Int. J. Adv. Curr. Pract. Mobil. 2020, 2, 2712–2720. [Google Scholar] [CrossRef]
  26. Incropera, F.P.; DeWitt, D.P.; Bergman, T.L.; Lavine, A.S. Fundamentals of Heat and Mass Transfer, 6th ed.; John Wiley & Sons: Hoboken, NJ, USA, 2007; pp. 347–534. ISBN 978-0-471-45728-2. [Google Scholar]
  27. Bryden, T.S.; Dimitrov, B.; Hilton, G.; Ponce de León, C.; Bugryniec, P.; Brown, S.; Cumming, D.; Cruden, A. Methodology to determine the heat capacity of lithium-ion cells. J. Power Sources 2018, 395, 369–378. [Google Scholar] [CrossRef]
  28. Auch, M.; Kuthada, T.; Wagner, A. Simple experimental method to determine the specific heat capacity of cylindrical Lithium-Ion-Battery cells. Appl. Therm. Eng. 2023, 234, 121212. [Google Scholar] [CrossRef]
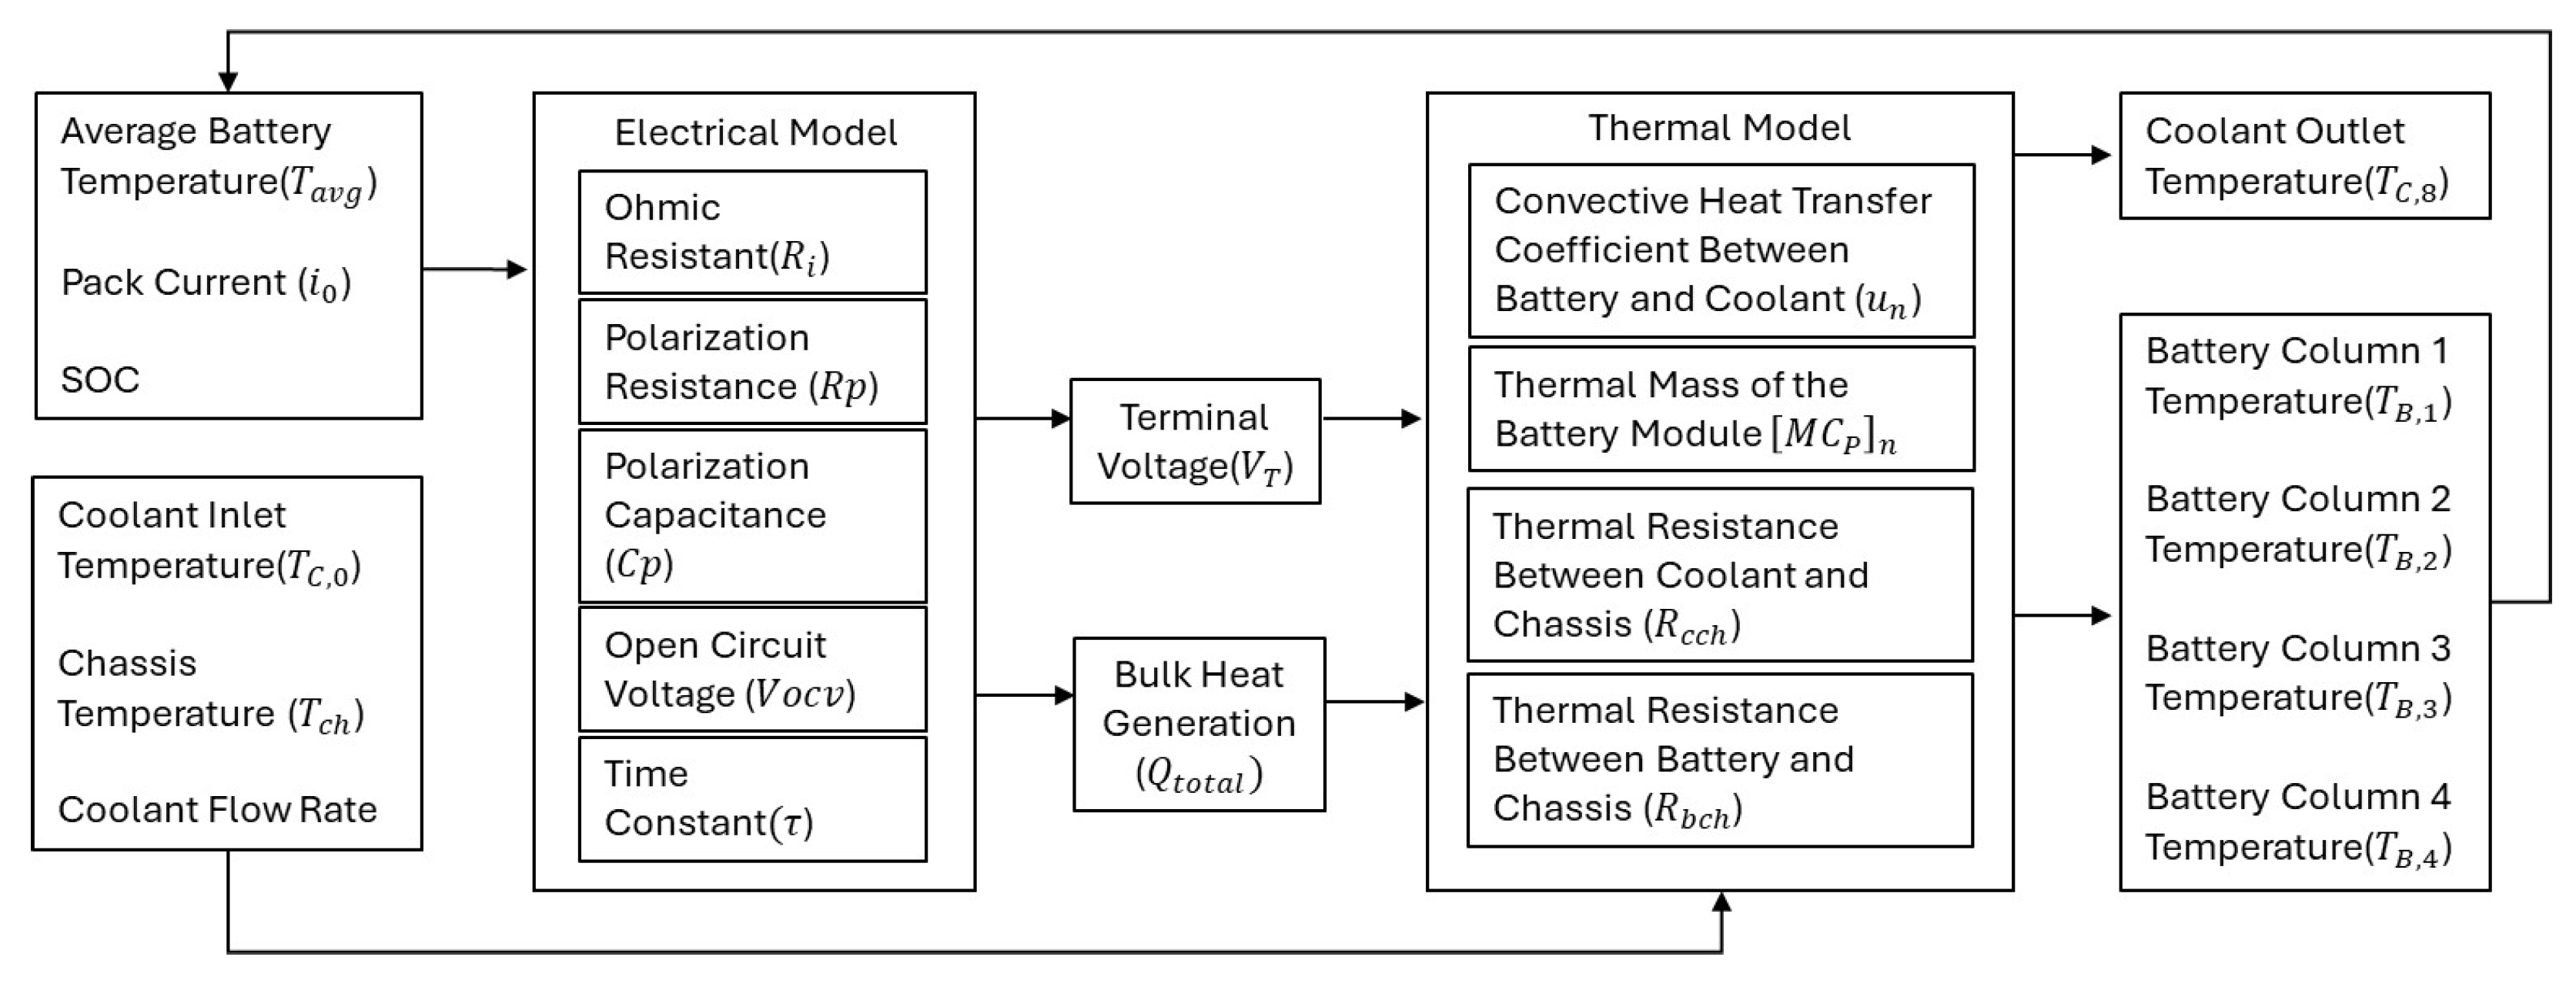
Figure 1. Overview of the electro-thermal coupled model.
Batteries 11 00319 g001
Figure 2. A schematic of a first-order ECM: OCV-R-RC.
Batteries 11 00319 g002
Figure 3. Configuration of the thermal resistance network model.
Batteries 11 00319 g003
Figure 4. Estimated values for polarization time constant: (a) estimated time constants plotted against temperature; (b) estimated time constants plotted against SOC.
Batteries 11 00319 g004
Figure 5. Comparison of estimated and measured base voltage for τ = 26 s at different SOC values and battery temperatures: (a) 72% SOC and 38 °C battery temperature; (b) 50% SOC and 40 °C battery temperature; (c) 72% SOC and 23 °C battery temperature; (d) 48% SOC and 28 °C battery temperature.
Batteries 11 00319 g005
Figure 6. Identified internal resistance R i surface overlaid with data points.
Batteries 11 00319 g006
Figure 7. An eighth-order polynomial fitted to the identified open-circuit voltage ( V O C V ) data points.
Batteries 11 00319 g007
Figure 8. Polarization resistance values that minimize the RMSE between the model and data.
Batteries 11 00319 g008
Figure 9. Test5 dataset: Vehicle speed (km/h), model performance for SOC and terminal voltage estimation.
Batteries 11 00319 g009
Figure 10. WLTC 45C dataset: Vehicle Speed (km/h), model performance for SOC and terminal voltage estimation.
Batteries 11 00319 g010
Figure 11. RD2 dataset: Vehicle speed (km/h), model performance for SOC and terminal voltage estimation.
Batteries 11 00319 g011
Figure 12. Comparison of predicted coolant and 4 battery columns temperatures against experimental measurements for the Test5 dataset.
Batteries 11 00319 g012
Figure 13. Comparison of predicted coolant and 4 battery columns temperatures against experimental measurements for the FTP-75 dataset.
Batteries 11 00319 g013
Figure 14. Comparison of predicted coolant and 4 battery columns temperatures against experimental measurements for Test1 45C dataset.
Batteries 11 00319 g014
Figure 15. Error variation in different mean discharge C rates: (a) error variation for SOC estimation; (b) error variation for battery pack terminal voltage estimation; (c) error variation for average battery pack surface temperature estimation; (d) error variation for temperature estimation at coolant outlet with the mean discharge C rate.
Batteries 11 00319 g015
Figure 16. Error variation in different mean battery temperature: (a) SOC estimation error variation; (b) terminal voltage estimation error variation; (c) average pack surface temperature estimation error variation; (d) coolant outlet temperature estimation error variation with the mean battery surface temperature.
Batteries 11 00319 g016
Figure 17. Error variation in different mean state-of-charge levels: (a) SOC estimation error variation; (b) terminal voltage estimation error variation; (c) average pack surface temperature estimation error variation; (d) coolant outlet temperature estimation error variation with mean SOC levels.
Batteries 11 00319 g017
Table 1. Test data used for this study.
TypeNameAmbient Temp.  [ C]SOC Range# SetsNote
Chassis Dynamometer TestWLTC−10–4580–90%6Harmonized light-vehicle cycle
FTP-752280–85%1Urban driving with stops & starts
US062265–75%1Aggressive driving
Test1−10–4540–80%4Inclines from 15  % to + 50  %
Test2−10–4545–75%4Speed steps of 20 km h 1
Test3−10–3545–75%2Constant 120 km h 1
On-road TestRealDriving0–2015–100%10General on-road test
Test415–3025–85%1Steady cruising on highway
Test535–450–85%1Acceleration to 130 km h 1
Test65–1580–100%1Congested traffic
Table 2. Identified thermal model parameters.
ParameterSymbolValueUnit
Total heat transfer coefficientcoefficient (a)1.68
exponent (b)0
constant (C)31.01W/m2K
Thermal mass of the battery column [ M C p ] n 100,262J/K
Thermal resistance (chassis–coolant) R cch 0.080K/W
Thermal resistance (battery–chassis) R bch 0.076K/W
Table 3. Root mean square error (RMSE) metrics for all datasets. All RMSE values are reported in their respective units.
Dataset NameRMSE–Temperature (°C)Terminal
Voltage (V)
SOC (%)
Battery Column 1 Battery Column 2 Battery Column 3 Battery Column 4 Coolant
Outlet
Test52.242.452.782.450.735.831.06
Test40.590.480.420.370.206.673.70
Test2:45C0.100.310.270.170.331.690.26
WLTC:45C0.540.470.550.570.550.860.32
Test3:35C0.420.370.370.280.381.260.18
WLTC:35C0.160.150.390.190.334.440.61
Test1:45C0.280.380.470.420.373.752.72
Test1:22C0.220.240.390.220.162.701.20
Test1:0C0.220.260.340.231.046.360.59
Test1:-10C0.210.240.240.211.254.580.49
FTP75:20C0.440.921.090.540.525.250.43
RD11.290.850.911.601.633.521.19
RD20.500.690.500.210.441.010.60
RD31.310.860.941.671.133.221.19
RD40.620.750.700.680.511.060.44
RD50.340.600.370.120.421.070.58
RD61.541.641.762.000.821.890.27
RD70.180.420.400.400.591.311.04
RD80.660.450.510.900.511.340.46
RD90.300.350.220.120.641.260.58
RD102.071.331.622.712.001.600.75
Test60.820.270.511.530.892.810.75
WLTC:-7C0.330.430.080.080.523.410.63
Test3:-7C0.320.240.290.400.663.030.22
Test2:-10C1.111.631.290.970.312.320.35
Test2:0C0.831.060.920.760.242.170.34
Test2:22C0.150.220.230.170.090.860.29
US06:22C0.100.180.140.120.204.190.44
WLTC:-10C0.120.140.150.120.273.910.34
WLTC:0C0.080.120.110.090.212.070.33
WLTC:22C0.060.060.060.070.221.550.21
Disclaimer/Publisher’s Note: The statements, opinions and data contained in all publications are solely those of the individual author(s) and contributor(s) and not of MDPI and/or the editor(s). MDPI and/or the editor(s) disclaim responsibility for any injury to people or property resulting from any ideas, methods, instructions or products referred to in the content.