Article

Fine Mapping and Candidate Gene Analysis of the Gv1 Locus Controlling Green-Peel Color in Eggplant (Solanum melongena L.)

1
Guangdong Key Laboratory for New Technology Research of Vegetables, Vegetable Research Institute, Guangdong Academy of Agricultural Sciences, Guangzhou 510640, China
2
Key Laboratory of Horticultural Plant Biology, Ministry of Education, Huazhong Agricultural University, Wuhan 510642, China
3
Institute of Vegetable, Guangxi Academy of Agricultural Sciences, Nanning 530007, China
*
Author to whom correspondence should be addressed.
These authors contributed equally to this work.
Horticulturae 2023, 9(8), 888; https://doi.org/10.3390/horticulturae9080888
Submission received: 7 July 2023 / Revised: 28 July 2023 / Accepted: 2 August 2023 / Published: 4 August 2023
(This article belongs to the Special Issue Breeding by Design: Advances in Vegetables)

Abstract

:
Peel color is one of the most important appearance qualities of eggplant. The main pigment in the peel of green-fruited eggplant is chlorophyll, while white-fruited eggplant is a mutant of chlorophyll biosynthesis. A dominant gene Gv controls chlorophyll biosynthesis in eggplant peel, but none of its genes have been mapped. In this study, the white-peel inbred line 19141, the green-peel inbred line 19143, and their F2 progeny with 3:1 segregation ratio of green-peel plants to white-peel plants, were used to map the Gv1 locus by whole genome re-sequencing combined with bulked segregant analysis (BSA). The Gv1 gene was mapped in a region spanning 7.66 Mb on chromosome 8, which was narrowed down to 173.2 kb interval by screening recombinant plants with InDel and SNP markers. Sixteen candidate genes were annotated in the above closely associated region. With the aid of RNA-Seq data, it was speculated that SmAPPR2-like is the candidate gene for Gv1. The results of cloning and sequencing of SmAPPR2-like showed that there might have been three types of mutation (large deletion, frameshift variant and premature stop codon) in white-peel accessions, and of these, the deletion mutation, such as that in inbred line 19141, was the most common. Based on the sequence difference of SmAPPR2-like, molecular markers were developed to distinguish the white and green-peel accessions in natural eggplant populations, and the other types of genetic variations of SmAPPR2-like leading to white-peel accessions were elucidated. The present study not only provided reliable markers for MAS (marker-assisted selection) breeding for eggplant peel color, but also paved the way for understanding the molecular mechanism of SmAPPR2-like on chlorophyll biosynthesis in eggplant fruit.

1. Introduction

Eggplant (Solanum melongena L., 2n = 24) is one of the world’s top ten healthy vegetables recommended by the WHO. Eggplant belongs to the family Solanaceae and plays an important role in the vegetable supply. Eggplant peel has rich and diverse colors, including purple black, purple red, pink, green, white and others. Different regions have different consumption habits for peel color selection, so peel color is an important breeding objective for eggplant.
Inheritance of eggplant peel color is a complex trait controlled by multiple genes. Two types of pigment determine the peel color of eggplant, namely, anthocyanin and chlorophyll, whose content and proportion jointly determine the color of eggplant peel [1]. Anthocyanins belong to flavonoids of phenolic compounds, mainly distributed in the vacuoles of eggplant epidermal cells. Chlorophyll is mostly distributed in the subepidermal cell layer of eggplant, which determines its green color, but its color can also be affected by anthocyanins.
Chlorophyll-deficient mutants of fruit have been reported in pepper [2], cucumber [3,4], bitter gourd [5], wax gourd [6] and other vegetables. Hu et al. (2002) [5] and Behera et al. (2012) [7] found that the green or white color of bitter gourd fruit is controlled by a pair of nuclear genes, and green is dominant to white. Genetic analysis has been conducted on the white fruit of young cucumber, and the results showed that a pair of recessive genes “ww” controlled this trait [8]. Liu et al. (2016) [9] found that the mutation of the candidate gene APRR2 related to chlorophyll biosynthesis regulation was the cause of the white color of cucumber young fruit based on fine mapping. As for the relationship between eggplant peel color and chlorophyll, Tatebe (1939) [10] found that the green-peel color of eggplant was controlled by the Gv gene [10], and green was dominant over white [11].
Both the green-peel eggplant and the white-peel eggplant have mutations in the gene controlling anthocyanin biosynthesis [12,13]. Compared with green-peel eggplant, the white-peel eggplant also has mutations in the Gv locus associated with chlorophyll biosynthesis. Eggplant varieties with green or white peel could not be distinguished at the seedling stage, so it is necessary to develop corresponding molecular markers on the basis of Gv mapping. In the process of eggplant germplasm innovation with different peel colors, the authors obtained inbred line 19143 (male parent) with a white flower and green peel and inbred line 19141 (female parent) with a white flower and white peel from progenies separated from the same origin through pedigree breeding. On this basis, a study on the inheritance of green-peel color controlled by the Gv1 locus, the mapping of the Gv1 locus and the development of molecular markers closely linking to Gv1 would accelerate the breeding process of eggplant varieties with different peel colors. Moreover, candidate genes obtained by gene annotation in closely associated regions could lay a foundation for elucidating the molecular mechanism of green-peel color formation in eggplant.

2. Materials and Methods

Plant materials and phenotype investigation.
The Vegetable Research Institute of Guangdong Academy of Agricultural Sciences bred two purified inbred lines: female parent 19141 with white peel and male parent 19143 with green peel. In the spring of 2021, with these two parents, their F1 (20183) and F2 populations were sown and grown in a greenhouse. The seedlings were planted in the field at the five true leaf stages in Baiyun District (113.27° N, 23.16° E), Guangdong, China. The peel color of all the F2 progeny was recorded as green (regardless of color depth) or white at the marketable fruit stage.
Determination of chlorophyll content.
Chlorophylls were extracted from peels of the two parents and F1 (20183) using 95% ethanol. The chlorophyll concentration was measured with an ultraviolet spectrophotometer at λ665 and λ649 [14]. The chlorophyll concentration was calculated using the formula: Chlorophyll a = 13.95 × ΔA665–6.88 × ΔA649 (mg/L); Chlorophyll b = 24.96 × ΔA649–7.32 × ΔA665 (mg/L); and Total Chlorophyll = 6.63 × ΔA665 + 18.08 × ΔA649 × (V/1000)/W (mg/g), where A is the absorbance at the corresponding wavelength, V is the volume of the extracting solution (mL) and W is the weight of the fresh peels (g).
DNA library construction and re-sequencing.
The genomic DNA of each plant was isolated from young leaves using the SteadyPure Plant Genome DNA Extraction Kit (Accurate Biotechnology, Hunan, China). The DNA was quantified using a NanoDrop 2000 spectrophotometer (Thermo Scientific, Waltham, MA, USA). Thirty plants with green peel and thirty plants with white peel were selected from the F2 population to construct the bulked sample pool. An equal amount of DNA from each plant of the green group was mixed to form the green-peel pool (20183G-bulk) and from the white group to obtain a white-peel pool (20183W-bulk), with a final concentration of 50 ng/μL. To construct the resequencing libraries, the four DNA samples, namely, 20183G-bulk, 20183W-bulk, the female parent 19141, and the male parent 19143 were sonicated to produce 350 bp fragments. The sheared DNA was end-repaired, a single nucleotide (A) overhang was added, and then, sequencing adapters were ligated using T4 DNA ligase. PCR amplification was conducted, and the products were then purified. Sequencing was performed on an Illumina HiSeq system using the standard protocol after the quality test. The sequencing data were processed by removing the inferior quality reads (quality score < 20e), and the raw reads were sorted based on barcode sequences. After the barcodes were trimmed, the clean, high-quality reads from each sample were mapped onto the reference genome ‘SME_HQ’ [15]. The detection of single nucleotide polymorphism (SNP) sites was performed using GATK software [16]. The ΔSNP-index was calculated for an association analysis, to find significant differences in genotype frequency between the two pools. As for quality traits controlled by a single gene, the expected threshold of the ΔSNP index is 0.667 in an F2 population. Loess regression fitting was performed to determine and obtain the association threshold. Regions over the threshold were considered to be candidate regions associated with the Gv1 locus controlling green-peel color.
Development of InDel and SNP Markers.
The genome sequence of the Gv1 candidate interval was downloaded from the reference genome ‘SME_HQ’ (http://eggplant-hq.cn/Eggplant/home/index, accessed on 6 July 2021) [15]. Based on the analysis results of genome re-sequencing of the two parents (19141 and 19143), InDel markers were developed by designing primers according to its flanking sequence (400 bp on each side) and PCR products detected on a 6% polyacrylamide denaturing gel. The SNP markers were analyzed with PARMS (Penta prime amplification reflex mutation system) technology [17]. Genotyping was performed on individual plants of the F2 population, and recombinant plants were screened according to the comparison of genotype and peel color phenotype of individual plants. Primers for InDel and SNP Markers are listed in Table S1.
Annotation and screening of candidate gene.
The genes in the closely associated regions were annotated according to the reference genome ‘SME_HQ’ [15], and the sequences and expression differences of annotated candidate genes were analyzed with the help of re-sequencing and peel transcriptome sequencing data of two parent lines (19143 and 19141); the candidate genes for eggplant green fruit color Gv1 locus were further screened through q-PCR validation.
Cloning of candidate gene and developing of molecular markers.
Using the cDNA sequence of EGP19168 annotated in reference genome GUIQIE-1 (https://db.cngb.org/cnsa/, extraction No.: CNP0000734, ref. [18]) as a reference, the primers were designed (Table S1), cDNA and DNA of 19141 and 19143 were used as templates to amplify SmAPRR2-like, and then sequencing results were spliced.
Based on the DNA sequence difference of SmAPRR2-like in two parent lines, the molecular marker of the SmAPRR2-like gene was developed. The marker was used to identify the genotype for a specific genetic population (such as the F2 population and its genealogy selection progenies) and to distinguish between green-peel color and white-peel color germplasms in natural populations. The PCR reaction system was as follows: 10 μL 2× PCR mix, 1 μL DNA template (500 ng/μL), 0.5 μL forward primer (10 mM), 0.5 μL reverse primer (10 mM), and 8 μL ddH2O. The PCR amplification procedure was as follows: 94 °C for 3 min; 35 cycles of 94 °C for 30 s; 51 °C for 60 s; 72 °C for 60 s; and 72 °C for 10 min. PCR products were detected by electrophoresis on 1% agarose gel.

3. Results

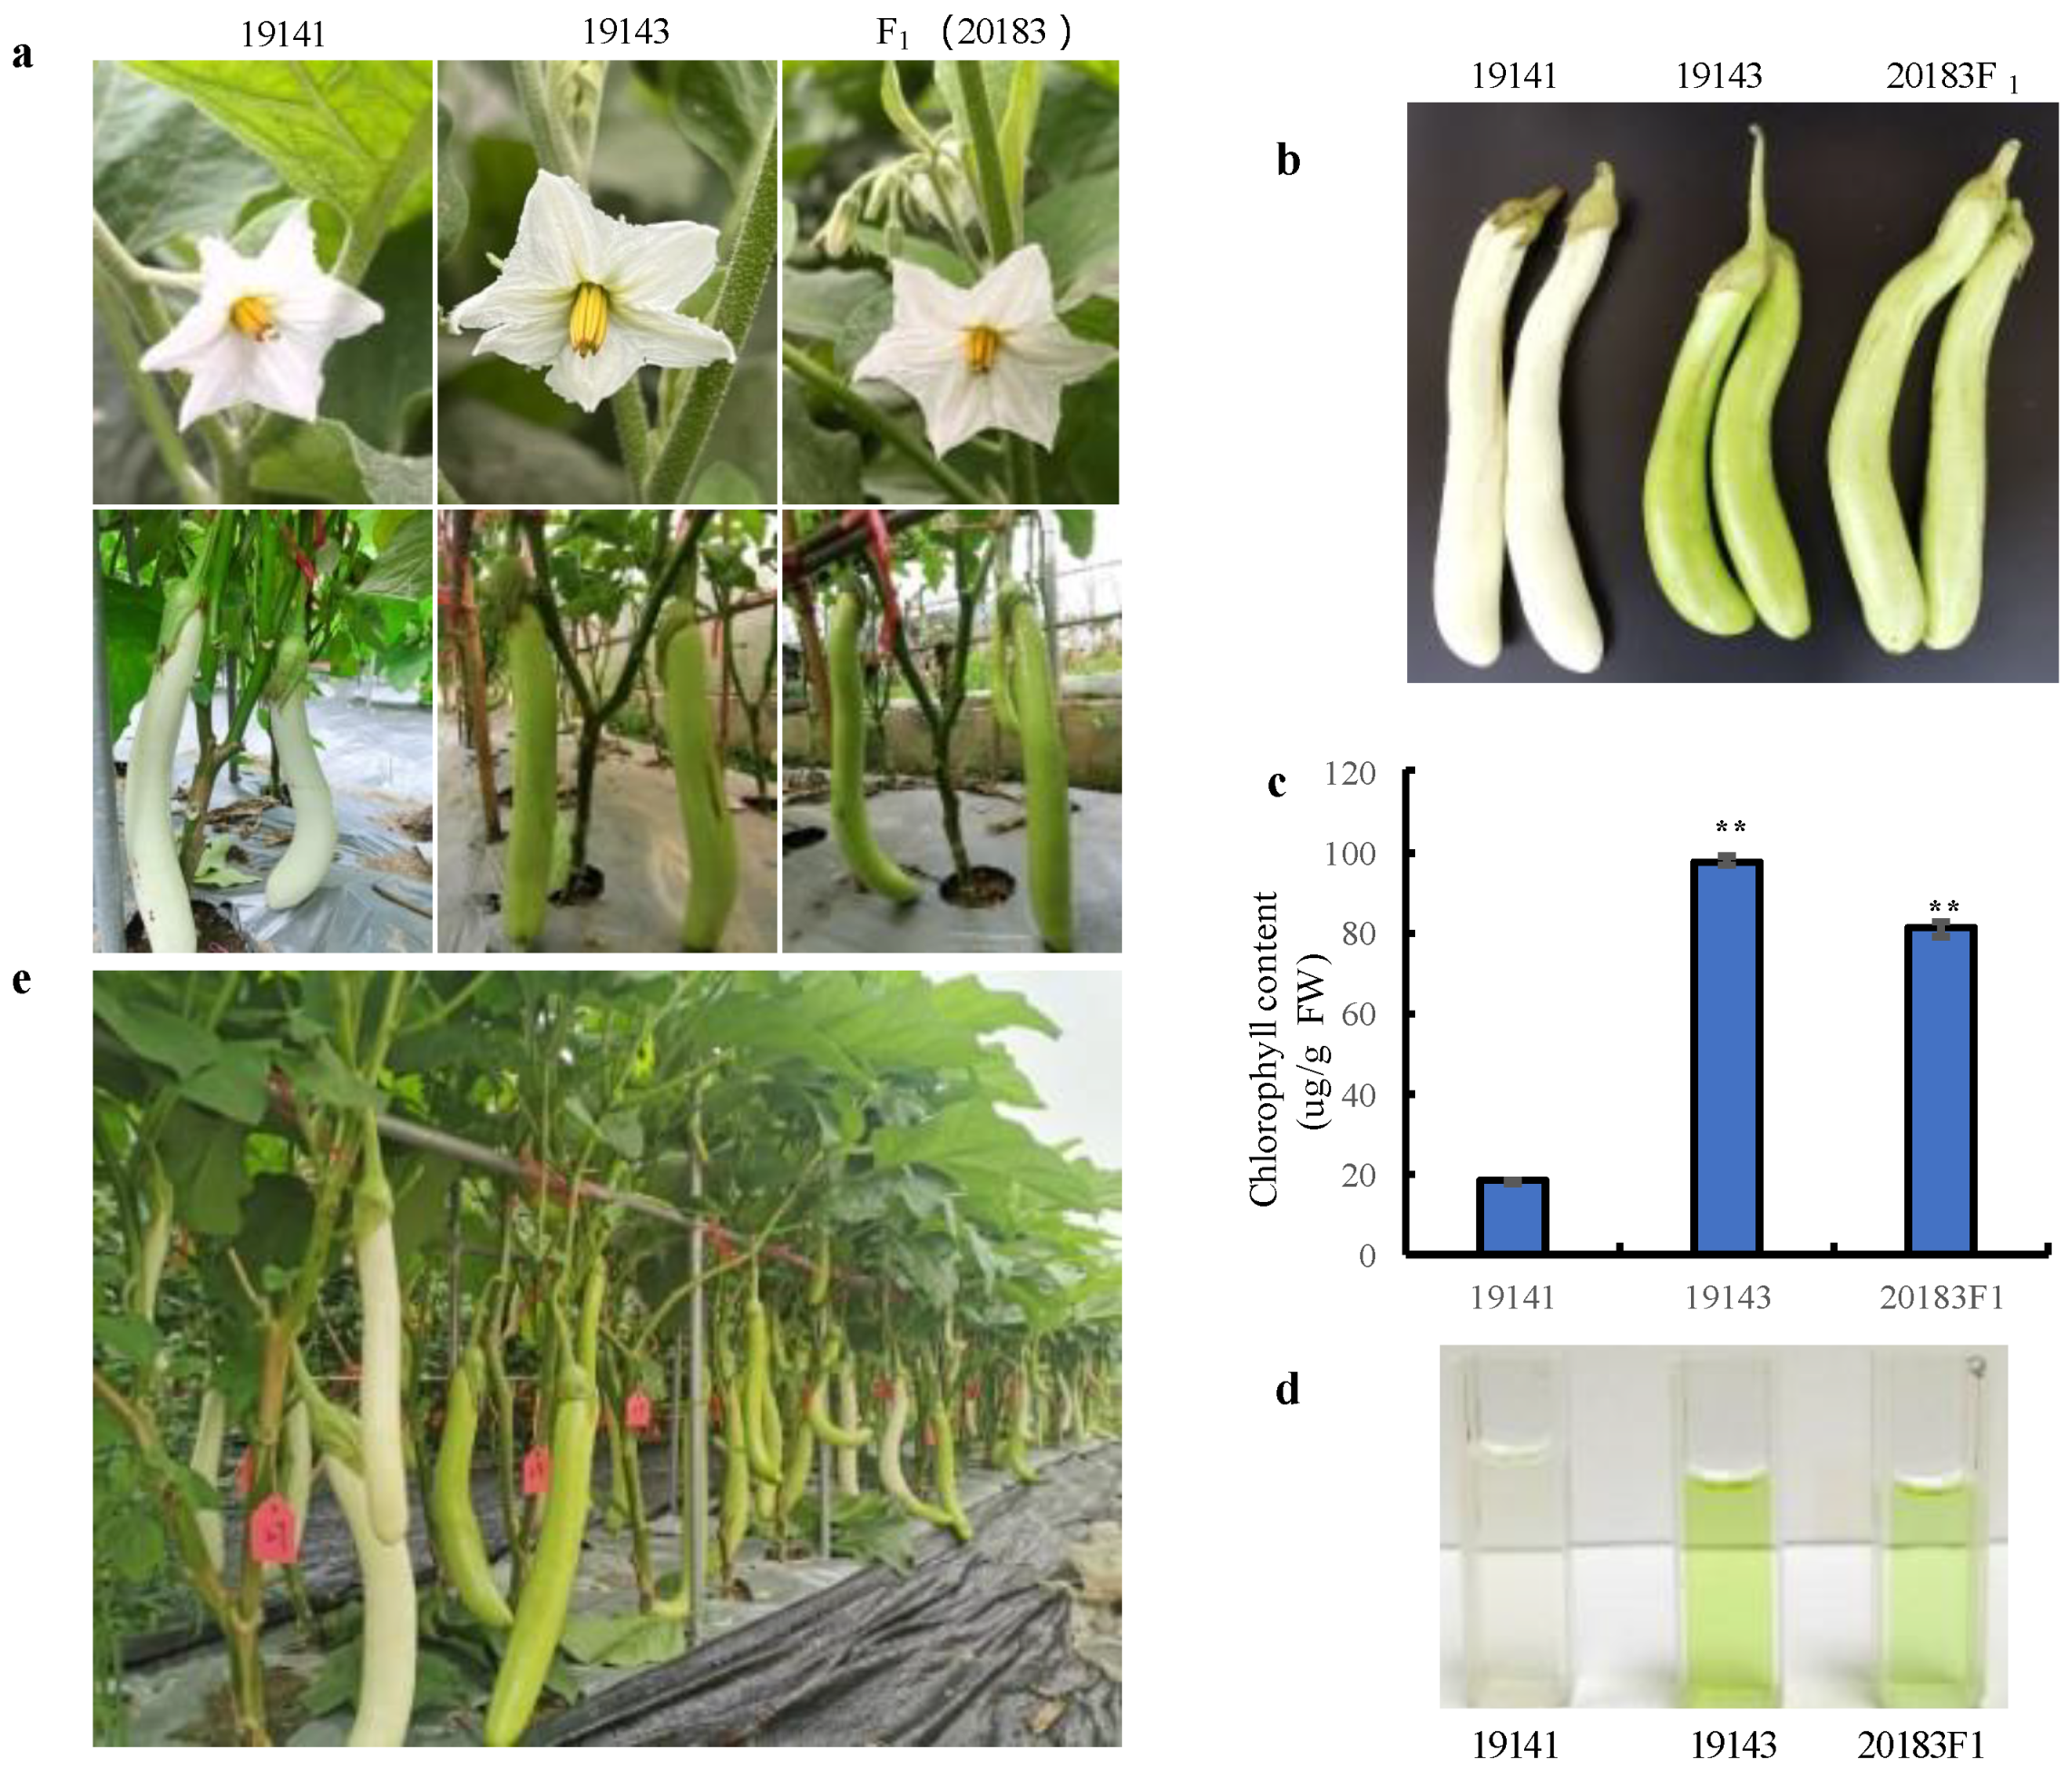
3.1. Inheritance of Peel Color in Eggplant Controlled by Gv1

The F1 (20183) population obtained by crossing the white-peel female 19141 and the green-peel male 19143 has a green-peel color, but slightly lighter than that of 19143 (Figure 1a,b), indicating that the green-peel color trait is dominant over the white-peel color trait. Moreover, we measured the total chlorophyll content in the peel of 19141 and 19143 as well as F1 (20183) (Figure 1c,d). The results showed that the chlorophyll content was 8.00 mg/100 g FW in the F1 plants, whereas it was minimal in 19141 (1.80 mg/100 g FW), and highest in 19143 (9.76 mg/100 g FW). The peel color of the F2 population is separated into green-peel plants and white-peel plants (Figure 1e). In the F2 population, comprising 267 plants, 199 individuals had green peel, and 68 had white peel, and a further χ2 test showed that the segregation ratio conformed to 3:1 (χ2 = 0.03, p = 0.85) (Table 1). All these results indicated that the inheritance of a green-peel color is controlled by a single dominant gene: Gv1.

3.2. Identification of the Candidate Region Associated with Gv1 by Whole Genome Re-Sequencing

Whole genome re-sequencing resulted in a total of 719,331,718 reads from four samples, and 93.24% of the average Q30 ratio. By mapping clean reads on reference genome, it was found that the average re-sequencing depths for 20183W-bulk and 20183G-bulk were 31× and 23×, and the genome coverage ratios for them were 90.58% and 90.42%, respectively (Table S2). According to the reference genome ‘SME_HQ’, a total of 108,985 SNP and 34,788 InDel were identified between the two parents, which showed that the genetic relationship between the two parents was close and the polymorphism difference was less. SNP-index graphs were generated for the 2018W-bulk and 20183G-bulk by plotting the average SNP-index against the position of each sliding window in the reference genome ‘SME_HQ’, then the ΔSNP-index was calculated and plotted against the genome position (Figure 2). According to the expected threshold of 0.667, approximately 7.66 Mb (75.71–83.37 Mb) on chromosome 8 of the ‘SME_HQ’ reference genome exceeded the threshold value and was, thus, considered to be the candidate region associated with Gv1.

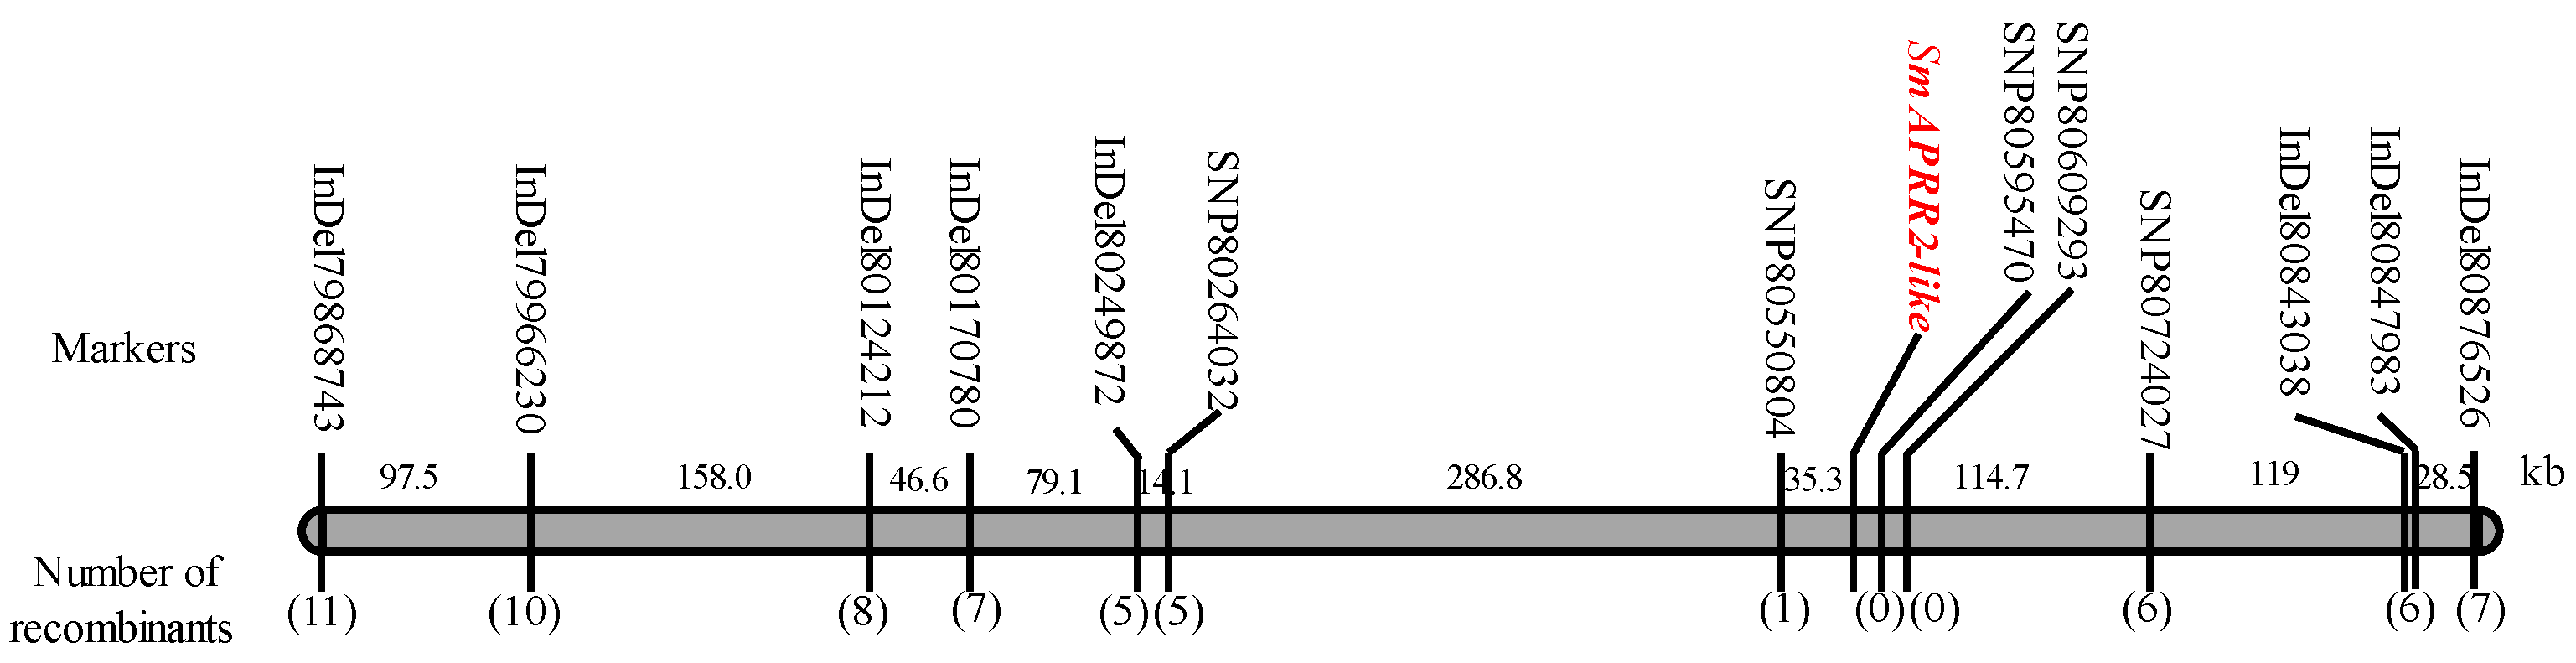
3.3. Fine Mapping of Gv1 with InDel and SNP Markers

According to the preliminary mapping results of Gv1 and the re-sequencing results of two parents, at each end of the associated region, the markers InDel79868743 and InDel80876526 were developed to genotype the 267 F2 individuals, then 19 recombinants were obtained (Table S3). To narrow down the candidate region associated with Gv1, 6 polymorphic InDel markers (Figure S1) and 5 SNP markers (Figure S2) were developed to genotype the 19 recombinants (Figure 3, Table S3). Finally, Gv1 was limited to 173.2 kb of the region between the markers SNP80550804 and SNP80724027 (Figure 3).
  • Annotation and screening of candidate genes
Since the two parents are sister lines, there were few SNP markers between SNP80550804 and SNP80724027. Although there were still seven recombinant plants (Figure 3), the associated region cannot be further narrowed down. A total of 16 candidate genes were annotated in the 173.2 kb of fine mapping interval associated with the Gv1 locus (Table 2).
According to the RNA-Seq data of peels of two parents, the expression difference of the above 16 genes were compared between 19141 and 19143. It was found that three of the above 16 candidate genes were differentially expressed between the green-peel 19143 and the white-peel 19141 (differential gene screening criteria: |log2 (FoldChange)| > 0 and padj ≤ 0.05). Among them, Smechr0802018 encoding a two-component response regulator-like APRR2 (Arabidopsis Pseudo Response Regulator 2, APRR2) was named SmAPRR2-like, which was upregulated in the green-peel 19143, and the other two genes were downregulated (Table 3).
It was confirmed that the relative expression level of SmAPRR2-like in the peels of marketable fruit of 19143 was significantly higher than that in white peel of 19141 by q-PCR analysis (Figure 4), which accorded with the transcriptome sequencing results. It is well-documented that the APRR2-like gene is related to the white fruit mutations, such as in pepper [2] and cucumber [9]. Therefore, SmAPRR2-like was considered as a candidate gene for the Gv1 locus controlling green-peel color in eggplant, which is closer to the two cosegregation markers SNP80595470 and SNP80609293 (Figure 3).

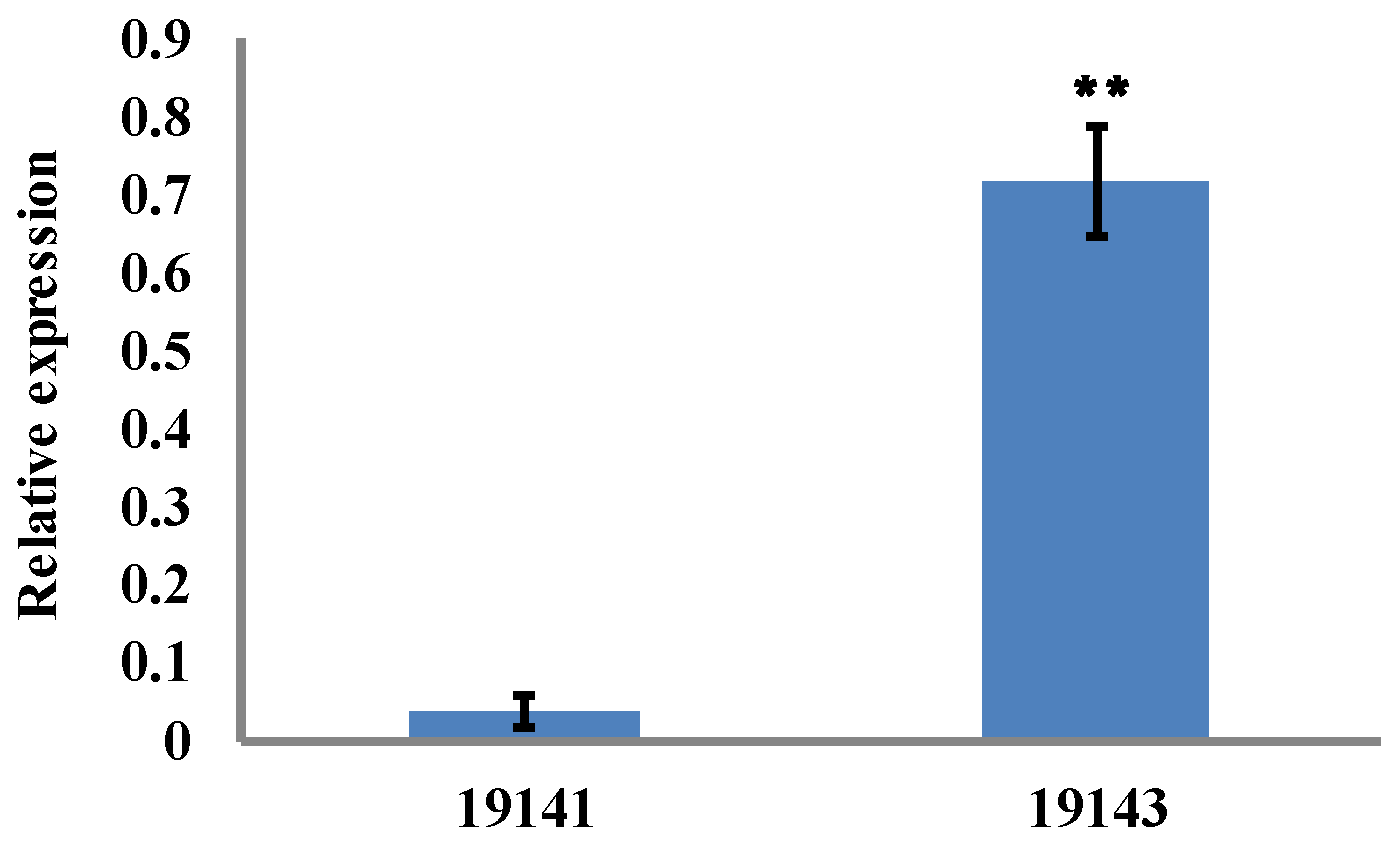
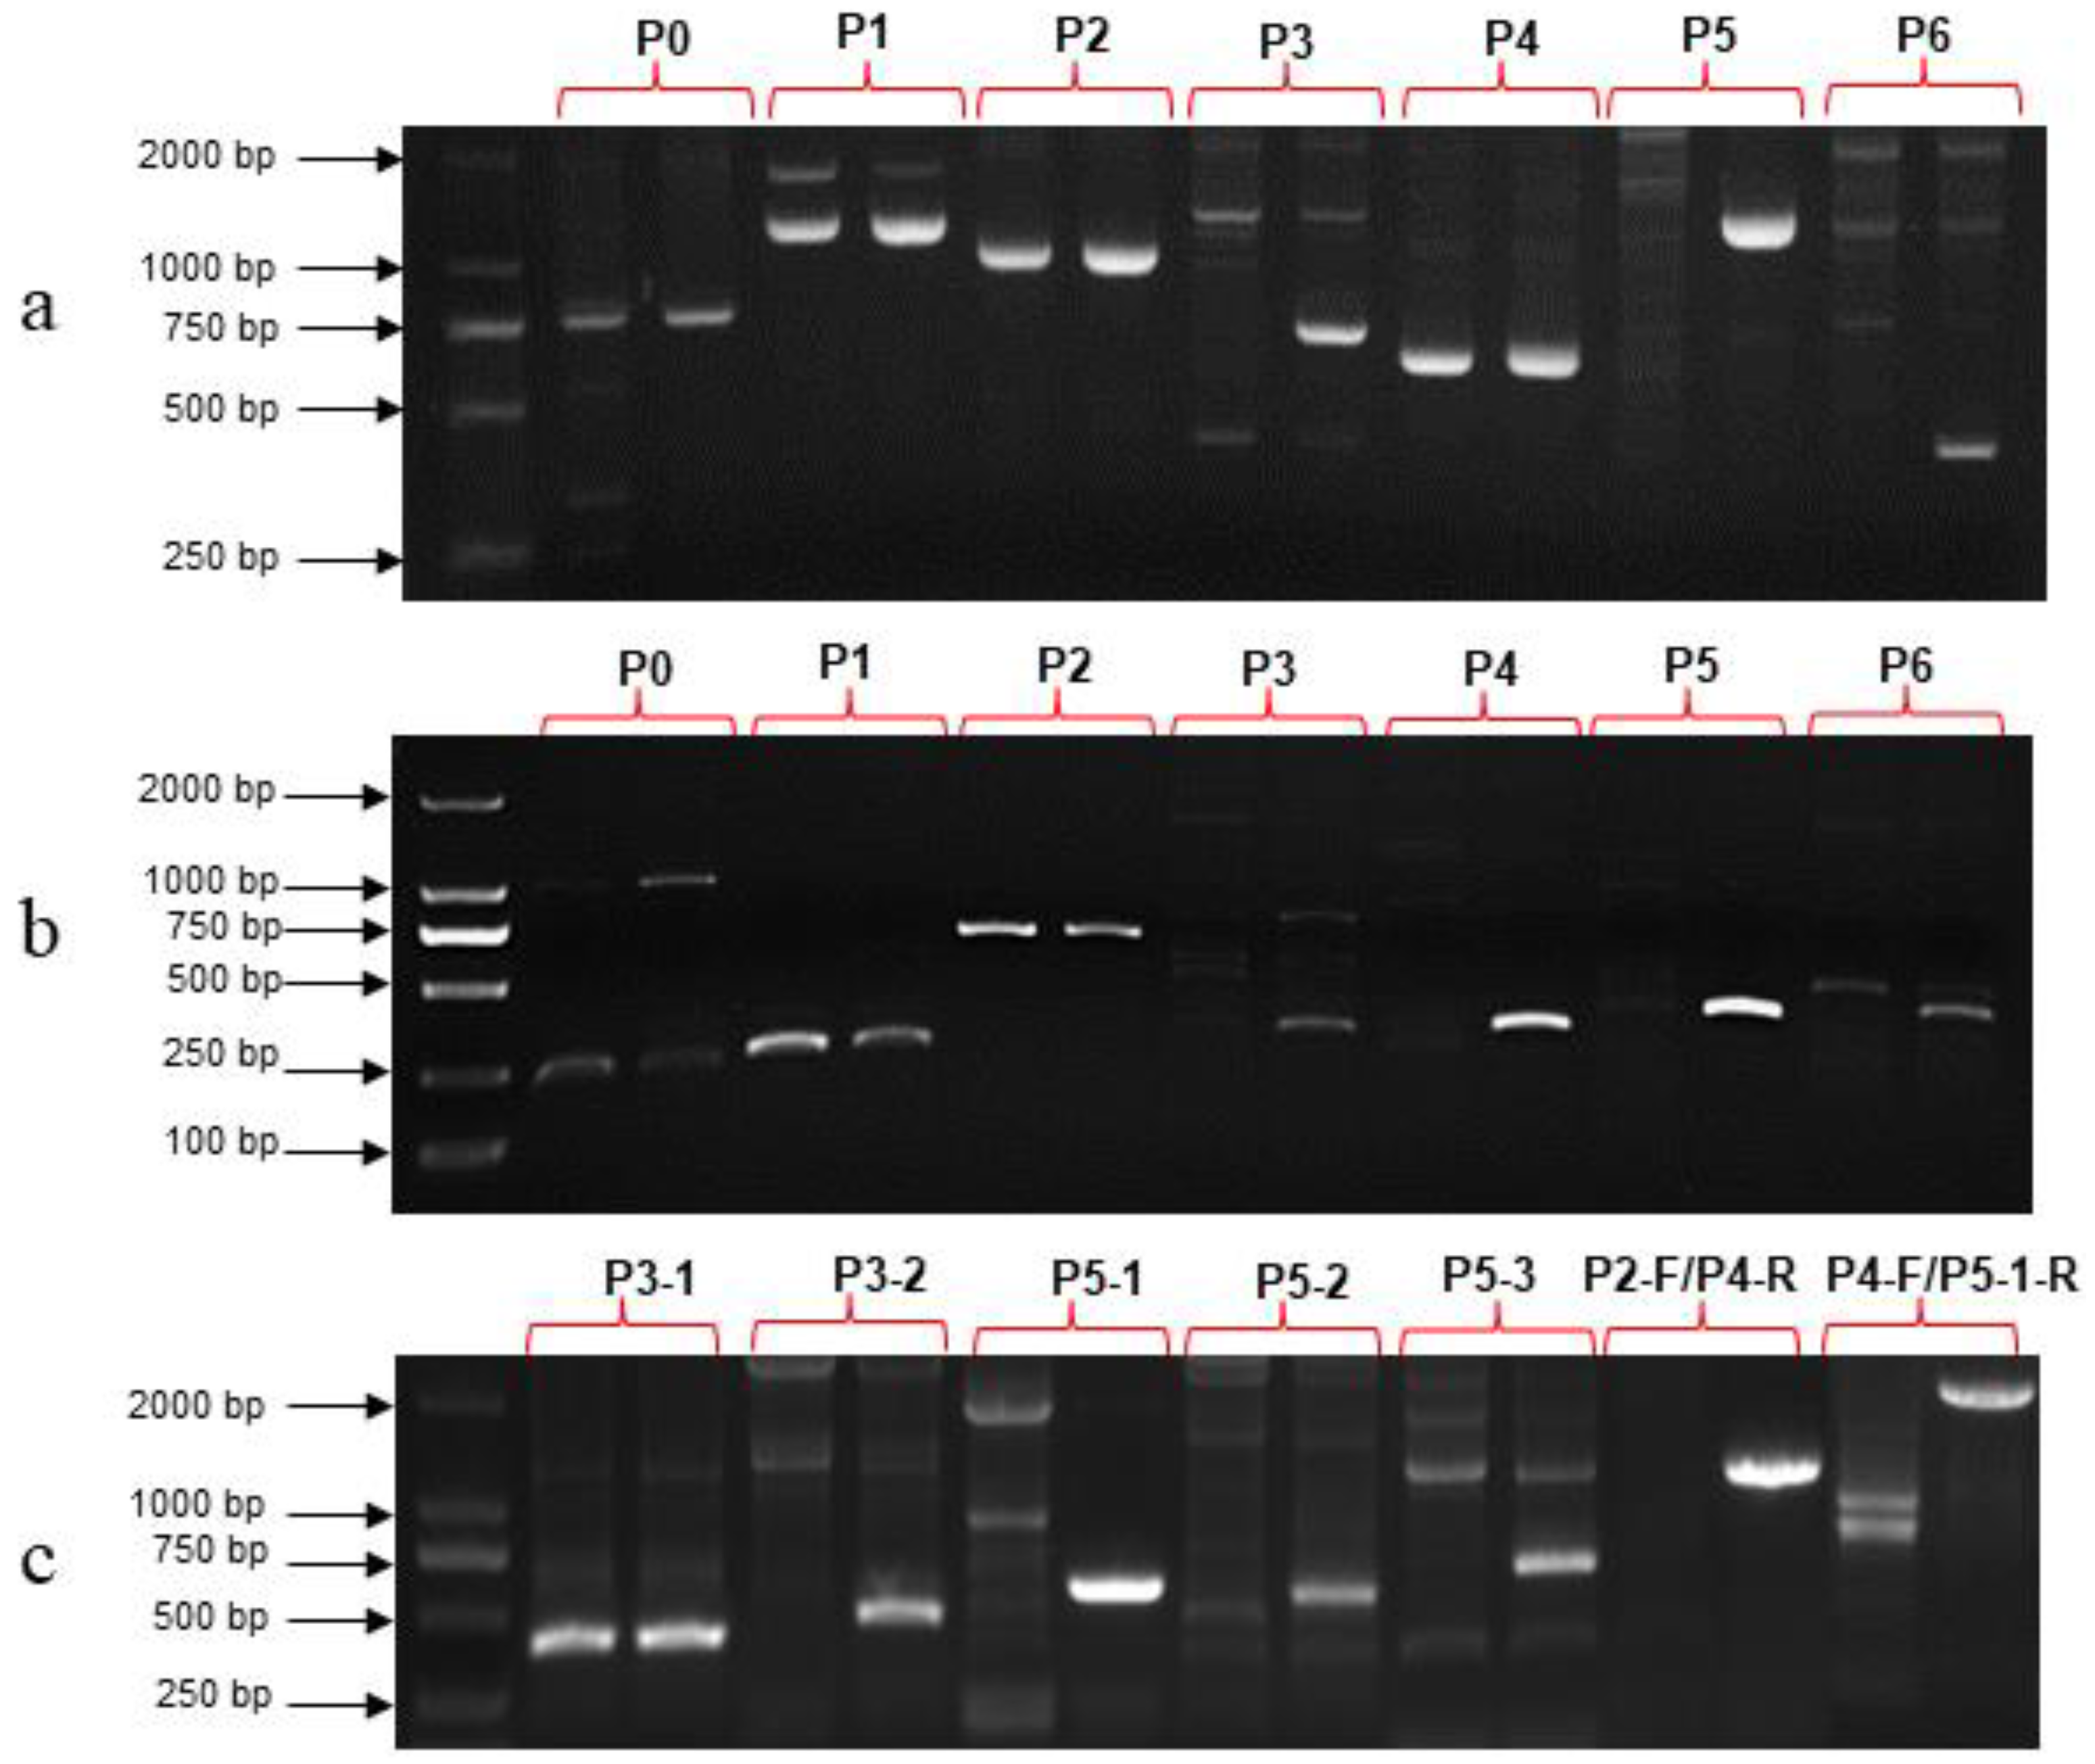
3.4. Cloning of SmAPRR2-like

In the present study, the candidate gene SmAPRR2-like corresponded to the gene Smechr0802018.1 of reference genome ‘SME_HQ’ [15], with 996 bp of CDS, encoding 331 amino acids (AA). According to the domain prediction on the website (http://pfam.xfam.org/search/sequence), it was found that the above Smechr0802018.1 gene only contained the response signal receiving region and did not contain the R2R3 domain similar to MYB transcription factor, so it could not bind the DNA sequence upstream of the promoter to regulate the target gene transcription. Therefore, two other reference genomes, namely, eggplant genome GUIQIE-1 (https://db.cngb.org/cnsa/) [18] and eggplant genome consortium V4: (https://www.sgn.cornell.edu/organism/Solanum_melongena/genome) [19] were used to analyze the size of SmAPRR2-like.
In genome consortium V4, the CDS length of SMEL4_08g005930.1 (SmAPRR2-like) was 1137 bp, encoding 378 amino acids (AA), while in the GUIQIE-1 genome, the CDS length of EGP19168 (SmAPRR2-like) was 1674 bp, encoding 557 AA (Figure 5). The sequence of EGP19168 had the highest coverage and homology with the reported tomato gene SlAPRR2-like.
The cDNA sequence of EGP19168 was used as a reference sequence to design primers (Table S1), and cDNA and DNA of 19141 and 19143 were used as templates for PCR amplification. All seven pairs of primers obtained an amplification product of an expected length when using cDNA and genomic DNA from 19143 as templates (Figure 6a,b). The sequencing and splicing results of the PCR product showed that the SmAPRR2-like sequence of 19143 was very similar with EGP19168 (SmAPRR2-like) annotated in the genome of GUIQIE-1, but with four SNPs (two of which were missense variants) in the exon region and nine SNPs and seven small InDels in the intron region.
Using the 19141 cDNA as a template, primers P0, P1 and P2 had amplification products, while the other four pairs of primers (P3, P4, P5 and P6) had no amplification products (Figure 6b, Table S4). As for 19141 DNA as a template, P3, P5 and P6 primers had no products (Figure 6a, Table S4). The results of sequencing and splicing showed that the sequence of 19141 amplified with primers P0, P1 and P2 was the same as that of 19143, but the length of the amplified product of P4 primer was 623 bp, 13 bp shorter than that of 19143, and their homology was 90.88% (Figure S3). BLAST results showed that the sequence of amplification with P4 primer combination in 19141 was identical to the region from 34,923,339 to 34,923,961 on chromosome four of the reference genome ‘SME_HQ’ and from 34,594,293 to 34,593,693 on chromosome four of the eggplant V4 genome. In order to find out the reason why 19141 DNA could not be amplified using P3 and P5 primer combinations, two pairs of primer combinations P3-1 and P3-2 (Table S1) were designed near the P3 amplification region, and the results showed that only P3-1 had target size fragment amplification (Figure 6c, Table S4). Three pairs of primer combinations—P5-1, P5-2 and P5-3 (Table S1)—were designed in the P5 amplification region, but none of them had amplification products in 19141 (Figure 6c, Table S4). In addition, there was no product via PCR amplification with P2-F/P4-R and P4-F/P5-1-R primer combinations (Figure 6c, Table S4).
Based on the above amplification results, the schematic diagram of the gene structure and primer location was drawn (Figure 7). SmAPRR2-like of 19143 consists of 12 exons and 11 introns, and starting codon ATG is located in exon 2, and its stop codon is TGA (Figure 7a). The length of CDS is 1674 bp, encoding a protein of 557 amino acids. We speculated that the mutation of 19141 was a deletion downstream of exon 7 (Figure 7c).

3.5. Development of Molecular Marker Based on the SmAPRR2-like Gene

The primer combinations P3 and P5 (Table S1) of the SmAPRR2-like gene were used to detect genetic variation in the SmAPRR2-like gene in the 20183 F2 population. The results showed that the primer combination P3 had a 706 bp target fragment amplification in green-peel parent 19143 and F2 individuals with green-peel, but there was no target fragment in white-peel male 19141 and F2 individuals with white peel (Figure S4a,b). Primer combination P5 had 1303 bp target fragment amplification in green-peel parent 19143 and F2 individuals with green-peel; however, there was no target fragment amplification in white-peel female 19141 and F2 individuals with white-peel white fruit color single plants (Figure S4b,c). The coincidence rate between genotype discriminated by the above two primer combinations and peel color phenotype were 100% in the F2 population, which indicated that this marker could be used as a molecular marker for the trait of green-peel color.

3.6. Detection of Genetic Variation in SmAPRR2-like in Natural Population

The primer combination P3 for the SmAPRR2-like gene was used to detect 80 accessions of eggplant with green fruit or white fruit. As could be seen from Figure 8, 706 bp target bands were amplified in all green-peel accessions (Figure 8a,b), 23 of 26 accessions with white-peel had no PCR product (Figure 8c,d, Table S5), and three white-peel accessions, namely, 19142, 21260, and 21393, had PCR product around 700 bp (Figure S5, Table S5). The above three special accessions also had no PCR product around 1300 bp when amplified with P5 primer combination (Figure S5). The above results indicated that there might be other forms of mutations of SmAPRR2-like besides deletion.

3.7. Mining other Genetic Variations of SmAPRR2-like

Further cloning and sequencing of SmAPRR2-like of the above three accessions (19142, 21260 and 21393) (Figure 9a) proved that there was a four-base (CTCC) deletion in the fourth exon of 19142 and 21260 (Figure 9b,c), resulting in a frameshift variant. The peptide length of SmAPRR2-like in 19142 and 21260 was predicted to be truncated from 557 to 101 amino acids. It was also found that there were multiple SNPs and small InDels in 19142 compared with 19143. Compared with green-peel 19143, a C-to-A SNP on the sixth exon led to a premature stop codon in white-peel 21393 (Figure 9d,e), which truncated the peptide length of SmAPRR2-like from 557 to 119 amino acids. The above results indicated that the SmAPRR2-like sequence mainly had three kinds of genetic variations resulting in white-peel mutant in eggplant. The white-fruit eggplant resources could be exploited by molecular markers based on SmAPRR2-like.

4. Discussion

4.1. Mapping of Genes Controlling Green Fruit Color in Edible Fruit and Vegetables

Fruit color is an important appearance quality trait for edible fruit and vegetables. The pigments that determine fruit color mainly include chlorophyll, anthocyanins, carotenoids, etc. The green fruit phenotype is closely related to chlorophyll metabolism. Chlorophyll biosynthesis pathway includes 15 enzymatic reactions involving 27 key enzyme genes [20]. The chlorophyll biosynthesis and chloroplast development are regulated by a variety of transcription factors [21,22,23]. Mutants of chlorophyll biosynthesis and chloroplast development in fruits are mostly related to mutations in transcription factor genes. Two major QTLs, pc8.1 and pc10.1, were identified for controlling the chlorophyll content of pepper fruit. The study found that CaGLK2 (Golden 2-like) was cosegregated with pc10.1 and regulated the chlorophyll content, suggesting that CaGLK2 was the candidate gene of pc10.1 [24]. It was found that the correct assembly position of pc8.1 QTL was on chromosome 1, renamed pc1, and the candidate gene was transcription factor gene LOL1 (LSD ONE LIKE1); the variation in CcLOL1 caused significant changes in fruit chloroplasts, but did not affect the carotene content. Jeong et al. (2020) found that the candidate gene for the C1 locus related to the color of mature pepper fruit was the PRR2 gene, and the mutation of this gene resulted in white fruit color in accession AC08-201 [25]. The gene controlling the cucumber white-green pericarp was mapped within 35.50–37.77 Mb and 38.21–39.71 Mb of cucumber chromosome 3 by BSA-seq [26]. Through RT-qPCR analysis, the gene Csa3G904140 was considered to be a candidate gene for controlling cucumber’s white-green color, which was consistent with the APRR2 gene for controlling the white pericarp mapped by Liu et al. [9].
In our study, the Gv1 locus controlling the green-peel color of eggplant was fine mapped by using the two sister lines and their F2 population composed of 267 individual plants, through whole genome sequencing and BSA technology. Recently, there have been two similar research reports on the mapping and mining of eggplant green fruit color genes: Arrones et al. [27] constructed a MAGIC population and used the GWAS method to preliminarily map the candidate associated region of eggplant green fruit color genes. Then, SmAPRR2 was predicted as a candidate gene by gene annotation in the candidate associated region; Fang et al. [28] eventually mapped the candidate gene regulating rind color between the Indel marker fc84.40 and the CAPS maker fc84.42 within a 20.3 6 Kb based on the initial localization of BSA technology, combined with kompetitive allele-specific PCR (KASP) markers to screen recombinant plants in 2794 F2 individuals, and verified that the candidate gene was SmAPRR2. These three studies used different methodologies, but identified the same candidate gene, SmAPRR2 Like, indicating that this gene plays a highly conserved role in regulating chloroplast development and chlorophyll synthesis in eggplant fruit peel and is crucial for fruit chlorophyll coloring.

4.2. APRR2-like Gene Related to Fruit Color

Arabidopsis Pseudo Response Regulator (APRR) is an important type of regulator in Arabidopsis two-component signal system [29]. Although the amino acid sequence of the APRR receptor domain is highly similar to ARR, it is called a pseudo-response regulator because there is no conservative D-D-K domain. The N terminal of the response regulator (RR) contains a signal receiving region composed of about 110 amino acids, and the C terminal is the output region. In most cases, RR is usually a transcription factor [30], and the output region acts as a DNA binding domain to bind the promoter motif of the target gene to regulate gene transcription.
It has been reported in tomato and pepper [2], cucumber [9] and pepper [25] that the APRR2-like gene is involved in the biosynthesis of chlorophyll and carotenoids in fruit, plastid development and other processes. Through metabolic network interference, it was found that the pigment accumulation in tomato and pepper fruits was linked to the APRR2-like gene on chromosome 8. Overexpression of the APRR2-like gene in tomato increased the number, area and pigment content of plastids, chlorophyll content in young fruits and carotene content in mature fruits [2]. PCR amplification of the APRR2-like gene was carried out in pepper parents whose young fruit color was green and white, respectively [2]. The sequencing results showed that there was a G to A substitution in the parent whose fruit color was green, which led to early termination of the codon and nonsense mutation. The white-peel color gene of cucumber was fine mapped by using the F2 population comprising 9497 individual plants. It was found that the insertion of a single nucleotide on exon 9 of APRR2, a candidate gene related to chlorophyll biosynthesis regulation, led to the early termination codon and the deletion of amino acid residues, which led to the appearance of white-green fruit peel color [9]. The color gene of melon young fruit peel was mapped, and the candidate gene obtained was CmAPRR2 [31]. Sequencing analysis of this gene found that the single base mutation at the 856th base in the light green peel was nonsense mutation, resulting in the loss of most of the Myb DNA binding domain of the transcription factor CmAPRR2, causing abnormal pigment regulation, which led to the appearance of light green peel. CcAPRR2 genes are highly differentiated and affect the content of chlorophyll in young pepper fruits [32].
In the present study, SmAPRR2-like was considered as a candidate gene for the Gv1 locus controlling green-peel color in eggplant, and three types of genetic variation in SmAPRR2-like could lead to the white-peel phenotype; among them, deletion mutation such as in 19141 was the most common mutation type in SmAPRR2-like. Arrones et al. [27] found four types of genetic variation in SmAPRR2.
Above all, the APRR2-like gene plays a conserved role in promoting fruit chlorophyll accumulation and chloroplast development. Through the comparison of the cDNA and DNA sequence amplified by PCR in our study, it is clear that SmAPRR2 Like has 12 exons, and the start codon is located in the second exon, while Arrones et al. [22] reported that SmAPRR2 has 11 exons. So far, studies on model plant tomato have shown that the APRR2 gene is related to fruit chloroplast development, but its potential molecular mechanism is still unclear.

4.3. Development and Utilization of Molecular Markers for Eggplant Peel Color

Eggplant has rich natural variation in fruit color. There are two types of pigments that determine the color of eggplant fruit: anthocyanin and chlorophyll, whose content and proportion jointly determine the color of eggplant peel [1]. As for the relationship between eggplant peel color and anthocyanins, it was found that anthocyanin synthesis in eggplant peel was controlled by three dominant epistatic loci (defined as D, P and, respectively) [33]. In the early stage, the authors constructed a high-density genetic map of eggplant through SLAF sequencing, and mapped the epigenetic genes D and P that control eggplant peel color, proving that SmMYB1 and SmANS are candidate genes for D and P, respectively, and developed corresponding functional markers based on the sequence differences between the two parents [34]. Phenotypically, eggplant varieties with green peel or white peel can easily be distinguished from those with purple-red peel or purple-black peel, but the green or white peel can only be distinguished after fruit setting, and not at the seedling stage. In this study, the SmAPRR2-like gene was screened as a candidate gene for Gv1. Based on the sequence difference of this gene between green and white-peel parents, molecular markers were developed, which is helpful for molecular marker-assisted selection breeding of eggplant fruit color.

5. Conclusions

In the present study, by taking advantage of high-throughput whole genome re-sequencing and BSA, genomic regions containing the Gv1 gene controlling the peel color of eggplant were quickly identified. The Gv1 locus was fine mapped to chromosome 8 within a 173.2 kb interval. Based on gene annotation and expression data, we hypothesized that SmAPRR2-like was the candidate gene for Gv1 locus. SmAPRR2-like underwent mutations in white-peel accessions, resulting in the inhibition of the biosynthesis of chlorophyll and development of chloroplasts. Based on the genetic variation of SmAPRR2-like, dominant molecular makers related to Gv1 were developed. The mapping and identification of the green-peel color gene paved the way towards understanding the role of SmAPRR2-like on the biogenesis and development of chloroplasts, and the functional molecular marker would aid in MAS breeding for peel color of eggplant.

Supplementary Materials

The following are available online at https://www.mdpi.com/article/10.3390/horticulturae9080888/s1. Supplementary tables: Table S1: Primer sequences used for cloning, qRT-PCR, and development of InDel and SNP marker; Table S2: The results of re-sequencing for two parents and two bulks; Table S3: The detection data of the InDel and SNP markers in F2 recombinant plants; Table S4: Amplification and sequencing results of SmAPRR2-like gene; Table S5: Detection results of functional markers based on SmAPRR2 Like in natural population. Supplementary figures: Figure S1: Detection results of InDel markers by PAGE gel electrophoresis; Figure S2: SNP genotyping by PARMS technology; Figure S3: Sequence difference between 19141 and 19143 amplified with P4 primer combination; Figure S4: Amplification results of primer combination P3 and P5 for SmAPRR2-like gene in 20183 F2 population; Figure S5: Amplification results of primer combination P3 and P5 for SmAPRR2-like gene in three special white fruit accessions (19142, 21260 and 21393).

Author Contributions

B.S. conceived the experiment and wrote the manuscript; Z.L. (Zijian Lv) and Q.J. conducted experiments, including sample collection, DNA and RNA extraction, BSA analysis, and qRT-PCR analysis; Z.L. (Zhiliang Li), T.L., Q.Y., C.G. and Z.H. analyzed the data; Y.W. shared the GUIQIE1-1 reference genome. All authors have read and agreed to the published version of the manuscript.

Funding

The present study was financially supported by Major special projects of Guangxi Science and Technology Program, grant number AA22068088-2, the National Natural Science Foundation of China, grant number 31501755; the Department of agriculture and rural areas of Guangdong province of China, grant number 2022KJ110 and 2022KJ106; and the Special fund for scientific innovation strategy-construction of high leveled Academy of Agriculture Science, grant number 202114TD, R2019PY-JX003, R2019PY-QF009, R2021YJ-YB3019.

Data Availability Statement

The data supporting the findings of this study are available from the corresponding author upon reasonable request.

Conflicts of Interest

The authors declare no competing interests.

References

  1. Daunay, M.C.; Aubert, S.; Frary, A.; Doganlar, S.; Lester, R.N.; Barendse, G.; van der Weerden, G.; Hennart, J.W.; Haanstra, J.; Dauphin, F.; et al. Eggplant (Solanum melongena L.) fruit color: Pigments, measurements and genetics. In Proceedings of the 12 Eucarpia Meeting on Genetics and Breeding of Capsicum and Eggplant, Noordwijkerhout, The Netherlands, 17–19 May 2004; pp. 108–116. [Google Scholar]
  2. Pan, Y.; Bradley, G.; Pyke, K.; Ball, G.; Lu, C.; Fray, R.; Marshall, A.; Jayasuta, S.; Baxter, C.; van Wijk, R.; et al. Network inference analysis identifies an APRR2-like gene linked to pigment accumulation in tomato and pepper fruits. Plant Physiol. 2013, 161, 1476–1485. [Google Scholar] [CrossRef] [PubMed] [Green Version]
  3. Dong, S.Y.; Miao, H.; Zhang, S.P.; Liu, M.M.; Wang, Y.; Gu, X.F. Genetic analysis and gene mapping of white fruit skin in cucumber (Cucumis stativus L.). Acta Bota Borea Occident. Sin. 2012, 32, 2177–2181. (In Chinese) [Google Scholar]
  4. Dou, W.W.; Shen, D.; Dong, H.X.; Qiu, Y.; Li, X.X. QTL mapping of immature fruit basal color in Cucumis sativus L. J. Plant Genet. Resour. 2018, 19, 1138–1142. (In Chinese) [Google Scholar] [CrossRef]
  5. Hu, K.L.; Fu, Q.M.; Wang, G.P.; Hu, Z.Q. Study on the heredity of fruit colour of Momordica charantia. China Veg. 2002, 6, 11–12. (In Chinese) [Google Scholar]
  6. Deng, J.Y.; Wang, Z.L.; Wu, P.; Liu, C.A.; Deng, J.L.; Li, L.Z.; Zhou, Y.X. Study on the inheritance of fruit color in wax guard. J. Anhui Agr. Sci. 2015, 43, 40–41. (In Chinese) [Google Scholar]
  7. Behera, T.K.; Satyavati, C.T.; Pal, A. Generation mean analysis of yield related traits and inheritance of fruit colour and surface in bitter gourd. Indian J. Hortic. 2012, 69, 65–69. [Google Scholar]
  8. Sun, X.D.; Shang, Q.M.; Qin, Z.W. Genetic regularity of white skin color and its AFLP markers in cucumber tender fruit. North. Hortic. 2011, 3, 135–140. [Google Scholar]
  9. Liu, H.Q.; Jiao, J.Q.; Liang, X.J.; Liu, J.; Meng, H.W.; Chen, S.X.; Li, Y.H.; Cheng, Z.H. Map-based cloning, identification and characterization of the w gene controlling white immature fruit color in cucumber (Cucumis sativus L.). Theor. Appl. Genet. 2016, 129, 1247–1256. [Google Scholar] [CrossRef] [PubMed]
  10. Tatebe, T. On inheritance of color in Solanum melongena L. Jpn. J. Genet. 1939, 15, 261–271. [Google Scholar] [CrossRef] [Green Version]
  11. Sambandam, C.N. Guide chart for color combinations in hybrid eggplants. Econ. Bot. 1967, 21, 309–311. [Google Scholar] [CrossRef]
  12. Doganlar, S.; Frary, A.; Daunay, M.C.; Leste, R.N.; Tanksley, S.D. Conservation of gene function in the solanaceae as revealed by comparative mapping of domestication traits in eggplant. Genetics 2002, 161, 1713–1726. [Google Scholar] [CrossRef]
  13. Sun, B.J.; Wang, R.; Sun, G.W.; Wang, Y.K.; Li, T.; Gong, C.; Heng, Z.; You, Q.; Li, Z.L. Transcriptome and metabolome integrated analysis of epistatic genetics effects on eggplant peel color. Sci. Agric. Sin. 2022, 55, 3997–4010. (In Chinese) [Google Scholar]
  14. Wang, P.J.; Gu, M.Y.; Shao, S.X.; Chen, X.M.; Hou, B.H.; Ye, N.X.; Zhang, X.T. Changes in Non-Volatile and Volatile Metabolites Associated with Heterosis in Tea Plants (Camellia sinensis). J. Agric. Food Chem. 2022, 70, 3067–3078. [Google Scholar] [CrossRef]
  15. Wei, Q.Z.; Wang, J.L.; Wang, W.H.; Hu, T.H.; Hu, H.J.; Bao, C.L. A high-quality chromosome-level genome assembly reveals genetics for important traits in eggplant. Hortic. Res. 2020, 7, 153. [Google Scholar] [CrossRef] [PubMed]
  16. Mckenna, A.; Hanna, M.E.; Sivachenko, A.; Cibulskis, K.; Kernytsky, A.; Garimella, K.; Altshuler, D.; Gabriel, S.; Daly, M.; Depristo, M.A. The Genome Analysis Toolkit: A MapReduce framework for analyzing next-generation DNA sequencing data. Genome Res. 2010, 20, 1297–1303. [Google Scholar] [CrossRef] [Green Version]
  17. Ye, S.; Dhillon, S.; Ke, Y.X.; Collins, A.R.; Day, I.N.M. An efficient procedure for genotyping single nucleotide polymorphisms. Nucleic Acids Res. 2001, 29, e88. [Google Scholar] [CrossRef] [Green Version]
  18. Li, D.; Qian, J.; Li, W.L.; Yu, N.; Gan, G.Y.; Jiang, Y.Q.; Li, W.J.; Liang, X.Y.; Chen, R.Y.; Mo, Y.C.; et al. A high-quality genome assembly of the eggplant provides insights into the molecular basis of disease resistance and chlorogenic acid synthesis. Mol. Ecol. Resour. 2021, 21, 1274–1286. [Google Scholar] [CrossRef]
  19. Barchi, L.; Rabanus-Wallace, M.T.; Prohens, J.; Toppino, L.; Padmarasu, S.; Portis, E.; Rotino, G.L.; Stein, N.; Lanteri, S.; Giuliano, G. Improved genome assembly and pan-genome provide key insights into eggplant domestication and breeding. Plant J. 2021, 107, 579–596. [Google Scholar] [CrossRef] [PubMed]
  20. Beale, S.I. Green genes gleaned. Trends Plant Sci. 2005, 10, 309–312. [Google Scholar] [CrossRef] [PubMed]
  21. Powell, A.L.; Nguyen, C.V.; Hill, T.; Cheng, K.L.; Figueroa-Balderas, R.; Aktas, H.; Ashrafi, H.; Pons, C.; Fernández-Muñoz, R.; Vicente, A.; et al. Uniform ripening encodes a Golden 2-like transcription factor regulating tomato fruit chloroplast development. Science 2012, 336, 1711–1715. [Google Scholar] [CrossRef] [Green Version]
  22. Jia, T.; Cheng, Y.T.; Khan, I.; Zhao, X.; Gu, T.Y.; Hu, X.Y. Progress on understanding transcriptional regulation of chloroplast development in fleshy fruit. Int. J. Mol. Sci. 2020, 21, 6951. [Google Scholar] [CrossRef] [PubMed]
  23. Shi, Y.; Pang, X.Q.; Liu, W.J.; Wang, R.; Su, D.D.; Gao, Y.S.; Wu, M.B.; Deng, W.; Liu, Y.D.; Li, Z.G. SlZHD17 is involved in the control of chlorophyll and carotenoid metabolism in tomato fruit. Hortic. Res. 2021, 8, 259. [Google Scholar] [CrossRef] [PubMed]
  24. Brand, A.; Borovsky, Y.; Meir, S.; Rogachev, I.; Aharoni, A.; Paran, I. pc8.1, a major QTL for pigment content in pepper fruit, is associated with variation in plastid compartment size. Planta 2012, 235, 579–588. [Google Scholar] [CrossRef] [PubMed]
  25. Jeong, H.B.; Jiang, S.J.; Kang, M.Y.; Kim, S.; Kwon, J.K.; Kang, B.C. Candidate gene analysis reveals that the fruit color locus C1 corresponds to PRR2 in pepper (Capsicum frutescens). Front. Plant Sci. 2020, 11, 399. [Google Scholar] [CrossRef] [PubMed]
  26. Yang, K.; Song, M.F.; Wei, Q.Z.; Wang, J.; Chen, J.F.; Lou, Q.F. Mapping and prediction of candidate gene w controlling white-green fruit color in cucumber. J. Nanjiang Agric. Univ. 2018, 41, 1003–1008. (In Chinese) [Google Scholar]
  27. Arrones, A.; Mangino, G.; Alonso, D.; Plazas, M.; Prohens, J.; Portis, E.; Barchi, L.; Giuliano, G.; Vilanova, S.; Gramazio, P. Mutations in the SmAPRR2 transcription factor suppressing chlorophyll pigmentation in the eggplant fruit peel are key drivers of a diversified colour palette. Front. Plant Sci. 2022, 13, 1025951. [Google Scholar] [CrossRef]
  28. Fang, H.; Wang, P.; Wang, W.; Peng, J.; Zheng, J.; Zhu, G.; Zhong, C.; Yu, W. Fine mapping and identification of SmAPRR2 regulating rind color in eggplant (Solanum melongena L.). Int. J. Mol. Sci. 2023, 24, 3059. [Google Scholar] [CrossRef]
  29. Hwang, I.; Chen, H.C.; Sheen, J. Two-component signal transduction pathways in Arabidopsis. Plant Physiol. 2002, 129, 500–515. [Google Scholar] [CrossRef] [Green Version]
  30. Lohrmann, J.; Harter, K. Plant two-component signaling systems and the role of response regulators. Plant Physiol. 2002, 128, 363–369. [Google Scholar] [CrossRef]
  31. Xu, X.Y.; Shen, J.; Zhang, Y.J.; Li, J.G.; Niu, X.W.; Shou, W.G. Fine mapping of an immature rind color gene GR in melon. Sci. Acricultura Sin. 2021, 54, 3308–3319. [Google Scholar]
  32. Borovsky, Y.; Monsonego, N.; Mohan, V.; Shabtai, S.; Kamara, I.; Faigenboim, A.; Hill, T.; Chen, S.; Stoffel, K.; Van Deynze, A.; et al. The zinc-finger transcription factor CcLOL1 controls chloroplast development and immature pepper fruit color in Capsicum chinense and its function is conserved in tomato. Plant J. 2019, 99, 41–55. [Google Scholar] [CrossRef]
  33. Tigchelaar, E.C.; Janick, J.; Erickson, H.T. The genetics of anthocyanin coloration in eggplant (Solanum melongena L.). Genetics 1968, 60, 475–491. [Google Scholar] [CrossRef]
  34. You, Q.; Li, H.M.; Wu, J.; Li, T.; Wang, Y.K.; Sun, G.W.; Li, Z.L.; Sun, B.J. Mapping and validation of the epistatic D and P genes controlling anthocyanin biosynthesis in the peel of eggplant (Solanum melongena L.) fruit. Hortic. Res. 2023, 10, uhac268. [Google Scholar] [CrossRef]
Figure 1. Phenotypes and chlorophyll content. (a) Flower and fruit phenotypes of the parental lines (19141 and 19143) and their F1 (20183). (b) Phenotype of fruits for chlorophyll content determination. (c) Chlorophyll content of the parental lines 19141 and 19143 and their F1 (20183). (d) Chlorophyll extracting solution of the parental lines (19141 and 19143) and their F1 (20183). (e) The peel color separation in the F2 population. Vertical bars in panel c represent the standard deviation of the mean (n = 3). ** indicates statistically significant differences (p < 0.01).
Horticulturae 09 00888 g001
Figure 2. Distribution graph of the SNP−index and ΔSNP−index of the white-peeled bulk (20183W-bulk) and green-peeled bulk (20183G-bulk). X-axis represents the position of twelve chromosomes of Solanum melongena, and Y-axis represents the SNP-index. The red dashed line indicates the threshold line.
Horticulturae 09 00888 g002
Figure 3. Fine mapping of the Gv1 locus. The value above the bar indicates the physical distances between two neighboring markers, and the numbers in parentheses represent the number of recombinants.
Horticulturae 09 00888 g003
Figure 4. Expression analysis of SmAPRR2-like gene. ** indicates statistically significant differences (p < 0.01).
Horticulturae 09 00888 g004
Figure 5. Alignment results of amino acid sequence of SmAPRR2-like annotated in three reference genomes.
Horticulturae 09 00888 g005
Figure 6. PCR amplification results of SmAPRR2-like gene conducted with different primer combinations. (a) DNA as template. (b) RNA as template. (c) Verification of the mutation site. As for each primer combination, the first lane corresponded to the white-peel 19141, and the second lane corresponded to the green-peel 19143.
Horticulturae 09 00888 g006
Figure 7. Schematic diagram of gene structure and primer location for SmAPRR2-like. (a) Schematic diagram for gene SmAPRR2-like of reference genome. (b) Schematic diagram and primer location for gene SmAPRR2-like of 19143. (c) Schematic diagram and primer location for gene SmAPRR2-like of 19141.
Horticulturae 09 00888 g007
Figure 8. Amplification results of primer combination P3 for SmAPRR2-like gene in natural populations with green and white fruits. (a) PCR amplification results in the accessions with green-peel color. (b) Fruit phenotype of the accessions with green-peel color. (c) PCR amplification results in the accessions with white-peel color. (d) fruit phenotype of the accessions with white fruit color.
Horticulturae 09 00888 g008
Figure 9. The genetic variations in SmAPRR2-like. (a) Fruit phenotype of different accessions. (b,c) sequence comparison of the fourth exon of SmAPRR2-like in different eggplant accessions. (d,e) sequence comparison of the sixth exon of SmAPRR2-like in different eggplant accessions. 19143 represented normal green-peel accessions, 19142 and 21260 represented DNA sequence of white-peel accessions with frameshift variant, and 21393 represented DNA sequence of white-peel accessions with nonsense variant (premature stop codon) at the 120th amino acid.
Horticulturae 09 00888 g009
Table 1. Segregation ratios of green-peel plants and white-peel plants in the parents, F1 (20183) and F2 populations.
PopulationTotal PlantsNumber of Green-Peel PlantsNumber of White-Peel PlantsExpected Ratioχ2a
19141 (female parent)30-30--
19143 (male parent)3030---
F1 (20183)30300--
F2 population267199683:10.03
Chi-square (χ2) goodness-of-fit test was used to confirm the segregation ratio. χ2a > χ20.05 = 3.84 indicates significant difference.
Table 2. Annotation results of candidate genes between SNP80550804 and SNP80724027.
CodeGene NameStart PositionStop PositionNr Annotation
1Smechr080201880,586,14680,589,692PREDICTED: two-component response regulator-like APRR2 [Solanum tuberosum]
2Smechr080201980,620,39580,626,917putative methyltransferase PMT17 [Capsicum chinense]
3Smechr080202080,628,31980,638,536uncharacterized protein LOC107027127 [Solanum pennellii]
4Smechr080202180,641,08880,645,293vacuolar protein sorting-associated protein 55 homolog [Solanum pennellii]
5Smechr080202280,646,22080,653,320PREDICTED: phosphoacetylglucosamine mutase [Solanum tuberosum]
6Smechr080202380,656,12880,656,656PREDICTED: uncharacterized protein LOC102601084 [Solanum tuberosum]
7Smechr080202480,658,61180,661,728transcription factor MAMYB [Solanum lycopersicum]
8Smechr080202580,662,05780,666,530PREDICTED: UMP-CMP kinase 3-like [Solanum tuberosum]
9Smechr080202680,674,67380,688,072SUPPRESSOR OF ABI3-5 isoform X1 [Solanum lycopersicum]
10Smechr080202780,689,08880,691,353PREDICTED: pentatricopeptide repeat-containing protein At3g29230-like [Solanum tuberosum]
11Smechr080202880,692,12880,693,721PREDICTED: expansin-like B1 isoform X1 [Capsicum annuum]
12Smechr080202980,699,20880,706,124PREDICTED: haloacid dehalogenase-like hydrolase domain-containing protein Sgpp isoform X1 [Solanum tuberosum]
13Smechr080203080,702,19580,709,174PREDICTED: dynamin-related protein 1E-like [Solanum tuberosum]
14Smechr080203180,712,56780,714,826PREDICTED: probable purine permease 11 [Solanum tuberosum]
15Smechr080203280,717,65080,719,902PREDICTED: probable purine permease 11 [Solanum tuberosum]
16Smechr080203380,722,93880,729,560PREDICTED: uncharacterized mitochondrial protein ymf11 [Solanum tuberosum]
Table 3. Information on differentially expressed candidate genes between SNP80595470 and SNP80724027.
Gene NameAverage RPKM Value of 19143Average RPKM Value of 19141log2 (Fold Change)Description
Smechr0802018448.695.52.2PREDICTED: two-component response regulator-like APRR2 [Solanum tuberosum]
Smechr080203072.6144.2−1.0PREDICTED: dynamin-related protein 1E-like [Solanum tuberosum]
Smechr0802033149.2221.7−0.6PREDICTED: uncharacterized mitochondrial protein ymf11 [Solanum tuberosum]
Disclaimer/Publisher’s Note: The statements, opinions and data contained in all publications are solely those of the individual author(s) and contributor(s) and not of MDPI and/or the editor(s). MDPI and/or the editor(s) disclaim responsibility for any injury to people or property resulting from any ideas, methods, instructions or products referred to in the content.

