Abstract
Traditional destructive fruit assessment methodologies are currently being replaced by non-destructive alternatives. The Kiwi-Meter™ is promoted as a non-destructive device for assessment of kiwifruit maturation and ripening. In this study, three trials evaluated the feasibility of using the Kiwi-Meter and its IAD™ index data for monitoring maturation, ripening, and quality of Actinidia chinensis var. chinensis ‘Donghong’ kiwifruit. The findings from the trials suggest that the Kiwi-Meter provides a non-destructive tool for measuring the color or chlorophyll content of the outer tissues of ‘Donghong’ kiwifruit. Since the timing of harvest of kiwifruit is not determined solely by flesh color, the utility of the Kiwi-Meter in any wider evaluation of fruit maturation (or ripening or quality) is dependent on there being a strong association between other fruit characteristics of interest with flesh color. The ‘Donghong’ fruit used in this trial degreened fully before ripening and thus the Kiwi-Meter could not provide a measure of maturation, ripening, or fruit quality. It is concluded that the Kiwi-Meter can assess fruit for flesh color, although even for this purpose, it must be considered that the IAD measurement may be limited to only the outer area of the fruit flesh.
1. Introduction
Kiwifruit (Actinidia chinensis) are harvested commercially when fruit are mature but firm and unripe so that they may be stored for up to several months at low temperature to prolong the marketing period [1]. The maturity at harvest in conjunction with postharvest management techniques determine the storage performance, the final fruit quality and ultimately, consumer acceptability [2,3]. Thus, it is important to define fruit maturity precisely and thereby establish appropriate harvest criteria. During and after storage, it is also essential for the exporter, importer, and retailer to be able to evaluate the progression of fruit ripening.
It is common to use aspects of fruit composition, including soluble solids concentration (SSC), firmness, flesh color, and dry matter (DM) as indices with which to time kiwifruit harvest [3]. In New Zealand, DM measured at harvest is used as an indicator of the potential ripe fruit SSC and thereby eating quality [2,4]. DM and SCC are generally determined by destructive methods on a sample of fruit, although there are also non-destructive methods available [5], largely based on visible and near infrared (Vis/NIR) spectroscopy. SSC and DM have long been estimated by Vis/NIR [6,7]. More recently, impact or acoustic impact devices have been used for firmness measurement [8].
A more recent device, also based on Vis/NIR technology, is the DA Meter™ or the Kiwi-Meter™ version, specifically developed for kiwifruit (www.trturoni.com) (accessed on 10 September 2022). These devices generate a DA index (IAD) which is the difference in light absorbance at two defined wavelengths. The IAD is designed to quantify the concentration of chlorophyll in fruit tissues. The Kiwi-Meter has two settings, one for green-fleshed fruit (DAg data) and one for yellow-fleshed fruit (DAr data) [9], although the wavelengths measured have been changed over time and differ slightly between devices: 540, 640, and 800 nm [9] and later 560, 640, and 750 nm [10].
DA Meter data have been reported to correlate well with chlorophyll content, and thus fruit maturity, for a range of fruit including apple [11], peach [12,13], apricot [14], and plum [15], as well as kiwifruit [9,10]. The IAD index is therefore promoted as having potential as a harvest index. The device has also been reported to indicate fruit postharvest quality, storability, and risk of physiological disorders for certain fruit species [16,17,18,19].
For kiwifruit, the Kiwi-Meter has been reported both to provide an assessment of fruit maturity for harvesting and a means of monitoring fruit ripening, in the yellow-fleshed A. chinensis var. chinensis kiwifruit cultivars ‘Jintao’ and Dori (‘AC1536’) [10]. However, in A. chinensis var. chinensis ‘Hort16A’ kiwifruit, flesh color was reported not to be tightly associated with other aspects of fruit composition, including SSC and firmness [20]. In addition, for ‘Hayward’ kiwifruit, a low correlation between Kiwi-Meter IAD values and at-harvest DM has been reported [21], with only limited discrimination for DM-based fruit classes.
In this study, three trials evaluated the feasibility of using Kiwi-Meter IAD data for monitoring fruit maturation, ripening during storage, and the discrimination of postharvest quality after storage. The fruit used in the trials were red-centered A. chinensis var. chinensis ‘Donghong’ kiwifruit, which is the second most widely planted red-fleshed kiwifruit cultivar in China.
2. Materials and Methods
2.1. Fruit Materials
For all trials, Actinidia chinensis var. chinensis ‘Donghong’ fruit were harvested from 4-year-old vines growing in several blocks on a commercially managed orchard at Danjiangkou City, Hubei Province, China (32°48′ N, 111°12′ E). Fruit were transported to the laboratory of Wuhan Botanical Garden, Chinese Academy of Sciences at ambient temperature, arriving within 24 h of harvest.
2.2. Trials
2.2.1. Trial 1: Fruit Maturity Monitoring
Fruit were harvested weekly from the same 16 vines in a single block of the commercially managed orchard for the period 119 (11 August 2020) to 182 (13 October 2020) days after full bloom (DAFB). Normal commercial harvest would occur at approximately 150 DAFB. On arrival at the laboratory, 20 individual fruit were measured non-destructively by the Kiwi-Meter (IAD index DAr value) and then measured destructively for firmness, flesh color, SSC, and DM (see Section 2.3). After destructive measurement, the skin and outer pericarp tissue to a depth of approximately 1 mm was sampled from five fruit. The sampled tissue was pooled, frozen in liquid nitrogen, and stored at −70 °C until assayed for chlorophyll content. Three biological replicates, each of five fruit, were prepared.
2.2.2. Trial 2: Fruit Ripening during Storage
Fruit were harvested from three distinct blocks of vines (maturity areas) in the commercially managed orchard on 8 September 2020, transported to WBG and cured in the shade for 2 days. Immediately on arrival at the laboratory, 20 fruit for each maturity area were measured by the Kiwi-Meter and then for firmness, SSC, and DM (see Section 2.3). At harvest, the average firmness, SSC, and DM were 53.7 N, 7.8%, and 18.0%, respectively. Fruit of uniform shape and size were packed into crates (about 100 fruit per crate) with polyethylene bags, and the crates were placed into a cold room at 5 °C for 5 days and then stored at 1 °C for up to 12 weeks from harvest. Fifteen fruit (5 fruit from each of the 3 crates) for each maturity area were measured by the Kiwi-Meter and then for firmness and SSC after 2, 4, 6, 8, and 12 weeks of storage.
2.2.3. Trial 3: Discrimination of Fruit Quality after Storage
Fruit were harvested from a single block of vines from the commercially managed orchard on 18 September 2020. Immediately on arrival at the laboratory, 20 fruit were randomly selected for fruit maturity characterization and measured individually for firmness, SSC, and DM (see Section 2.3). At harvest, the average firmness, SSC, and DM were 49.4 N, 12.0%, and 19.2%, respectively. The remaining fruit were packed into single layer trays with polyliners and stored in a cool room at 0.5 °C. In all packs, each fruit was numbered and measured by the Kiwi-Meter after 0, 4, 9, and 12 weeks of storage. After 12 weeks of storage, an additional sample was measured by the Kiwi-Meter and for firmness and SSC after 7 days at 20 °C. At this time, the fruit were fully ripe (on average 3.1 N firmness), and the SSC and DM values are referred to as the ripe fruit SSC (rSSC) and DM (rDM). The rSSC and rDM values were related to the at-harvest IAD data split into six classes (Class I (IAD > 1.0)–Class VI (IAD < 0.6). Any rotten fruit were removed during storage and at the end of shelf life at 20 °C, and thus data from 152 fruit were available for analysis.
2.3. Destructive Fruit Measurement
Fruit firmness was measured using a Fruit Texture Analyzer (FTA, Güss model GS15, Strand, South Africa) fitted with a 7.9-mm penetrometer probe that was driven into the fruit, after removal of skin and flesh, to a depth of approximately 1 mm at 5 mm s−1 to a displacement of 7.9 mm after triggering at 0.49 N [20]. The maximum force was recorded as the firmness value in kgf, which was converted to N where 1 kgf = 9.81 N. Firmness was measured twice at the equator of each fruit at positions 90° to each other, and these values averaged to give a fruit firmness value. Flesh color was measured as the hue value (°h) with a CR400 Chroma Meter (Konica Minolta, Tokyo, Japan) after removal of skin and flesh to a depth of approximately 2 mm [20]. Flesh color was measured twice at the equator of the fruit, with two measurements taken at positions 90° to each other and their average recorded as the fruit flesh color value. SSC was measured with a digital refractometer (PAL-1, Atago, Tokyo, Japan) for a sample of juice from the stylar and stem end of the fruit combined. To measure DM, a transverse 2-mm slice from the equator of the fruit was weighed, dried at 65 °C for approximately 24 h, and weighed again. DM was calculated as the dried weight as a percentage of the initial fresh weight of the slice.
2.4. Kiwi-Meter IAD Index Measurement
A portable hand-held Kiwi-Meter instrument (T.R. Turoni Inc., Forlì, Italy, Figure 1) was used to measure the IAD index (DAr data). This parameter is recommended for yellow-fleshed kiwifruit rather than the IAD index (DAg) value that is recommended for green-fleshed kiwifruit [9]. A preliminary check of the data showed the DAr value to be better associated with flesh color than the DAg value (data not shown). The IAD index was measured twice at the equator of the fruit with readings at positions 90° to each other, and their average represented as the IAD value for the fruit. Areas chosen for measurement excluded any blemished or dark areas of skin.
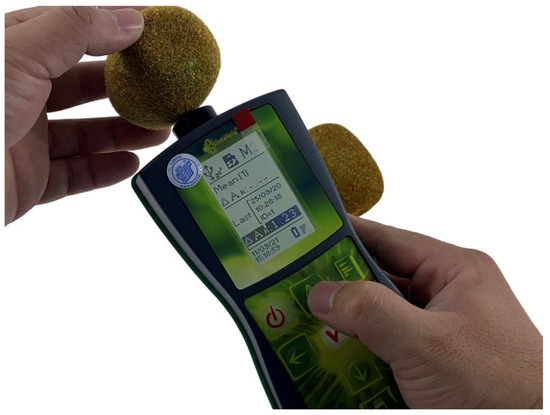
Figure 1.
The Kiwi-Meter instrument (T.R. Turoni Inc., Italy) with kiwifruit model used for IAD data measurement.
2.5. Chlorophyll Content Measurement
The frozen tissue samples were ground into a fine powder in liquid nitrogen, and 95% ethanol was used to extract and quantify chlorophyll pigments as previously described [22] with minor modification. In brief, approximately 1.000 g of sample powder accurately known was extracted with 10 mL 95% ethanol and 200 mg calcium carbonate (CaCO3) for 30 min at 4 °C in the dark with occasional shaking, and then centrifuged at 1000× g for 15 min at 4 °C. The supernatant was removed, and absorbance was measured at 649 nm and 664 nm with a Lambda 35 UV/VIS spectrophotometer (Perkin Elmer, Waltham, MA, USA). The amounts of chlorophyll a (Chl a), chlorophyll b (Chl b) and total chlorophyll (Total Chl) were calculated by the following formulas: Chl a = 13.36 × A664 − 5.19 × A649; Chl b = 27.43 × A649 − 8.12 × A664; Total Chl = Chl a + Chl b [22].
2.6. Data Analysis
Data are presented graphically as the sample means and standard error of means (sem). Significant differences among samples were determined by analysis of variance with separation of means by Fisher’s multiple comparison test at p ≤ 0.05. Graphics and statistical analyses were performed using Origin 2021 software (OriginLab Corporation, Northampton, MA, USA).
3. Results
3.1. Trial 1: Evaluation of Fruit Maturity
There were marked changes in fruit flesh color, SSC, and firmness over the period monitored from 119 to 182 DAFB (Figure 2A). Flesh color declined from ~108 °h to ~100 °h, with the color decreasing below 103 °h at ~140 DAFB. This change in flesh color was reflected in a change in IAD from ~1.2 to 0.6 (Figure 2B), although the patterns of change differed, with a slower rate of change in IAD than flesh color over the period from 126 to 161 DAFB. In addition, the final flattening of the flesh color curve after 161 DAFB did not occur until 168 DAFB for the IAD data. While there was an overall decline in chlorophyll content between the start and end of monitoring (Figure 2C), the pattern of change was inconsistent and not tightly linked to the change in flesh color (°h) or IAD values. The SSC of the fruit showed little change between 6 and 6.5% at the start of monitoring, but then increased almost linearly from 133 DAFB to reach ~14% at the end of monitoring (182 DAFB; Figure 2A). Fruit firmness declined slowly from ~60 N at 119 DAFB to ~50 N at 161 DAFB (Figure 2A). Thereafter, there was a rapid decline in fruit firmness to ~10 N at 182 DAFB.
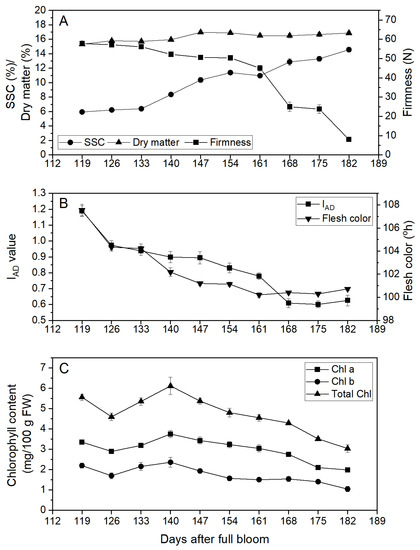
Figure 2.
Maturation of Actinidia chinensis var. chinensis ‘Donghong’ fruit in 2020. (A) Fruit firmness, soluble solids content (SSC), and dry matter (DM); (B) Kiwi-Meter IAD index and flesh color; and (C) chlorophyll a (Chl a), chlorophyll b (Chl b), and total chlorophyll content. Values are means of 20 fruit (±s.e.m.), except chlorophyll data, for which n = 3 (±s.e.m.).
The associations between IAD index and firmness, SSC, DM, flesh color, and Total Chl based on sample average data or individual fruit data from the harvest period 119 to 182 DAFB are given as Pearson correlation coefficients (r) in Figure 3. Overall, the correlation coefficients for the averaged data were stronger than for the individual fruit data: r = 0.87 and r = 0.64 for firmness, r = −0.91 and r = −0.68 for SSC, r = −0.75 and r = −0.23 for DM and r = 0.89 and r = 0.75 for flesh color, respectively (Figure 3). Only averaged data were available for the IAD and Total Chl correlation (r = 0.76) as each replicate for Total Chl comprised five fruit. Similar correlation coefficients were obtained for IAD with Chl a and Chl b as for Total Chl (data not presented). The reduced Pearson r values for the individual fruit data are indicative of the variability in association between the IAD value and the other more traditional fruit characteristics used to monitor maturation. For the association between IAD and firmness, it appears that the relationship is not linear, but rather occurs in two phases, above or below 40 N. This break point at 40 N was coincident with full degreening of the fruit flesh.
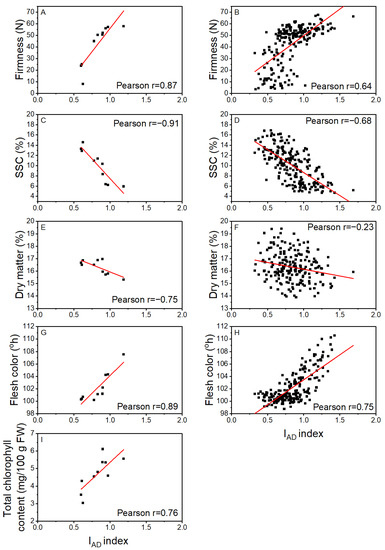
Figure 3.
Correlation coefficients for the relationships based on sample average (A,C,E,G,I) and individual fruit (B,D,F,H) data for at-harvest measurements of IAD and: fruit firmness (A,B), soluble solids content (SSC) (C,D), dry matter (E,F), flesh color (G,H). and total chlorophyll (I) for Actinidia chinensis var. chinensis ‘Donghong’ fruit harvested between 119 and 182 days after full bloom in 2020. The red lines are the fitted linear regressions, with Pearson correlation coefficients provided. Sample sizes, n = 10 for averages, and 200 for individual fruit.
If an IAD index equal to 1.0 is set as the threshold value for ‘Donghong’ harvest criteria, the predicted flesh color, firmness, and SSC would be 103.5 °h, 50.0 N, and 8.6%, respectively, based on the linear equations from averaged data. However, if the data are investigated based on individual fruit data, the degree of variability becomes apparent, between ~104 and 100 °h for flesh color, between ~39 and 59 N for firmness, and between 5 and 12% for SSC (Figure 3).
3.2. Trial 2: Characterization of Fruit Ripening Stages and IAD Index during Cold Storage
During storage, there were marked changes in the IAD, firmness, and SSC of the fruit (Figure 4). Both IAD and firmness declined rapidly over the first 4 weeks of storage, IAD from 0.93 to 0.71 (Figure 4A), and firmness from ~54 N to ~10 N (Figure 4B). Thereafter there was only a slow further decrease in both parameters for the remainder of the storage period. SSC increased rapidly from ~8 to 12% over the first 2 weeks in storage, followed by a slower rate of increase until a maximum of ~15% was reached after 8 weeks (Figure 4C). While the averaged data for all three parameters gave smooth changes through storage, the individual maturity area data for IAD were more variable and inconsistent in the magnitude of change, whereas the individual maturity area data for firmness and SSC differed little from the average (Figure 4).
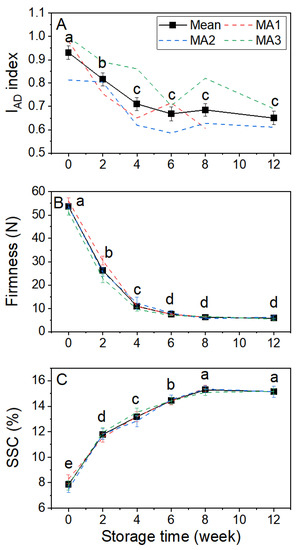
Figure 4.
The change in IAD index (A), firmness (B), and soluble solids content (SSC, (C)) of Actinidia chinensis var. chinensis ‘Donghong’ fruit during storage at 1 °C for 12 weeks. Bold lines and symbols are the mean of three maturity areas (±s.e.m.), dashed lines the individual maturity areas (MA) for which n = 60 at harvest and 45 at other times. Values not sharing a common letter differ at p = 0.05.
Correlations between IAD index and firmness and SSC based on sample average data or individual fruit data from all six storage assessments are given in Figure 5. Overall, the correlation coefficients for the averaged data were stronger than for the individual fruit data: r = 0.98 and r = 0.48 for firmness and r = −0.98 and r = −0.49 for SSC, respectively. The individual fruit data illustrate that for any given IAD value, there can be a wide range of firmness or SSC values. Hence, if the IAD index was set to 0.7, the predicted fruit firmness and SSC would be approximately 10 N and 14%, respectively, from the averaged relationships, but from the individual fruit data, it may be between 5 and 60 N or between 8 and 17% SSC (Figure 5).
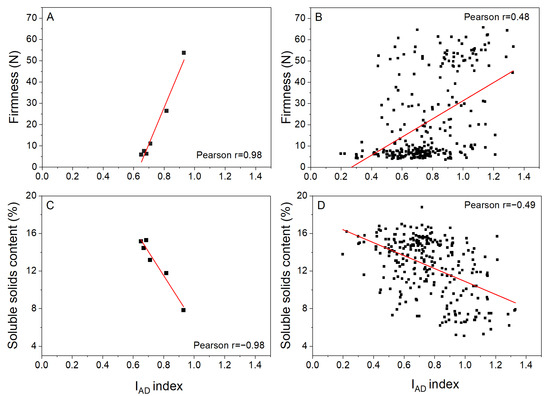
Figure 5.
Associations between IAD and fruit firmness (A,B) and soluble solids content (C,D) for Actinidia chinensis var. chinensis ‘Donghong’ fruit from 3 maturity areas stored for 0, 2, 4, 6, 8, and 12 weeks at 1 °C. Associations are based on sample averages for three maturity areas (A,C) and individual fruit (B,D) data. At each assessment, 15 fruit were measured per maturity area.
3.3. Trial 3: Discrimination of Fruit Postharvest Quality Based on IAD Index after Cold Storage
The average IAD value gradually decreased from 0.87 at harvest to 0.65 after 12 weeks of storage, with a further sharp decline to 0.58 after 7 days at 20 °C (Figure 6A). The correlations of IAD index with rSSC and rDM after shelf-life were small at r = −0.27 for rSSC (Figure 6B) and r = −0.16 for rDM (Figure 6C). These correlation coefficients suggest that the IAD index value had little ability to discriminate accurately rSSC or rDM. However, rSSC was strongly correlated with rDM at r = 0.86 (data not shown).
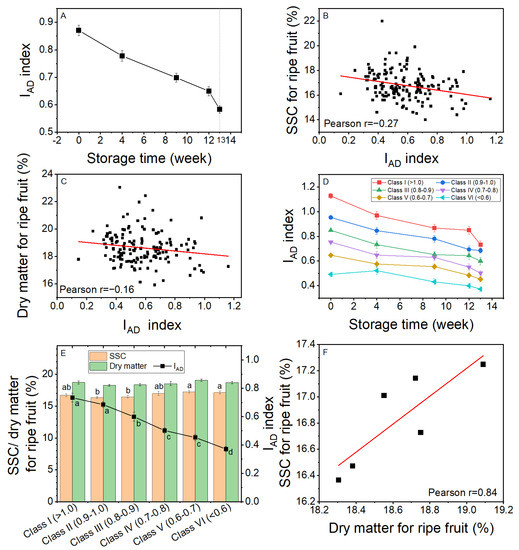
Figure 6.
The change in the Kiwi-Meter IAD index value of Actinidia chinensis var. chinensis ‘Donghong’ fruit during storage at 0.5 °C for 12 weeks and 7 days at 20 °C and the association between IAD and ripe fruit soluble solids content (rSSC) and ripe fruit dry matter (rDM). (A) The change in IAD index with storage, n = 152 ±s.e.m. (B) The correlation between IAD and rSSC, n = 152. (C) The correlation between IAD and rDM, n = 152. (D) The change in IAD index during storage based on the IAD classification at harvest (Class I (>1.0)–Class VI (<0.6)), n = 20–32, ±s.e.m. (E) The IAD index, rSSC, and rDM of fruit in Class I to Class VI, n = 20–32, ±s.e.m. Means not sharing a common letter differ at p = 0.05. There were no differences in DM among classes. (F) The correlation between average rSSC and average rDM for fruit in six IAD classes.
Individual fruit in the sample were divided into six classes based on IAD values at harvest: Class I (>1.0), II (0.9–1.0), III (0.8–0.9), IV (0.7–0.8), V (0.6–0.7), and VI (<0.6), and the IAD monitored during storage (Figure 6D). The IAD for all classes of fruit showed a similar pattern, declining gradually throughout storage, although by the end of shelf assessment there was a smaller difference between classes than there was at the start of storage (Figure 6D). After 7 days at 20 °C, when fruit were ripe, the average values of IAD, rSSC and rDM for the different classes were compared (Figure 6E). While the classes of fruit maintained some of the IAD differences that were used for selection at the start of storage, there were no statistically significant differences in rDM of the fruit of the different classes, which were between 18.3 and 19.1% for rDM (Figure 6E). For rSSC, there were statistically identifiable (p = 0.05) differences between Class II/Class III fruit and Class V/Class VI fruit (Figure 6E) and an overall correlation of r = −0.80 between the ripe fruit IAD and rSSC (correlation not shown). However, fruit from Class I and Class IV did not differ significantly from any other classes of fruit. Overall, for the six classes of fruit, there was a strong correlation between average rSSC and average rDM (Figure 6F).
4. Discussion
The findings from the three trials shed new light on the utility of the Kiwi-Meter for the evaluation of different aspects of ‘Donghong’ kiwifruit. During the extended maturation period evaluated, the IAD value correlated well with the fruit flesh color, SSC, and firmness, but not DM. During storage, there were good correlations between IAD and the average firmness and SSC values as the fruit ripened. However, the strength of these correlations was reduced when individual fruit data were investigated. Finally, for rSSC and rDM, the correlations between IAD and these parameters were low. These findings are discussed below in the light of the measurement technique, the biology of kiwifruit and previous findings for the Kiwi-Meter on other kiwifruit and the DA-Meter on other fruit species.
The wavelengths used for the Kiwi-Meter measurement are selected as being close to the chlorophyll-a absorbance peak [9] and therefore designed to quantify the amount of chlorophyll at the fruit surface. Consequently, the meter functions well in assessing fruit color, particularly for those fruit in which the external color (skin or peel color) changes during maturation. On this basis, IAD may be indicative of fruit maturation and may have value as a harvest index. High correlation values for IAD were found with the chlorophyll content or flesh color of ‘Dori’ and ‘Jintao’ kiwifruit [9,10] as well as for apple [11], peach [12,13], and in some plum cultivars [15]. To this extent, the close association between IAD and flesh color measurement of ‘Donghong’ agrees with these previous publications. However, an important aspect of kiwifruit is that, depending on the cultivar, the degree of degreening that occurs may be variable. ‘Donghong’ is an example of a kiwifruit that degreens fully in the outer pericarp, leaving a yellow flesh with red pigmentation limited to the inner pericarp tissues [23]. The method of removing approximately 2 mm of skin and flesh to measure the color of kiwifruit flesh was first implemented for ‘Hort16A’ kiwifruit and was designed specifically to avoid the outer cell layers just under the skin, as this is the last area of the fruit to degreen; degreening starts from the center of the fruit. This pattern of flesh color change can be seen in other fruit such as melons. The method was designed to check the fruit specifically for degreening as a harvest aid. Yet, the outer ~2 mm of fruit flesh and skin is the very same area measured by the Kiwi-Meter and most likely explains the difference in the maturation patterns for IAD and flesh color, with the change in IAD being slightly delayed relative to flesh color. This would be expected if it measured the last region to degreen.
Extrapolation of the data to suggest it is possible to assess fruit maturity using the Kiwi-Meter is dependent on which fruit characteristics are important for maturation. For the Kiwi-Meter to be of use, there must be a tight association between the IAD values and these characteristics, which include SSC and firmness. With the large change in IAD, SSC and firmness over the period monitored, it is not surprising to find relatively strong associations among them. However, these associations are dependent on the cultivar and growing region. It was observed several years ago that there was no tight association between flesh color and SSC or firmness in ‘Hort16A’ kiwifruit, with the individual characteristics being affected by environmental conditions [20]. For ‘Hort16A’ fruit, it is possible to have fully degreened unripe (firm with low SSC) fruit, or fully ripe (soft with high SSC) green-fleshed fruit depending on the growing region. For the ‘Donghong’ fruit in this trial, the fruit were almost fully degreened with a flesh color of ~101 °h before there was any sign of rapid softening (ripening).
Excluding flesh color, the key aspects of kiwifruit ripening are softening and the starch to sugar conversion seen in the increased SSC of ripe fruit. Thus, the capacity to monitor kiwifruit ripening is dependent on a strong association between the IAD value (chlorophyll content) and firmness and SSC. This association is not always strong and has already been described in evaluating fruit maturation. It has also been demonstrated that the DA index from the Kiwi-Meter did not monitor fruit ripening in Dori kiwifruit, in which fruit were fully degreened, as measured by the Kiwi-Meter or colorimeter (Minolta), before there had been any softening of the fruit or a marked increase in SSC [10]. Likewise, there was no close association between Kiwi-Meter IAD and fruit firmness or SSC relevant to ripening in ‘Hayward’ fruit [24]. The current findings suggest that for ‘Donghong’ fruit there was a decrease in chlorophyll (IAD) during storage, which differs from those cultivars in which degreening has been shown to be slowed by low storage temperatures [25,26,27]. As with the maturation data, the large changes in IAD, SSC and firmness during storage made associations highly likely. Strong associations were observed when average data were investigated. Yet, when individual fruit data were investigated, there were large differences in SSC and firmness for any given IAD value. Thus, the consistent trends observed in the averaged data hide the wide spread of the individual fruit data and the average values were dependent on the proportions of individual fruit towards the extremes of the range.
Finally, the third trial looking at ripe fruit quality failed to show any strong association between IAD and rSSC or rDM. Given the previous discussion, it is perhaps not surprising that the Kiwi-Meter cannot directly quantify rSSC or rDM. Previously, a lack of association between IAD and DM was reported for ‘Hayward’ kiwifruit [21]. In addition, it was reported that there was no association between IAD and SSC in any cultivar of peach and nectarine, and thus the DA meter could not replace SSC measurement during on-tree maturity monitoring [28].
When fruit at harvest were categorized by IAD before and during storage, all categories of fruit showed a decline in IAD over the 12 weeks of storage at 1 °C and also after 1 week at 20 °C at the end of storage. Yet despite the marked differences in IAD at the end of storage and shelf assessment that were linked to the at-harvest IAD values, fruit in all categories were considered as ripe. While there were no differences in the rDM of the fruit in the different categories, there was a trend for there to be a higher rSSC in the lower IAD value categories (i.e., closer to 0.6 at harvest). This is likely to reflect differences in the maturity of the individual fruit at harvest, with overall less developed, greener fleshed, and lower carbohydrate fruit being identified by IAD. The fact that the ranking by IAD category at harvest was maintained through storage, with large differences in IAD despite the fruit being at a similar ripeness by firmness and SSC, again reflects the lack of a tight association between flesh color and the ripening of ‘Donghong’ fruit. The strong association between rSSC and rDM was to be expected given the long-established relationship between DM at harvest and rSSC [2], and the effect of storage on DM would be limited largely to an effect of water loss.
In summary, the Kiwi-Meter provides a non-destructive tool for measuring the color or chlorophyll content of the outer tissues of ‘Donghong’ kiwifruit. Since the timing of harvest of kiwifruit is not determined solely by flesh color, the utility of the Kiwi-Meter in any wider evaluation of fruit maturation, ripening, or quality is dependent on there being a strong association between other fruit characteristics of interest with flesh color. Associations between fruit characteristics are likely to depend on the growing environment. The ‘Donghong’ fruit used in this trial degreened fully before ripening and thus the Kiwi-Meter could not provide a measure of maturation, ripening, or fruit quality.
5. Conclusions
It is concluded that the Kiwi-Meter can assess the flesh color of ‘Donghong’ kiwifruit, although even for this purpose it must be considered that the IAD measurement may be limited to only the outer area of the fruit flesh. With the flesh color not being tightly associated with fruit ripening, the device is not suitable for the assessment of fruit maturity, ripening, or fruit quality.
Author Contributions
Conceptualization: W.H., J.B. and C.Z.; funding acquisition: C.Z.; investigation: Z.W., Q.Z. and S.F.; methodology: W.H. and Z.W.; writing—original draft: W.H.; writing—review and editing: J.B. and C.Z. All authors have read and agreed to the published version of the manuscript.
Funding
This research was funded by Science and Technology Poverty Alleviation Project of Chinese Academy of Sciences (KFJ-FP-202101) and Key Research and Development Project of Hubei Province (2021BBA100).
Conflicts of Interest
The authors declare no conflict of interest.
References
- Burdon, J.; Lallu, N. Kiwifruit (Actinidia spp.). In Postharvest Biology and Technology of Tropical and Subtropical Fruit; Cocona to Mango; Yahia, E.M., Ed.; Woodhead Publishing Limited: Cambridge, UK, 2011; Volume 3, pp. 326–360. [Google Scholar]
- Burdon, J.; McLeod, D.; Lallu, N.; Gamble, J.; Petley, M.; Gunson, A. Consumer evaluation of ‘Hayward’ kiwifruit of different at-harvest dry matter contents. Postharvest Biol. Technol. 2004, 34, 245–255. [Google Scholar] [CrossRef]
- Burdon, J. Kiwifruit biology: The commercial implications of fruit maturation. Hort. Rev. 2019, 46, 385–421. [Google Scholar]
- Crisosto, C.H.; Crisosto, G.M. Understanding consumer acceptance of early harvested ‘Hayward’ kiwifruit. Postharvest Biol. Technol. 2001, 22, 205–213. [Google Scholar] [CrossRef]
- Costa, G.; Noferini, M.; Montefiori, M.; Brigati, S. Non-destructive assessment methods of kiwifruit quality. Acta Hortic. 2003, 610, 179–189. [Google Scholar] [CrossRef]
- McGlone, V.A.; Kawano, S. Firmness, dry matter and soluble solids assessment of postharvest kiwifruit by NIR spectroscopy. Postharvest Biol. Technol. 1998, 13, 131–141. [Google Scholar] [CrossRef]
- Schaare, P.N.; Fraser, D.G. Comparison of reflectance, interactance and transmission modes of visible-near infrared spectroscopy for measuring internal properties of kiwifruit (Actinidia chinensis). Postharvest Biol. Technol. 2000, 20, 175–184. [Google Scholar] [CrossRef]
- Li, H.; Pidakala, P.; Billing, D.; Burdon, J. Kiwifruit firmness: Measurement by penetrometer and non-destructive devices. Postharvest Biol. Technol. 2016, 120, 127–137. [Google Scholar] [CrossRef]
- Costa, G.; Bonora, E.; Fiori, G.; Noferini, M. Innovative non-destructive device for fruit quality assessment. Acta Hortic. 2011, 913, 575–581. [Google Scholar] [CrossRef]
- Rocchi, L.; Vidoni, S.; Ceccarelli, A.; Fiori, G.; Costa, G. Use of the DAindex™ for monitoring fruit ripening evolution in A. chinensis to precisely assess harvesting time “in planta”. J. Berry Res. 2016, 6, 373–379. [Google Scholar] [CrossRef]
- DeLong, J.; Harrison, P.; Harkness, L. An optimal harvest maturity model for ‘Minneiska’ apple fruit based on the delta-absorbance meter. J. Hortic. Sci. Biotechnol. 2020, 95, 637–644. [Google Scholar] [CrossRef]
- Zhang, P.; Wei, Y.; Xu, F.; Wang, H.; Chen, M.; Shao, X. Changes in the chlorophyll absorbance index (IAD) are related to peach fruit maturity. NZ J. Crop Hortic. Sci. 2020, 48, 34–46. [Google Scholar] [CrossRef]
- Ziosi, V.; Noferini, M.; Fiori, G.; Tadiello, A.; Trainotti, L.; Casadoro, G.; Costa, G. A new index based on vis spectroscopy to characterize the progression of ripening in peach fruit. Postharvest Biol. Technol. 2008, 49, 319–329. [Google Scholar] [CrossRef]
- Amoriello, T.; Ciccoritti, R.; Paliotta, M.; Carbone, K. Classification and prediction of early-to-late ripening apricot quality using spectroscopic techniques combined with chemometric tools. Sci. Hortic. 2018, 240, 310–317. [Google Scholar] [CrossRef]
- Infante, R.; Contador, L.; Rubio, P.; Mesa, K.; Meneses, C. Non-destructive monitoring of flesh softening in the black-skinned Japanese plums ‘Angeleno’ and ‘Autumn beaut’ on-tree and postharvest. Postharvest Biol. Technol. 2011, 61, 35–40. [Google Scholar] [CrossRef]
- Farneti, B.; Gutierrez, M.S.; Novak, B.; Busatto, N.; Ravaglia, D.; Spinelli, F.; Costa, G. Use of the index of absorbance difference (IAD) as a tool for tailoring post-harvest 1-MCP application to control apple superficial scald. Sci. Hortic. 2015, 190, 110–116. [Google Scholar] [CrossRef]
- Gomes, R.; Silva, F.; Oliveira, C.M. Utilizing the IAD index to predict ‘Rocha’ pear quality and physiological disorders after storage. Acta Hortic. 2021, 1303, 461–468. [Google Scholar] [CrossRef]
- Sadar, N.; Zanella, A. A study on the potential of IAD as a surrogate index of quality and storability in cv. ‘Gala’ apple fruit. Agronomy 2019, 9, 642. [Google Scholar] [CrossRef]
- Sortino, G.; Allegra, A.; Farina, V.; Inglese, P.; Gallotta, A. Non-destructive determination of ‘Big Bang’ nectarine quality and harvest maturity. Acta Hortic. 2021, 1314, 471–478. [Google Scholar] [CrossRef]
- Burdon, J.; Pidakala, P.; Martin, P.; McAtee, P.A.; Boldingh, H.L.; Hall, A.; Schaffer, R.J. Postharvest performance of the yellow-fleshed ‘Hort16A’ kiwifruit in relation to fruit maturation. Postharvest Biol. Technol. 2014, 92, 98–106. [Google Scholar] [CrossRef]
- Cantin, C.M.; Soto, A.; Crisosto, G.M.; Crisosto, C.H. Evaluation of a non-destructive dry matter sensor for kiwifruit. Acta Hortic. 2011, 913, 627–632. [Google Scholar] [CrossRef]
- Sumanta, N.; Haque, C.I.; Nishika, J.; Suprakash, R. Spectrophotometric analysis of chlorophylls and carotenoids from commonly grown fern species by using various extracting solvents. Res. J. Chem. Sci. 2014, 4, 63–69. [Google Scholar]
- Zhong, C.; Han, F.; Li, D.; Liu, X.; Zhang, Q.; Jiang, Z.; Huang, H. Breeding of red-fleshed kiwifruit cultivar ‘Donghong’. J. Fruit Sci. 2016, 32, 1596–1599. [Google Scholar]
- Pellegrino, S.; Costamagna, F.; Noferini, M.; Costa, G. Monitoring of ‘Hayward’ (Actinidia deliciosa) fruit ripening in north-west Italy. Acta Hortic. 2011, 913, 665–669. [Google Scholar] [CrossRef]
- Gambi, F.; Pilkington, S.M.; McAtee, P.A.; Donati, I.; Schaffer, R.J.; Montefiori, M.; Spinelli, F.; Burdon, J. Fruit of three kiwifruit (Actinidia chinensis) cultivars differ in their degreening response to temperature after harvest. Postharvest Biol. Technol. 2018, 141, 16–23. [Google Scholar] [CrossRef]
- Burdon, J.; Lallu, N. Minimising chilling injury in Italian-grown ‘Hort16A’ kiwifruit. Acta Hortic. 2022, 1332, 343–349. [Google Scholar] [CrossRef]
- Ghasemnezhad, M.; Fullerton, C.; Billing, D.; Ampomah-Dwamena, C.; Burdon, J. Fruit degreening in different cultivars of kiwifruit. Acta Hortic. 2022, 1332, 285–293. [Google Scholar] [CrossRef]
- Gonçalves, R.G.; Couto, J.; Almeida, D.P.F. On-tree maturity control of peach cultivars: Comparison between destructive and nondestructive harvest indices. Sci. Hortic. 2016, 209, 293–299. [Google Scholar] [CrossRef]
Publisher’s Note: MDPI stays neutral with regard to jurisdictional claims in published maps and institutional affiliations. |
© 2022 by the authors. Licensee MDPI, Basel, Switzerland. This article is an open access article distributed under the terms and conditions of the Creative Commons Attribution (CC BY) license (https://creativecommons.org/licenses/by/4.0/).