Abstract
The purpose of this research is to determine how increasing levels of nitrogen (N) fertilizers, locations, and cultivars affected yields, biomass accumulation, and polyphenol concentrations in lettuce. This study is carried out at the North Mississippi Research and Extension Center (NMREC) and Northwest Washington Research and Extension Center (NWREC). The experiment is a randomized complete block design arranged in a 2 × 2 × 4 factorial with 4 replications. Treatments include two cos (romaine) lettuce cultivars, ‘Salvius’ and ‘Thurinus’. N treatments include 42, 63, 105 and 189 kg·ha−1. ‘Salvius’ has greater fresh mass (FM) and dry mass (DM), and a smaller DM:FM ratio when compared to ‘Thurinus’. The NWREC location has higher lettuce FM and DM. Quercetin-3-glucoside (Q-3-G) increases with increasing N concentrations. There are interactions between locations and lettuce cultivars for chlorogenic acid, Q-3-G, and quercetin/luteolin glucuronide (QL-G). There is increased chlorogenic acid content in ‘Salvius’ at the NMREC and increased concentrations of Q-3-G and QL-G in ‘Thurinus’ compared to the NWREC location. ‘Thurinus’ has significantly more chicoric acid and quercetin-malonyl-glucoside (QM-G) than ‘Salvius’. Lettuce at the NWREC has significantly more chicoric acid and cyanidin-3-glucoside (C-3-G). Lettuce at the NWREC has greater yields and biomass accumulation. Lettuce at the NWREC also has greater amounts of flavonoids and anthocyanins. ‘Salvius’ has greater amounts of phenolic acids and ‘Thurinus’ has greater amounts of flavonoids and anthocyanins.
1. Introduction
Lettuce is among the most widely produced vegetables in the United States. Since 2012, the acreage devoted to fresh-market lettuce production has been expanding, as production territory has grown and more producers have entered the industry [1,2]. As of 2015, lettuce was considered to be the nation’s most valuable crop after reaching $1.9 billion in sales [2]. While the clear majority of the lettuce in the United States is produced in California and Arizona, the rising cost of shipping produce, as well as the increased demand for locally produced crops, has generated demand for lettuce production in other regions of the country, such as Northwestern and Southeastern United States.
Currently, lettuce is a staple food in the American diet and is consumed in large quantities by the public [3]. Lettuce is considered to be a nutritious vegetable due to its high content of calcium, iron, vitamins A and C, and phenolic antioxidants. Polyphenols are a class of secondary metabolites, which plants produce primarily as a defense mechanism in an effort to mitigate the effects of harmful pests, pathogens, and detrimental abiotic stresses [4]. Recently, plants that contain substantial concentrations of these metabolites have received increased attention due to their positive impact on human health. Phenolic compounds possess a high antioxidant capacity and scavenge for free radicals within the human body, giving them great potential for preventing chronic diseases and maintaining optimal human health [4,5,6]. Therefore, researchers have become increasingly more interested in understanding and controlling factors that affect phenolic antioxidant accumulation in lettuce.
Lettuce is a cool-weather crop, which has a preferred temperature range of 21–23 °C/15–18 °C (day/night). A major cause of reduced yields and quality is inflorescence initiation at high temperatures [7], which results in the emergence of seed stalks during plant vegetative growth, often rendering lettuce bitter and unmarketable. For example, Zhao and Carey [8] demonstrated that lettuce produced in unshaded high tunnels during the summer season had a significant increase in bolting and bitter flavored plants compared to those produced in open fields. The ability to grow lettuce during high temperature exposure could result in an overall increase in the production of lettuce, as it could potentially be grown throughout the summer in regions, where elevated temperatures are problematic.
Previous studies have indicated that damage incurred by heat stress may be mitigated by volumes and timing of nutrient applications [9]. Nitrogen (N) is a primary, essential plant nutrient that serves many functions in plant metabolism, such as photosynthesis, production of enzymes, and energy relations [10]. While experiments have been conducted in several plant species with respect to alleviating detrimental effects of environmental stress through N application rates [11,12], the resulting impact on lettuce has been varied and is not yet completely understood [13,14,15]. Thus, the purpose of this research was to determine how increasing levels of N fertilizers, two locations with significant temperature differences, and lettuce genotypes affect the yield and quality when the lettuce was grown at peak summer temperatures.
2. Materials and Methods
Experimental sites. This study was carried out at two sites, the North Mississippi Research and Extension Center in the Mississippi State University (NMREC; 34°09′54.2″ N, 88°43′14.3″ W, elevation 99 m) and the Northwestern Washington Research and Extension Center in the Washington State University (NWREC; 48°43′24″ N, 122°39′09″ W, elevation 6 m). Summer at the NMREC is generally hot, with an average daily temperature of 26.7 °C in June, 27.2 °C in July, and 27.2 °C in August [16]. The site at the NMREC has an Ora fine sandy loam with a pH 6.8 and 1.2% organic matter. Summer at the NWREC is generally mild, with an average daily temperature of 13.3 °C in June, 16.1 °C in July, and 17.2 °C in August [17]. The site has poorly drained Skagit silt loam soil with a pH 6.2 and 2.8% organic matter.
Experimental design and planting. The experiment was a randomized complete block design arranged in a 2 (cultivar) × 2 (location) × 4 (N rate) factorial with 4 replications. Treatments included two cos (romaine) lettuce cultivars, ‘Salvius’ (green leaf; Johnny’s Selected Seeds, Winslow, ME) and ‘Thurinus’ (red leaf; Johnny’s Selected Seeds). N treatments included 42 (1×), 63 (1.5×), 105 (2.5×) and 189 (3.5×) kg·ha−1 N.
Historical weather data were used to identify peak summer temperatures at each field location, and the seeding date was scheduled, so lettuce would be growing during the peak temperature exposure (Figure 1). At the NMREC, lettuce was seeded in the greenhouse on 15 April in 48-cell trays (Metro Mix 300 soilless medium; Sun Gro, Agawam, MA, USA) and germinated in greenhouse conditions at 24/20 °C (day/night). At the NWREC, lettuce was seeded in the greenhouse on 25 May in 72-cell trays (Sunshine Mix #3; Steuber Distributing Co., Snohomish, WA, USA) and germinated in greenhouse conditions at 24/19 °C (day/night). At both sites, raised beds (Model 2600 Bed Shaper, Rain-Flo Irrigation, East Pearl, PA, USA) were 15–20 cm high, 0.8 m wide, 2.4 m center to center, and covered with black plastic mulch (at the NMREC, 31.75 μm, Berry Plastics, Evansville, IN; at the NWREC, 25.4 μm, Filmtech, Allentown, PA, USA) with a drip tape (NMREC-Turbulent Twin Wall, 0.2 m emitter spacing, 0.25 mm thickness, 0.7 L·h−1 at 69 kPa, Chapin Watermatics, Watertown, NY, USA; NWREC-T-Tape, 8 mil, 0.2 m dripper spacing, 77 L·h−1 per 33 m, San Diego, CA, USA) laid down the center of the bed under the mulch. Plots were 8 m long, with 2 m buffers between each plot. Lettuce was transplanted into a double-row spaced 0.3 m between and within row, with 16 plants per row, totaling 32 plants per plot. Transplanting was on 6 May at the NMREC and 14 June at the NWREC.
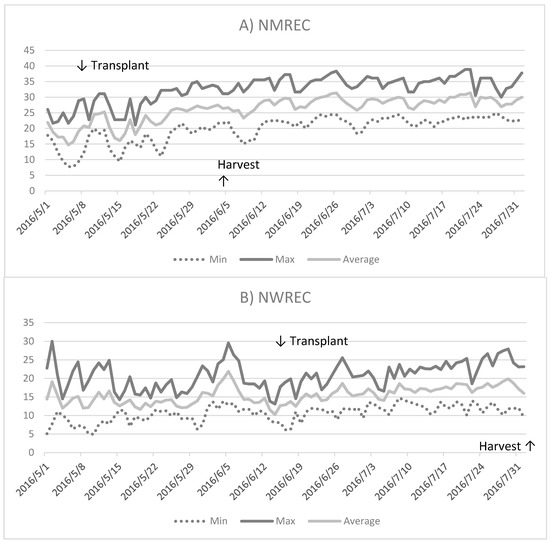
Figure 1.
Minimum, maximum, and average temperatures from May to August 2016 at (A) the North Mississippi Research and Extension Center (NMREC) in the Mississippi State University, Verona, MS, USA and (B) the Northwest Washington Research and Extension Center (NWREC) in the Washington State University, Mount Vernon, WA, USA.
Fertilizer and irrigation. Fertilizer application at the NMREC was applied according to recommendations by soil test results from Mississippi State University Extension Service Soil Testing Laboratory. A custom blend fertilizer was applied as ammonium nitrate (34N–0P–0K), super phosphate (0N–20.1P–0K), and muriate of potash (0N–0P–49.8K). Phosphorus and potassium fertilizers were applied at 56 kg·h−1 and 224 kg·h−1, respectively. An N fertilizer was applied prior to planting at a target of 46 kg·ha−1 N on all plots as a base for N treatment applications. Fertilizer application at the NWREC was according to local recommendations for lettuce based on a soil analysis from the site (Wilbur-Ellis, Mount Vernon, WA, USA). A fertilizer (11N–2.2P–21.6K, with 1.1% ammoniacal N and 9.9% urea N; Wilbur-Ellis) was applied prior to planting at a target of 42 kg·ha−1 N.
The remaining N fertilizer (46N–0P–0K, 46% urea N in each treatment) was applied via side-dressing 2 weeks after transplanting on 20 May at the NMREC and on 28 June at the NWREC, respectively. Total N fertilizer treatment application rates (including pre-plant fertilizer and side-dressed fertilizer) were (1) 42 (1×, control); (2) 63 (1.5×); (3) 105 (2.5×) and (4) 189 (3.5×) kg·ha−1 N at both locations. To apply the additional fertilizer, the plastic mulch was slit open down the center of the bed, a 2.5-cm-deep trench was made approximately 10 cm to the side of the plants (between the drip tape and the plant), the fertilizer was sprinkled evenly by hand into the trench then covered with soil, and plastic mulch was closed with a black electrical tape in the NMREC and a clear greenhouse repair tape in the NWREC. For the lowest N fertilizer treatment (42 kg·ha−1 N), the plastic mulch was not cut because no additional fertilizer was applied.
Lettuce harvest and yield. Twelve center plants in each plot were harvested at peak maturity, on 15 June at the NMREC and on 28 July at the NWREC, respectively. If a center plant was missing, an adjacent plant was harvested. At harvest, 6 random plants of the 12 center plants were selected for measurement of fresh mass (FM); plants were dried at 60 °C for 2 days and dry mass (DM) was recorded. From the remaining 6 harvested plants, the last 4 fully matured leaves were collected from each plant, bulked, and a 20 g sample was retained. Samples at the NMREC were frozen at −20 °C and then freeze-dried. At the NWREC, samples were frozen at −20 °C, then shipped overnight on dry ice to the NMREC where samples were freeze-dried. All samples were then extracted and analyzed for phenolic acids, flavonoids, and anthocyanins.
Phenolic acid, flavonoid, and anthocyanin analysis. Extraction and chemical analyses were conducted according to Becker et al. [18] with modification. Briefly, freeze-dried lettuce leaf samples were ground in a bullet grinder for homogeneous subsamples. A 0.1 g subsample was extracted in a 15 mL test tube by adding 2.5 mL of an extraction solvent consisting of methanol, de-ionized water, and formic acid (60:37:3, v/v/v). The samples were vortexed for 1 min and then centrifuged at 4000 rpm for 20 min. After centrifugation, the supernatant was transferred to a new 15 mL test tube and kept on ice. This process was repeated 2 more times for a total of 7.5 mL of the supernatant collected. After the transfers, the tubes were mixed by inversion and samples were filtered through a 0.2 µm syringe filter and collected in a 2 mL high performance liquid chromatography (HPLC) vial for analysis. Separation parameters and flavonoid quantification were carried out with authentic standards using an Agilent 1260 series HPLC with a multiple wavelength detector (Agilent Technologies, Willington, DE, USA). Chromatographic separations were achieved using a 150 × 4.6 mm i.d., 2.6 μm analytical scale Kinetex F5 reverse-phase column (Phenomenex, Torrance, CA, USA), which allowed for the effective separation of chemically similar flavonoid compounds. The HPLC was equipped with a Kinetex F5 12.5 × 4.6 mm i.d. guard cartridge and holder (Phenomenex) and was maintained at 30 °C using a thermostat column compartment. All separations were achieved using gradient mobile phase of RO (reverse osmosis) water adjusted to a pH 2.5 with trifluoroacetic acid and acetonitrile. The gradient held the following percentages of 15–35% (20 min), 30–15% (1 min), and 15% (2 min). The flow rate was 1.0 mL min−1, with a run time of 21 min, followed by a 2 min equilibration before the next injection. Eluted compounds from a 10 µL injection loop were detected, and data were collected, recorded, and integrated using ChemStation C.01.01 Software (Agilent Technologies). Peak assignment for individual phenolic acids, flavonoids, and anthocyanins was performed by comparing retention times from the multiple wavelength detector using external standards of quercetin glucoside, caftaric acid, chlorogenic acid, luteolin glucuronide, quercetin glucuronide, quercetin malonyl, and cyanidin glucoside (Sigma-Aldrich, St. Louis, MO, USA).
Statistical analysis. Data were subjected to the GLIMMIXED procedure and the mean separation using the Tukey’s Honest Significant Difference test (p ≤ 0.05) with SAS statistical software (Version 9.4; SAS Institute, Cary, NC, USA).
3. Results
Temperature. In general, summer temperatures were higher at the NMREC than at the NWREC (Figure 1) for 2016. At the NMREC, during the months of May, June, and July, the mean daily temperatures were 21.6, 27.7 and 28.9 °C, respectively. In the same time period, the mean daily temperatures at the NWREC were 13.8, 15.3 and 17.3 °C, respectively. Thus, the average daily temperatures at the NMREC were 19.7%, 27.2% and 24.9%, which were higher than those at the NWREC.
Influence of cultivar and location on lettuce biomass. There were no significant differences in lettuce head fresh and dry biomass when increasing N treatments were compared (data not shown). There were also no interactions between the cultivar and the location regarding lettuce biomass. Thus, lettuce head FM and DM production differed only by cultivars and growing locations (Table 1). ‘Salvius’ exhibited significantly greater average FM and DM than ‘Thurinus’. Overall, ‘Salvius’ lettuce had an increase of 55.4% for FM and a 47.3% increase in DM compared to ‘Thurinus’. However, ‘Thurinus’ produced a greater DM:FM ratio than ‘Salvius’. These results demonstrated that marketable lettuce produced at the NWREC had significantly greater FM and DM than plants grown at the NMREC (Table 1). There was a 14.3% increase in lettuce FM and a 15.6% increase in DM at the NWREC compared to lettuce grown at the NMREC. The DM:FM ratio was not statistically different with respect to production location.

Table 1.
Fresh mass (FM, g), dry mass (DM, g), and the ratio of DM to FM as affected by lettuce cultivars and growing locations.
Influence of N rate, lettuce cultivars, and location on phenolic concentrations. In general, N treatments did not significantly affect phenolic concentrations in lettuce cultivars grown at the NMREC or the NWREC. However, significant differences among N treatments were observed on the content of the flavonoid quercetin-3-glucoside (Q-3-G) in lettuce leaf tissue (Figure 2). Plots treated with N at a rate of 189 kg·ha−1 achieved the greatest concentration of Q-3-G. This treatment contained 24% more Q-3-G than treatments of 63 kg·ha−1 and 105 kg·ha−1, and 57% more than the control treatment of 42 kg·ha−1.
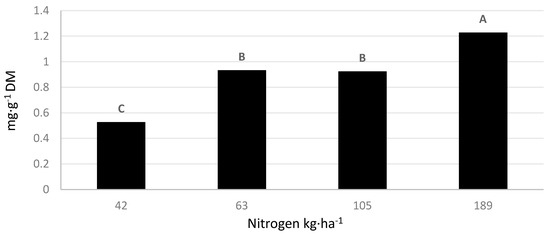
Figure 2.
The effect of increasing nitrogen fertilization on the concentration of quercetin-3-glucoside concentrations in leaf tissue of ‘Salvius’ and ‘Thurinus’, red and green romaine lettuce cultivars, respectively. Values followed by the same letter are not significantly different at p ≤ 0.05 according to the Tukey’s Honest Significant Difference test.
There was a significant interaction between production locations and lettuce cultivars for chlorogenic acid, Q-3-G, and quercetin/luteolin glucuronide (QL-G) concentrations (Table 2). ‘Salvius’ lettuce produced at the NMREC had 24% more chlorogenic acid content compared to the same cultivar grown at the NWREC. Moreover, the greatest concentration of chlorogenic acid appeared in ‘Salvius’ produced at the NMREC, which was 86% more than ‘Thurinus’ produced at the NWRE. Conversely, ‘Salvius’ lettuce from the NWREC contained 79% more Q-3-G than the same cultivar produced at the NMREC. ‘Salvius’ lettuce from the NMREC also contained the lowest concentration of Q-3-G among both cultivars and locations. ‘Thurinus’ had the greatest concentrations of QL-G at both locations, and was 81% greater than ‘Salvius’. Although ‘Thurinus’ grown at the NMREC contained 36% greater QL-G compared to the NWREC, this difference was not significant. There were no significant differences in QL-G concentrations for ‘Salvius’ lettuce produced at each location.
Table 2.
The interaction of growing locations and lettuce cultivars on the concentrations of phenolic secondary metabolites quercetin-3-glucoside (Q-3-G) and quercetin/luteolin glucuronide (QL-G) in green and red romaine lettuce cultivars.
There were no significant interactions between cultivars and locations for QM and chicoric acid in lettuce leaf tissue. The lettuce cultivars, ‘Salvius’ and ‘Thurinus’, had significantly different leaf QM and chicoric acid concentrations (Figure 3). ‘Thurinus’ contained 89% more QM and 49% more chicoric acid compared to the green-leafed ‘Salvius’. Furthermore, production locations resulted in significant differences with respect to chicoric acid and C-3-G content (Figure 4). Lettuce produced at the NWREC contained 36% higher amounts of chicoric acid and 77.4% more C-3-G when compared to the NMREC location.
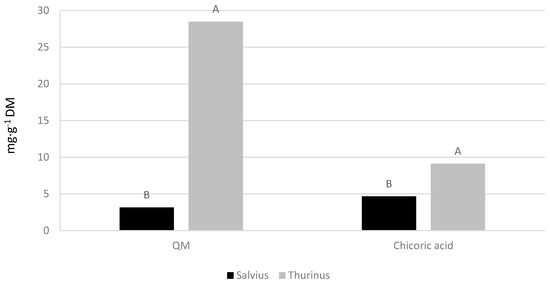
Figure 3.
Effect on quercetin-malonyl (QM) and chicoric acid concentrations in leaf tissue of ‘Salvius’ and ‘Thurinus’, red and green romaine lettuce cultivars, respectively. Values followed by the same letter are not significantly different at p ≤ 0.05 according to the Tukey’s Honest Significant Difference test.
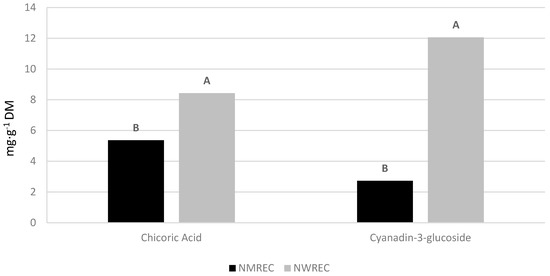
Figure 4.
Concentrations of chicoric acid and cyanidin-3-glucoside concentrations in leaf tissue of ‘Salvius’ and ‘Thurinus’, red and green romaine lettuce cultivars, respectively, when growing locations are compared (i.e., the North Mississippi Research and Extension Center (NMREC) in the Mississippi State University, Verona, MS, USA and the Northwest Washington Research and Extension Center (NWREC) in the Washington State University, Mount Vernon, WA, USA). Values followed by the same letter are not significantly different at p ≤ 0.05 according to the Tukey’s Honest Significant Difference test.
4. Discussion
The current study aimed to elucidate the impact that varying rates of N fertilizer may have on the yield and nutritional quality of green and red romaine lettuce cultivars produced in regions with differing climates. Overall, the climatic differences between the NMREC and NWREC were evident from the variance of average temperatures during the project period. Studies have indicated that these parameters play a significant role in determining yields and the sequestration of phenolic compounds. Fallovo et al. [19] and Tudela et al. [20] determined that seasonal climatic changes affected the yield of lettuce heads when lettuce was grown in the greenhouse and field, respectively. Additionally, studies indicated that there are differences in lettuce cultivar yields when lettuce was grown at different growing season temperatures [20]. Previous research has also indicated that environmental stress factors, such as heat stress, chilling, and high light intensity, affect phenolic compound concentrations in lettuce [21]. In the current study, the data suggest that locations affected lettuce yields, biomass accumulation, and phenolic compounds in green and red lettuce cultivars. These changes in yields and phenolic compounds are most likely because the average daily temperatures were up to 24% higher on average at the NMREC than at the NWREC during the growing season. At the NWREC, cooler temperatures were the likely cause of higher yields than at the NMREC location. Wallace et al. [22] demonstrated similar results with increased yields and quality with lettuce cultivars grown in a cooler climate in Northeast United States compared to warmer climate conditions in Southern United States. Research has also indicated that environmental stress factors, such as high temperatures during lettuce crop growth can cause reduced yields and quality, such as bitterness [7,8]. The current study demonstrated that there were reduced yields and increased chlorogenic acid, at the NMREC location, which can contribute to bitterness in lettuce grown under high-temperature stress conditions.
In general, increasing the supply of N to plants delays the onset of senescence and encourages growth. Previous studies have produced mixed results when comparing the effect of N rate and abiotic stresses on lettuce yield. For example, lettuce subjected to increasing applied N fertilizer resulted in greater production of biomass up to 150 kg.ha−1 N in full sun but declined at 300 kg·ha−1 N. The study also found that phenolic compounds increased when exposed to increasing light levels [23]. Higher yields and elevated levels of phenolic compounds were also found in carrot (Daucus carota L.) exposed to increasing N treatments [24]. The results from the current study did not suggest a connection between N rates and yields. However, the flavonoid Q-3-G was significantly increased with elevating N application rate and was present in the highest concentration under the 189 kg·ha−1 N treatment and lowest in the 42 kg·ha−1 N treatment. Consequently, Hoque et al. [9] demonstrated that increasing levels of N ranging from 0 to 337 kg·ha−1 significantly increased lettuce yields. Thus, there have been mixed results when examining the effect of N on lettuce yields. In the current study, lettuce biomass accumulation was not significantly affected by increasing N rates, and these results may have been due to N treatments not reaching sufficient levels in the soil to create a yield response.
The current study demonstrated a significant difference between production locations and cultivars on phenolic content. Numerous studies have conveyed supportive results regarding the significance of cultivars on phenolic compositions [25,26]. For example, Gazula et al. [27] evaluated nine red leaf lettuce cultivars and found a significant cultivar effect on total anthocyanin concentrations. Moreover, lettuce cultivars exhibited a significant difference in the composition of polyphenols and antioxidant properties [8]. The results of the current study also showed that lettuce cultivars significantly affected individual concentrations of QM and chicoric acid. These compounds were generated in the greatest quantities by the red-leafed ‘Thurinus’. This is expected as red lettuce typically contains greater amounts of polyphenols due to its pigmentation and the presence of anthocyanins [28].
Similarly, the location had a significant impact on individual concentrations of phenolics, resulting in a higher concentration of chicoric acid and C-3-G at the NWREC location. This result aligns with the assertion that phenolic compounds, and specifically, anthocyanins are produced in larger concentrations when crops are grown at cooler temperatures [26,29]. The anthocyanins, C-3-G, were substantially elevated in ‘Thurinus’ grown under cooler conditions at the NWREC location. However, major phenolic compounds found in lettuce, including chlorogenic acid and chicoric acid, have been shown to increase in response to heat stress and chilling [21]. The results of this study indicated significant differences in chlorogenic acid and QL-G at the NMREC with respect to locations and cultivars, which may be attributed to increased pressures from environmental stresses, such as high temperatures.
Increasing N treatments did not cause significant differences in lettuce yields and biomass accumulation. However, concentrations of Q-3-G significantly increased in lettuce leaf tissue as the N rate increased. There is limited published research available, demonstrating the effect of increasing N on specific phenolic compounds. The most substantial findings of this study pertained to the impact of cultivars and locations on biomass production, and the foliar quantity of phenolic compounds by cultivars, locations, and the interaction between the two. The green-leafed, ‘Salvius’ lettuce generated more fresh mass, dry mass, and a smaller DM:FM ratio compared to its red-leafed counterpart, ‘Thurinus’. Red-leafed lettuce generally takes longer to reach maturity than green varieties, which perhaps explains the greater yield and biomass production of the ‘Salvius’ lettuce. The increased concentrations of polyphenols are believed to be a direct result of lettuce cultivar genetics and the climatic conditions they are exposed to during production. While a significant body of research exists that outlines the effect of cool temperatures on anthocyanins, such as C-3-G, further investigations could be directed to the complex interaction of nutrient application rates and high temperatures with the accumulation of specific phenolic compounds in lettuce leaf tissue.
Author Contributions
Conceptualization, T.C.B.; methodology, T.C.B. and C.M.; validation, T.C.B., C.M. and E.S.; formal Analysis, T.C.B., W.S., C.M., D.C. and E.S.; investigation, W.S., D.C. and E.S.; resources, T.C.B. and C.M.; data curation, T.C.B.; writing of the original draft preparation, T.C.B., W.S. and D.C.; writing of review and editing, T.C.B., C.M. and E.S.; visualization, T.C.B., W.S., D.C., C.M. and E.S.; supervision, W.S., D.C. and E.S.; project administration, T.C.B., W.S., D.C., C.M. and E.S.; funding acquisition, T.C.B. and C.M.
Funding
This work was supported by USDA NIFA Hatch S-294 project MIS 149160 and the Mississippi Agriculture and Forestry Experiment Station and the Washington State project WN00375-Acc. No.1008680.
Acknowledgments
Special thanks to Thomas E. Horgan and Cameron Tate for technical assistance throughout the project.
Conflicts of Interest
The authors declare no conflicts of interest.
References
- U. S. Department of Agriculture. 2012 Census of Agriculture; U. S. Department of Agriculture: Washington, DC, USA, 2012.
- U.S. Department of Agriculture, National Agricultural Statistics Service. Crop Values 2015 Summary; U. S. Department of Agriculture: Washington, DC, USA, 2016.
- Zhao, X.; Carey, E.E.; Young, E.; Wang, W.; Iwamoto, T. Influences of organic fertilization, high tunnel environment, and postharvest storage on phenolic compounds in lettuce. HortScience 2007, 42, 71–76. [Google Scholar]
- Romani, A.; Pinelli, P.; Galardi, C.; Sani, G.; Cimato, A.; Heimler, D. Polyphenols in Greenhouse and Open-Air-Grown Lettuce. Food Chem. 2002, 79, 337–342. [Google Scholar] [CrossRef]
- Llorach, R.; Martínez-Sánchez, A.; Tomás-Barberán, F.A.; Gil, M.I.; Ferreres, F. Characterisation of polyphenols and antioxidant properties of five lettuce varieties and escarole. Food Chem. 2008, 108, 1028–1038. [Google Scholar] [CrossRef] [PubMed]
- Podsedek, A.; Sosnowska, D.; Redzynia, M.; Anders, B. Antioxidant capacity and content of Brassica oleracea dietary antioxidants. Int. J. Food Sci. Technol. 2006, 41, 49–58. [Google Scholar] [CrossRef]
- Simonne, A.; Simonne, E.; Eitenmiller, R.; Coker, C.H. Bitterness and composition of lettuce varieties grown in the southeastern United States. HortTechnology 2002, 12, 721–726. [Google Scholar]
- Zhao, X.; Carey, E.E. Summer production of lettuce, and microclimate in high tunnel and open field plots in Kansas. HortTechnology 2009, 19, 113–119. [Google Scholar]
- Hoque, M.M.; Ajwa, H.; Othman, M.; Smith, R.; Cahn, M. Yield and postharvest quality of lettuce in response to nitrogen, phosphorus, and potassium fertilizers. HortScience 2010, 45, 1539–1544. [Google Scholar]
- Marschner, H. Functions of mineral nutrients: Macronutrients. In Mineral Nutrition of Higher Plants, 3rd ed.; Academic Press: New York, NY, USA, 2012; pp. 135–151. [Google Scholar]
- Tawfik, A.A.; Kleinhenz, M.D.; Palta, J.P. Application of calcium and nitrogen for mitigating heat stress effects on potatoes. Am. Potato J. 1996, 73, 261–273. [Google Scholar] [CrossRef]
- Tahir, I.S.A.; Nakata, N. Remobilization of nitrogen and carbohydrates from stems of bread wheat in response to heat stress during grain filling. J. Agron. Crop Sci. 2005, 191, 106–115. [Google Scholar] [CrossRef]
- Karam, F.; Mounzer, O.; Sarkis, F.; Lahoud, R. Yield and nitrogen recovery of lettuce under different irrigation regimes. J. Appl. Hortic. 2002, 4, 70–76. [Google Scholar]
- Stefanelli, D.; Winkler, S.; Jones, R. Reduced nitrogen availability during growth improves quality in red oak lettuce leaves by minimizing nitrate content, and increasing antioxidant capacity and leaf mineral content. Agric. Sci. 2011, 2, 477–486. [Google Scholar] [CrossRef]
- Bumgarner, N.R.; Scheerens, J.C.; Mullen, R.W.; Bennett, M.A.; Ling, P.P.; Kleinhenz, M.D. Root-zone temperature and nitrogen affect the yield and secondary metabolite concentration of fall-and spring-grown, high-density leaf lettuce. J. Sci. Food Agric. 2012, 92, 116–124. [Google Scholar] [CrossRef] [PubMed]
- Mississippi State University. Mississippi Weather Station Data; North Mississippi Research and Extension Center: Verona, MS, USA, 2017. [Google Scholar]
- AgWeatherNet. Washington State University, Northwest Washington Research and Extension Center: Mount Vernon, WA, USA, 2017. Available online: http://weather.wsu.edu/?p=93250 (accessed on 15 August 2016).
- Becker, C.; Kläring, H.; Kroh, L.W.; Krumbein, A. Temporary reduction of radiation does not permanently reduce flavonoid glycosides and phenolic acids in red lettuce. Plant Physiol. Biochem. 2013, 72, 154–160. [Google Scholar] [CrossRef] [PubMed]
- Fallovo, C.; Cardarelli, Y.R.M.; Rea, E.; Battistelli, A.; Colla, G. Yield and quality of leafy lettuce in response to nutrient solution composition and growing season. J. Food Agric. Environ. 2009, 7, 456–462. [Google Scholar]
- Tudela, J.A.; Hernandez, N.; Perez-Vicente, A.; Gil, M.I. Growing season climate affect quality of fresh-cut lettuce. Postharvest Biol. Technol. 2017, 123, 60–68. [Google Scholar] [CrossRef]
- Oh, M.M.; Carey, E.E.; Rajashekar, C.B. Environmental stresses induce health-promoting phytochemicals in lettuce. Plant Physiol. Biochem. 2009, 47, 578–583. [Google Scholar] [CrossRef] [PubMed]
- Wallace, R.W.; Wszelaki, A.L.; Miles, C.A.; Cowan, J.S.; Martin, J.; Roozen, J.; Gundersen, B.; Inglis, D.A. Lettuce yield and quality when grown in high tunnel and open-field production systems under three diverse climates. HortTechnology 2012, 22, 659–668. [Google Scholar]
- Stagnari, F.; Galieni, A.; Pisante, M. Shading and nitrogen management affect quality, safety and yield of greenhouse-grown leaf lettuce. Sci. Hortic. 2015, 192, 70–79. [Google Scholar] [CrossRef]
- Smolen, S.; Sady, W. The effect of various nitrogen fertilization and foliar nutrition regimes on the concentrations of sugars, carotenoids and phenolic compounds in carrot (Daucus carota L.). Sci. Hortic. 2009, 120, 315–324. [Google Scholar] [CrossRef]
- Bunning, M.L.; Kendall, P.A.; Stone, M.B.; Stonaker, F.H.; Stushnoff, C. Effects of seasonal variation on sensory properties and total phenolic content of 5 lettuce cultivars. J. Food Sci. 2010, 75, 156–162. [Google Scholar] [CrossRef] [PubMed]
- Marin, A.; Ferreres, F.; Barberá, G.G.; Gil, M.I. Weather variability influences color and phenolic content of pigmented baby leaf lettuces throughout the season. J. Agric. Food Chem. 2015, 63, 1673–1681. [Google Scholar] [CrossRef] [PubMed]
- Gazula, A.; Kleinhenz, M.D.; Scheerens, J.C.; Ling, P.P. Anthocyanin levels in nine lettuce (Lactuca sativa) cultivars: Influence of planting date and relations among analytic, instrumented, and visual assessments of color. HortScience 2007, 42, 232–238. [Google Scholar]
- Kim, M.J.; Moon, Y.; Tou, J.C.; Mou, B.; Waterland, N.L. Nutritional value, bioactive compounds and health benefits of lettuce (Lactuca sativa L.). J. Food Compos. Anal. 2016, 49, 19–34. [Google Scholar] [CrossRef]
- Becker, C.; Klaering, H.P.; Kroh, L.W.; Krumbein, A. Cool-cultivated red leaf lettuce accumulates cyanidin-3-O-(6″-O-malonyl)-glucoside and caffeoylmalic acid. Food Chem. 2014, 146, 404–411. [Google Scholar] [CrossRef] [PubMed]
© 2018 by the authors. Licensee MDPI, Basel, Switzerland. This article is an open access article distributed under the terms and conditions of the Creative Commons Attribution (CC BY) license (http://creativecommons.org/licenses/by/4.0/).