Article

Assessing Purchase Patterns of Price Conscious Consumers

1
Mid-Florida Research and Education Center, University of Florida, Apopka, FL 32703, USA
2
Food and Resource Economics Department, Mid-Florida Research and Education Center, University of Florida, Apopka, FL 32703, USA
*
Author to whom correspondence should be addressed.
Horticulturae 2018, 4(3), 13; https://doi.org/10.3390/horticulturae4030013
Submission received: 19 May 2018 / Revised: 14 June 2018 / Accepted: 21 June 2018 / Published: 2 July 2018
(This article belongs to the Special Issue Marketing Strategies of the Horticultural Production Chain)

Abstract

:
Price greatly influences consumers’ purchasing decisions. Individuals whose decisions are primarily driven by price are said to be ‘price conscious’. To date, studies have focused on defining price consciousness and identifying factors that contribute to price-conscious behavior. However, research using visual attention to assess how price conscious consumers use in-store stimuli is limited. Here, consumers’ purchasing decisions are assessed using a rating-based conjoint analysis paired with eye tracking technology when shopping for ornamental plants. An ordered logit model is employed to understand price conscious consumers’ purchase patterns and choice outcomes. Overall, price conscious consumers are less attentive to price information. Being price conscious tends to reduce purchase likelihood, ceteris paribus. Increasing visual attention to price decreases consumers’ purchase likelihood, which is amplified for price conscious consumers. Price conscious consumers tend to be quicker decision makers than non-price conscious consumers. Results are beneficial to retailers interested in targeting or primarily catering to price conscious consumers.

1. Introduction

Price strongly affects consumers’ purchasing decisions. Consumers who are unwilling/unable to pay a higher price or primarily focus on a product’s price during the decision making process have been called ‘price conscious’, ‘price sensitive’, ‘value conscious’, ‘value oriented’, ‘price oriented’, ‘deal prone’, ‘thrifty’, and so on [1,2,3,4,5,6,7]. Here, we refer to those individuals as ‘price conscious’. Consumers’ level of price consciousness greatly influences their decision making processes and purchasing behaviors [8,9,10].
Prior research primarily focuses on defining price consciousness [7,8,10,11] and identifying key factors that influence these consumers’ shopping behavior [1,5,6]. Price conscious consumers place greater emphasis on a product’s price and carefully weigh the potential benefits of the purchase against the cost of the good [2,12]. Additionally, price conscious consumers exhibit similar demographic characteristics. They tend to be deal prone [13], and many factors (including income, product involvement, product quality perceptions, upbringing, age, socialization, and cognitive beliefs on saving money) have been shown to influence consumers’ level of price consciousness [11,14,15]. Price consciousness has long been studied, but, to the authors’ knowledge, visual attention metrics have not been used to assess this decision making style.
Understanding visual attention and its role in decision making is important since industry stakeholders spend a substantial amount of money on in-store promotions (e.g., in 1997, the food industry spent $48.7 billion on in-store promotions [16]), but only 2% of the visual field is processed and used in decision making [17,18]. Visual attention metrics have recently been incorporated into consumer behavior research to investigate choice [17,19], examine decision making processes [20,21], and improve the econometric model fit [17,22,23]. Past studies also use eye tracking to study promotional aspects related to packaging design, nutritional information usage, and shelving strategies to optimize product design and in-store visibility [24]. However, little is known about the use of this technology to investigate price conscious consumers’ visual attention to prices and purchase likelihood within the retail setting.
To price conscious consumers, the product’s price is a key determinant of their purchase intentions. This raises several questions that invite closer examination. Do price conscious consumers’ visual attention to in-store promotions and prices vary from non-price conscious consumers? Are price conscious consumers more or less attentive to the price attribute than non-price product attributes? How does this visual attention influence price conscious consumers’ purchasing decisions? Understanding the relationship between price consciousness, visual attention, and purchasing behavior could lead to more effective price communications and in-store promotions, especially in retail outlets that target price conscious consumers (e.g., stores using everyday low price [EDLP] pricing strategies). In this manuscript, we address these questions by investigating the relationship between consumers’ price consciousness and visual attention to in-store price and non-price attribute signs on ornamental plants using a conjoint analysis paired with an eye tracking experiment.
Economic theory states there is a negative relationship between higher prices and purchase likelihood. Price is an important attribute in consumers’ decision making processes which can encourage [25] or discourage consumption [26,27]. Furthermore, price becomes consumers’ primary information cue when information overload occurs [28].
Existing visual attention research provides mixed results on the relationship between visual attention and price attributes. On the one hand, Chen et al. [29] suggest that participants who spend more time focusing on prices are, typically, more sensitive to price. Similarly, Van Loo et al. [23] show participants’ utility decreases as visual attendance to the price attribute increases and more visual attention to price indicates higher price sensitivity. Based on their estimations, each fixation on price decreases willingness to pay (WTP) by 2.3%, while each second fixation on price decreases WTP by 10.1%. On the other hand, Behe et al. [30] suggest that low involvement consumers are likely more price sensitive and, thus, look at price quicker than highly involved consumers. Huddleston et al. [31] find price information holds more visual attention (as indicated by a greater number of fixations) and that there is a positive relationship between visual attention to price and likelihood to buy.
Surprisingly, little is known about how visual attention to price impacts price conscious consumers’ purchasing behavior in general. An actual price-conscious measurement has yet to be incorporated into these experiments. Studies that address the relationship between price conscious consumers’ visual attention to price information and their purchasing decisions are limited and tend to be auxiliary to the primary focus of the research. For instance, Behe et al. [2] used a cluster analysis and found 16% of their sample was price-oriented and spent more time (in seconds) visually attending price-related horticultural retail displays.

2. Materials and Methods

2.1. Hypotheses Development

To investigate variances between price conscious consumers’ and non-price conscious consumers’ visual attention to product attributes and their subsequent purchase likelihood, four hypotheses were developed and tested in this study. First, since consumers are more visually attentive to subjectively more important attributes [2,29], we hypothesize that price conscious consumers will fixate more on price than non-price attributes (H1a). Price consciousness, by definition, is exclusively concerned with consumers’ focus on searching for and paying a low price [1,5,32], thus, we hypothesize that price conscious consumers will fixate more on price than non-price conscious consumers (H1b). Price theory suggests that price serves as an indicator of the monetary sacrifice for a specific product. The higher the price of a product, ceteris paribus, the less likely a consumer will be to purchase the product. In addition, as ornamental plants (which were used in the eye tracking experiments) are often perceived as luxury products as opposed to necessity goods [33], we further hypothesize that there will be a negative relationship between purchase likelihood and price conscious consumers (H2a) and that there will be a negative relationship between purchase likelihood and visual attention to price (H2b). Lastly, price conscious consumers’ visual attention to price signs will inversely affect their purchase likelihood (H3).

2.2. Recruitment and Sampling

Ninety-five participants were recruited in central Florida through flyers at garden centers, an emailing list, and Facebook advertisements. Participants were prescreened when they signed up for the experiment to ensure that they had purchased ornamental plants in the past 12 months. In-person participation was required to facilitate the use of the eye tracking technology (participants received a compensation of $30 for their time and collaboration at the end of the survey). A sample size of 95 was deemed acceptable since previous studies using eye tracking metrics used far fewer subjects [19,22,34]. Participants were screened to insure they were active purchasers of the study product (ornamental plants). Participants’ average age was 53 years with the majority (66%) being over 50 years old (Table 1). Thirty-nine percent were males and 55.6% earned more than $50,000 at the time of the study. The average household size consisted of approximately two people. Compared to Florida census data, the sample is slightly biased towards females at 61% [35]. However, the sample was considered acceptable since the socio-demographic results are consistent with previous studies in horticulture [2] and representative of the core consumers of ornamental plants [36].

2.3. Price Consciousness Measures

The standard definition of price consciousness in economics refers to the change of consumer demand resulting from a change of price, akin to “price elasticity”. However, research on “price elasticity” is primarily at an aggregate level and cannot account for sensitivity to price changes at an individual level. To measure individual consumers’ level of price consciousness, Lichtenstein et al. [32,37] suggest using a price range or price thresholds to approximate consumers’ reactions towards price changes. Low et al. [38,39] define the degree to which a customer’s buying decisions are based on price-related aspects. Following these ideas, a price consciousness indicator was developed to measure an individual participant’s price consciousness in this study. Specifically, participants indicated if the plant was eliminated from selection when the price, as an important attribute, did not fall into a certain range during their decision-making process for each plant (i.e., elimination strategy). Participants were then divided into two groups where the ‘price conscious’ group consisted of individuals who indicated price was used as an elimination strategy for purchasing decisions and the ‘non-price conscious’ group comprising individuals who did not indicate that price was used as an elimination strategy. In other words, participants utilized a different strategy when deciding whether to purchase the product (elimination and additive strategies were explained to participants prior to answering this question).
Thirty participants (about one-third of the sample) are included in the price conscious group and 66 (two-thirds of the sample) in the not-price conscious group (Table 1). Price conscious consumers are younger, consist of a higher percentage of females, have larger households, and lower incomes than the non-price conscious group. These results align with previous studies showing price-conscious individuals tend to be younger with lower incomes and/or greater financial stressors (such as providing for a larger family) [9,12].

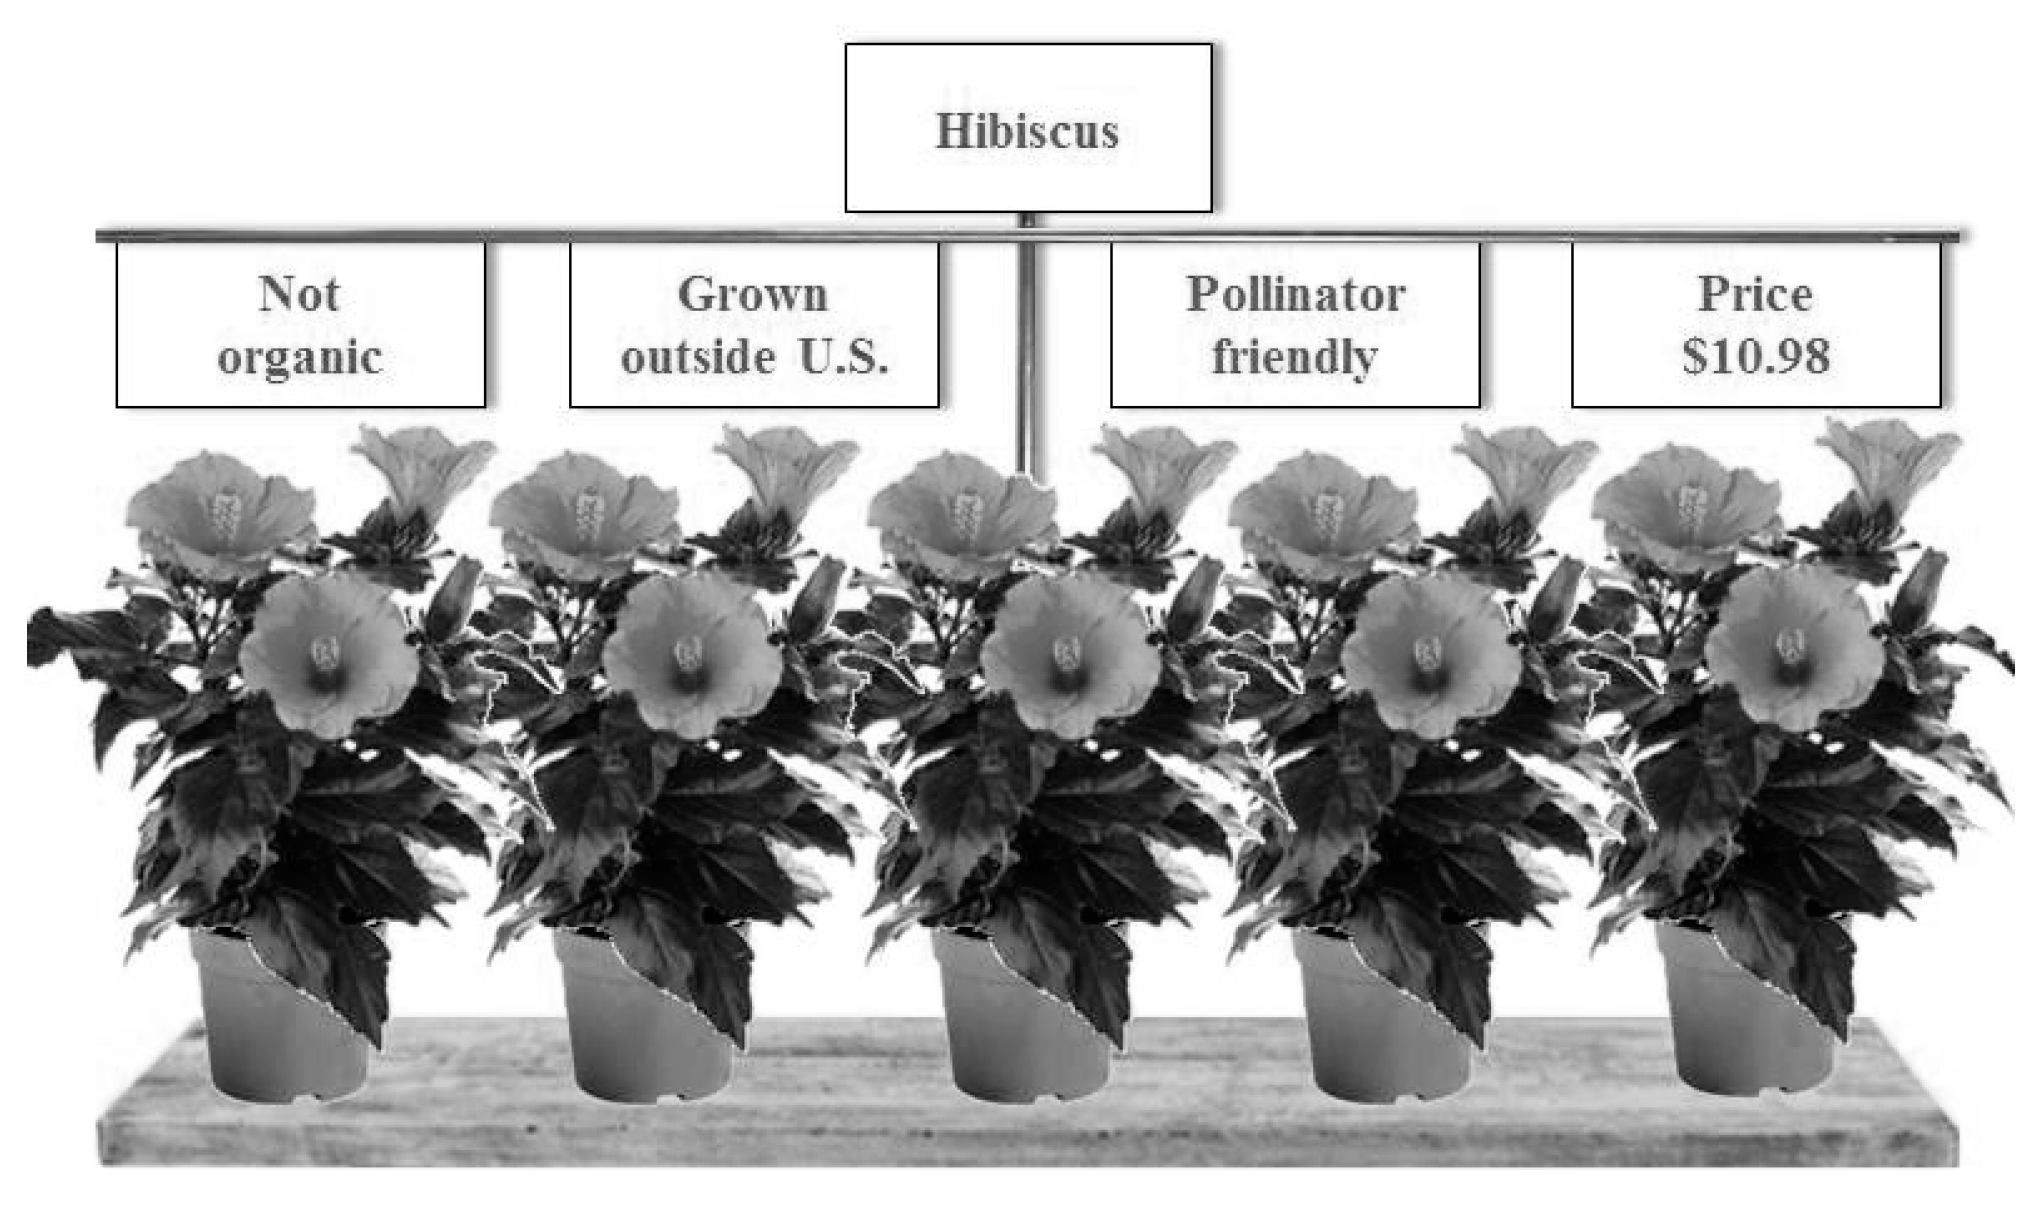
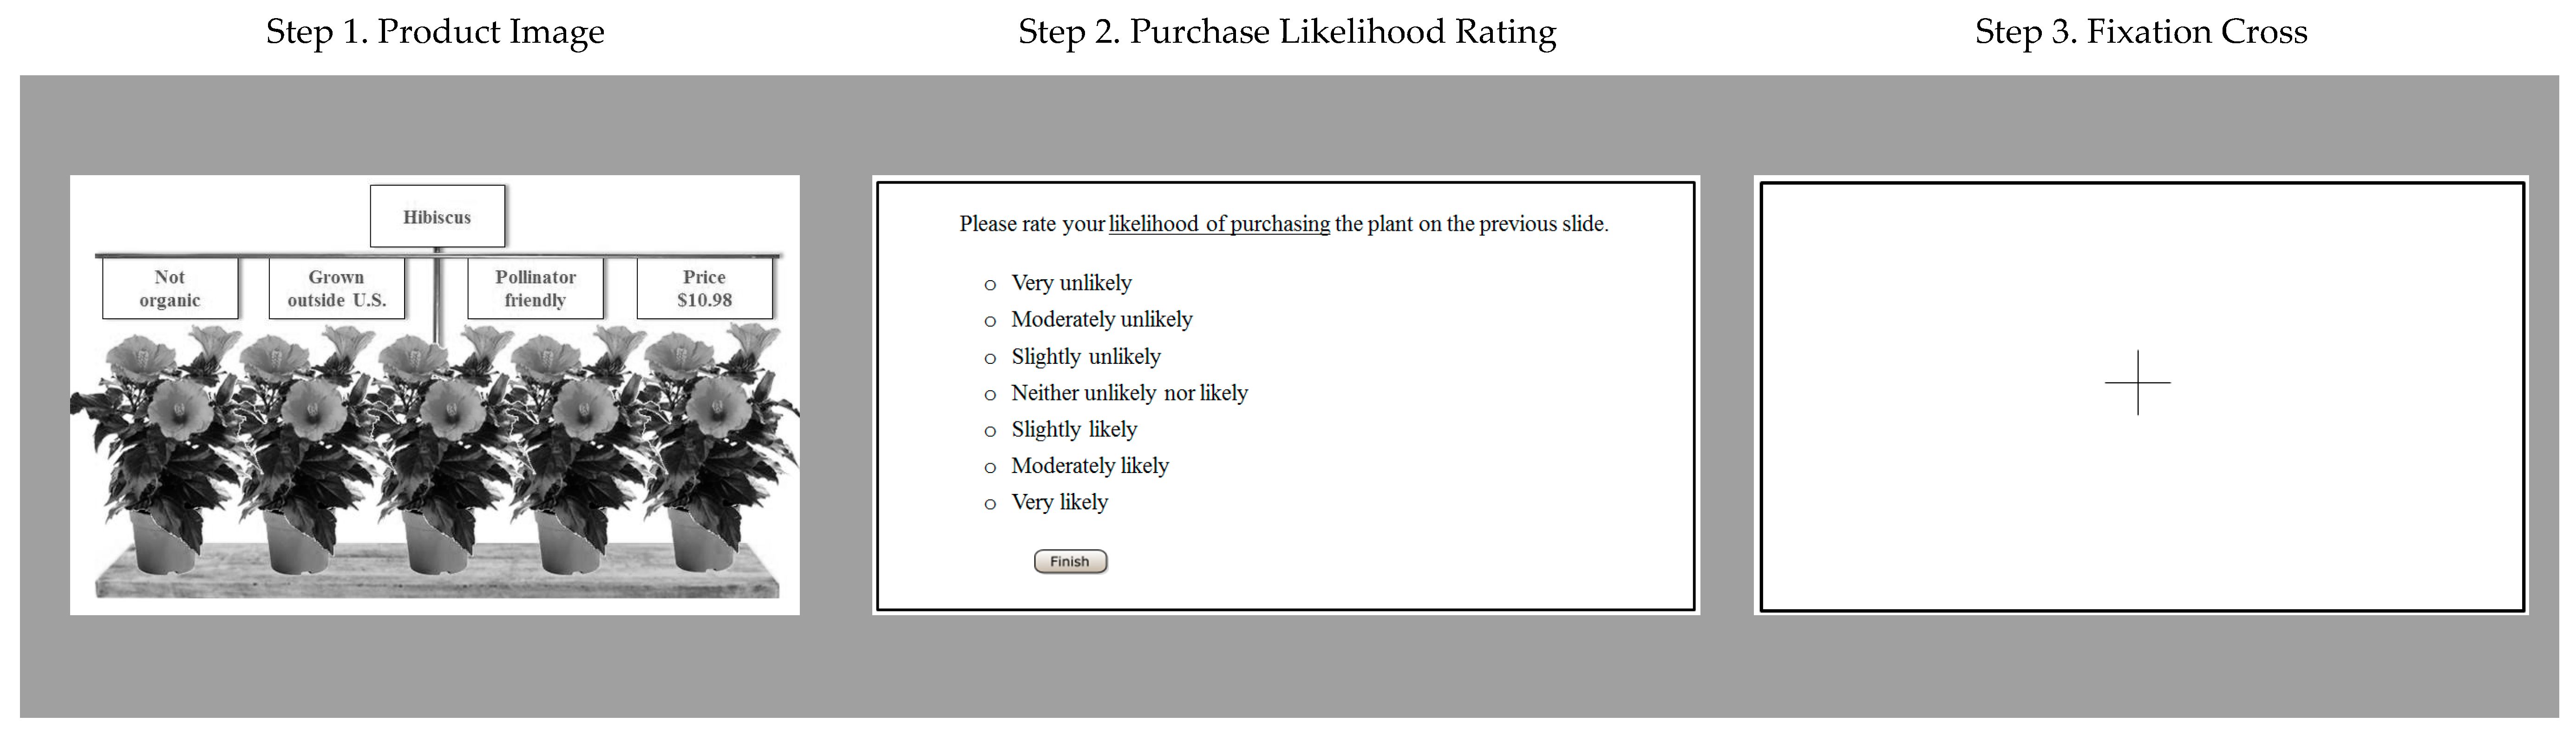
2.4. Conjoint Analysis Experiment Procedure

The Conjoint Analysis (CA) experiment was designed using ornamental landscape plants (i.e., bedding plants, flowering annuals, and perennials) as the product, since they generated the most plant sales in Florida in 2013 [40]. Additionally, plants were selected as a product because they typically are sold with very little in-store signage and limited brand promotions [41]. Consequently, participants’ preconceptions about the products are more limited than highly branded or promoted products. Several species of plants (petunias, pentas, and hibiscus) were included in the analysis to account for differences in individual preferences (Table 2). To simulate a common retail garden center display, five plants were presented on a bench, with additional attributes (i.e., price, production method, origin, and pollinator friendly attributes) being presented as above-plant signs (Figure 1). Previous studies have successfully used this bench/attribute sign design to elicit consumers’ purchasing preferences for ornamental plants [2,42,43].
In this study, three price points ($10.98, $12.98, $14.98) were used based on prices of similar plants in higher end specialty garden centers, as well as lower price points from mass retailers and box stores in the study area (Table 2). Production methods included certified organic, organic production (but not certified), and conventional levels. Origin attributes included in-state, domestic, and imported levels. The pollinator friendly attribute was either labeled or not labeled. Sign order was randomized to eliminate order effect. Production method, origin, and pollinator friendly attributes were included to cover credence attributes that potentially add value to the products [44]. Additional attributes (such as size, care requirements, etc.) were controlled by informing participants that they were consistent across the products. A fractional factorial design was used to generate 16 product images for the Conjoint Analysis (CA) experiment to reduce participant fatigue. Participants rated their purchase likelihood for each product on a 7 point Likert scale (1 = not at all likely; 7 = very likely). While evaluating each product scenario, participants’ eye movements were recorded. Participants also completed a survey with price-conscious and socio-demographic questions.

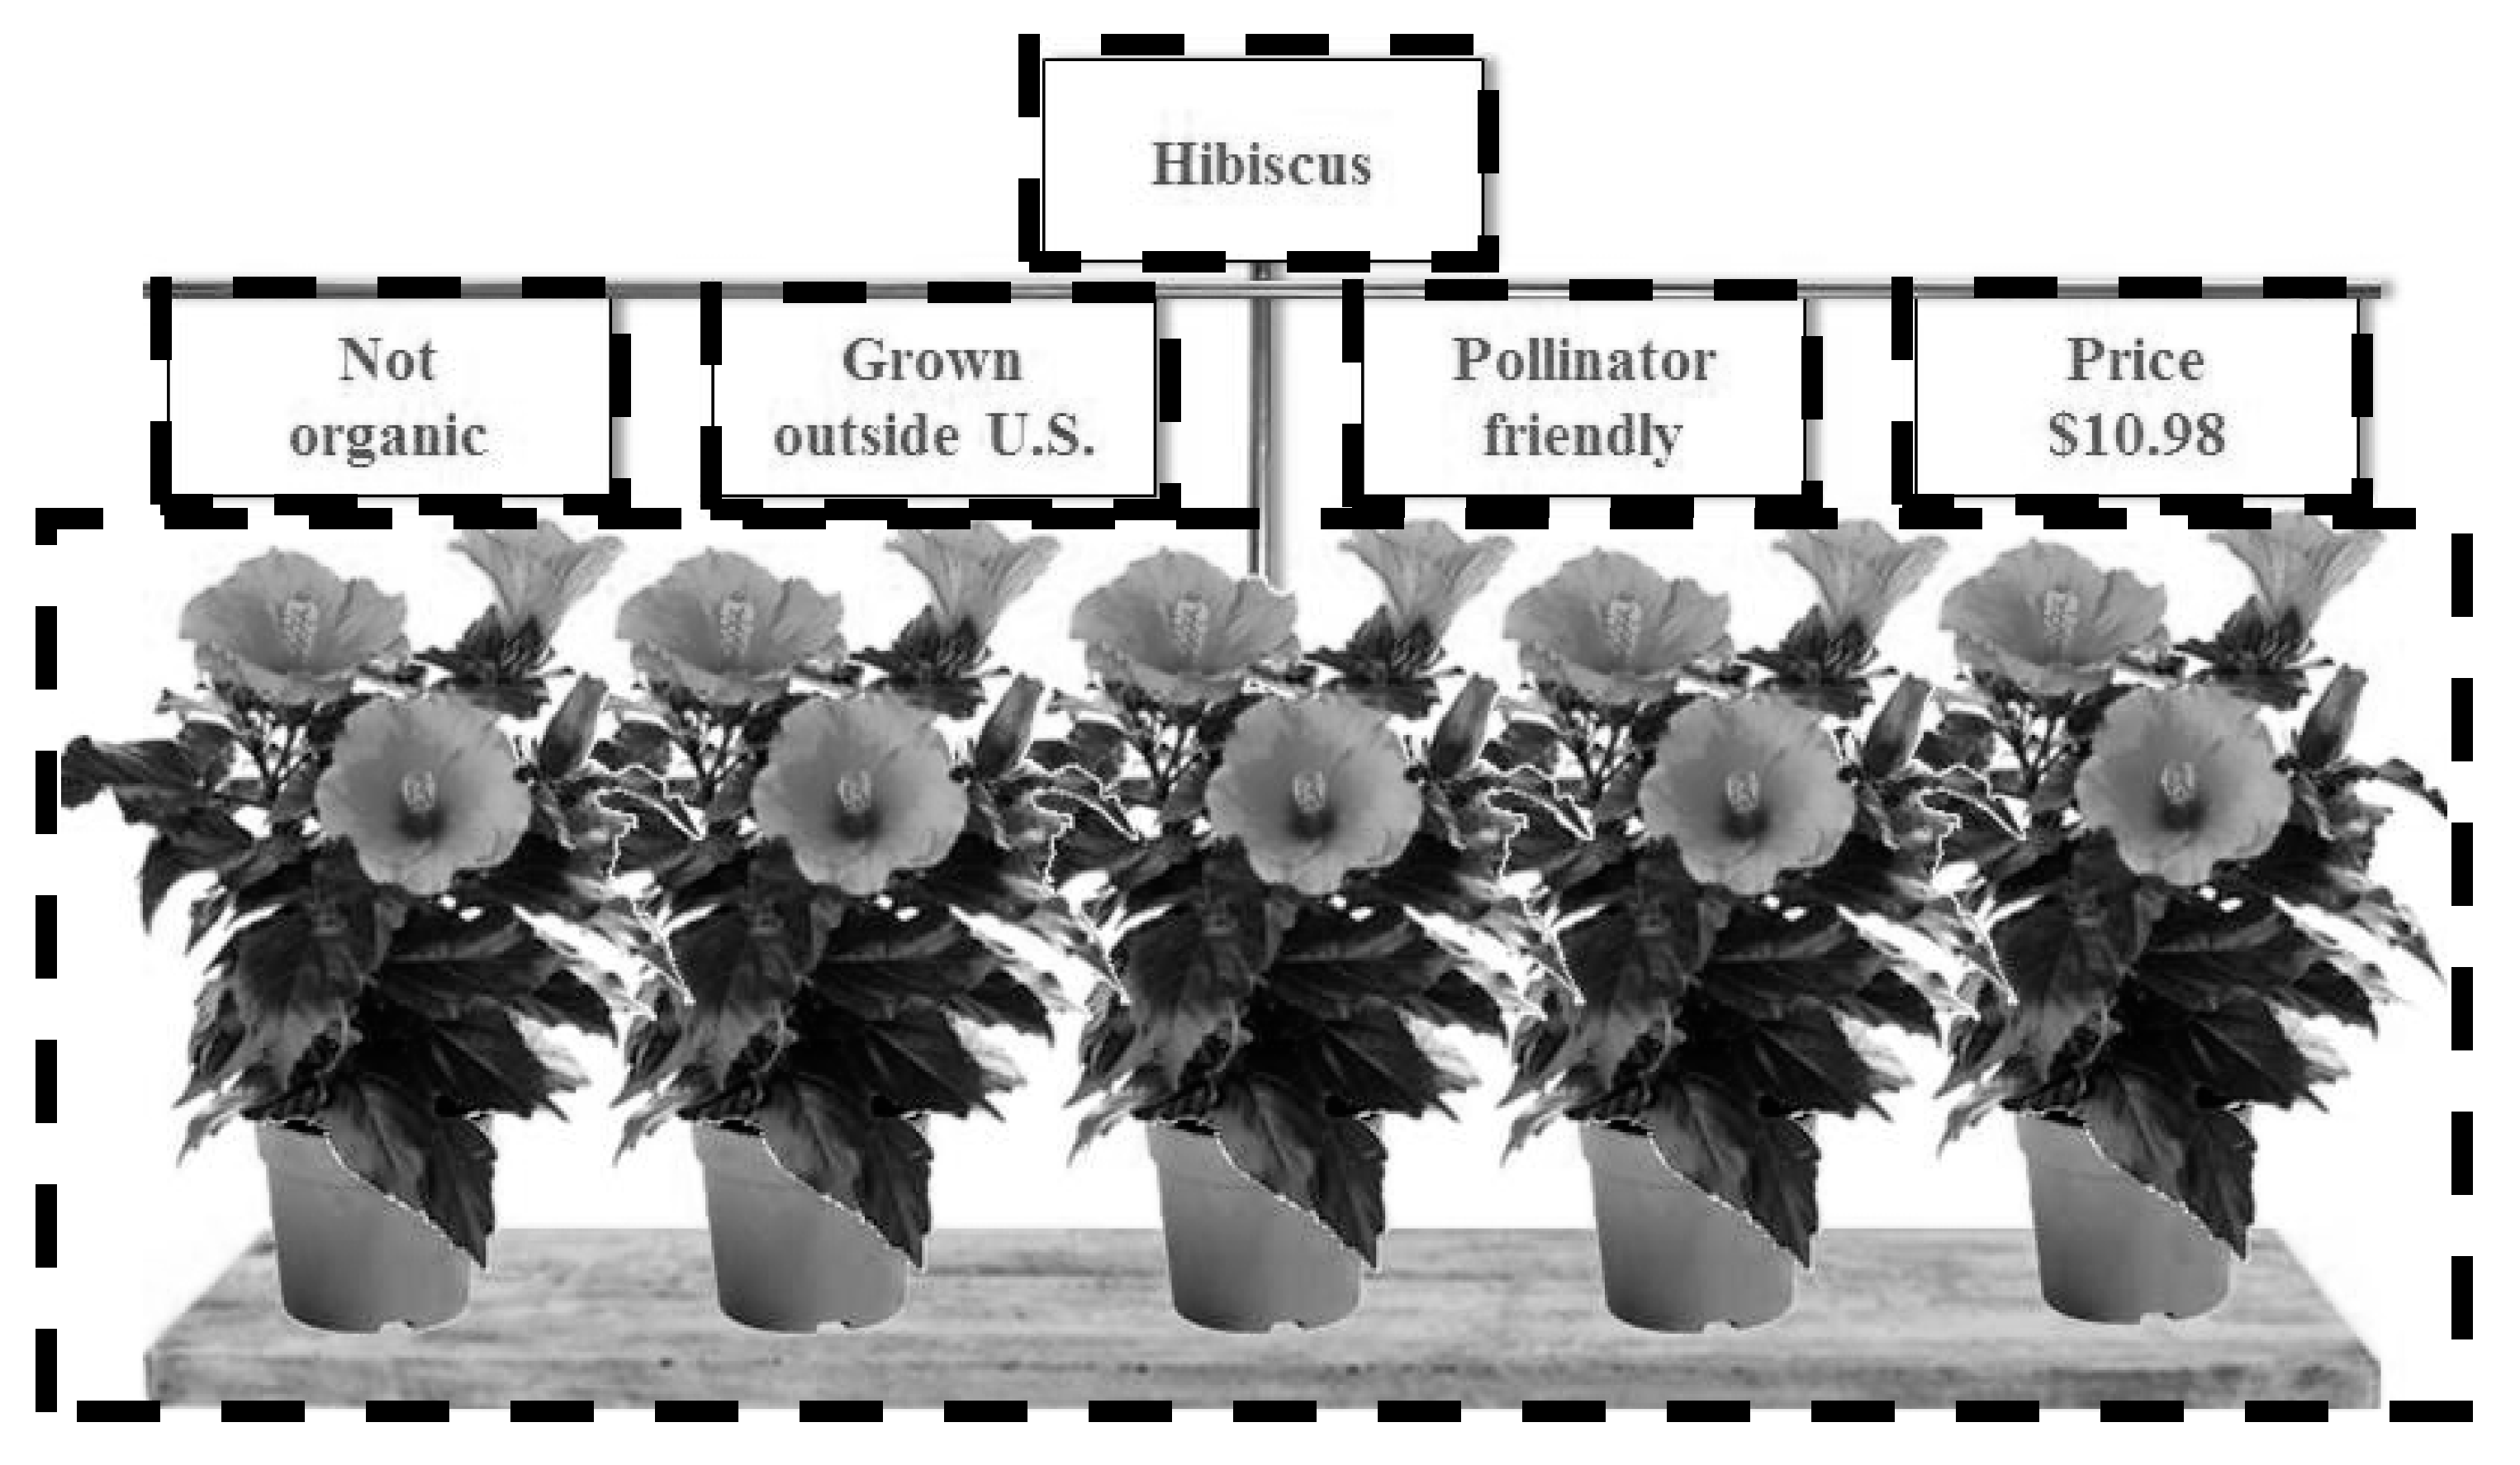
2.5. Eye Tracking Metrics and Procedures

A stationary Tobii X1 Light Eye Tracking camera connected to the base of a computer monitor (22 inch screen with a 1920 × 1080 pixel resolution) was used to record eye movements (Figure 2). Tobii Studio Software (version 3.4.8) was used to present the CA images to participants.
Participants were provided instruction slides describing the experimental procedure followed by an example non-target product (i.e., tomato plant). Each CA scenario consisted of three steps (Figure 3). First, participants viewed the product image and then clicked a mouse key when they were ready to rate their purchase likelihood. Then, participants selected their purchase likelihood for the previously viewed image. Lastly, they were presented with a fixation cross that they focused on for 5 s between the first image and the subsequent image. The fixation cross served to “reset” participants’ visual attention so all participants had the same visual starting point for each image [23,40].
After all participants had completed the experiment, areas of interest (AOI) were used to extract visual attention measures from the product images. Each AOI corresponds to a specific visual of interest (i.e., the product image or an attribute sign; Figure 4). Researchers extracted participants’ fixation count (FC) for each AOI. FC is the total number of eye fixations (when the eye stops and attends to the stimuli) within each AOI. FCs are considered a reliable indicator of participants’ visual attention to stimuli within each AOI [2,23].

2.6. Econometric Model

To investigate how price-conscious consumers may behave differently in term of purchase patterns, we follow Long and Freese’s [45] ordered logit model and post-estimation procedures to estimate predicted probabilities of participants’ purchase likelihood. As shown in Figure 3, the purchase likelihood was measured using a 7-point Likert scale question, with 1 indicating very unlikely to purchase and 7 indicating very likely to purchase. The ordered logit model captures the nature that order of response matters. Let y i be the ordered rating scores of purchase likelihood, which is of interest to explain. y i is assumed to be generated by the underlying linear latent variable model:
y i * = x i β + ε i
where y * is varying from − to , i is the observation, and ε is a random error term. Our observed response categories ( y i ) are linked to the latent variable using the following subsequent measurement model:
y i = { 1   2   7     i f i f i f     κ 0 = y i * < κ 1 κ 1 y i * < κ 2   κ 6 y i * < κ 7 =
where κ are thresholds that once crossed result in a category change. In the rest of the models, i is suppressed. Thus, the probability of observing y = j for given values of x is:
Pr ( y = j | x ) = Pr ( κ j 1 y * < κ j | x )
and j = 1 to J (purchase likelihood rating). Consequently, the predicted probability can be given as:
Pr ( y = j | x ) = F ( κ j x β ) F ( κ j 1 x β )
where F indicates the cumulative distribution function of ε, and for ordered logit the ε is assumed to have a logistic distribution with a mean of 0 and variance of π 2 / 3 .
The dependent variable (purchase likelihood) is a rating score (1 = very unlikely; 7 = very likely) and the key independent variables of interest are the price-consciousness indicator and the FCs on the price sign. Other control variables include plant attributes (plant type, production method, origin) and individual socio-demographics, as well as visual data (fixation counts) on other non-price product attributes.

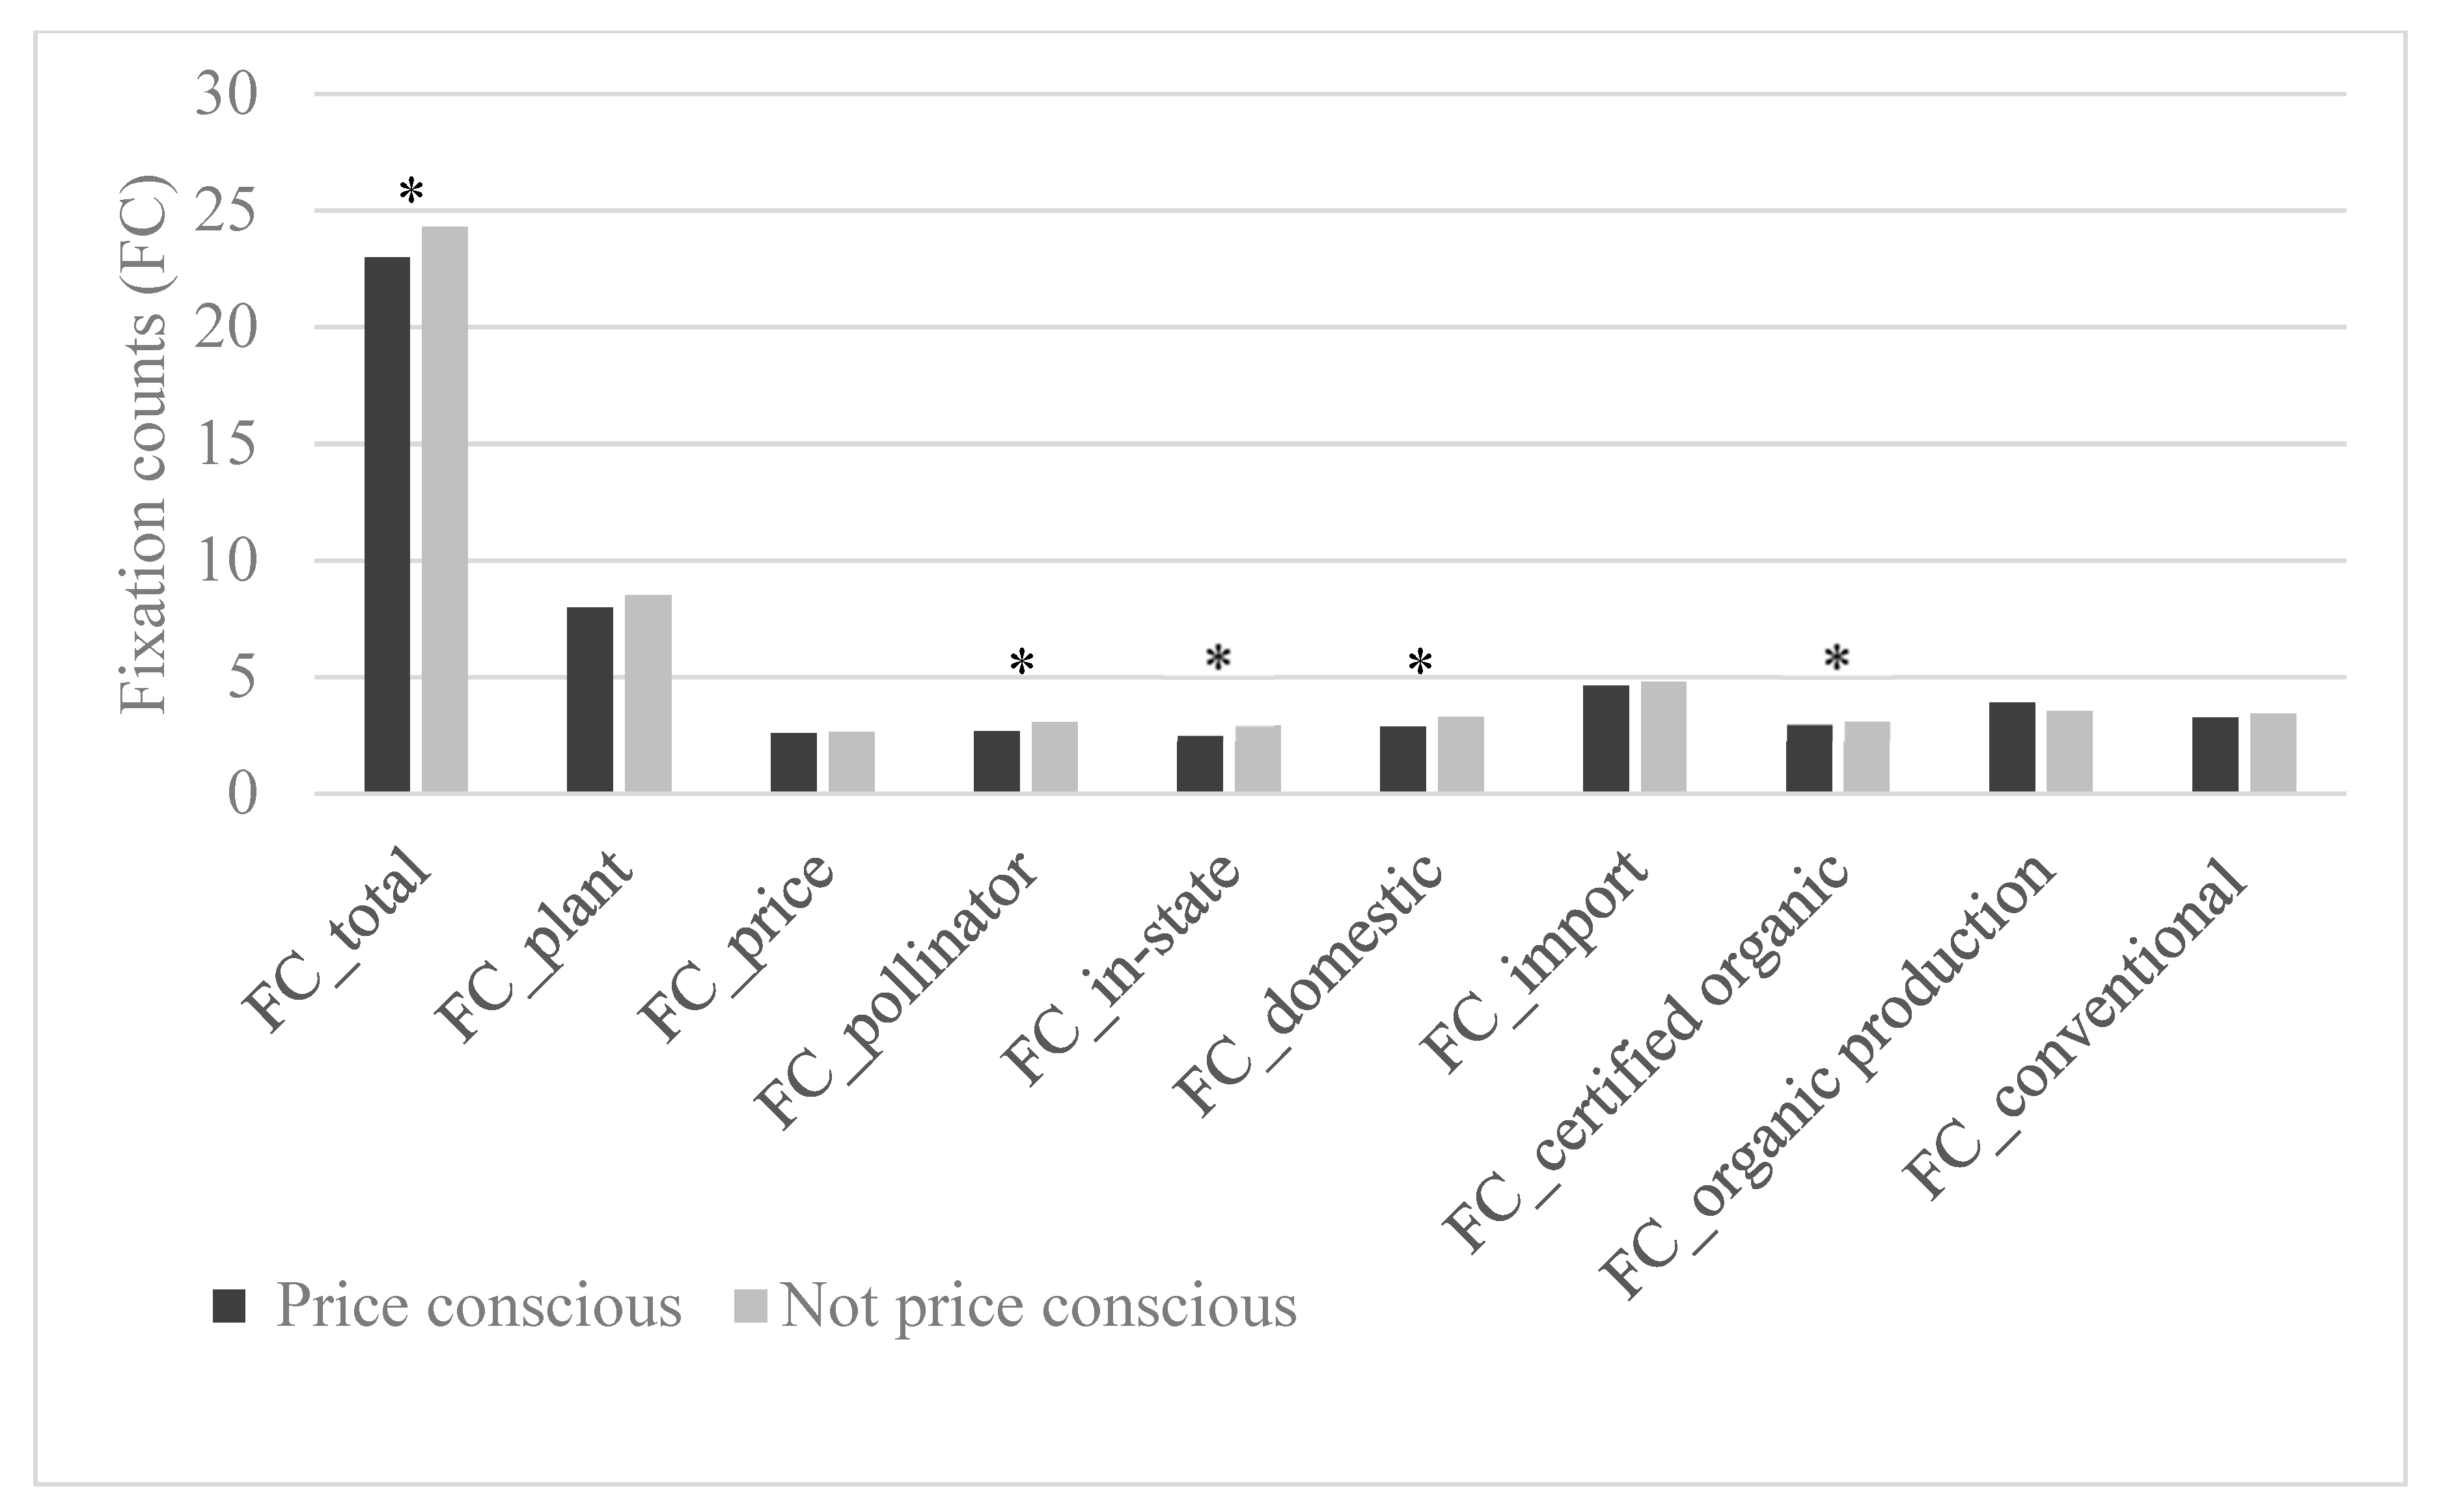
3. Results and Discussion

Prior to regression analysis, we first compare price conscious consumers’ visual attention to price versus non-price attitudes, which were measured by FCs. With a mean FC of 2.6, price conscious consumers are typically less attentive to price than non-price attributes (compared to a mean FC of 3.3 across non-price attributes). The paired t-test statistic for each pair of price and non-price attributes (including pollinator friendly, production method, and origin) comparison is significant at 1% significant level except for when price and in-state attributes are compared. This result contradicts Hypothesis H1a that price conscious consumers would fixate more on price than non-price attributes. Further, a direct comparison of price-conscious and non-price conscious consumers’ FCs is provided in Figure 5. Overall, price conscious consumers spend less time fixating on the total image, products, prices, origins, certified organic, and conventional signs than the non-price conscious group, except for the organically produced sign. The mean FC for non-price conscious consumers is 2.7, which is slightly more than that of the price-conscious group (2.6). Nonetheless, the difference is not statistically significant (pairwise t-test static is 1.20 with a p-value of 0.23). This result does not support Hypothesis H1b that price conscious consumers fixate more on price than non-price conscious consumers. Although there is no significant difference in terms of visual attention on price between price-conscious and non-price conscious groups, price conscious consumers tend to be more efficient (i.e., have fewer total fixations and fewer fixations on price and other attributes) than non-price conscious consumers when determining their purchase likelihood. Since price conscious consumers value price over other attributes [2,12], this may reduce their visual consideration time on different attributes because the attributes are less important than price. Alternatively, the price conscious consumers may have been quicker decision makers due to having preexisting reference prices and price cut-off values. Preexisting cut-off values streamlines the decision making process because if the product does not align with the reference prices, the product is eliminated from the choice set [46].
To fully explore price conscious consumers’ purchasing decisions and test Hypotheses H2a, H2b, and H3, three different specifications of the ordered logit model are estimated. Baseline Specification 1 includes only the price-conscious indicator, plant attributes, and individual demographic information. Specification 2 and Specification 3 add visual attention variables (model 2) and interaction terms between price-conscious indicators to test H2a and H2b, and visual attention variables (model 3) to test H3, respectively. Recent studies have shown attention (i.e., visual attention) provides an additional explanation for how consumers selectively process product information and is a crucial aspect that should be considered when analyzing individual choice behavior, including purchasing decisions [24,29]. The interaction terms between the price-conscious indicator and visual attention variables, specifically, the interaction between the price conscious indicator and FCs on price (PC × FC price), further distinguishes price conscious consumers from non-price conscious consumers to test H3. Indicated by the lower Bayesian Information Criterion (BIC) and Akaike Information Criterion (AIC) values (Table 3), Specification 2 and Specification 3 have largely improved the model fit and model explanation power by incorporating visual attention data.
Regression results (Table 3) from the ordered logit model indicate that price conscious consumers are significantly less likely to purchase plants in comparison with non-price conscious consumers regardless of the model specification, supporting Hypothesis H2a. The average marginal effect based on Specification 1 indicates that a price conscious consumer, ceteris paribus, is 1.6 percentage points more likely to rate themselves as “very unlikely” to purchase a plant, while 4.4 percentage points less likely to rate themselves as “very likely” to purchase a plant. In addition, plant attributes (plant type, price, pollinator friendly, production method, and origin), respondents’ social-demographic characteristics, and visual attention variables all influence the purchase likelihood. Respondents are more likely to purchase hibiscus and pentas plants than petunia plants. As expected, price is negatively associated with purchase likelihood. Consistent with previous empirical evidence [47,48,49,50], we also find that consumers value products “being green” or sustainable. Particularly, the pollinator friendly attribute increases consumers’ purchase intention. Respondents are also more likely to purchase certified organic or organically produced plants than conventionally produced plants. Regarding origin, in-state and domestically grown plants are preferred to imported plants.
In terms of social-demographic characteristics, we find purchase likelihood increases with age. Male participants are more likely to purchase products than females as shown by the positive coefficient estimates across all specifications. Respondents with higher incomes are more likely to purchase products than respondents with lower incomes. Conversely, having a larger household size discourages purchase likelihood.
The visual attention data indicates there are statistically significant relationships between price consciousness, fixations, and purchase likelihood (Specification 2, Table 3). After controlling for consumers’ visual attention, the negative impact of the price-conscious indicator on purchase likelihood remains statistically significant. Consistent with price theory and existing empirical evidence (e.g., Chen et al. [29]), increasing visual attention to the price sign discourages the likelihood of purchase, supporting Hypothesis H2b. Meanwhile, we find several positive relationships between consumers’ visual attention to non-price attributes and their purchase likelihood. For example, more FCs on attribute signs, such as pollinator friendly, production method, and grown outside the United States, increases purchase likelihood. These results are in line with Van Loo et al. [23], finding that consumers fixate more on attributes that they value more and, thus, are more likely to purchase them.
The complete relationship between price consciousness, visual consideration, and purchase likelihood is captured by Specification 3 (Table 3). The impact of how increasing/decreasing visual attention to the price attribute may further affect price conscious consumers’ purchase likelihood, which is our primary interest, is jointly determined by the coefficients in front of FCs of price (FC_ price) and the interaction term between the price-conscious indicator and FCs of price (PC × FC_price). Both coefficients are negative and statistically significant, suggesting that increasing visual attention on the price attribute will further reduce price conscious consumers’ purchase likelihood. This result is in support of Hypothesis 3, which states that price conscious consumers’ visual attention to price signs will inversely affect their purchase likelihood.
In addition, price conscious consumers who fixate on the product longer are less likely to purchase. Although FCs on the pollinator friendly attribute, in general, increases purchase likelihood, for price conscious consumers, more fixations corresponds with a decreased likelihood of purchase. The interaction terms between the price-conscious indicator and FCs on the three production methods (certified organic, organically produced, conventional) are not statistically significant, indicating that additional visual attention to production methods did not affect price conscious consumers’ purchase decisions. In other words, visual attention does not differentiate the price-conscious group of consumers from their counterparts in terms of preferences for production methods. Nonetheless, we do find, interestingly, that price conscious consumers with increased visual consideration of the domestic and import origins are more likely to purchase the products. This result may be related to perceived price, since consumers are often willing to pay premiums for locally produced (‘in-state’) products [51,52]. Thus, domestic or import origins would likely be considered the less expensive options by price conscious consumers. The visual attention results indicate that product attributes, which are perceived as “less expensive”, may improve price conscious consumers’ visual consideration and, ultimately, purchase likelihood.

4. Conclusions

Cumulatively, when examining price conscious consumers’ purchase likelihood and visual attention behavior, several patterns emerge. First, price conscious consumers typically pay less visual attention to price than other non-price information, such as plant type, production method, and origin. Compared to non-price conscious consumers, price conscious consumers spend less time on the price attribute and less time evaluating the products (in general). This may indicate that they are faster decision makers or have preconceived reference points for the various attributes that improve their speed of decision making. Second, for price conscious consumers, greater visual attention to product price information leads to a lesser purchase likelihood. As suggested by Chen et al. [29], price sensitive consumers generally spend more time visually attending to the price attribute. Our results further refine their conclusion by demonstrating that longer fixations on the price information increases price conscious consumers’ price sensitivity and, thus, reduces their likelihood to buy. To the best of our knowledge, this is the first study to explore how price conscious consumers perceive and react to prices differently from non-price conscious consumers. The extent to which price conscious consumers consider the price attribute of products when shopping is important from the consumer welfare perspective.
A third pattern is that the relationship between visual attention to ‘less desirable’ and, potentially, ‘less expensive’ options (e.g., domestic origins, import origins) improved price conscious consumers’ purchase likelihood. This study does not delve into these motives, but they invite attention to potential reasons behind price conscious consumers’ visual attention to various products/product attributes and suggests directions for future studies. Our results also have important implications for retailers. Retailers who are interested in targeting price conscious consumers and triggering them to buy should avoid promoting attributes that are perceived as more expensive (e.g., organic, local, etc.).
Despite providing interesting insights into price conscious consumers’ visual and purchasing behavior, the present study does have several limitations that must be mentioned. First, to facilitate eye tracking, a localized sample was used. Consequently, generalizing the results to the general population should be done cautiously. Secondly, only one type of product (i.e., ornamental plants) was tested in the present study. Results will likely vary for products that are not perceived as luxury goods. Lastly, to reduce other visual inconsistencies, the experiment was conducted in a lab setting and is subject to biases typical to lab experiments. However, the lab setting provided the benefits of visual, locational, and methodological consistency, all of which become much more variable and inconsistent in a real retail setting. Conducting a comparative experiment in a retail center is one means of overcoming this bias in future experiments.
This study serves as a launching point for future studies addressing decision making styles and visual attention to in-store stimuli. For instance, future studies could use a similar methodology with frequently purchased necessities (i.e., bread, milk, etc.) to see how results change based on product type. Future studies could also assess how results vary based on experimental location (e.g., retail, lab, etc.) Finally, additional studies could build on the present study by introducing pricing promotion strategies and styles (e.g., sign size/color, type, etc.) to determine price conscious consumers’ purchasing behavior based on those visual stimuli.

Author Contributions

Project design and research questions development: H.K. and A.R.; Data collection: H.K. and A.R.; Data analysis: A.R., H.K., and X.W.; Manuscript preparation: A.R.; Editing manuscript: A.R., H.K., and X.W.

Funding

This research was funded by the Florida Department of Agriculture and Consumer Services.

Conflicts of Interest

The authors declare no conflict of interest.

References

  1. Alford, B.L.; Biswas, A. The effects of discount level, price consciousness and sale proneness on consumers’ price perception and behavioral intention. J. Bus. Res. 2002, 55, 775–783. [Google Scholar] [CrossRef]
  2. Behe, B.K.; Campbell, B.; Khachatryan, H.; Hall, C.H.; Dennis, J.H.; Huddleston, P.T.; Fernandez, R.T. Incorporating eye tracking technology and conjoint analysis to better understand the green industry consumer. HortScience 2014, 49, 1550–1557. [Google Scholar]
  3. Han, S.; Gupta, S.; Lehmann, D.R. Consumer price sensitivity and price thresholds. J. Retail. 2001, 77, 435–456. [Google Scholar] [CrossRef]
  4. Lichtenstein, D.R.; Netemeyer, R.G.; Burton, S. Distinguishing coupon proneness from value consciousness: An acquisition-transaction utility theory perspective. J. Mark. 1990, 54, 54–67. [Google Scholar] [CrossRef]
  5. Lichtenstein, D.R.; Ridgway, N.M.; Netemeyer, R.G. Price perceptions and consumer shopping behavior: A field study. J. Mark. Res. 1993, 30, 234–245. [Google Scholar] [CrossRef]
  6. Sinha, I.; Batra, R. The effect of consumer price consciousness on private label purchase. Int. J. Res. Mark. 1999, 16, 237–251. [Google Scholar] [CrossRef]
  7. Sproles, G.B. From perfectionism to fadism: Measuring consumers’ decision-making styles. Proc. Am. Council Consum. Interests 1985, 31, 79–85. [Google Scholar]
  8. Hafstrom, J.L.; Jung, S.C.; Chung, Y.S. Consumer decision-making styles: Comparison between United States and Korean young consumers. J. Consum. Aff. 1992, 26, 146–158. [Google Scholar] [CrossRef]
  9. Kim, B.; Srinivasan, K.; Wilcox, R.T. Identifying price sensitive consumers: The relative merits of demographic vs. purchase pattern information. J. Retail. 1999, 75, 173–193. [Google Scholar] [CrossRef]
  10. Sproles, G.B.; Kendall, E.L. A short test of consumer decision-making styles. J. Consum. Aff. 1987, 5, 7–14. [Google Scholar]
  11. Hoch, S.J.; Kim, B.; Montgomery, A.L.; Rossi, P.E. Determinants of store-level price elasticity. J. Mark. Res. 1995, 32, 17–29. [Google Scholar] [CrossRef]
  12. Wakefield, K.L.; Inman, J.J. Situational price sensitivity: The role of consumption occasion, social context and income. J. Retail. 2003, 79, 199–212. [Google Scholar] [CrossRef]
  13. Martínez, E.; Montaner, T. The effect of consumer’s psychographic variables upon deal-proneness. J. Retail. Consum. Serv. 2006, 13, 157–168. [Google Scholar] [CrossRef]
  14. Inglehart, R. Culture Shift in Advanced Industrial Society; Princeton University Press: Princeton, NJ, USA, 1990. [Google Scholar]
  15. Ofir, C. Reexamining latitude of price acceptability and price thresholds: Predicting basic consumer reaction to price. J. Consum. Res. 2004, 30, 612–621. [Google Scholar] [CrossRef]
  16. Elitzak, H. Food Cost Review, 1950–1997; Report No. 780, USDA Agricultural Economic Report; Economic Research Service: Washington, DC, USA, 1999. [Google Scholar]
  17. Balcombe, K.; Bitzios, M.; Fraser, I.; Haddock-Fraser, J. Using attribute importance rankings within discrete choice experiments: An application to valuing bread attributes. J. Agric. Econ. 2014, 65, 446–462. [Google Scholar] [CrossRef] [Green Version]
  18. Bundesen, C. A Theory of visual attention. Psychol. Rev. 1990, 97, 523–547. [Google Scholar] [CrossRef] [PubMed]
  19. Reutskaja, E.; Nagel, R.; Camerer, C.F.; Rangel, A. Search dynamics in consumer choice under time pressure: An eye-tracking study. Am. Econ. Rev. 2011, 101, 900–926. [Google Scholar] [CrossRef]
  20. Arieli, A.; Ben-Ami, Y.; Rubinstein, A. Tracking decision makers under uncertainty. Am. Econ. J. Microecon. 2011, 3, 68–76. [Google Scholar] [CrossRef]
  21. Russo, J.E.; Leclerc, F. An eye-fixation analysis of choice processes for consumer nondurables. J. Consum. Res. 1994, 21, 274–290. [Google Scholar] [CrossRef]
  22. Van Loo, E.J.; Nayga, R.M.; Seo, H.S.; Verbeke, W. Visual Attribute Non-Attendance in a Food Choice Experiment: Results From an Eye-Tracking Study; Agricultural and Applied Economics Association Annual Meeting: Minneapolis, MN, USA, 2014. [Google Scholar]
  23. Van Loo, E.J.; Caputo, V.; Nayga, R.M.; Seo, H.S.; Zhang, B.; Verbeke, W. Sustainability labels on coffee: Consumer preferences, willingness-to-pay and visual attention to attributes. Ecol. Econ. 2015, 118, 215–225. [Google Scholar] [CrossRef]
  24. Orquin, J.L.; Loose, S.M. Attention and choice: A review on eye movements in decision making. Acta Psychol. 2013, 144, 190–206. [Google Scholar] [CrossRef] [PubMed] [Green Version]
  25. Chandon, P.; Wansink, B.; Laurent, G. A benefit conguency framework of sales promotion effectiveness. J. Mark. 2000, 64, 65–81. [Google Scholar] [CrossRef]
  26. Aschemann-Witzel, J.; Zielke, S. Can’t buy me green? A review of consumer perceptions of and behavior toward the price of organic food. J. Consum. Aff. 2017, 51, 211–251. [Google Scholar] [CrossRef]
  27. Magnusson, M.K.; Arvola, A.; Hursti, U.K.; Åberg, L.; Sjödén, P. Attitudes Towards Organic Foods Among Swedish Consumers. Br. Food J. 2001, 103, 209–226. [Google Scholar] [CrossRef]
  28. Grebitus, C.; Seitz, C. Relationship between attention and choice. In Proceedings of the European Association of Agricultural Economists 2014 Congress “Agri-Food and Rural Innovations for Healthier Societies”, Ljubljana, Slovenia, 26–29 August 2014. [Google Scholar]
  29. Chen, Y.; Caputo, V.; Nayga, R.M., Jr.; Scarpa, R.; Fazli, S. How visual attention affects choice outcomes: An eye tracking study. In Proceedings of the 3rd International Winter Conference on Brain-Computer Interface, Sabuk, Korea, 12–14 January 2015. [Google Scholar]
  30. Behe, B.K.; Bae, M.; Huddleston, P.T.; Sage, L. The effect of involvement on visual attention and product choice. J. Retail. Consum. Serv. 2015, 24, 10–21. [Google Scholar] [CrossRef]
  31. Huddleston, P.; Behe, B.K.; Minahan, S.; Fernandez, R.T. Seeking attention: An eye tracking study of in-store merchandise displays. Int. J. Ret. Dist. Manag. 2015, 43, 561–574. [Google Scholar] [CrossRef]
  32. Lichtenstein, D.R.; Bloch, P.H.; Black, W.C. Correlates of price acceptability. J. Consum. Res. 1988, 15, 243–252. [Google Scholar] [CrossRef]
  33. Schimmenti, E.; Galati, A.; Borsellino, V.; Ievoli, C.; Lupi, C.; Tinervia, S. Behaviour of consumers of conventional and organic flowers and ornamental plants in Italy. HortScience 2013, 41, 162–171. [Google Scholar]
  34. Reisen, N.; Hoffrage, U.; Mast, F.W. Identifying decision strategies in a consumer choice situation. Judgm. Decis. Mak. 2008, 3, 641–658. [Google Scholar]
  35. U.S. Census Bureau. State & County QuickFacts. 2014. Available online: http://quickfacts.census.gov/qfd/states/12000.html (accessed on 2 January 2018).
  36. National Gardening Association. The Impact of Home and Community Gardening in America; Butterfield, B., Ed.; National Gardening Association, Inc.: South Burlington, VT, USA, 2009; pp. 1–17. [Google Scholar]
  37. Kalyanaram, G.; Little, J.D.C. An empirical analysis of latitude of price Acceptance in consumer package goods. J. Consum. Res. 1994, 21, 408–418. [Google Scholar] [CrossRef]
  38. Low, W.; Lee, J.; Cheng, S. The link betweeen customer satisfaction and price sensitivity: An investigation of retailing industry in Taiwan. J. Retail. Consum. Serv. 2013, 20, 1–10. [Google Scholar] [CrossRef]
  39. Stock, R.M. Can customer satisfaction decrease price sensitivity in business-to-business markets? J. Bus.-to-Bus. Mark. 2005, 12, 59–87. [Google Scholar] [CrossRef]
  40. Hodges, A.W.; Khachatryan, H.; Hall, C.R.; Palma, M.A. Production and marketing practices and trade flows in the United States Green Industry in 2013. J. Environ. Hortic. 2015, 33, 125–136. [Google Scholar]
  41. Collart, A.J.; Palma, M.A.; Hall, C.R. Branding awareness and willingness-to-pay associated with the Texas Superstar™ and Earth-Kind™ Brands in Texas. HortScience 2010, 45, 1226–1231. [Google Scholar]
  42. Behe, B.K.; Zhao, J.; Sage, L.; Huddleston, P.T. Minahan, S. Display signs and involvement: The visual path to purchase intention. Int. Rev. Retail. Dist. Consum. Res. 2013, 23, 189–203. [Google Scholar]
  43. Behe, B.K.; Fernandez, R.T.; Huddleston, P.T.; Minahan, S.; Getter, K.L.; Sage, L.; Jones, A.M. Practical field use of eye-tracking devices for consumer research in the retail environment. HortTechnology 2013, 23, 517–524. [Google Scholar]
  44. Hall, C.R.; Dickson, M.W. Economic, environmental, and health/well-being benefits associated with green industry products and services: A review. J. Environ. Hortic. 2011, 29, 96–103. [Google Scholar]
  45. Long, J.S.; Freese, J. Regression Models for Categorical Dependent Variables Using STATA; A Stata Press Publication, StataCorp, LP: College Station, TX, USA, 2006. [Google Scholar]
  46. Schiffman, L.G.; Kanuk, L.L. Consumer Behavior, 9th ed.; Prentice-Hall, Inc.: Upper Saddle River, NJ, USA, 2007; pp. 177–178. [Google Scholar]
  47. Dagher, G.; Itani, O. Factors influencing green purchasing behaviour: Empirical evidence from the Lebanese consumers. J. Consum. Behav. 2014, 113, 188–195. [Google Scholar] [CrossRef]
  48. Khachatryan, H.; Rihn, A.L.; Campbell, B.; Yue, C.; Hall, C.; Behe, B.K. Visual attention to eco-labels predicts consumer preferences for pollinator friendly plants. Sustainability 2017, 9, 1743. [Google Scholar] [CrossRef]
  49. Miller, S.; Tait, P.; Saunders, C.; Dalziel, P.; Rutherford, P.; Abell, W. Estimation of consumer willingness-to-pay for social responsibility in fruit and vegetable products: A cross-country comparison using a choice experiment. J. Consum. Behav. 2017, 16, e13–e25. [Google Scholar] [CrossRef]
  50. Yue, C.; Campbell, B.; Hall, C.R.; Behe, B.K.; Dennis, J.; Khachatryan, H. Consumer preference for sustainable attributes in plants: Evidence from experimenal auctions. Agribusiness 2016, 32, 222–235. [Google Scholar] [CrossRef]
  51. Darby, K.; Batte, M.T.; Ernst, S.; Roe, B. Decomposing local: A conjoint analysis of locally produced foods. Am. J. Agric. Econ. 2008, 90, 476–486. [Google Scholar] [CrossRef]
  52. Onozaka, Y.; McFadden, D.T. Does local labeling complement or compete with other sustainable labels? A conjoint analysis of direct and joint values for fresh produce claims. Am. J. Agric. Econ. 2011, 93, 693–706. [Google Scholar] [CrossRef]
Figure 1. Example of the conjoint analysis product images.
Horticulturae 04 00013 g001
Figure 2. The experimental set-up showing the computer monitor and Eye Tracking camera.
Horticulturae 04 00013 g002
Figure 3. The three-step experimental procedure used for the 16 conjoint analysis scenarios.
Horticulturae 04 00013 g003
Figure 4. Designated areas of interest (indicated by the dashed lines) around the product image and attribute signs.
Horticulturae 04 00013 g004
Figure 5. Mean Fixation Counts, by Price Consciousness. * indicates the mean difference between price conscious and non-price-conscious consumers is significant (p < 0.05) based on pairwise t-test.
Horticulturae 04 00013 g005
Table 1. Socio-demographic characteristics of the sample participants (n = 96).
Overall MeanPrice Conscious MeanNon-Price Conscious Meanp-Value a
(n = 96)(n = 30)(n = 66)
Age (in years)52.547.26754.8790.00
(16.678)(10.554)(16.642)
Male39.6%43.33%37.88%0.04
(48.7)(49.61)(48.53)
Household size1.8542.1331.7270.00
(1.377)(1.589)(1.250)
High income (>$50,000)54.2%46.67%57.58%0.00
(49.8)(49.94)(49.45)
Notes: Standard deviation is reported in parenthesis. a p-value reports the statistical significance of the difference between price conscious consumers and non-price conscious consumers based on paired t-test statistic.
Table 2. Attributes and attribute levels.
AttributesAttribute LevelsDefinition/Description
Plant type aHibiscus
Penta
Petunia b
The type of plant in the scenario image shown to participants.
Price a$10.98
$12.98
$14.98
Price per plant.
PollinatorPollinator friendlyIndicates if the plant benefits pollinators.
No label b
Production methodCertified organicPlants are certified as organically produced.
Organic productionPlants are produced in an organic manner, but are not certified organic.
Not organic (conventional) bPlants are grown using conventional production methods.
OriginIn-state (Fresh from Florida)Plants are produced in Florida
Domestic (Grown in the U.S.)Plants are produced in the U.S.
Imported (Grown outside the U.S.) bPlants are imported from countries outside the U.S.
a Plant types and price points were selected based on products and prices at several retail outlets (i.e., big box stores, independent garden centers, etc.) in the study area. b Indicates base variables.
Table 3. Coefficient estimates of consumers’ purchase likelihood of ornamental horticultural plants from the Ordered Logit Regression Models.
VariableDependent Variable: Purchase Likelihood
Specification 1Specification 2Specification 3
CoefficientStandard Error CoefficientStandard Error CoefficientStandard Error
Price-conscious indicator (PC)−0.290(0.106)***−0.251(0.108)**−0.254(0.114)**
Plant attribute
  Hibiscus0.663(0.116)***0.716(0.120)***0.733(0.121)***
  Penta0.414(0.110)***0.442(0.114)***0.468(0.112)***
  PetuniaBase Base Base
  Price−0.175(0.029)***−0.204(0.030)***−0.208(0.030)***
  Pollinator friendly0.319(0.094)***0.327(0.097)***0.333(0.095)***
  Certified organic0.541(0.115)***0.514(0.118)***0.544(0.120)***
  Organic production0.722(0.125)***0.699(0.128)***0.7333(0.128)***
  ConventionalBase Base Base
  In-state1.061(0.124)***1.156(0.131)***1.222(0.134)***
  Domestic0.817(0.123)***0.922(0.128)***0.972(0.131)***
  ImportBase Base Base
Visual Attention Variables
  FC_product image 0.025(0.009)***0.053(0.011)***
  FC_price −0.049(0.006)***−0.045(0.010)***
  FC_pollinator friendly 0.214(0.070)***0.322(0.086)***
  FC_certified organic 0.208(0.068)***0.367(0.093)***
  FC_organic production −0.064(0.033)*−0.030(0.047)
  FC_conventional 0.159(0.038)***0.168(0.044)***
  FC_in-state −0.033(0.045) −0.027(0.053)
  FC_domestic 0.023(0.048) −0.180(0.062)***
  FC_import 0.199(0.034)***0.037(0.047)
PC interacting with Visual Attention
  PC × FC_product image −0.143(0.024)***
  PC × FC_price −0.411(0.216)*
  PC × FC_pollinator friendly −0.780(0.163)***
  PC × FC_certified organic −0.042(0.157)
  PC × FC_organic production −0.041(0.082)
  PC × FC_conventional −0.135(0.114)
  PC × FC_in-state −0.007(0.127)
  PC × FC_domestic 0.576(0.107)***
  PC × FC_import 0.612(0.087)***
Social-demographics
  Age0.007(0.004)**0.001(0.004) 0.010(0.004)***
  Gender0.243(0.095)**0.211(0.106)**0.205(0.117)*
  High income (>50 k)0.230(0.112)**0.300(0.116)***0.220(0.138)
  Household−0.091(0.038)**−0.164(0.041)***−0.234().047)***
Threshold Parameters a
  Cut 1−3.421(0.483) −3.723(0.536) −3.625(0.559)
  Cut 2−2.233(0.474) −2.444(0.521) −2.265(0.542)
  Cut 3−1.487(0.473) −1.658(0.518) −1.418(0.539)
  Cut 4−1.117(0.472) −1.259(0.516) −0.992(0.538)
  Cut 5−0.106(0.472) −0.139(0.514) 0.191(0.538)
  Cut 61.024(0.473) 1.085(0.514) 1.468(0.541)
Number of Obs.153214721472
Log likelihood−2701.33−2504.89−2443.68
BIC5542.015214.035157.26
AIC5440.655065.784961.37
Notes: Robust standard errors are reported in parenthesis. * p < 0.10; ** p < 0.05; and *** p < 0.001. a Threshold parameters are the estimated cutoff points for the latent variables used to differentiate the various levels of the dependent variable where Pr(y = 0) = Pr(z < cut 1); Pr(y = 1) = Pr (cut 1 < z < cut 2); Pr(y = 7) = Pr (cut 6 < z).

