Article

Coordinated Water–Nitrogen Management for Sustainable Fragrant Pear Production in Arid Regions: Organ Nutrition Regulation and 15N Utilization Optimization


1
College of Water Conservancy & Architectural Engineering, Shihezi University, Shihezi 832000, China
2
Key Laboratory of Cold and Arid Regions Eco-Hydraulic Engineering of Xinjiang Production & Construction Corps, Shihezi 832000, China
3
College of Resources and Environment, Qingdao Agricultural University, Qingdao 266000, China
*
Authors to whom correspondence should be addressed.
Horticulturae 2026, 12(2), 144; https://doi.org/10.3390/horticulturae12020144
Submission received: 22 November 2025 / Revised: 19 January 2026 / Accepted: 21 January 2026 / Published: 27 January 2026
(This article belongs to the Section Fruit Production Systems)

Abstract

The combined challenges of water scarcity and inefficient nitrogen use pose substantial barriers to sustainable agricultural development. Optimizing the coordinated regulation of water and nitrogen resources in fruit trees is essential for promoting water-saving agriculture in drylands. To establish a water and nitrogen collaborative management model for efficient resource utilization, this study conducted a 3-year field experiment examining different irrigation amount (W1: 4500 m3·ha−1, W2: 6000 m3·ha−1, and W3: 7500 m3·ha−1) and nitrogen application rates (N1: 200 kg·ha−1, N2: 300 kg·ha−1, and N3: 400 kg·ha−1), coupled with 15N isotopic labeling, to evaluate the impact of water and nitrogen regulation on the following: (i) the spatial distribution patterns of water and nitrogen in the root zone soil, (ii) dynamic characteristics of water and nitrogen across organs, and (iii) 15N absorption and utilization. The findings revealed that 20–80 cm depth was the key zone for water and nitrogen absorption by roots of pear. The W2 treatment met the optimal irrigation requirement for young pear tree roots and exhibited the optimal dynamic characteristics of water and nitrogen among the newly formed organs. At the end of the growth period, N3 treatment had the highest nitrogen content and the root system was the main organ for nitrogen absorption and storage. Water-saving irrigation coupled with optimized nitrogen application synergistically enhanced the nitrogen accumulation efficiency in fragrant pear. The W2N2 treatment exhibited the highest 15N absorption and utilization rate (40.79%), effectively promoting nitrogen absorption and assimilation, reducing nitrogen losses, and offering valuable insights for advancing sustainable practices in the fruit and forestry industries.

1. Introduction

Water and nitrogen are key factors that limit agricultural productivity and are essential for maintaining the balance of healthy plant growth. Freshwater resources are currently scarce worldwide, with agriculture accounting for over 70% of the global freshwater consumption, significantly impacting human survival and development [1,2]. As perennial water consuming plants, fruit trees can greatly achieve the rational allocation of water resources by applying drip irrigation technology to the production practice of the forestry and fruit industry. Furthermore, as one of the primary sources of global nitrogen pollution, residual nitrogen in agricultural fields not only results in resource waste but also causes severe environmental problems—including water eutrophication, soil acidification, and increased greenhouse gas emissions—through leaching, runoff, and gaseous emissions, which has attracted extensive attention [3,4]. As an essential nutrient for plant development, nitrogen content reflects the physiological health status of the plant organs. However, there are significant variations in the nitrogen-carrying capacities of different plant organs. Excessive nitrogen fertilizer input can lead to nutritional imbalances in plants, resulting in increased residual nitrogen losses and posing severe threats to the environment and human health [5,6]. Optimizing the regulation of water and nitrogen in agriculture not only enhances crop yields and promotes plant biomass accumulation [7] but also improves the average nitrogen-use efficiency of plants, reduces nitrogen losses, and mitigates adverse environmental impacts [8,9]. Therefore, improving the efficiency of water and nitrogen utilization has become a critical scientific challenge that must be addressed to ensure the sustainable development of dryland agriculture.
Fragrant pear, with a long cultivation history in East Asian countries and beyond, is one of the world’s highest yielding fruits [10]. Its global trade has expanded continuously, reaching markets worldwide. In typical semi-arid regions such as Northwest China, however, achieving a high yield and quality includes facing significant resource and environmental challenges. While abundant sunlight and high diurnal temperature variation in these areas favor sugar accumulation and fruit quality development, low annual precipitation and high evaporation rates make water the primary limiting factor. Concurrently, the widespread increase in nitrogen fertilizer application to pursue a high yield further disrupts the internal water and nutrient balance within plant organs. Nitrogen is a fundamental component of key biomolecules in plant organs that directly influences leaves’ structure, functional properties, and stomatal conductance [11]. Nitrogen levels within plant organs are crucial indicators of plant nutritional health, and increasing the nitrogen content in organs can help plants to maintain high productivity under water scarcity [12]. Nitrogen flows within plant organs, and each organ shows dynamic patterns for nitrogen based on the plant’s growth stage and physiological needs [13]. The nitrogen nutrition level in plant organs is positively correlated with the nitrogen application rate. Timely monitoring of the nitrogen nutrition in plant organs provides valuable insights into the health status of plants, aiding in the accurate regulation of fruit tree development to ensure the high yield and quality of the fruit [14,15]. The regulation and utilization of nitrogen in plants are influenced by various factors, including soil nitrogen availability, plant absorption capacity, and distribution of nitrogen within plant tissues [16]. The distribution of nitrogen in the soil significantly affects the nitrogen content of plant organs [17]. The absorption and distribution of nitrogen by plant organs are influenced, in part, by the water content of organs. Water directly affects the water potential and nutrient transport in plants, and tissues must maintain an optimal water state to ensure proper functioning of the plant [18]. This balance plays a crucial role in photosynthesis, energy metabolism, and plant nutrition. The soil moisture status significantly affects the moisture content of plant organs, thereby influencing nitrogen transport and distribution, which can lead to aggregation phenomena [19,20]. Therefore, by regulating irrigation reasonably, it is possible to ensure an optimal water balance in plant organs, thereby enhancing the absorption efficiency of nitrogen by plants and reducing nitrogen loss in orchard ecosystems.
Organ water and nitrogen nutrition are critical indicators of healthy plant development and growth. The proper regulation of water and nitrogen can optimize the functions of various plant organs. Although extensive research has been conducted on the effects of water and nitrogen regulation on fruit tree growth, the dynamics of organ-specific nutrient allocation remain poorly understood in this context. Moreover, the mechanisms of nitrogen utilization regulation in fruit trees under varying environmental conditions require further research. In particular, under drought and water-limited conditions, the interaction between water and nitrogen plays a pivotal role in regulating the coordinated transport of these resources at the organ level, which in turn affects nitrogen-use efficiency in both vegetative and reproductive organs. We hypothesize that appropriate water and nitrogen regulation can optimize the nitrogen uptake process within the soil–plant system in semi-arid regions, ultimately maximizing the resource-use efficiency. Therefore, to establish a water-management collaborative model for efficient resource utilization, a 3-year field experiment (2022–2024) was conducted, using Korla fragrant pear trees as the experimental object. This study aimed to do the following: (i) investigate the impact of water and nitrogen regulation on the spatial distribution of soil moisture and nitrogen in the root zone; (ii) examine the dynamic responses of water and nitrogen nutrition in different organs of fragrant pear to water and nitrogen regulation within a precision control system of drip irrigation; and (iii) employ the 15N isotope labeling technique to analyze the regulation and utilization mechanisms of nitrogen resources in fragrant pears under varying environmental conditions. The ultimate goal is to enhance the sustainable development of the ecological fruit industry in arid regions.

2. Materials and Methods

2.1. Experimental Site Overview

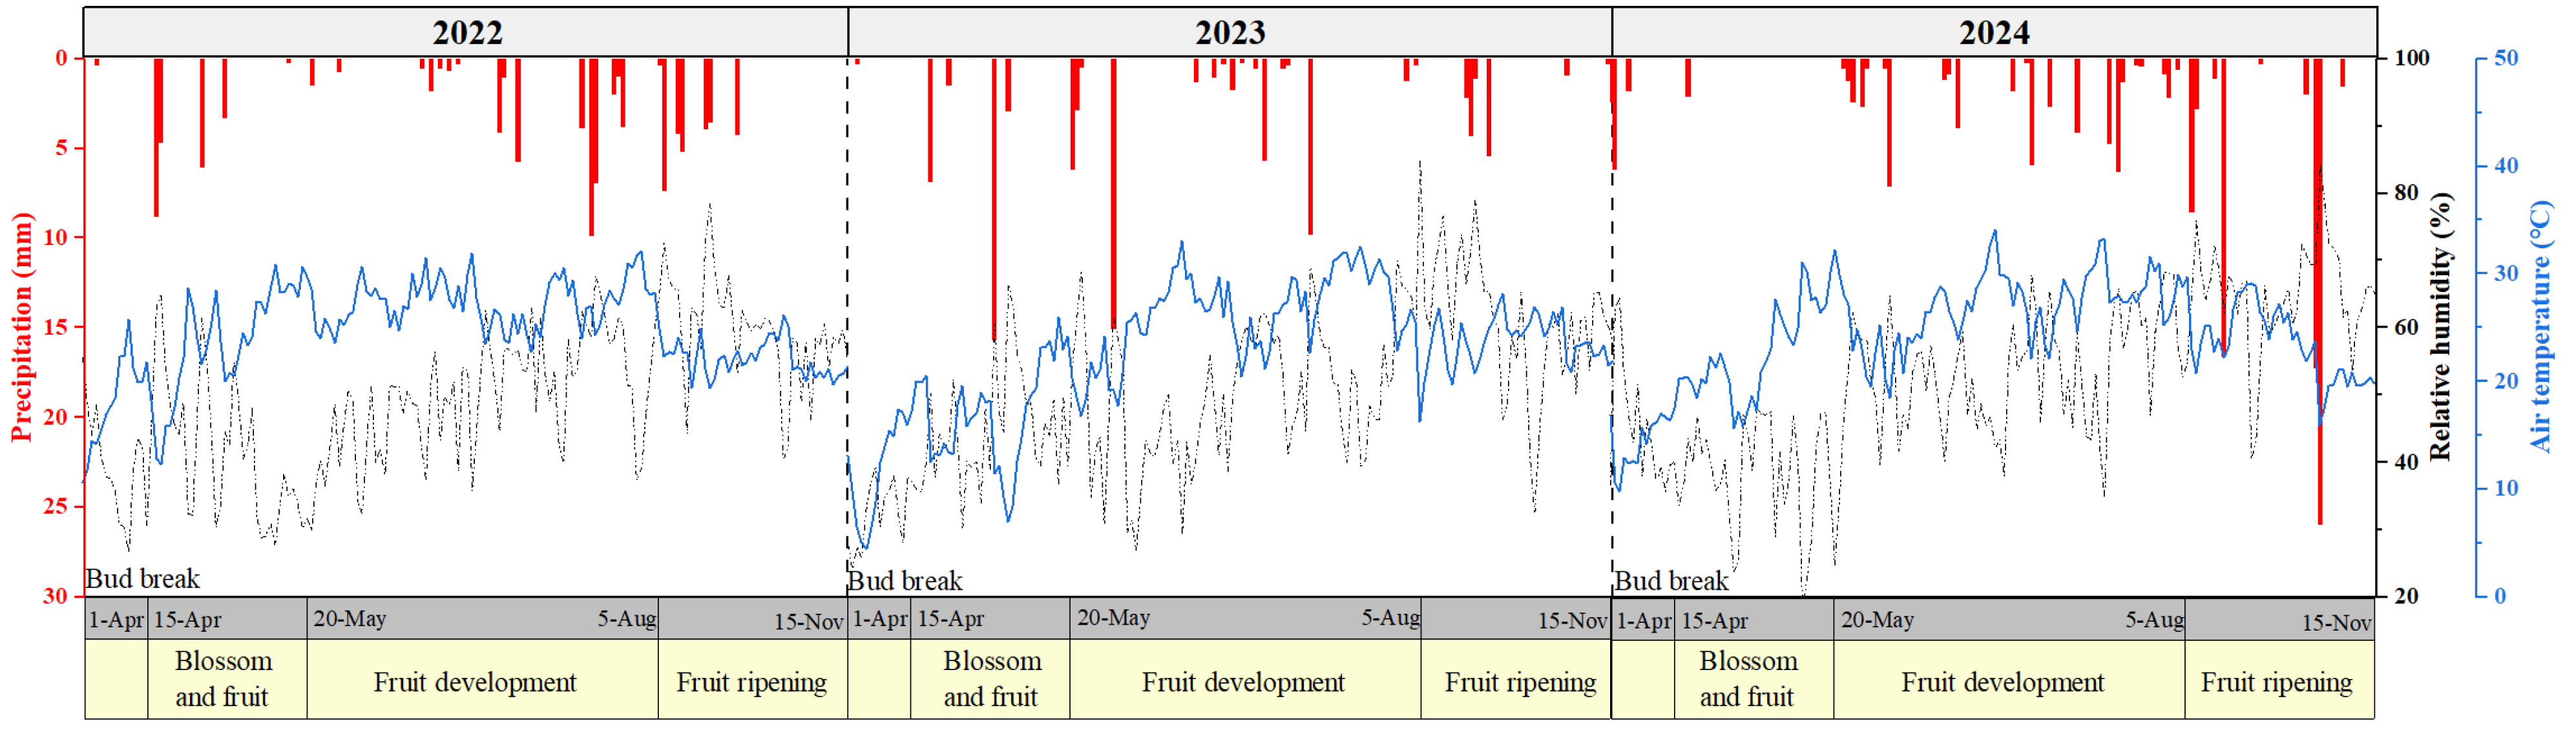
The field experiment was conducted from 2022 to 2024 in Korla City, Xinjiang Uygur Autonomous Region, located in Northwestern China (85°53′ E, 41°47′ N, 860 m asl). The experimental area covered an area of 1.33 ha. The region belongs to a typical temperate continental arid climate, with an average annual sunshine duration of 2980 h, an average annual rainfall of around 90 mm, and an average annual evaporation of approximately 2780 mm. Despite the high evaporation significantly exceeding precipitation and irrigation inputs, sustainable pear cultivation was enabled by groundwater recharge from Tianshan snowmelt, which provided critical supplemental water to the orchard ecosystem. The average bulk density of the soil from 0 to 100 cm of the soil layer was 1.45 g·cm−3, the soil pH was 7.27, the field’s water-holding capacity was 19.42%, the saturated moisture content was 27.79%, the soil’s ammonium nitrogen content was 11.66 mg·kg−1, the soil’s nitrate nitrogen content was 8.30 mg·kg−1, the available potassium content was 160.50 mg·kg−1, and the organic matter content was 14.2 g·kg−1. Meteorological data were continuously recorded, using the Tianqi Intelligent Ecological Station (INSETEK Oriental Zhigan Co., Ltd., Zhejiang, China) (Figure 1).

2.2. Experimental Design

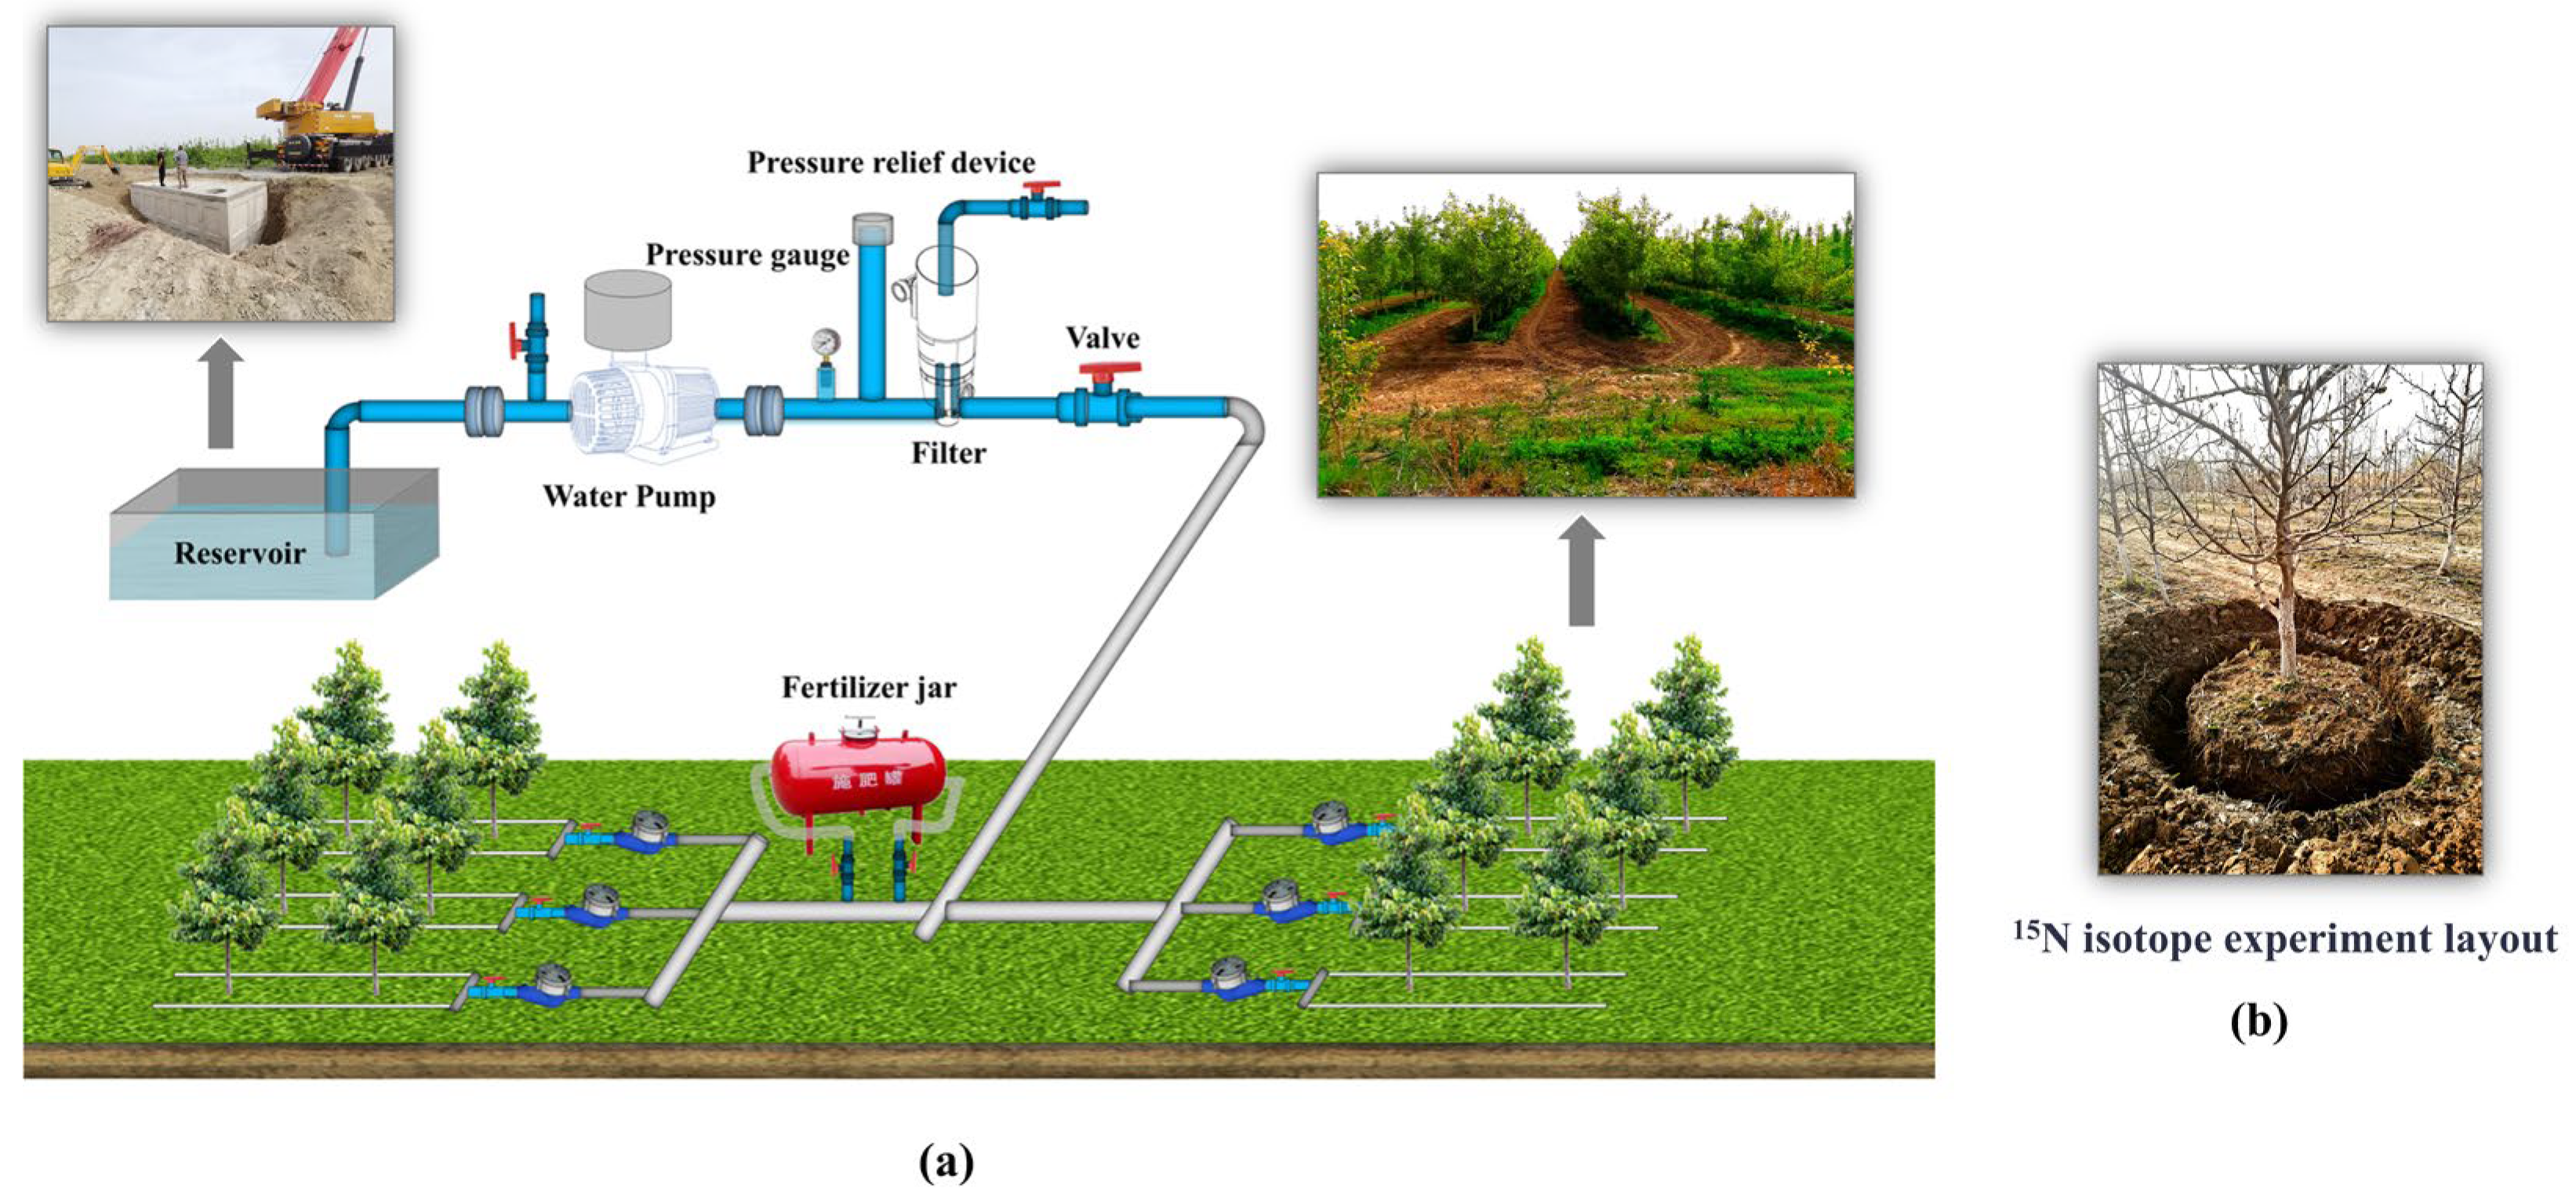
This study used 7-year-old Korla fragrant pear (Pyrus sinkiangensis Yu) grafted onto Du pear rootstock as the experimental object, adopting a dense planting cultivation mode of 4 m (row spacing) × 1 m (plant spacing), and planting in the east–west direction. A total of 12 treatment rows were set up in the experimental plot; the drip irrigation pipes were arranged in double lines, each 30 cm apart from both sides of the trees; and the drip head flow rate was set to 4 L·h−1. During each growth period from 2022 to 2023, 9 irrigations were carried out and in 2024, a total of 12 irrigations were performed, with an average of 6 fertilization sessions per year (Table 1). The irrigation schedule was designed based on crop water requirements and climatic adaptability, with reduced irrigation during maturation to improve fruit quality. Winter and spring irrigation occurred in November and March of the subsequent year to achieve the goals of cold and frost resistance, salt and alkali washing, and soil moisture preservation (with an irrigation amount of 2250 m3·ha−1). Sheep manure (50 m3·ha−1) was applied annually as the base fertilizer after the autumn harvest of fragrant pears, at a depth of 30 cm and a width of 25 cm. Fertilization was performed using a differential pressure fertilizer tank. The nitrogen fertilizer consisted of a combination of ordinary urea (N 46%) and 15N isotope-labeled urea (N 46%), applied simultaneously. The phosphorus fertilizer used was water-soluble monoammonium phosphate (N 12% + P2O5 61%), and the potassium fertilizer was potassium sulfate (K2O content 52%). The experiment included two main factors: the irrigation amount and the nitrogen application rate. The irrigation treatment consisted of three levels, based on the local micro-irrigation technology that is standard for fragrant pears: “Technical Regulations for Water and Fertilizer Management of Mature Korla Fragrant Pear under Micro-irrigation”, W1 (4500 m3·ha−1), W2 (6000 m3·ha−1), and W3 (7500 m3·ha−1). The nitrogen application treatments also had three levels by the same standard—N1 (200 kg·ha−1), N2 (300 kg·ha−1), and N3 (400 kg·ha−1)—resulting in a total of 9 experimental conditions, each repeated 3 times (Figure 2a). This experiment adopted a multi-year randomized trial design. After completing the basic drip irrigation nitrogen regulation experiment in 2022, 15N isotope labeling experiments were conducted from 2023 to 2024 to ensure continuity in the water and nitrogen management protocols, as well as the testing methods. Prior to the experiment, a waterproof canvas was buried to a depth of 1 m within the root zone of the fragrant pear trees, with a radius of 1 m to prevent excessive isotope leaching and maximize nutrient utilization by the trees (Figure 2b).

2.3. Collection and Measurement of Test Samples

2.3.1. Collection of Samples

Soil sample collection: Soil samples were collected during the four key growth stages of fragrant pear: bud break and leaf development, flowering and fruiting, fruit development, and fruit ripening. Samples were collected every 20 cm, using a soil drill at a distance of 60 cm from the tree. The initial sampling depth was 100 cm, and the final sampling depth was 140 cm, to assess the residual amount of 15N in the soil. Each sample was sampled three times repeatedly. A portion of each soil sample was placed into an aluminum box, while the remaining portion was air dried under room temperature and light avoidance conditions to eliminate moisture interference and minimize nitrogen loss, then ground and passed through a 100-mesh (0.15 mm) sieve. The sieved samples were thoroughly mixed and then tested for soil nitrogen.
Plant sample collection: During the flowering and whole fruit swelling stages, partial samples were collected from fragrant pear trees, which were then separated into annual branches, leaves, perennial branches, and fruits. At the maturation stage, comprehensive whole plant samples, including the complete root system, were obtained through destructive excavation. All analytical measurements for each sample type were performed in triplicate.

2.3.2. Determination of Samples

Determination of soil moisture content: Soil moisture content was measured by using a drying method.
Organ moisture content determination: After each sample was collected, it was rinsed with distilled water 2–3 times to remove surface moisture and contaminants. The fresh weight (m1) was recorded subsequently. The samples were then killed at 105 °C for 30 min, followed by drying at 70–80 °C until a constant weight was achieved. The dry weight (m2) was recorded thereafter.
Determination of total nitrogen in soil: A 1.000–4.000 g sample of processed soil was weighed and placed in a digestion tube. Two to four catalyst pieces and 20.00–30.00 mL of H2SO4 were added for high-temperature digestion. After digestion, the total nitrogen content was determined by using an automatic Kjeldahl nitrogen analyzer (K-375; Büchi Labortechnik AG, Flawil, Switzerland).
Determination of ammonium nitrogen in soil: A 1.000–4.000 g sample of processed soil was weighed. A total of 20 mL of KCl solution were added, shaken at room temperature for 1 h and centrifuged, and measured using a soil multi-element analyzer (Cleverchem Elfin, DeChem Tech. GmbH, Hamburg, Germany).
Determination of soil nitrate nitrogen: Soil nitrate nitrogen was extracted with a potassium chloride (KCl) solution and shaken for 1 h at 25 °C. After centrifugation, the supernatant was collected and analyzed for its nitrate concentration by using dual-wavelength ultraviolet spectrophotometry at 220 nm and 275 nm. However, the measured nitrate nitrogen concentrations in the vast majority of treatments were below the effective detection limit. Therefore, nitrate nitrogen data were excluded from formal statistical analysis and are only discussed descriptively in the text.
Determination of total nitrogen in plants: A 0.200–0.500 g processed plant sample was weighed and subjected to the same digestion method as that used for soil samples to determine the total nitrogen content.
Isotope determination: Processed plant and soil samples were separately analyzed for 15N abundance by using a stable gas isotope ratio mass spectrometer (Thermo Fisher® Delta V Advantage, Waltham, MA, USA).

2.4. Data Processing and Statistical Analysis

2.4.1. Data Processing

(1)
The moisture contents of the soil and plant organs were calculated using the following formula:
ws = (m1 − m2)/m2 × 100
wp = (m1 − m2)/m2 × 100
where wS is the soil moisture content (%), wP is the plant organ moisture content (%), m1 is the fresh weight of soil or plant organs (g), and m2 is the dry weight of soil or plant organs (g).
(2)
The nitrogen accumulation in various organs of fragrant pear, the proportion of nitrogen from labeled nitrogen fertilizer (Ndff) (%), 15N absorption (g), utilization rate (%), residual rate (%), and loss rate (%) were calculated using the Equations (3)–(8) given below:
The nitrogen accumulation of plant organs (g) = nitrogen content × dry matter mass
Ndff (%) = (15N abundance in sample − 15N natural abundance)/(15N abundance in labeled nitrogen fertilizer − 15N natural abundance) × 100
The average natural abundance of 15N in the soil was 0.3684%, and the abundance of 15N in the labeled nitrogen fertilizer used was 10.26%.
15N absorption (g) = total nitrogen content × Ndff
15N utilization rate (%) = total 15N absorption by plant organs/15N application rate × 100
15N residual rate (%) = (Ndff × soil layer thickness × soil bulk density × soil nitrogen content)/15N application rate × 100
15N loss rate (%) = 100 − 15N utilization rate − 15N residual rate

2.4.2. Statistical Analysis

The experimental data were recorded and analyzed using Microsoft Excel 2019. Graphical representations were created using OriginPro 2024 and Adobe Illustrator 2024 (Adobe Inc., San Jose, CA, USA). Statistical analyses were performed using SPSS version 26.0 (SPSS Inc., Chicago, IL, USA). A two-way ANOVA was used to evaluate the effects of irrigation and nitrogen application on soil nitrogen distribution, organ water and nitrogen nutrition, and 15N absorption and utilization. The Waller–Duncan multiple range test (95% confidence level, p < 0.05) was employed to identify significant differences.

3. Results

3.1. Temporal and Spatial Variability of Soil Moisture in Root Zone

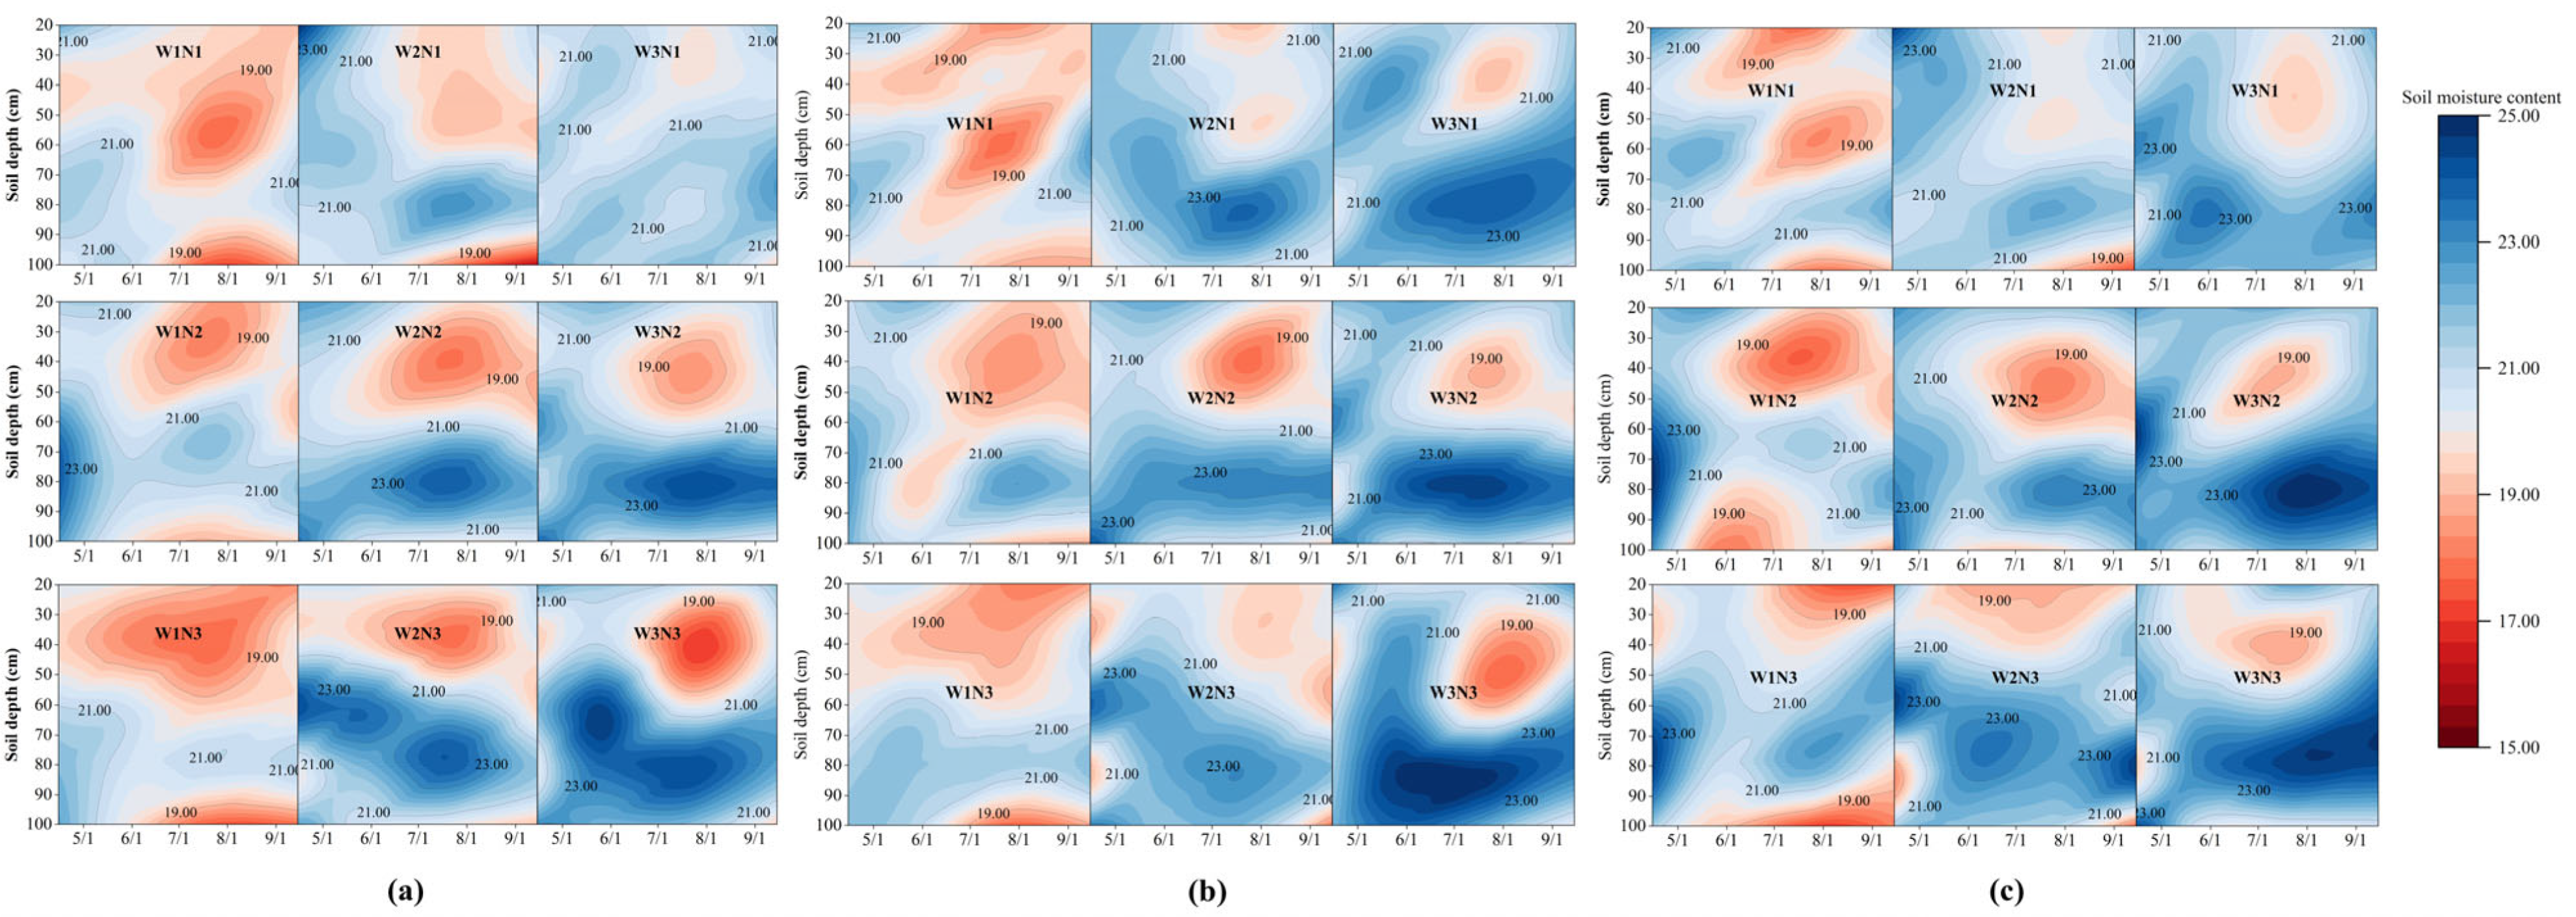
From the perspective of temporal variation, the moisture content in the 20–80 cm soil layer showed a pattern of first decreasing and then increasing during the pear growth period, with the lowest levels occurring between June and August. At the W1 irrigation level, moisture fluctuation ranged from 15% to 21%, while at W2 and W3, the range slightly widened to 17–24%. In deeper soil layers (below 80 cm), moisture content first increased and then decreased, except during the early growth stage. Under W1, moisture changes were minimal, indicating limited replenishment of deep soil moisture. Under W2 and W3, however, soil moisture variation increased significantly, with fluctuations expanding to 19–25%.
From the perspective of spatial distribution, the irrigation amount significantly influenced the spatial variation in soil moisture (p < 0.05). The moisture content under W1 was significantly lower than under W2 and W3 and exhibited clear variation with soil depth. The 20–80 cm layer maintained the lowest moisture level in the entire profile, fluctuating between 17% and 23%. In deep soil (below 80 cm), moisture under W3 remained high, ranging from 21% to 25%, which exacerbates unnecessary water loss (Figure 3).

3.2. Spatial Distribution Characteristics of Soil Nitrogen in Root Zone

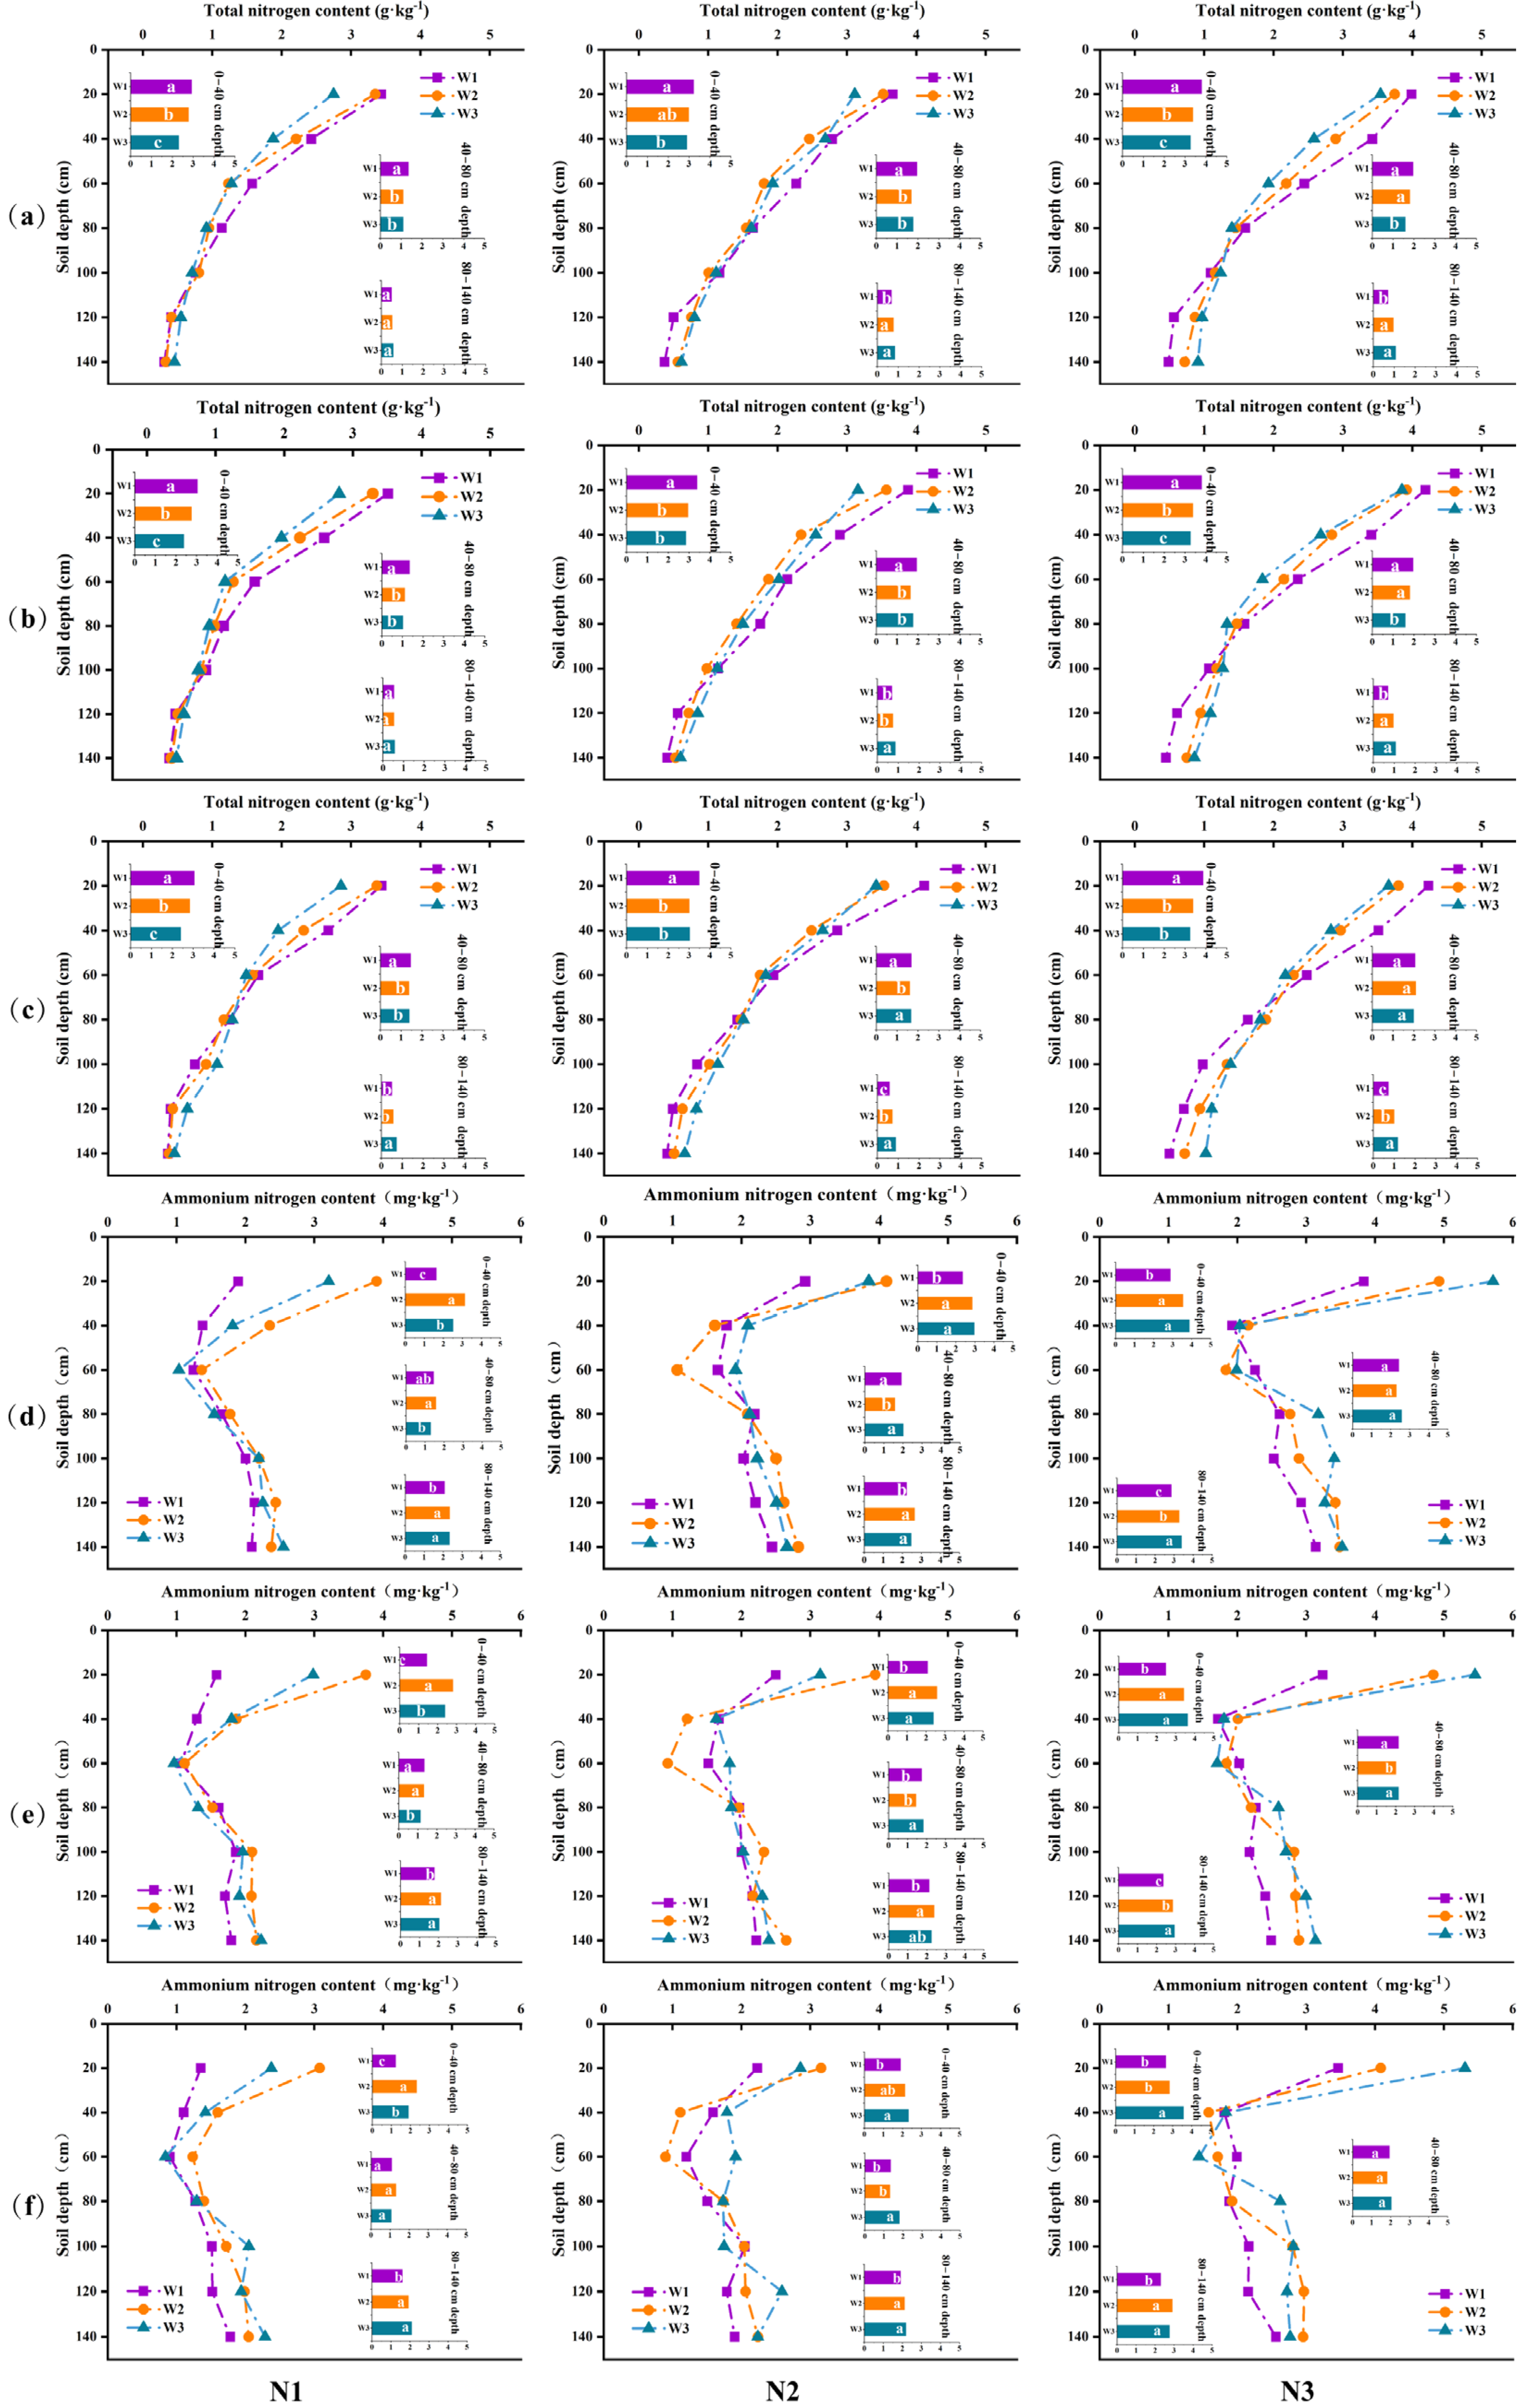
The results of this study indicated that the total nitrogen content in the soil exhibited a clear vertical distribution pattern, with a decreasing trend in the gradient as the soil layer deepened (Figure 4). Specifically, under the applied nitrogen treatments, the total nitrogen content in the shallow soil layer of 0–40 cm was the highest, ranging from 2.31 to 3.71 g·kg−1, while it significantly decreased in the middle soil layer of 40–80 cm, ranging from 1.09 to 2.02 g·kg−1. The deep soil layer below 80 cm tended to be stable and had the lowest content. Under the condition of a consistent irrigation amount, nitrogen application rate had a significant impact on the soil’s total nitrogen content. Among them, the N3 treatment increased the soil’s total nitrogen content to 5.77–6.44 g·kg−1, which was 34.73% to 44.97% higher than that of the N1 treatment. In addition, when the nitrogen application level was the same, the W1 irrigation treatment significantly increased the total nitrogen content of the shallow soil, with an increase of 5.47–11.56% and 11.13–26.71%, respectively, compared to the W2 and W3 treatments. This relationship was consistently observed in both the 2023 and 2024 experiments.
There was a significant influence of the coupled regulation of water and nitrogen on the ammonium nitrogen content (p < 0.05). The overall ammonium nitrogen levels in 2023 and 2024 were lower than those in 2022, showing a trend of initially decreasing and then increasing with the increasing soil depth. The lowest ammonium nitrogen content was observed at 40–80 cm. Below 80 cm, the ammonium nitrogen content increased slightly. In the 0–40 cm soil layer, under N1 and N2 conditions, the W2 treatment exhibited the highest ammonium nitrogen content, ranging from 2.34 to 3.17 mg·kg−1. The W1 treatment showed the lowest content, ranging from 1.23 to 2.43 mg·kg−1. Under N3 conditions, the W3 treatment displayed the highest ammonium nitrogen content, ranging from 3.57 to 3.94 mg·kg−1, whereas the W1 treatment had the lowest content, ranging from 2.48 to 3.00 mg·kg−1. In the 40–80 cm soil layer, under N2 and N3 conditions, the W2 treatment had the lowest content, at 1.32–1.62 mg·kg−1 and 1.82–2.32 mg·kg−1, respectively. In the 80–140 cm soil layer, the W1 treatment exhibited the lowest ammonium nitrogen content, ranging from 1.60 to 3.05 mg·kg−1 (Figure 4).

3.3. Dynamic Patterns of Water and Nitrogen in Pear Organs

3.3.1. Characteristics of Organ Moisture Changes

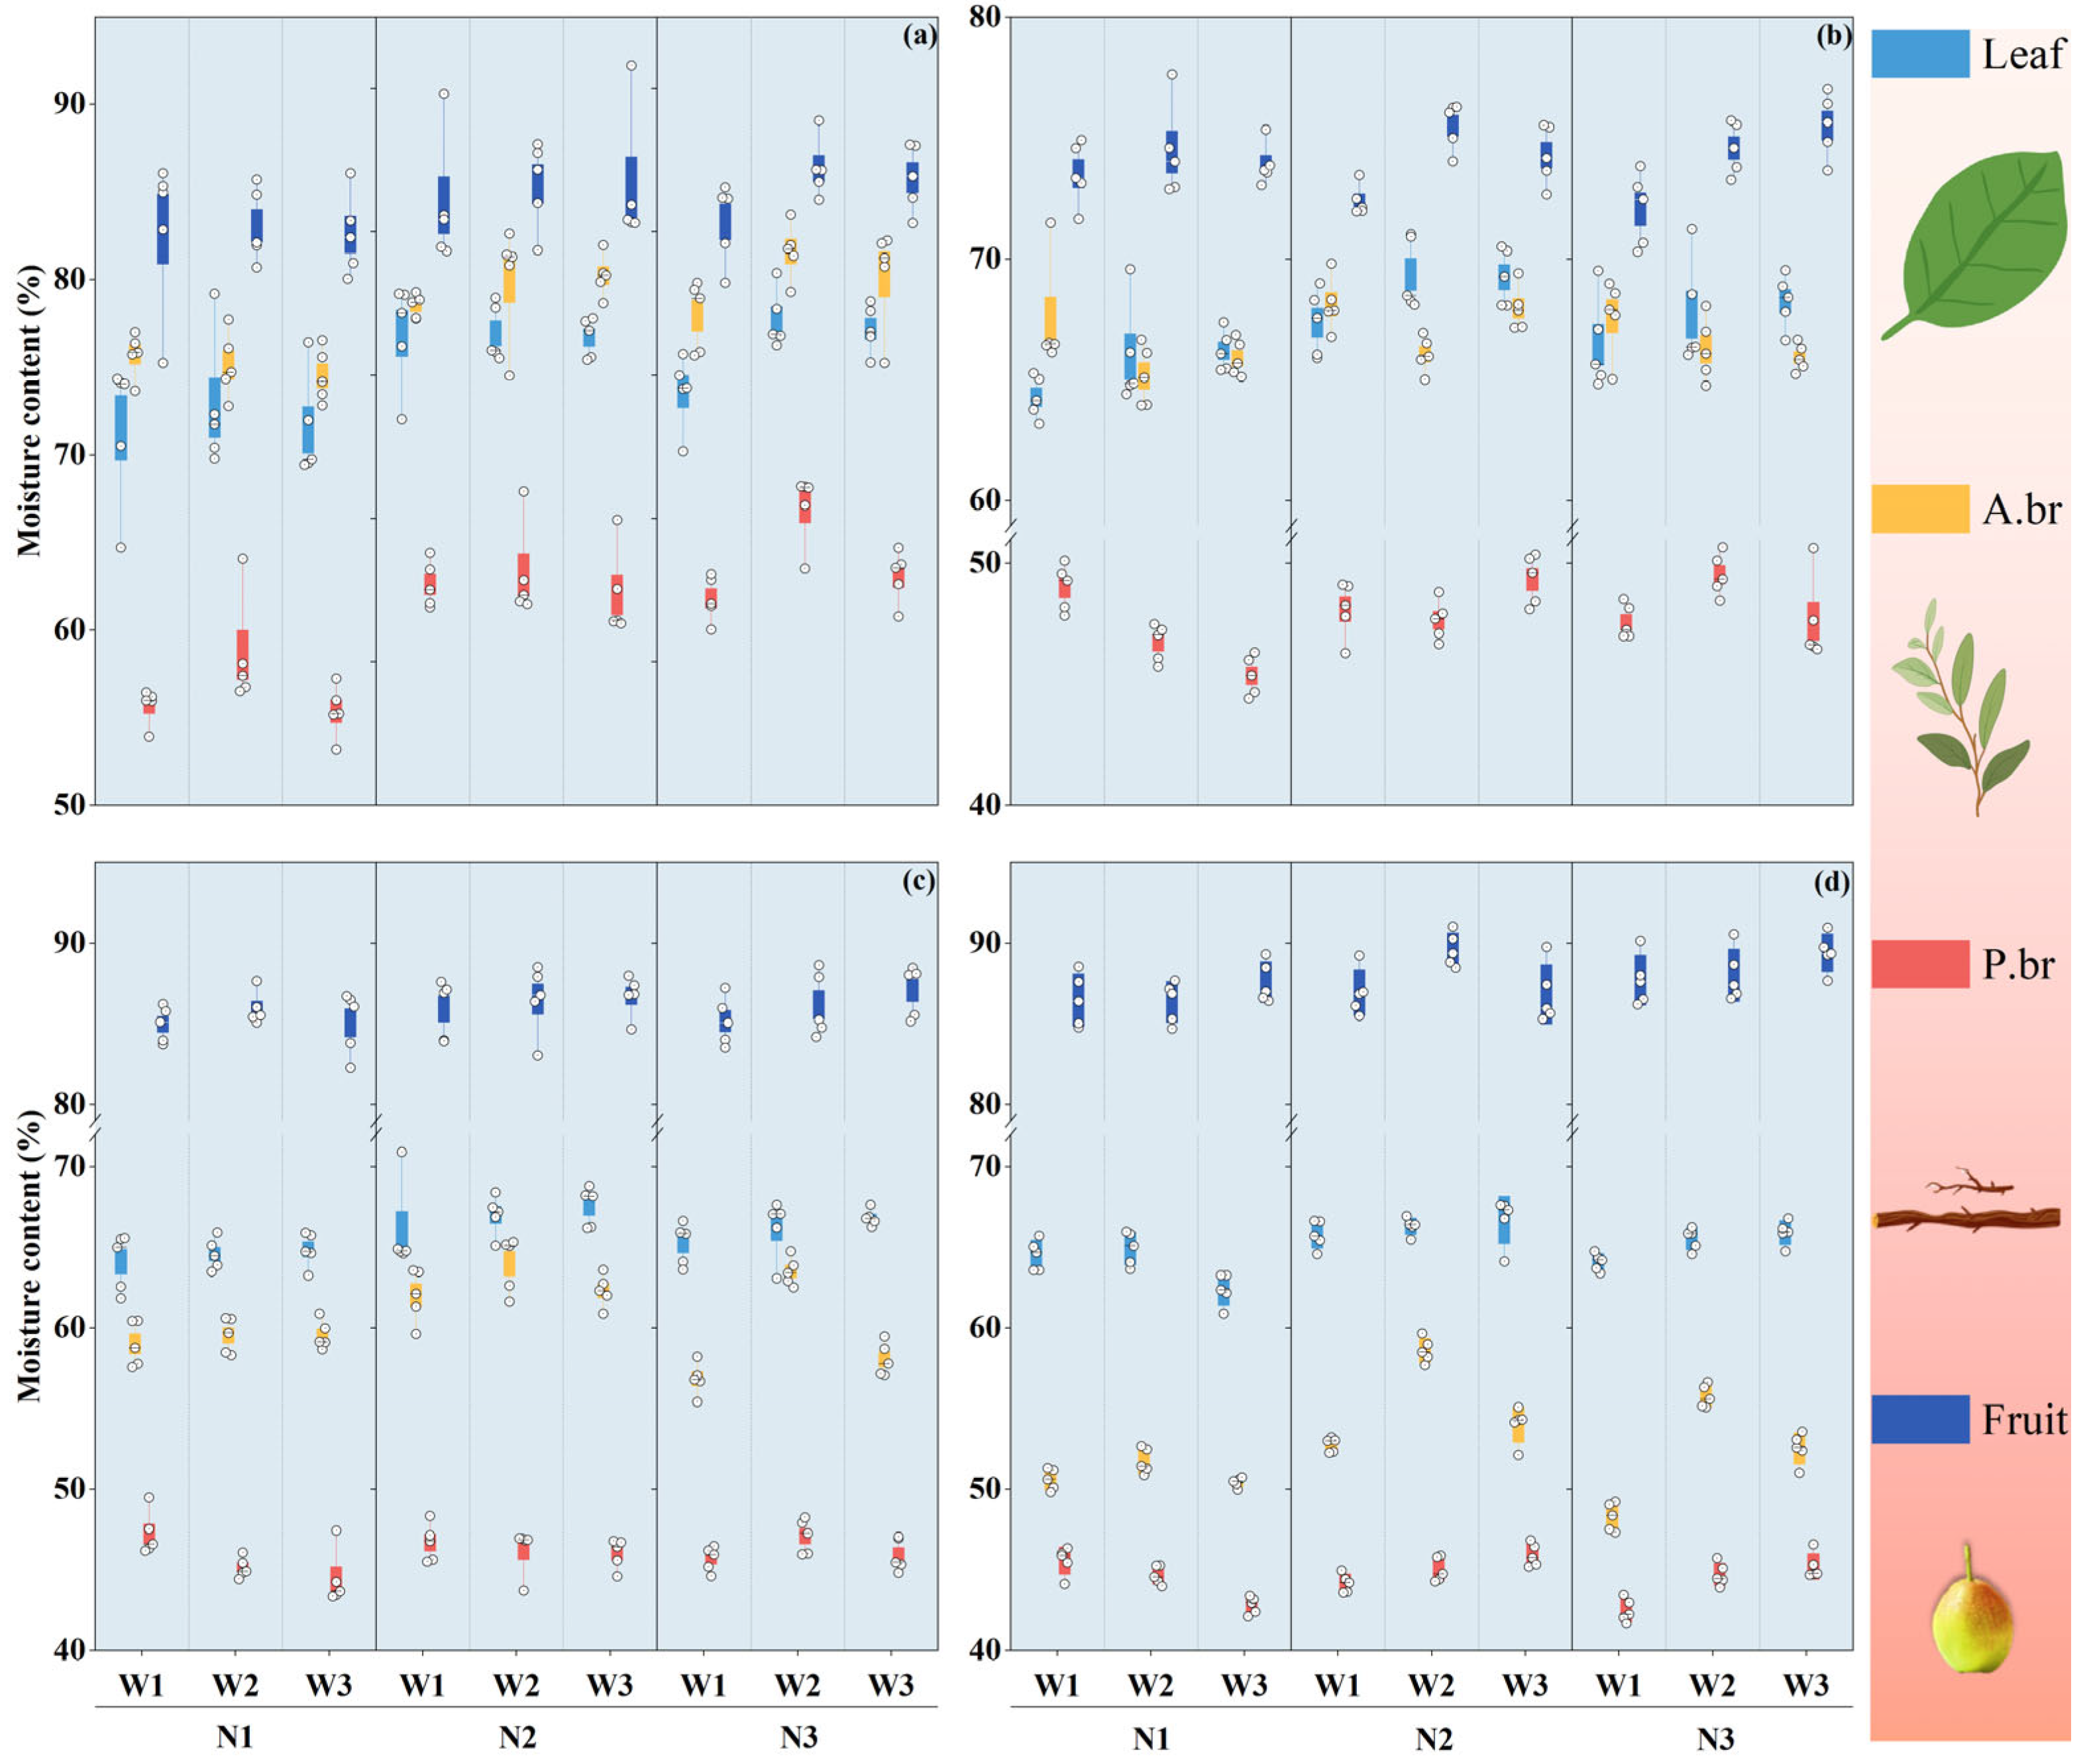
Irrigation and nitrogen application rates significantly affected the moisture content of pear leaves, annual branches, and fruits (p < 0.05), with varying effects across growth stages. As growth progressed, the leaves’ moisture content showed a significant declining trend. Moisture changes in annual and perennial branches were generally consistent with leaves, differing mainly in the rate of decrease, while fruit moisture content initially decreased and then increased during the growth period (Figure 5).
At early growth stages, the leaves’ moisture remained stable above 70% (Figure 5a). Annual branches had slightly higher moisture than leaves, whereas perennial branches had the lowest moisture, ranging from 50% to 60%. Fruits exhibited the highest moisture content, between 80% and 90%. Under consistent irrigation levels, the leaves’ moisture increased with higher nitrogen application (except at W1). At the N3 and N2 levels, the moisture content increased by 0.33% and 1.65% and 1.70% and 2.56%, respectively, compared to N1. With constant nitrogen levels, the leaves’ moisture first increased and then decreased with the rising irrigation, peaking under W2 with increases of 0.01–7.30% and 0.41–1.78% compared to W1 and W3, respectively.
Under the same irrigation levels, the annual branches and fruits showed similar moisture trends. With insufficient irrigation, their moisture gradually decreased as the nitrogen increased; under sufficient irrigation, the moisture continued to rise, being highest under W2N3 at 72.66% and 84.44%, respectively, and lowest under W1N3 at 74.16% and 80.70%, respectively. Perennial branch moisture showed no significant differences between treatments.
During early fruit enlargement, the leaves’ moisture fell below 70% (Figure 5b). The annual branch moisture was initially close to the leaves’ but slightly decreased later, while the perennial branch moisture remained stable at 40–50%, with no significant treatment differences. The fruit moisture first decreased and then increased during enlargement, rising from 70 to 75% to 85–90% (Figure 5c). The fruit moisture during this stage was more affected by irrigation: at N1 and N2, it first increased and then decreased with irrigation in the early stage, and gradually increased at N2 in the late stage; at N3, the fruit moisture increased with the irrigation throughout the period. W2N2 ranged between 75.52 and 86.55%, while W3N3 had the highest moisture, at 87.08%.
At maturity, the moisture in leaves, perennial branches, and fruits fluctuated slightly, with no significant changes from late enlargement. The annual branch moisture decreased to about 50%, all lower than the leaves (Figure 5d).

3.3.2. Dynamics of Nitrogen Changes in Organs

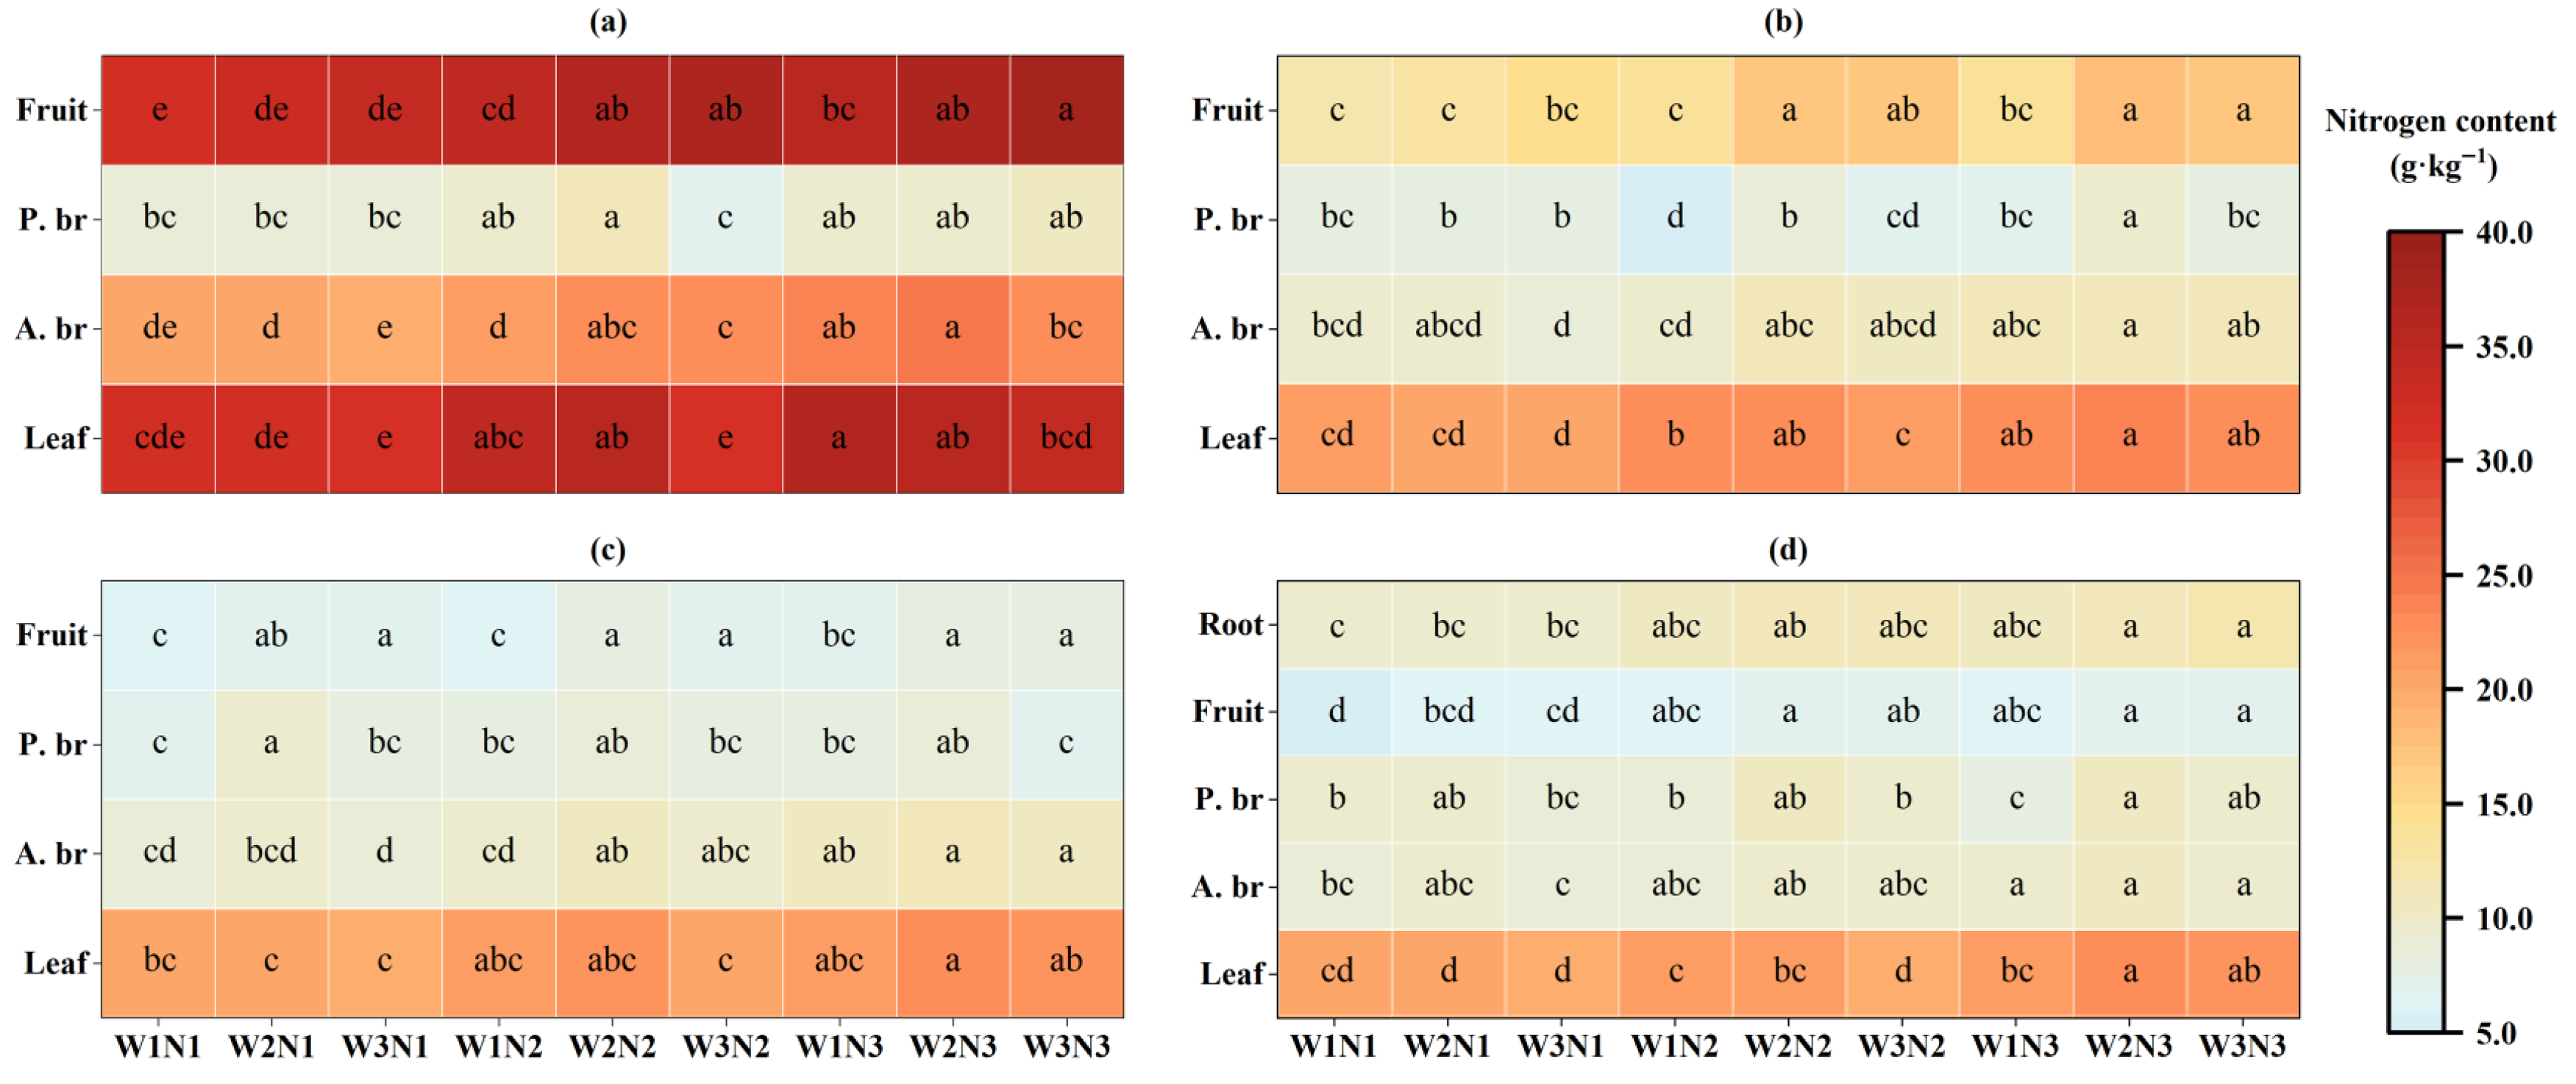
The sprouting and leaf expansion stage represented the period during which the nitrogen content in the various organs of fragrant pear reached its peak (excluding perennial branches). The nitrogen absorbed by fragrant pear trees from the soil is mainly allocated to newly formed organs of the current year, including annual branches, leaves, and fruits. Notably, the nitrogen content of each newly formed organ reached its highest level during this stage, with measured values ranging from 19.41 to 24.26 g·kg−1 in annual branches, 30.91–36.28 g·kg−1 in leaves, and 32.18–37.95 g·kg−1 in fruits (Figure 6a). As the growing season progressed, the nitrogen content gradually decreased and eventually stabilized across all organs, though variations were observed among different organs. By the maturity stage, the nitrogen content had declined to 8.25–10.06 g·kg−1 in the annual branches, 19.65–22.7 g·kg−1 in the leaves, and 5.67–7.15 g·kg−1 in the fruits (Figure 6d). Throughout the entire growth period, neither the irrigation nor the nitrogen application significantly affected the nitrogen content in perennial branches.
Throughout the entire growth period, the nitrogen content of new organs was significantly affected by the nitrogen application rate and showed varying degrees of increase with the increasing nitrogen application rate. Among them, the nitrogen content of each organ was highest at the N3 level, and during maturity, the nitrogen content of the leaves, annual branches, and fruits increased by 4.36–13.44% and 1.84–11.73%; 8.06–16.59% and 2.82–6.79%; and 14.45–20.37% and 1.39–6.40%, respectively, compared to the N1 and N2 treatments. At different stages of growth, the interactive effect of irrigation and nitrogen application showed significant differences in regulating the nitrogen content changes in new organs. Specifically, at the N1 level, the effect of the irrigation amount on the nitrogen content in various newly formed organs did not reach a significant level; under N2 and N3 conditions, the effect of the water factors on the nitrogen content in various organs showed a decreasing trend with the advancement of the growth process. It is worth noting that the W2N2 and W2N3 treatments consistently demonstrated significant advantages across multiple critical growth stages, with the nitrogen content in various organs generally ranking highest or relatively high among all treatments during the same periods (Figure 6). In the analysis at the maturity, compared with the W1 treatment, under the N2 level, the nitrogen content in the leaves, annual branches, and fruits of the W2 treatment increased by 0.90%, 5.39%, and 5.70%, respectively; under the N3 level, the increases were 3.18%, 6.64%, and 7.31%, respectively. This indicates that an appropriate water supply effectively optimizes nitrogen uptake and the balance of allocation among organs under medium-to-high nitrogen levels.

3.4. Water and Nitrogen Regulatory Effects on the Fertilizer Nitrogen Contribution Rate (Ndff) in Mature Organs

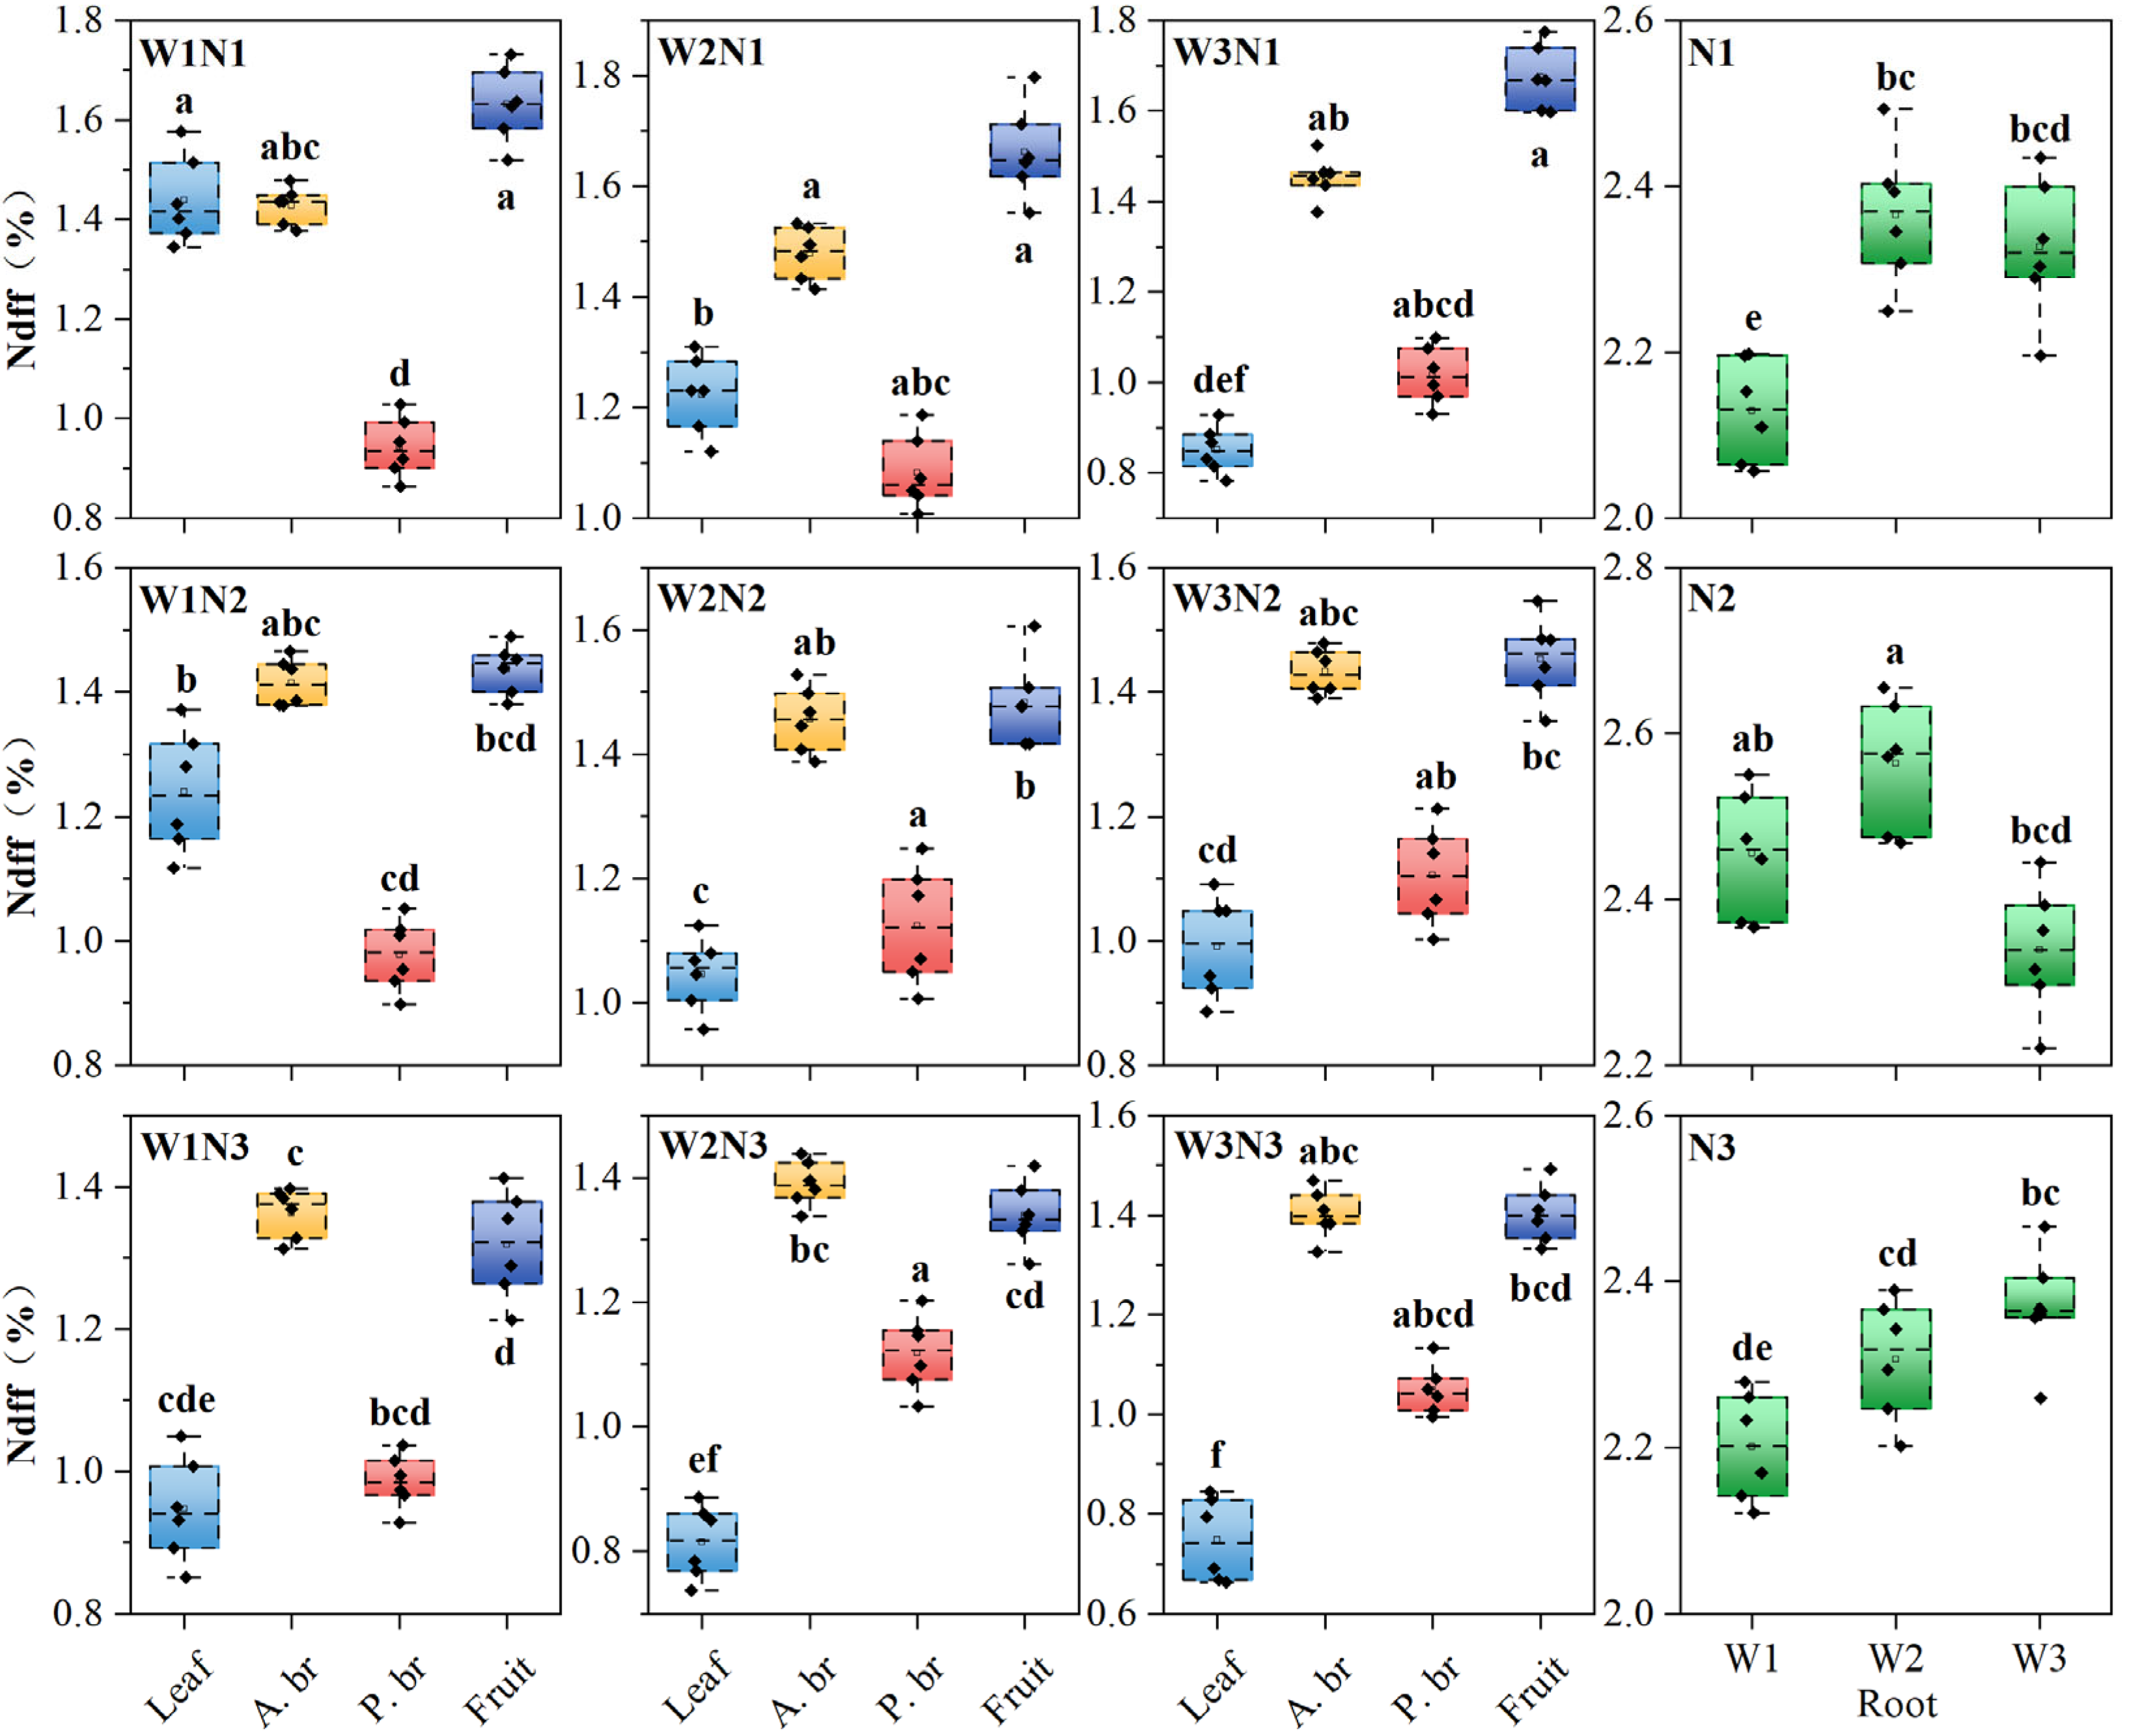
Ndff represents the degree of nitrogen absorption by fragrant pears from fertilizers. During the mature stage, the Ndff of leaves gradually decreased with increasing irrigation water. The highest Ndff was observed in the W1 treatment, ranging from 0.95 to 1.44%. Under both W1 and W2 conditions, as the nitrogen application rate increased, Ndff gradually decreased, with the N3 treatment having the lowest values of 0.95% and 0.81%, respectively. The effect of water and nitrogen regulation on the Ndff of one-year branches were relatively minor, with the W1N3 treatment exhibiting the lowest effect of 1.36%. The fruit Ndff was significantly affected by the nitrogen application rate, which gradually decreased as the nitrogen application rate increased. The lowest fruit Ndff was recorded in the N3 treatment, ranging from 1.32 to 1.40%. In the root system, Ndff showed an initial increase followed by a decline as the irrigation water volume increased, with the highest values of 2.37% and 2.56% being under W2 conditions for N1 and N2, respectively. Under both W1 and W2 conditions, the maximum Ndff was observed in the N2 treatment at 2.46% and 2.56%, respectively. However, under W3 conditions, the difference in Ndff between the treatments was not significant. Among all treatments, the W1N1 treatment had the lowest Ndff of 0.94% in the perennial branches (Figure 7).

3.5. Nitrogen Absorption and Accumulation Characteristics in Various Organs During the Mature Stage

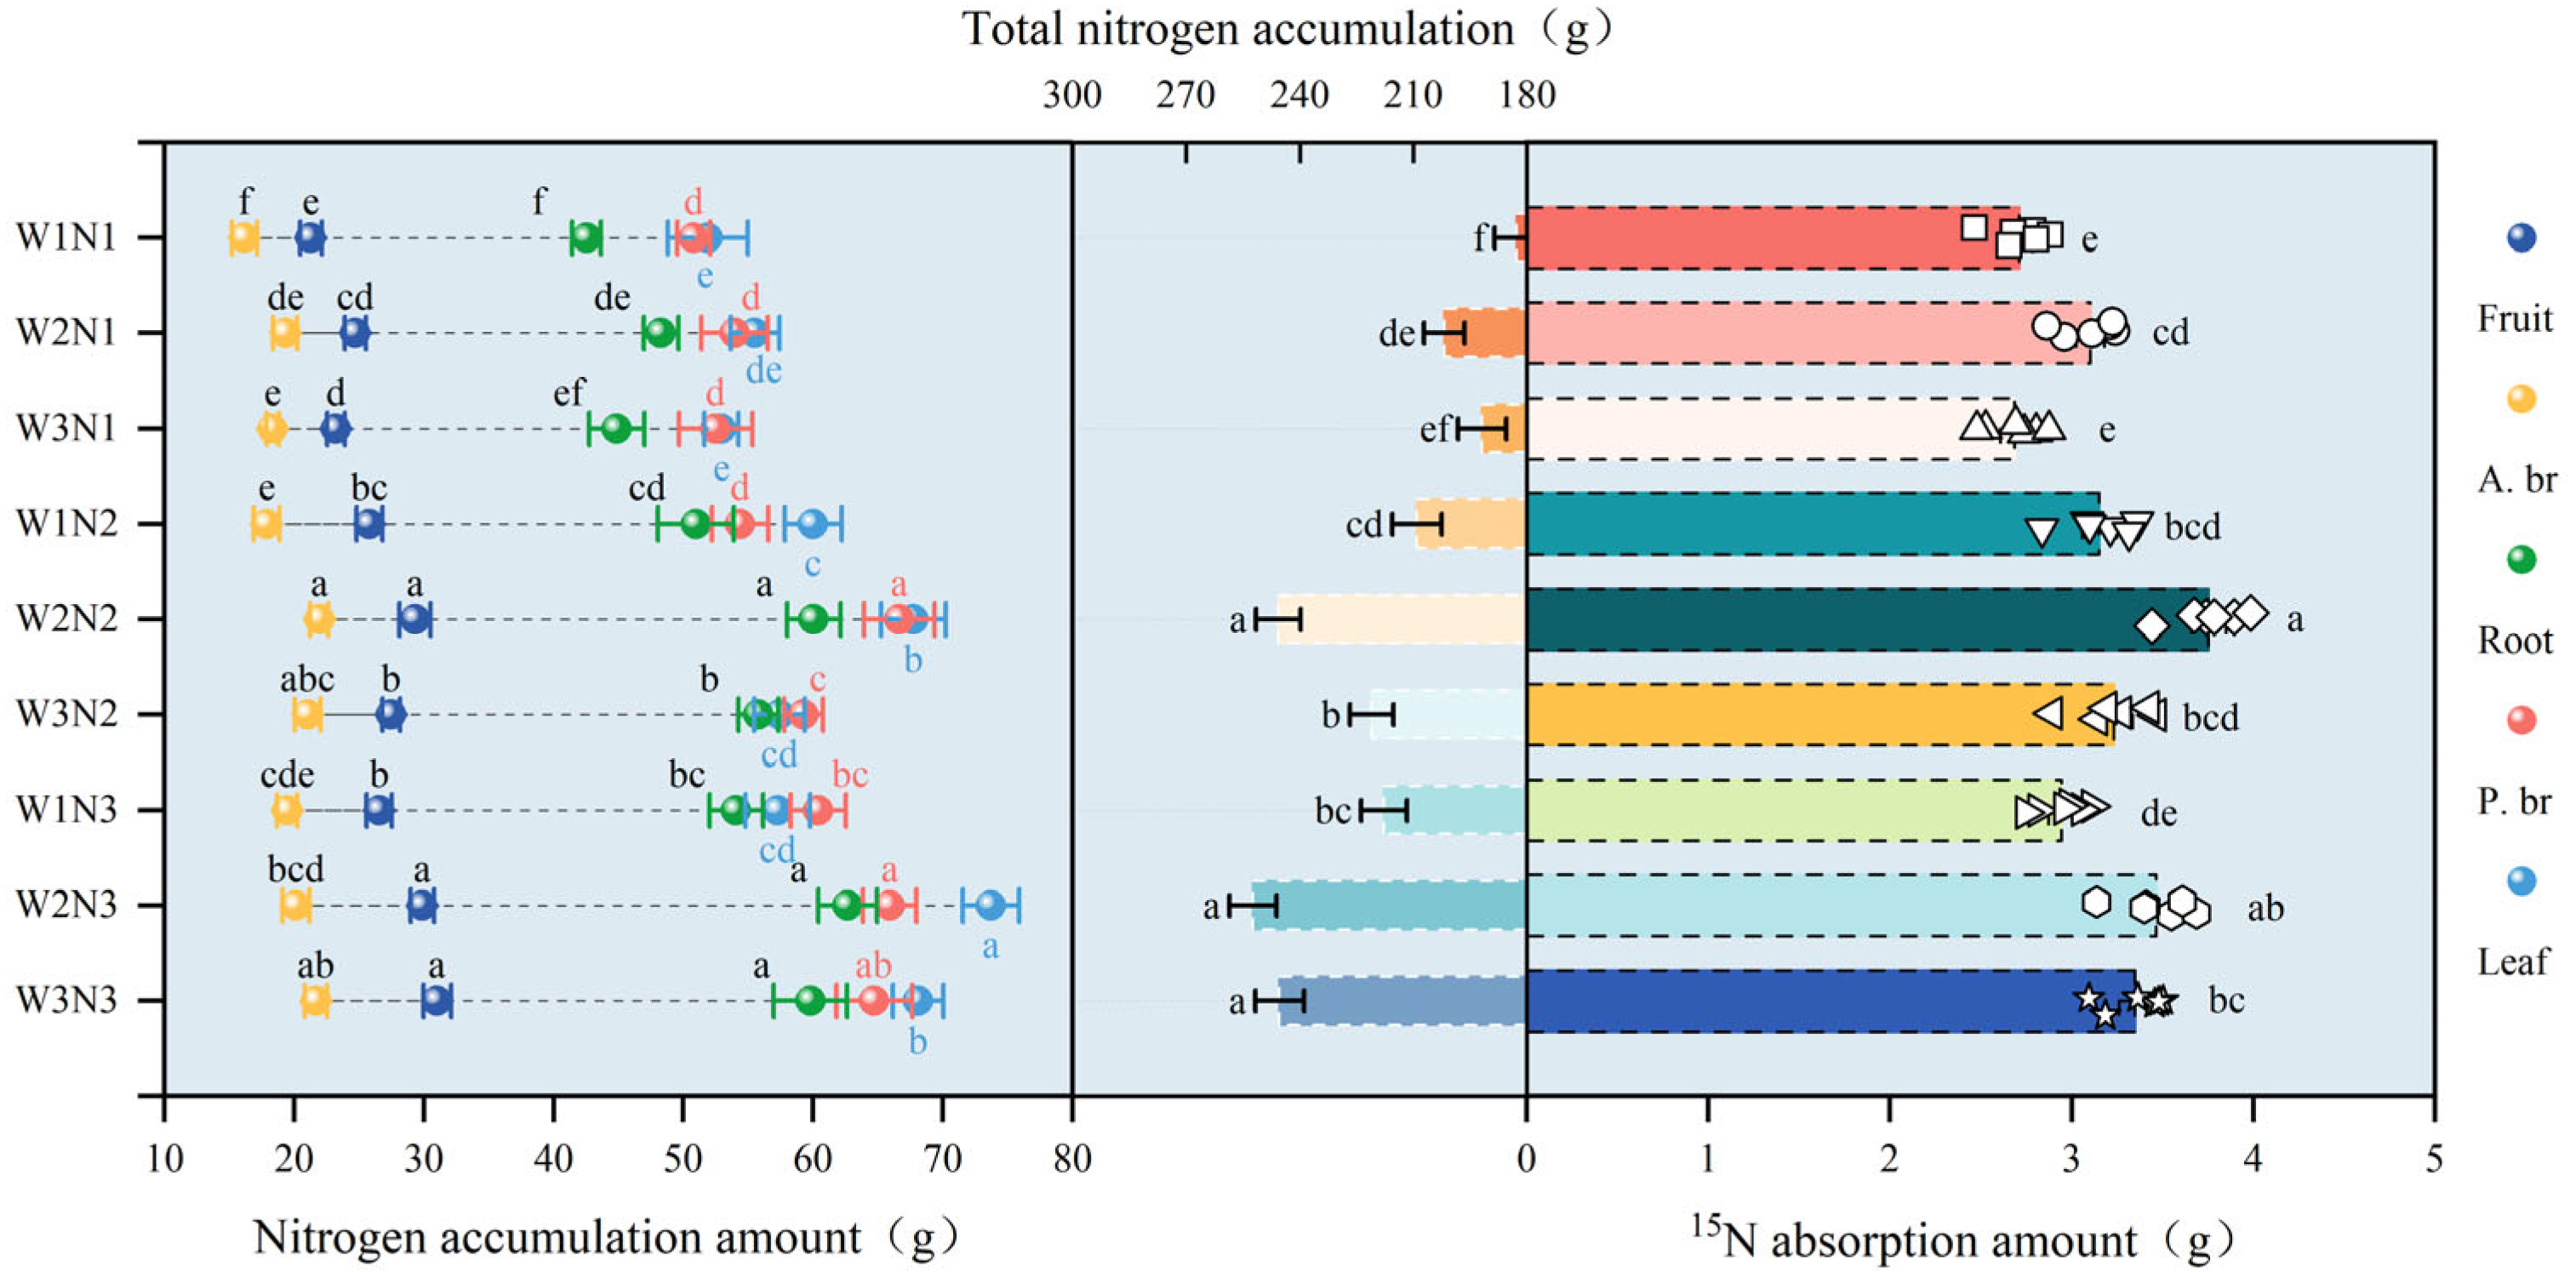
At the mature stage, the total nitrogen accumulation in fragrant pear organs first increased and then decreased with the increasing irrigation water volume and increased with higher nitrogen application rates. The highest nitrogen accumulation was observed in the W2N3 treatment at 252.30 g, with no significant difference compared with the W3N3 and W2N2 treatments.
Water and nitrogen regulation significantly influenced nitrogen accumulation in newly formed organs. In leaves, nitrogen accumulation under N2 and N3 treatments was significantly higher than under N1 treatment, with relative increases of 8.44–22.00% and 10.37–32.76%, respectively. Under constant nitrogen application rates, W2 leaves showed the highest nitrogen accumulation, ranging from 55.52 to 73.70 g. Fruit nitrogen accumulation increases diminished with higher nitrogen application rates, with the N3 treatment showing the highest accumulation at 26.57–31.01 g, which was 20.90–33.59% and 1.94–12.86% higher than in the N1 and N2 treatments, respectively. The root nitrogen accumulation increased with higher nitrogen application rates, with the N3 treatment absorbing the greatest amount, ranging from 54.08 to 62.65 g, which was 27.11–33.24% and 4.34–7.19% higher than in the N1 and N2 treatments, respectively. Under constant nitrogen application rates, the root nitrogen accumulation first increased and then decreased with the increasing irrigation water volume, with the W2 treatment showing the highest accumulation ranging from 48.27 to 62.65 g, which was 13.45–17.83% and 4.80–7.66% higher than the W1 and W3 treatments, respectively.
Appropriate water regulation promoted nitrogen absorption, with the W2 treatment showing the highest 15N uptakes of 3.24 g, 3.89 g, and 3.55 g, which increased by 14.41–19.11% and 3.54–16.17% compared to the W1 and W3 treatments, respectively. Under the same nitrogen application level, 15N absorption between the W1 and W3 treatments tended to differentiate as the nitrogen application rate increased. Under the same irrigation amount, under the W1 and W2 conditions, 15N absorption first increased and then decreased with the increasing nitrogen application rates, with the N2 treatment showing the highest absorption of 3.15 g and 3.75 g, which increased by 16.22% and 7.07% and 20.99% and 8.32%, compared to the N1 and N3 treatments, respectively (Figure 8).

3.6. Comprehensive Analysis of 15N Utilization Efficiency, Residue, and Environmental Losses

Water and nitrogen regulation had significant effects on the utilization, residue, and loss of 15N in fragrant pears (p < 0.05). As the irrigation amount remained constant, the 15N utilization rate exhibited a pattern of first increasing and then decreasing with the increasing nitrogen application rate. The highest utilization rate was observed under the N2 treatment, ranging from 34.25 to 40.79%. In contrast, under all tested irrigation levels, the 15N residual rate consistently first decreased and then increased, and the N3 treatment resulted in the highest 15N residual rate in the soil, with a specific range of 19.92–29.28%. For the W2 treatment, the highest utilization rate at a given nitrogen application rate was observed, ranging from 33.71 to 40.79%. Under N2 and N3, the loss rate in W1 was the highest, at 26.93% and 29.28%, respectively. The loss rate was highest in W3, ranging from 43.7 to 58.1% (Table 2).

3.7. Analysis of Factors Affecting Nitrogen Absorption and Utilization in Fragrant Pear

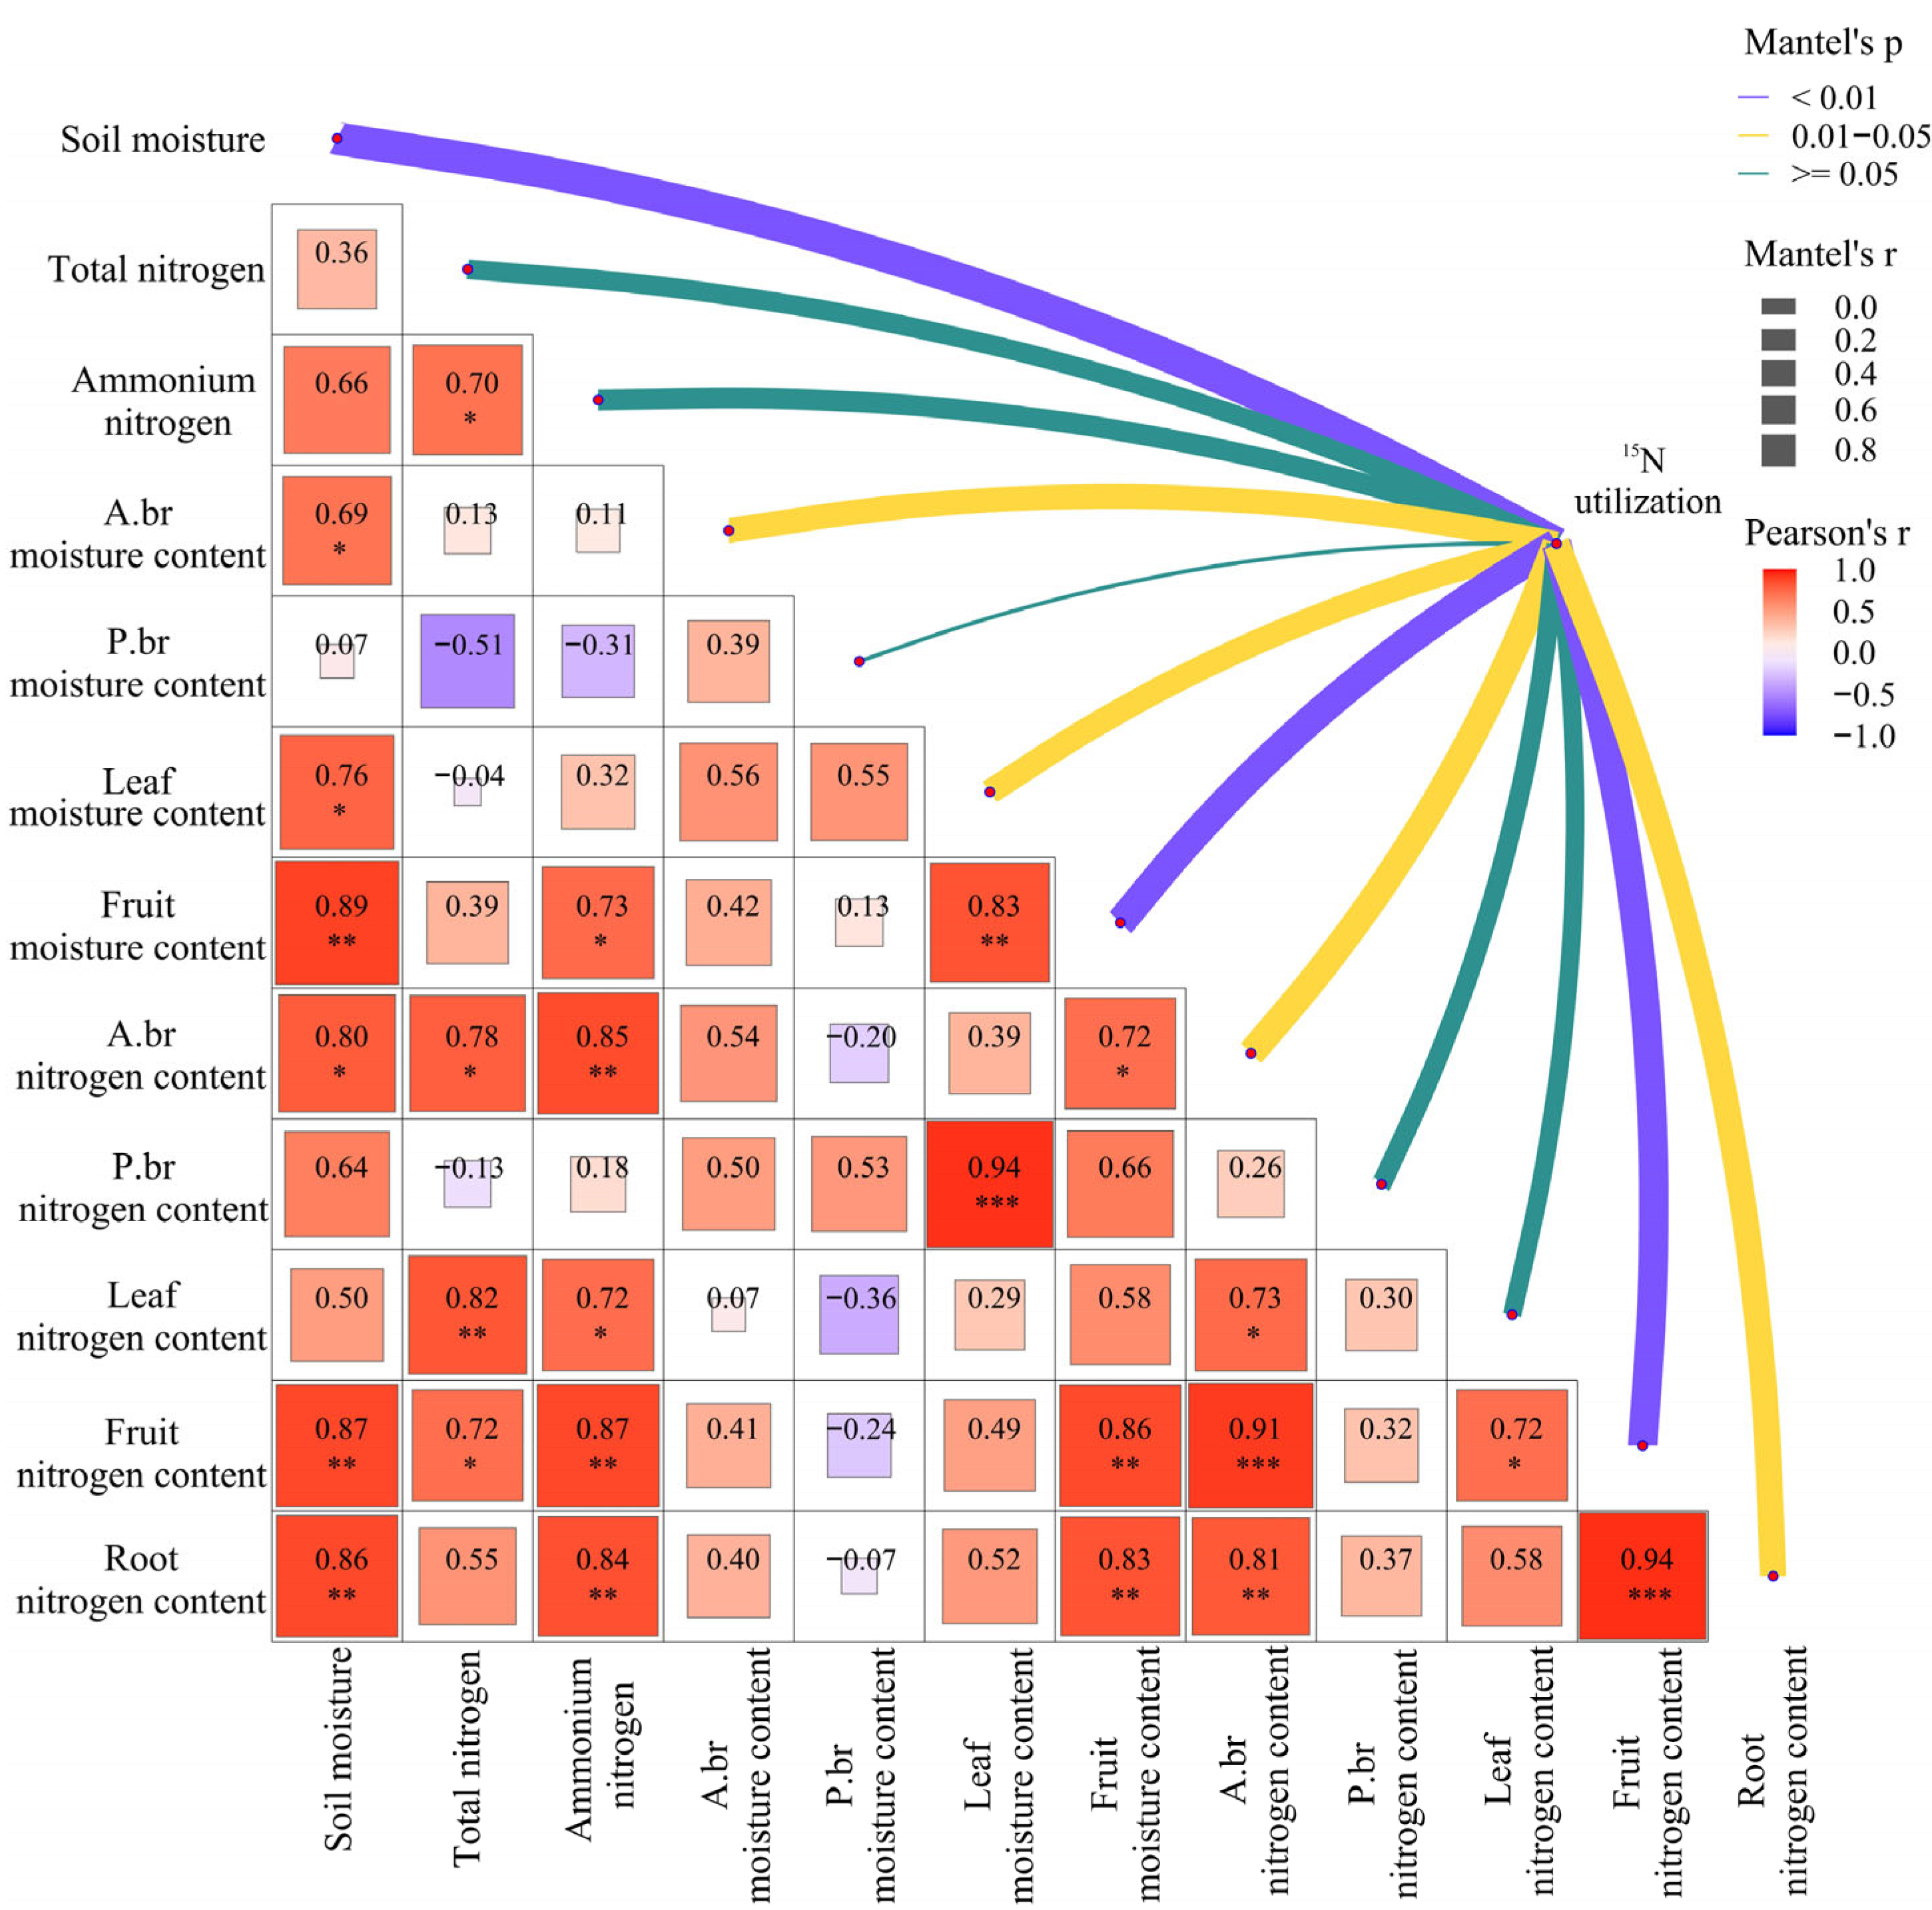
The soil moisture in the root zone significantly affected the water and nitrogen content of newly formed organs in fragrant pear and was significantly positively correlated with the water and nitrogen content of newly formed organs (p < 0.05); there was a certain positive correlation (p < 0.05) between the soil’s nitrogen content and the nitrogen content in newly formed organs, which jointly regulated and promoted the absorption and utilization of nitrogen by pear organs. The soil moisture (r = 0.850, p = 0.001), leaf moisture (r = 0.355, p = 0.043), annual branch moisture (r = 0.360, p = 0.040), annual branch nitrogen content (r = 0.543, p = 0.015), fruit moisture (r = 0.667, p = 0.003), fruit nitrogen content (r = 0.627, p = 0.005), and root nitrogen content (r = 0.440, p = 0.022) were all significantly correlated with the 15N utilization efficiency (Figure 9). However, although the soil’s total nitrogen, ammonium nitrogen content, perennial branch moisture, and nitrogen content had a certain degree of influence on 15N utilization, they had not reached a significant level (p > 0.05). Analysis showed that the soil’s moisture regulated the absorption and utilization of 15N by fragrant pears by affecting the organ’s water and nitrogen nutrition.

4. Discussion

4.1. Distribution Characteristics of Soil Water and Nitrogen in the Root Zone

The dynamic fluctuations in the soil’s water and nitrogen are profoundly influenced by irrigation practices and nitrogen application rates [21]. Under different irrigation conditions, the moisture content in shallow soil layers can be maintained within a healthy range. Isotopic data indicate that 48% of stem water and 26% of leaf water in fruit trees are derived from the nutrient-enriched 0–60 cm root zone, while the remainder originates mainly from pre-existing plant water and deeper soil water, reflecting the multi-source nature of water uptake [22]. In contrast, nitrogen absorption is predominantly concentrated within this nutrient-rich soil layer. Maintaining adequate moisture in this zone helps to optimize the rhizosphere environment, sustain root activity, and thereby promote nitrogen uptake and transport via the transpiration stream. The effect of irrigation treatment W1 on the water content of the middle soil layer (40–80 cm) was relatively modest, as pear tree root absorption was most concentrated between 20 and 60 cm depths. However, roots also extended into the 60–80 cm layer, albeit to a lesser extent. In contrast, irrigation treatment W2 effectively enhanced the water-holding capacity of the middle soil layers (40–80 cm), thereby facilitating improved water and nutrient absorption by the root system (Figure 3).
There were significant differences in the spatial distribution of nitrogen in different layers of soil under different conditions. The results of this study revealed that the 0–20 cm surface soil layer exhibited higher nitrogen enrichment characteristics. This shallow soil layer also tends to have a greater organic matter content and microbial activity, both of which enhance microbial-mediated nitrogen retention and stabilization in the soil organic pool [16]; the 60–80 cm soil layer likely serves as a critical zone for soil nitrogen cycling, where the spatial variability of total nitrogen content decreases significantly and reaches a state of stabilization (Figure 4). This suggests that the turnover rate of nitrogen pools in deeper soil layers is slower, which is likely due to a combination of limited root penetration and reduced microbial abundance and activity with increasing soil depth [23,24]. Additionally, water–nitrogen regulation significantly affects the vertical spatial distribution pattern of the soil’s nitrogen [25]. The ammonium nitrogen content showed a significant decreasing trend in the 20–40 cm soil layer and reached its lowest value in the 40–80 cm layer. This distribution pattern is primarily related to the chemical properties of ammonium nitrogen, which is readily adsorbed by soil colloids and exhibits low mobility, as well as the influence of the pear tree root uptake within this soil layer. Notably, under the N1 treatment, nitrogen transport was constrained by the lower nitrogen content, leading to a relatively homogeneous nitrogen distribution in the middle soil layer. However, at the N2 and N3 application levels, the nitrogen content in the middle soil layer (40–80 cm) of the W2 treatment was significantly lower than that of the W1 and W3 treatments, which may be under W2 conditions, which established an aerobic environment that was more conducive to the microbial processes involved in soil nitrogen transformation [26], promoting nitrogen conversion and subsequently being absorbed by the pear root system. Furthermore, the increased irrigation volume under W3 intensified the nitrogen leaching, promoting nitrogen movement to deeper soil layers (below 80 cm), may also exacerbate the horizontal diffusion of nitrogen, resulting in the accumulation and loss of soil nitrogen [27] (Figure 4). It is worth considering that the nitrate nitrogen content in each soil layer was relatively low in the experiment, and there was no significant difference. There are two reasons for this: (1) plants might preferentially absorb nitrate nitrogen through selective absorption mechanisms, resulting in a small residual amount in the soil; and (2) the high abundance and activity of denitrifying bacteria in the soil could result in the conversion of nitrate into gaseous nitrogen.

4.2. Dynamic Characteristics of Water and Nitrogen in Pear Organs

The water status of plant tissues is a critical factor influencing cellular metabolism and nutrient transport. Adequate water availability is essential for maintaining turgor pressure within cells, which is crucial for supporting cell structures and metabolic functions. The water content of plant organs directly impacts various physiological processes, including nutrient transport and overall plant vitality [28]. Throughout the different growth stages, the water content of newly developed organs was highest during the bud break stage, reflecting the typical water-retention characteristics of young tissues in the cell expansion phase. Vigorous early plant growth is accompanied by high transpiration demand and substantial water transport flux to maintain turgor, metabolism, and organ differentiation. Thus, water availability mainly influences growth and development at this stage by regulating the transpiration flow and its coupling with xylem nutrient transport [29]. This suggests that pear trees experience substantial water demand early in their growth cycle to sustain cellular turgor pressure, metabolic activity, and organ differentiation. During the late stage of vegetative organ growth, increased transpirational demand and limited root water uptake capacity jointly contribute to the decline in organ water potential. This change in water potential is primarily a result of the plant’s active accumulation of inorganic ions to maintain osmotic regulation and support growth, while drought stress further exacerbates water scarcity in plants, fundamentally limiting the absorption and translocation of nutrients within the plant [30]. The lower organ water content under the W1 treatment indicates that the plants were likely experiencing mild water stress (Figure 5), and this condition directly inhibited nitrogen uptake and transport by the roots, thereby resulting in an imbalance in nitrogen nutrition within the plants [31]. On the contrary, excess water can increase extracellular water potential pressure, which may inhibit cellular metabolic activity and negatively affect the elongation of cell walls [32].
Nitrogen, a key macronutrient for plant growth and development, plays an essential role in various metabolic processes and is central to the overall health of plants. The nitrogen content of plant organs is an important indicator of nutritional status and growth performance [33,34]. As the key functional organ for photosynthetic carbon assimilation and nitrogen metabolism, leaves’ nitrogen content directly influences biomass accumulation and yield formation [35]. During the bud break stage, the nitrogen content in various organs is significantly higher than in later phases, as it is rapidly assimilated for immediate organ development. Once the relatively low nitrogen requirement at this stage is met, further nitrogen addition does not increase the fruit yield. Instead, it often leads to a decline in the yield due to excessive vegetative growth, which competes with fruit development for resources. As plants progress through the reproductive stages, the rate of biomass accumulation in the newly formed organs outpaces the nitrogen accumulation, leading to the stabilization of nitrogen levels in the newly formed organs during the mature stage. The efficiency of nutrient utilization is, to some extent, influenced by the soil moisture availability [36]. Under optimal moisture conditions, plants maintain a balanced nitrogen transport system, absorbing nitrogen from the soil through their roots and effectively distributing it to organs such as leaves, stems, and fruits. Consequently, the nitrogen content of the W2 treatment was maintained at a relatively high level, reflecting the efficient and balanced regulation and utilization of nitrogen by the plant. This study found that perennial branches primarily serve the function of stabilizing nitrogen storage and buffering, while newly developed organs are the key targets that respond to water and nitrogen regulation, determining seasonal growth and yield formation. Therefore, for precision nitrogen management in fragrant pear trees, emphasis should be placed on ensuring an adequate nitrogen supply from leaf expansion to early fruit development to support the full growth of new organs. Additionally, attention must be given to the potential negative effects of excessive nitrogen, which may overstimulate vegetative growth in new shoots and compete with fruits for assimilates, thereby adversely impacting the fruit quality. Notably, the nitrogen content of various organs in W3N3 and W2N2 treatments remained at the highest level, although the difference between the two was not statistically significant. This result suggests two potential underlying mechanisms. First, an excessive water and nitrogen supply can inhibit the activity of nitrogen transporters [37], disrupting the nitrogen transport balance and emphasizing the importance of coordinated water–nitrogen management [38]. Second, when the nitrogen supply exceeds the physiological threshold of plants, it may trigger a negative feedback regulation mechanism, reducing nitrogen absorption by the roots and promoting non-productive nitrogen loss [39] (Figure 6).

4.3. Regulation and Utilization Mechanism of Nitrogen Resources

The nitrogen absorbed by plants is preferentially allocated to the biosynthesis and morphological construction of new plant organs. The nitrogen allocation dynamics across various organs in mature fruit trees exhibit significant heterogeneity. Research has indicated that the nitrogen distribution factor (Ndff) is highest in leaves, followed by roots, annual branches, and perennial branches, with fruits having the lowest ratio [40]. However, this study found that the root system is the primary organ for nitrogen absorption and storage, followed by fruits and leaves. In contrast, the nitrogen utilization priority in the annual, main, and perennial branches was notably reduced (Figure 7). The difference in this allocation pattern may be attributed to the regulatory effects of nitrogen fertilizer application on plants’ nitrogen absorption, transport, distribution, and assimilation efficiency. Spring nitrogen application efficiently promotes the balanced distribution of nitrogen to newly developing organs [41]. Fertilizer applied during the bud break and flowering periods resulted in the highest Ndff in the root system. As the fruit develops, the nitrogen, initially absorbed by the roots, is gradually transported to the fruit, increasing the Ndff value. During the fruit development stage, the leaves are fully developed and photosynthetic activity reaches a high level. Fruit development mainly relies on early nitrogen absorption. In the later stages of growth, the priority of nitrogen allocation in plants may shift. The root system may redistribute some of the stored nitrogen to aboveground organs. However, because of the root system’s nitrogen demand, the fertilizer nitrogen absorbed by the roots is preferentially used to maintain the roots’ physiological functions rather than being transported to the fruit. This pattern is similar to the high nitrogen demand observed in annual almond organs (leaves and fruits) during early growth stages [42]. During later growth stages, the small amount of nitrogen that may be absorbed by the root system is primarily allocated to perennial tissues for storage, providing essential nutrient reserves for the following year’s bud break and early growth [43,44].
At the end of the fertility period, nitrogen assimilation in the newly formed organs of fragrant pear reaches a stable accumulation state. The perennial branches, roots, and leaves are the primary storage organs, with the highest nitrogen accumulation observed in these organs, confirming that roots, developing leaves, and stems or trunks are the strongest nitrogen absorbers [45]. The nitrogen storage capacities of fruits and annual branches are relatively low. During the early stages of leaf shedding, fruit trees utilize nitrogen redistribution mechanisms to transport nitrogen from aging leaves to other storage organs [44]. Irrigation and nitrogen application significantly enhance the total nitrogen accumulation in stems, leaves, and overall plant biomass, promoting nitrogen assimilation [6,45]. Water serves as a carrier of nitrogen dissolution and migration within the soil, affecting the activity of antioxidant enzymes in plants [46], thereby facilitating nitrogen assimilation (Figure 8). Under identical water supply conditions, the nitrogen fertilizer utilization efficiency exhibited a notable decreasing trend with an increasing nitrogen application rate. Conversely, an increased water gradient significantly improves the nitrogen uptake efficiency by enhancing the rhizosphere nitrogen mobility [40]. However, the findings of this study present a deviation; under equal nitrogen conditions, the nitrogen-use efficiency of W2 treatment was significantly higher than that of the other water treatments (p < 0.05), demonstrating optimal nitrogen assimilation performance [47]. The soil’s moisture status can disrupt plant carbon and nitrogen metabolic processes, potentially exacerbating physiological disorders in plants [48] and slightly reducing the nitrogen-use efficiency. Water stress constraints lead to fruit trees prioritizing nitrogen allocation for physiological processes that are essential for maintaining basic metabolism and stress resistance. As a result, N2 exhibited the highest nitrogen utilization efficiency. When there is sufficient water, the growth potential of fruit trees is released to a certain extent, significantly improving the nitrogen assimilation efficiency and biomass accumulation. In this context, N3 has demonstrated the highest nitrogen utilization efficiency, reflecting the dynamic adaptive mechanism of fruit trees to nitrogen resource availability under varying environmental conditions (Table 2).

5. Conclusions

This study analyzed the effects of irrigation and nitrogen application rates on the spatial distribution of soil’s water and nitrogen within the root zone of fragrant pear, the dynamic characteristics of organ nutrition, and the absorption and utilization of nitrogen. The 3-year experimental results revealed that the 20–80 cm soil depth was the core zone for water and nitrogen absorption by the young pear tree root system. The regulation of water and nitrogen resources maintains a steady-state mechanism that ensures the balanced distribution of nutrients across the various organs of fragrant pear. Throughout the growth period, under the condition of an irrigation volume of 6000 m3·ha−1, each newly formed organ exhibited optimal water and nitrogen nutrition characteristics. Soil’s moisture content significantly influences the water balance of pear tree organs, thereby regulating the allocation and utilization of nitrogen. This reflects the dynamic regulation of nitrogen resources by pear trees under different environmental conditions. An irrigation volume of 6000 m3·ha−1 combined with a nitrogen application rate of 400 kg·ha−1 effectively improved the nitrogen absorption and assimilation in fragrant pear plants, thereby minimizing 15N loss in the environment. This study provides innovative solutions for optimizing water and nitrogen resource utilization, establishing water- and nitrogen-saving efficient orchards, and promoting sustainable development in the forestry and fruit industry.

Author Contributions

The authors confirm their contributions to the paper as follows: Writing—original draft: L.Z.; Investigation: L.Z.; Methodology: L.Z.; Conceptualization: L.Z.; Validation: F.Z.; Data curation: F.Z.; Formal analysis: F.Z., X.H., and Q.Z.; Resources: Y.W. and Y.L.; Supervision: Y.W. and Y.L.; Writing—review and editing: Y.W., Y.L., M.A.F., and C.W.; Funding acquisition: X.H. and Q.Z.; Visualization: X.H. and Q.Z. All authors have read and agreed to the published version of the manuscript.

Funding

This research was funded by the Ministry of Science and Technology of the People’s Republic of China—Third Comprehensive Scientific Expedition to Xinjiang (Grant No. 2021xjkk0804) and Corps Financial Science and Technology Plan Projects of Xinjiang Province, China (Grant No. 2022DB020, 2022DB023, 2023TSYCCX0114). We are also very grateful to the anonymous reviewers for their valuable comments on the manuscript.

Data Availability Statement

The original contributions presented in this study are included in the article. Further inquiries can be directed to the corresponding author(s).

Acknowledgments

We sincerely thank everyone who contributed their time and effort to the manuscript.

Conflicts of Interest

The authors declare no conflicts of interest.

References

  1. Liu, S.; Zhang, C.; Shen, T.; Zhan, Z.; Peng, J.; Yu, C.; Jiang, L.; Dong, Z. Efficient agricultural drip irrigation inspired by fig leaf morphology. Nat. Commun. 2023, 14, 5934. [Google Scholar] [CrossRef] [Scilit]
  2. Tong, X.; Wu, P.; Liu, X.; Zhang, L.; Zhou, W.; Wang, Z. A global meta-analysis of fruit tree yield and water use efficiency under deficit irrigation. Agric. Water Manag. 2022, 260, 107321. [Google Scholar] [CrossRef] [Scilit]
  3. Gu, B.; Zhang, X.; Lam, S.K.; Yu, Y.; Van Grinsven, H.J.; Zhang, S.; Wang, X.; Bodirsky, B.L.; Wang, S.; Duan, J.; et al. Cost-effective mitigation of nitrogen pollution from global croplands. Nature 2023, 613, 77–84. [Google Scholar] [CrossRef] [Scilit] [PubMed]
  4. Dai, Z.; Fei, L.; Huang, D.; Zeng, J.; Chen, L.; Cai, Y. Coupling effects of irrigation and nitrogen levels on yield, water and nitrogen use efficiency of surge-root irrigated jujube in a semiarid region. Agric. Water Manag. 2019, 213, 146–154. [Google Scholar] [CrossRef] [Scilit]
  5. Tian, Y.; Tian, L.; Wang, F.; Shi, X.; Shi, F.; Hao, X.; Li, N.; Chenu, K.; Luo, H.; Yang, G. Optimizing nitrogen application improves its efficiency by higher allocation in bolls of cotton under drip fertigation. Field Crops Res. 2023, 298, 108968. [Google Scholar] [CrossRef] [Scilit]
  6. Xu, M.; Zhang, Y.; Wang, Y.; Wang, L.; Bai, Y.; Lu, Y. Optimizing nitrogen input and nitrogen use efficiency through soil nitrogen balance in a long-term winter wheat-summer maize rotation system in North China. Eur. J. Agron. 2023, 149, 126908. [Google Scholar] [CrossRef] [Scilit]
  7. Chen, R.; Liu, W.; Yang, H.; Jin, X.; Yang, G.; Zhou, Y.; Zhang, C.; Han, S.; Meng, Y.; Zhai, C.; et al. A novel framework to assess apple leaf nitrogen content: Fusion of hyperspectral reflectance and phenology information through deep learning. Comput. Electron. Agric. 2024, 219, 108816. [Google Scholar] [CrossRef] [Scilit]
  8. Liu, Y.; Wang, H.; Jiang, Z.; Wang, W.; Xu, R.; Wang, Q.; Zhang, Z.; Li, A.; Liang, Y.; Ou, S.; et al. Genomic basis of geographical adaptation to soil nitrogen in rice. Nature 2021, 590, 600–605. [Google Scholar] [CrossRef] [Scilit]
  9. You, L.; Ros, G.H.; Chen, Y.; Shao, Q.; Young, M.D.; Zhang, F.; De Vries, W. Global mean nitrogen recovery efficiency in croplands can beenhanced by optimal nutrient, crop and soil management practices. Nat. Commun. 2023, 14, 5747. [Google Scholar] [CrossRef] [Scilit]
  10. Quinet, M.; Warzée, M.; Vanderplanck, M.; Michez, D.; Lognay, G.; Jacquemart, A.L. Do floral resources influence pollination rates and subsequent fruit set in pear (Pyrus communis L.) and apple (Malus × domestica Borkh) cultivars? Eur. J. Agron. 2016, 77, 59–69. [Google Scholar] [CrossRef] [Scilit]
  11. Greer, D.H. Photosynthetic responses to CO2 at different leaf temperatures in leaves of apple trees (Malus domestica) grown in orchard conditions with different levels of soil nitrogen. Environ. Exp. Bot. 2018, 155, 56–65. [Google Scholar] [CrossRef] [Scilit]
  12. Wang, J.; Wen, X. Divergent responses of nitrogen availability to aridity in drylands. Plant Soil 2023, 482, 111–125. [Google Scholar] [CrossRef] [Scilit]
  13. Raj, R.; Walker, J.P.; Pingale, R.; Banoth, B.N.; Jagarlapudi, A. Leaf nitrogen content estimation using top-of-canopy airborne hyperspectral data. Int. J. Appl. Earth Obs. Geoinf. 2021, 104, 102584. [Google Scholar] [CrossRef] [Scilit]
  14. Li, H.; Zhang, J.; Xu, K.; Jiang, X.; Zhu, Y.; Cao, W.; Ni, J. Spectral monitoring of wheat leaf nitrogen content based on canopy structure information compensation. Comput. Electron. Agric. 2021, 190, 106434. [Google Scholar] [CrossRef] [Scilit]
  15. Azadnia, R.; Rajabipour, A.; Jamshidi, B.; Omid, M. New approach for rapid estimation of leaf nitrogen, phosphorus, and potassium contents in apple-trees using Vis/NIR spectroscopy based on wavelength selection coupled with machine learning. Comput. Electron. Agric. 2023, 207, 107746. [Google Scholar] [CrossRef] [Scilit]
  16. Gao, F.; Li, Z.; Gao, Y.; Gaoyang, E.; Li, M.; Li, C.; Cheng, Y.; Zhang, T.; Wang, S.; Wu, L.; et al. The effect of long-term controlled-release urea application on the relative abundances of plant growth-promoting microorganisms. Eur. J. Agron. 2023, 151, 126971. [Google Scholar] [CrossRef] [Scilit]
  17. Stocker, B.D.; Dong, N.; Perkowski, E.A.; Schneider, P.D.; Xu, H.; de Boer, H.J.; Rebel, K.T.; Smith, N.G.; Sundert, K.V.; Wang, H.; et al. Empirical evidence and theoretical understanding of ecosystem carbon and nitrogen cycle interactions. New Phytol. 2025, 245, 49–68. [Google Scholar] [CrossRef] [Scilit]
  18. Thalheimer, M.; Aguzzoni, A.; Wittemann, M.S.; Carlino, U.; Tagliavini, M. Root water uptake and water transport to above-ground organs compensate for winter water losses and prevent shoot dehydration in apple trees. Agric. Water Manag. 2024, 291, 108622. [Google Scholar] [CrossRef] [Scilit]
  19. Li, N.; Shi, X.; Zhang, H.; Shi, F.; Zhang, H.; Liang, Q.; Hao, X.; Luo, H.; Wang, J. Optimizing irrigation strategies to improve the soil microenvironment and enhance cotton water productivity under deep drip irrigation. Agric. Water Manag. 2024, 305, 109095. [Google Scholar] [CrossRef] [Scilit]
  20. Lu, C.; Wang, X.; Gai, A. Effects of continuous rainout deficit on growth and yield of spring wheat in the semi-arid region of the Loess Plateau, China. In Proceedings of the 2024 12th International Conference on Agro-Geoinformatics (Agro-Geoinformatics), Novi Sad, Serbia, 15–18 July 2024; IEEE: New York City, NY, USA, 2024; pp. 1–6. [Google Scholar] [CrossRef] [Scilit]
  21. Li, Y.; Huang, G.; Chen, Z.; Xiong, Y.; Huang, Q.; Xu, X.; Huo, Z. Effects of irrigation and fertilization on grain yield, water and nitrogen dynamics and their use efficiency of spring wheat farmland in an arid agricultural watershed of Northwest China. Agric. Water Manag. 2022, 260, 107277. [Google Scholar] [CrossRef] [Scilit]
  22. Aguzzoni, A.; Engel, M.; Zanotelli, D.; Penna, D.; Comiti, F.; Tagliavini, M. Water uptake dynamics in apple trees assessed by an isotope labeling approach. Agric. Water Manag. 2022, 266, 107572. [Google Scholar] [CrossRef] [Scilit]
  23. Xu, X.; Thornton, P.E.; Post, W.M. A global analysis of soil microbial biomass carbon, nitrogen and phosphorus in terrestrial ecosystems. Glob. Ecol. Biogeogr. 2013, 22, 737–749. [Google Scholar] [CrossRef] [Scilit]
  24. Fierer, N. Embracing the unknown: Disentangling the complexities of the soil microbiome. Nat. Rev. Microbiol. 2017, 15, 579–590. [Google Scholar] [CrossRef] [Scilit] [PubMed]
  25. Luo, Z.; Hu, Q.; Tang, W.; Wang, X.; Lu, H.; Zhang, Z.; Liu, T.; Kong, X. Effects of N fertilizer rate and planting density on short-season cotton yield, N agronomic efficiency and soil N using 15N tracing technique. Eur. J. Agron. 2022, 138, 126546. [Google Scholar] [CrossRef] [Scilit]
  26. Yang, Y.; Wang, C.; He, X.; Wang, H.; Wang, Y.; Zhou, F.; Qin, D.; Fan, Z. Study on the effects of winter irrigation during seasonal freezing–thawing period on soil microbial ecological properties. Sci. Rep. 2025, 15, 23586. [Google Scholar] [CrossRef] [Scilit]
  27. Min, J.; Zhang, H.; Shi, W. Optimizing nitrogen input to reduce nitrate leaching loss in greenhouse vegetable production. Agric. Water Manag. 2012, 111, 53–59. [Google Scholar] [CrossRef] [Scilit]
  28. Wu, Y.; Hou, Z.; Liu, Y.; Liu, W. Leaf Moisture Content Detection Method Based on UHF RFID and Hyperdimensional Computing. Forests 2024, 15, 1798. [Google Scholar] [CrossRef] [Scilit]
  29. Delgado-Baquerizo, M.; Maestre, F.T.; Gallardo, A.; Bowker, M.A.; Wallenstein, M.D.; Quero, J.L.; Ochoa, V.; Gozalo, B.; Garcia-Gómez, M.; Soliveres, S.; et al. Decoupling of soil nutrient cycles as a function of aridity in global drylands. Nature 2013, 502, 672–676. [Google Scholar] [CrossRef] [Scilit]
  30. Wang, Y.; Bertelsen, M.G.; Petersen, K.K.; Andersen, M.N.; Liu, F. Effect of root pruning and irrigation regimes on leaf water relations and xylem ABA and ionic concentrations in pear trees. Agric. Water Manag. 2014, 135, 84–89. [Google Scholar] [CrossRef] [Scilit]
  31. Sánchez-Rodríguez, E.; del Mar Rubio-Wilhelmi, M.; Cervilla, L.M.; Blasco, B.; Rios, J.J.; Leyva, R.; Romero, L.; Ruiz, J.M. Study of the ionome and uptake fluxes in cherry tomato plants under moderate water stress conditions. Plant Soil 2010, 335, 339–347. [Google Scholar] [CrossRef] [Scilit]
  32. Feng, W.; Lindner, H.; Robbins, N.E.; Dinneny, J.R. Growing out of stress: The role of cell-and organ-scale growth control in plant water-stress responses. Plant Cell 2016, 28, 1769–1782. [Google Scholar] [CrossRef] [Scilit] [PubMed]
  33. Gao, D.; Sun, W.; Wang, D.; Dong, H.; Zhang, R.; Yu, S. A xylan glucuronosyltransferase gene exhibits pleiotropic effects on cellular composition and leaf development in rice. Sci. Rep. 2020, 10, 3726. [Google Scholar] [CrossRef] [Scilit] [PubMed]
  34. Bao, J.; Yu, M.; Li, J.; Wang, G.; Tang, Z.; Zhi, J. Determination of leaf nitrogen content in apple and jujube by near-infrared spectroscopy. Sci. Rep. 2024, 14, 20884. [Google Scholar] [CrossRef] [Scilit] [PubMed]
  35. Chen, Y.; Ma, X.; He, Z.; Ci, B.; Liu, Y.; Ma, F. Optimal phosphorus proportion increases cotton yields in low nitrogen environments by enhancing mid-upper canopy biomass and nitrogen utilization. Ind. Crops Prod. 2024, 222, 119449. [Google Scholar] [CrossRef] [Scilit]
  36. Plett, D.C.; Ranathunge, K.; Melino, V.J.; Kuya, N.; Uga, Y.; Kronzucker, H.J. The intersection of nitrogen nutrition and water use in plants: New paths toward improved crop productivity. J. Exp. Bot. 2020, 71, 4452–4468. [Google Scholar] [CrossRef] [Scilit]
  37. Tegeder, M.; Masclaux-Daubresse, C. Source and sink mechanisms of nitrogen transport and use. New Phytol. 2018, 217, 35–53. [Google Scholar] [CrossRef] [Scilit]
  38. Celette, F.; Gary, C. Dynamics of water and nitrogen stress along the grapevine cycle as affected by cover crop. Eur. J. Agron. 2013, 45, 142–152. [Google Scholar] [CrossRef] [Scilit]
  39. Stamatiadis, S.; Tsadilas, C.; Samaras, V.; Schepers, J.S.; Eskridge, K. Nitrogen uptake and N-use efficiency of Mediterranean cotton under varied deficit irrigation and N fertilization. Eur. J. Agron. 2016, 73, 144–151. [Google Scholar] [CrossRef] [Scilit]
  40. Lan, G.; Feng, Y.; Ma, W.; Feng, T.; Lu, Y.; Mao, J.; Chen, B. 15N isotope labeled tracking of the nitrogen utilization of apple under water and nitrogen coupling application in arid and semiarid areas. Agronomy 2024, 14, 1245. [Google Scholar] [CrossRef] [Scilit]
  41. Colpaert, B.; Steppe, K.; Gomand, A.; Vanhoutte, B.; Remy, S.; Boeckx, P. Experimental approach to assess fertilizer nitrogen use, distribution, and loss in pear fruit trees. Plant Physiol. Biochem. 2021, 165, 207–216. [Google Scholar] [CrossRef] [Scilit]
  42. Muhammad, S.; Sanden, B.L.; Lampinen, B.D.; Saa, S.; Siddiqui, M.I.; Smart, D.R.; Olivos, A.; Shackel, K.A.; DeJong, T.; Brown, P.H. Seasonal changes in nutrient content and concentrations in a mature deciduous tree species: Studies in almond (Prunus dulcis (Mill.) DA Webb). Eur. J. Agron. 2015, 65, 52–68. [Google Scholar] [CrossRef] [Scilit]
  43. Tagliavini, M.; Asensio, D.; Andreotti, C. Increasing nitrogen cycling in deciduous fruit orchards and vineyards to enhance N use efficiency and reduce N losses–A review. Eur. J. Agron. 2025, 167, 127561. [Google Scholar] [CrossRef] [Scilit]
  44. Tan, B.Z.; Close, D.C.; Quin, P.R.; Swarts, N.D. Nitrogen use efficiency, allocation, and remobilization in apple trees: Uptake is optimized with pre-harvest N supply. Front. Plant Sci. 2021, 12, 657070. [Google Scholar] [CrossRef] [Scilit]
  45. Liu, R.; Yang, Y.; Wang, Y.S.; Wang, X.C.; Rengel, Z.; Zhang, W.J.; Shu, L.Z. Alternate partial root-zone drip irrigation with nitrogen fertigation promoted tomato growth, water and fertilizer-nitrogen use efficiency. Agric. Water Manag. 2020, 233, 106049. [Google Scholar] [CrossRef] [Scilit]
  46. Mahajan, M.; Thakur, B.K.; Pal, P.K. Moisture stress and nitrogen availability modulate the secondary metabolite profiles, enzymatic activity, and physiological and agronomic traits of Stevia rebaudiana. Plant Physiol. Biochem. 2021, 162, 56–68. [Google Scholar] [CrossRef] [Scilit]
  47. Zhao, H.; Sun, S.; Zhang, L.; Yang, J.; Wang, Z.; Ma, F.; Li, M. Carbohydrate metabolism and transport in apple roots under nitrogen deficiency. Plant Physiol. Biochem. 2020, 155, 455–463. [Google Scholar] [CrossRef] [Scilit]
  48. Xing, H.; Zhou, W.; Wang, C.; Li, L.; Li, X.; Cui, N.; Hao, W.; Liu, F.; Wang, Y. Excessive nitrogen application under moderate soil water deficit decreases photosynthesis, respiration, carbon gain and water use efficiency of maize. Plant Physiol. Biochem. 2021, 166, 1065–1075. [Google Scholar] [CrossRef] [Scilit]
Figure 1. Meteorological data for the growth period of fragrant pears from 2022 to 2024. The blue line represents air temperature, the black double-dotted line represents relative humidity, and the red bars represent precipitation.
Horticulturae 12 00144 g001
Figure 2. Experimental design and field layout. (a) The experimental layout and (b) the isotope measurement layout.
Horticulturae 12 00144 g002
Figure 3. Temporal and spatial variation characteristics of moisture in the root zone soil. In (a) 2022, (b) 2023, and (c) 2024. The contour map represents the moisture content at different depths of the soil, with blue representing high moisture states and red representing low moisture states.
Horticulturae 12 00144 g003
Figure 4. Spatial distribution characteristics of nitrogen in the root zone soil. (a), (b), and (c) represent the total nitrogen content in each soil layer for the years 2022, 2023, and 2024, respectively; (d), (e), and (f) represent the ammonium nitrogen content in each soil layer for the corresponding years. The line chart illustrates the total nitrogen or ammonium nitrogen content across soil layers, whereas the bar chart depicts their content within each soil layer region. Different lowercase letters represent significant differences between treatments (p < 0.05): the same applies below.
Horticulturae 12 00144 g004
Figure 5. Water dynamics of fragrant pear organs: from nutritional growth to fruit ripening. (a) Sprout and leaf expansion stage, (b) early fruit enlargement stage, (c) late fruit enlargement stage, and (d) fruit ripening stage. Colorless columns represent fresh weight, while gradient columns represent dry weight. A. Br represents annual branch and P. br represents perennial branch; the same applies below.
Horticulturae 12 00144 g005
Figure 6. (ad) correspond to four key phenological stages of Korla fragrant pear: (a) blossom and fruit stage, (b) early fruit development stage, (c) late fruit development stage, and (d) fruit maturation stage. Nitrogen dynamics of fragrant pear organs: from nutritional growth to fruit ripening. Different lowercase letters represent significant differences in organ nitrogen content between treatments (p < 0.05).
Horticulturae 12 00144 g006
Figure 7. Ripening stage fragrant pear organ nitrogen fertilizer contribution rate (Ndff). Different colors in the figure represent the Ndff values corresponding to different organs along the horizontal axis, while different lowercase letters on the same colored column indicate significant differences in Ndff values of that organ between different treatments (p < 0.05).
Horticulturae 12 00144 g007
Figure 8. Characteristics of nitrogen accumulation and 15N absorption and utilization in fragrant pear organs. Different lowercase letters represent significant differences between treatments (p < 0.05). The dots in the left figure represent the nitrogen accumulation of each organ, the middle bar chart represents the total nitrogen accumulation of pear plants, and the right bar chart represents the 15N absorption of pear plants. The varying colors of the bars denote the average values of total nitrogen content or 15N uptake across different treatments on the left side of Figure 8, while different symbols in the right graph correspond to the actual measured values of 15N uptake for the respective treatments.
Horticulturae 12 00144 g008
Figure 9. Analysis of factors affecting nitrogen absorption and utilization in fragrant pear. The upper right network diagram shows the Mantel test results between 15N utilization and each factor. The thickness of the lines between 15N utilization and each factor indicates the magnitude of their correlation (Mantel’ r). The color of the lines between 15N utilization and each factor represents significance (Mantel’ p). The bottom left heatmap shows the Pearson correlation between various indicators, where the larger the square area, the greater the absolute value of the correlation coefficient. The asterisk represents the magnitude of significance; *, ** and *** represent p < 0.05, p < 0.01, and p < 0.001, respectively.
Horticulturae 12 00144 g009
Table 1. Irrigation and fertilization plan for fragrant pear growth period.
Growth StageDateIrrigation Amount15N UreaFertilization Amount (kg·ha−1)
(m3·ha−1)NPK
20222023W1W2W3(g/Plant)N1N2N3
Sprout and leaf expansion stage1 April1 April---------
7 April7 April---------
Blossom and fruit stage15 April15 April22530037566191121169
5 May10 May22530037566191121169
Fruit development stage20 May5 June225300375------
5 June20 June562.5750937.54223246509
25 June30 June562.5750937.54223246509
10 July10 July6759001125------
20 July25 July6759001125-1727331632
5 August10 August6759001125-1727331632
Ripening stage25 August30 August6759001125------
15 September15 September---------
Total--45006000750020200300400164100
Growth stageDateIrrigation amount15N ureaFertilization amount (kg·ha−1)
(m3·ha−1)NPK
2024W1W2W3(g/plant)N1N2N3
Sprout and leaf expansion stage1 April---------
7 April---------
Blossom and fruit stage15 April22530037566191121169
30 April22530037566191121169
Fruit development stage15 May225300375------
30 May4506007504223246509
10 June4506007504223246509
20 June6759001125------
30 June6759001125-1727331632
10 July450600750-1727331632
20 July450600750------
5 August225300375------
Ripening stage25 August225300375------
5 September225300375------
15 September---------
Total-45006000750020200300400164100
Table 2. The effect of water–nitrogen coupling regulation on the utilization efficiency, residual, and loss characteristics of 15N in fragrant pear.
Treatment15N Utilization Rate %15N Residual Rate %15N Loss Rate %
W1N129.47 ± 1.60 e18.68 ± 1.54 b51.85 ± 2.90 b
W2N133.71 ± 1.71 cd21.16 ± 2.36 b45.13 ± 3.61 cde
W3N129.19 ± 1.70 e12.71 ± 1.88 c58.10 ± 3.40 a
W1N234.25 ± 2.06 bcd26.93 ± 2.16 a38.82 ± 4.14 f
W2N240.79 ± 2.06 a12.27 ± 0.92 c46.94 ± 2.63 bcd
W3N235.11 ± 2.27 bcd14.68 ± 0.73 c50.21 ± 2.68 bc
W1N331.99 ± 1.51 de29.28 ± 2.74 a38.74 ± 3.70 f
W2N337.66 ± 2.13 ab21.87 ± 2.40 b40.47 ± 3.11 ef
W3N336.37 ± 1.84 bc19.92 ± 1.03 b43.70 ± 2.67 def
W*****
N******
W × Nns****
Note: Different lowercase letters represent significant differences between treatments (p < 0.05). The significance level of each factor: *: p < 0.05, **: p < 0.01, and ns: p > 0.05.
Disclaimer/Publisher’s Note: The statements, opinions and data contained in all publications are solely those of the individual author(s) and contributor(s) and not of MDPI and/or the editor(s). MDPI and/or the editor(s) disclaim responsibility for any injury to people or property resulting from any ideas, methods, instructions or products referred to in the content.