Abstract
Rootstocks play a central role in modulating grapevine responses to water scarcity, yet their morpho-functional strategies remain highly genotype-dependent. This study compared three functionally contrasting rootstocks, 1103 Paulsen, 420 A, and M2, grafted with Vitis vinifera cv. Merlot, which differ in root system architecture, hydraulic efficiency, canopy development, and stomatal regulation, with the aim of elucidating their hydraulic, morphological, and physiological responses under controlled conditions. Plants were grown in containers and assessed for root system architecture, hydraulic conductance, gas exchange including transpiration rate, chlorophyll fluorescence, and biomass allocation. The results revealed three distinct adaptive strategies: 1103 P exhibited the highest structural root biomass and rootstock hydraulic conductivity, supporting elevated axial water transport, higher transpiration rates, and a larger canopy, consistent with an “active tolerance” strategy; 420 A showed balanced structural and absorptive root development, moderate hydraulic performance, and the highest transpiration rates, reflecting a flexible, opportunistic response to water availability. In contrast, M2 displayed markedly reduced structural root biomass but a high proportion of absorptive roots and the greatest scion hydraulic conductance combined with low stomatal conductance, reduced transpiration, and high intrinsic water use efficiency, which is indicative of a conservative, resource-efficient strategy. These findings demonstrate that the three rootstocks express fundamentally different drought response syndromes driven by coordinated variation in root morphology, hydraulic traits, canopy development, and stomatal behavior. The integration of hydraulic and morphological traits provides a robust framework for selecting rootstocks tailored to specific pedoclimatic and management contexts in water-limited environments.
1. Introduction
Viticulture, like other agricultural systems, is highly vulnerable to climate change due to the tight coupling between grapevine physiology, atmospheric demand, and soil water availability. Rising temperatures, altered precipitation patterns, and the increased frequency of extreme drought events are reshaping the environmental conditions under which grapevines maintain optimal phenological development and fruit quality. Recent assessments indicate that water deficit has become one of the primary constraints to vineyard productivity, affecting shoot growth, bud fertility, berry size, and the biochemical pathways underlying fruit composition [1,2]. Drought stress triggers a complex cascade of morphological, physiological, and molecular responses, including reductions in stomatal conductance, shifts in carbon allocation, activation of antioxidant systems, and structural adjustments in root architecture [3].
Rootstocks play a central role in modulating these responses, as their genetic diversity translates to substantial variation in hydraulic architecture, root system morphology, stomatal regulation, and drought response strategies. Differences between rootstocks in axial and radial hydraulic conductance, vulnerability to xylem cavitation, and the ability to sustain water transport under stress strongly influence scion water status and overall plant performance [4]. In grafted grapevines, hydraulic vulnerability segmentation—where specific organs are preferentially protected from hydraulic failure—has emerged as a key determinant of drought tolerance [5].
Root system morphology further contributes to drought adaptation. Drought-tolerant rootstocks often exhibit greater root branching, enhanced fine root proliferation, and high plasticity in root anatomical traits, enabling sustained water acquisition under limiting soil moisture conditions [6]. These structural traits interact with physiological processes such as stomatal behavior, photosynthetic regulation, osmotic adjustment, and hormonal signaling, collectively shaping genotype-specific drought response syndromes [7].
At the biochemical and molecular levels, drought-resilient rootstocks maintain stronger redox homeostasis, enhanced antioxidant capacity, and more efficient osmotic regulation, thereby preserving cellular integrity during prolonged water deficit [8]. Transcriptomic studies indicate that tolerant genotypes rapidly activate genes associated with abscisic acid signaling, aquaporin regulation, and cell wall remodeling, supporting both hydraulic stability and metabolic resilience under stress conditions [9].
Given the projected increase in drought frequency and severity across major viticultural regions, identifying functional differences between rootstocks is critical for the development of climate-resilient vineyard systems. Comparative analyses of hydraulic, morphological, and physiological traits under controlled conditions provide a robust framework for disentangling genotype-dependent drought response strategies and for identifying promising candidates for further field validation [10].
In this context, the use of reduced container volumes represents a deliberate experimental strategy, as growth in small pots allows for precise control of soil water availability, minimizes environmental variability, and enhances the detection of intrinsic genotype-dependent differences in hydraulic and physiological responses to water deficit [11,12]. Several key drought-related traits, including stomatal regulation, hydraulic conductance, vulnerability to cavitation, and root-to-shoot signaling, are expressed early in plant development and are largely determined by genetic factors rather than by absolute root system size. Accordingly, container-based experiments conducted over a single growing season have been widely adopted for comparative rootstock screening under standardized conditions [6,7,13,14].
The aim of this study was to comparatively assess the hydraulic, morphological, and physiological traits of different grapevine rootstocks grown in reduced-volume containers over a single growing season, with the goal of identifying intrinsic functional strategies that enable plants to respond to limited soil water availability and, consequently, to evaluate their conductive properties.
2. Materials and Methods
2.1. Plant Material and Experimental Design
The experiment was conducted in 2025 and involved grafted vines (Vitis vinifera L. cv. Merlot N) grown in pots. Scions were grafted onto three rootstocks in the preceding year: 1103 Paulsen (Vitis berlandieri × Vitis rupestris), 420 A (Vitis berlandieri × Vitis riparia), and M2 [Teleki 8B (Vitis berlandieri × Vitis riparia) × 333 E.M. (Vitis vinifera × Vitis berlandieri)]. Plant material was provided by Vivai Cooperativi Rauscedo (Rauscedo, PN, Italy). Grafted grapevine cuttings were used, prepared using one-year-old wood from both the rootstock and the scion, with rootstock basal diameters of approximately 5–7 mm. The rootstock buds were blinded, and in March 2024, a single-bud scion was grafted onto each rootstock using the omega grafting technique. After nursery operations, including forcing and callusing, the seedlings were placed in a nursery bed in April and later excavated in December. They were then stored in a cold room at 4 °C and 90% relative humidity until planting in containers, which coincided with the standard field planting period in March 2025.
At the time of container planting, the roots were standardized by pruning to 5 cm from the base of the cutting, following common pre-planting procedures reported in the literature [13]. This approach allowed for the uniform development of the root system across all plants.
Grafted vines were grown at the Termine Grosso vineyard farm (Roccabernarda, KR, Italy) and subsequently transferred to the Tree Crop Laboratory of the Department of AGRARIA, Mediterranean University of Reggio Calabria, where physiological and morphological measurements were performed.
Plants were cultivated in 3 L pots filled with Arber DX Seeding substrate (Arber Horticulture, Bolzano, Italy) under gray shading nets providing 15% shade until May 2025. Subsequently, the net was removed. Irrigation, fertilization, and pest management were applied uniformly across all treatments.
Irrigation was applied using two levels: WET (field capacity) and DRY (−30/−40 cbar) [11]. Pots were initially brought to field capacity and rewatered whenever the soil water potential, measured by using Watermark sensors, and the volumetric water content, measured by using Watermark sensors and SM100 probes (Spectrum Technologies Inc., Aurora, IL, USA), reached −30/−40 cbar and 10–15% v/v, respectively. Watermark sensors and SM100 WaterScout probes were installed to monitor the entire substrate layer. When the readings from the SM100 and Watermark sensors reached −40 cbar, corresponding to 10–15% soil moisture, the Wi-Fi logger triggered the solenoid valves, initiating irrigation until the soil water potential was restored to field capacity (WET, 0 cbar).
For this purpose, a limited-volume container was used to allow for precise control of water availability and to monitor hydraulic, morphological, and key physiological traits that determine rootstock resilience to drought [11,12]. A small container volume (3 L) was adopted, following the approach reported in previous studies [6,7,13,14].
The experiment was arranged in a randomized complete block design with three blocks. Each block included three replicates per rootstock, resulting in a total of nine replicates per rootstock. Within each block, the rootstocks (1103 Paulsen, 420 A, and M2) were randomly assigned to the pots to minimize positional and environmental effects.
2.2. Relative Growth Rate
Shoot growth measurements were carried out from March to August, with data collected at a bi-weekly interval throughout the entire monitoring period. For each plant, the longest shoot was measured using a millimetric ruler. Relative Growth Rate (RGR) was computed for each interval between consecutive measurement dates. RGR was calculated using the following standard linear growth formulation:
where and represent the mean shoot lengths at times and , respectively, and is the number of days between measurements. This approach allowed for the quantification of growth dynamics across four distinct intervals spanning the monitoring period.
2.3. Gas Exchange and Chlorophyll Fluorescence
Gas exchange parameters were recorded in August using a portable infrared gas analyzer (LI-6400XT, LI-COR Biosciences, Lincoln, NE, USA), including net photosynthesis (A, µmol CO2 m−2 s−1), stomatal conductance (gs, mol H2O m−2 s−1), transpiration (E, mmol H2O m−2 s−1), and intrinsic water use efficiency (WUEi = A/gs). Chlorophyll fluorescence was assessed using the fluorometer module of the LI-6400XT portable photosynthesis system (LI-COR Biosciences, Lincoln, NE, USA). Measurements were performed every three days during the last ten days of August on three fully expanded, sun-exposed leaves per plant, located in the median portion of the canopy, under clear-sky conditions and between 08:00 and 11:00, when the soil water potential approached −30 cbar. The maximum efficiency of PSII in light-adapted leaves (Fv’/Fm’) and the effective quantum yield of PSII (ΦPSII) were determined following standard protocols, while photochemical quenching (qP), non-photochemical quenching (NPQ), and the electron transport rate (ETR, µmol electrons m−2 s−1) were calculated from steady-state fluorescence signals, enabling us to characterize the photochemical performance and energy dissipation strategies of each grafting combination. For each grafting combination, CO2 response curves (A/Ci) were generated by varying the intercellular CO2 concentration from 50 to 1500 ppm, allowing us to obtain robust estimates of the maximum carboxylation capacity (Vcmax) and the maximum electron transport rate (Jmax) [15]. The soil water potential ranged from −30 to −40 cbar, corresponding to a volumetric water content of 10–15%.
2.4. Non-Destructive Chlorophyll Estimation
Chlorophyll content was estimated non-destructively using a SPAD-502 Plus chlorophyll meter (Konica Minolta, Tokyo, Japan). Three readings per leaf were averaged, and measurements were taken on fully expanded, sun-exposed leaves concurrently with the gas exchange measurements.
2.5. Laboratory Processing and Plant Dissection Procedures
At the end of September, the plants were transported to the laboratory, where they were subjected to measurements involving plant dissection.
2.5.1. Determination of Hydraulic Conductance Using High-Conductance Flow Meter (HCFM)
Hydraulic conductance (the inverse of hydraulic resistance) was measured using a High-Conductance Flow Meter (HCFM GEN 3, Dynamax Inc., Houston, TX, USA). The HCFM generates variable flow rates within a conduit by rapidly altering the applied pressure while simultaneously recording the resulting flow. The dynamic relationship between pressure and flow rate was monitored in real time on a computer interface. Two types of hydraulic conductance measurements were performed: steady-state and transient. Steady-state measurements were obtained by applying a constant pressure and maintaining equal inflow and outflow. As perfectly stable conditions cannot be maintained, the system operated under “quasi-steady-state” conditions, during which the software recorded the pressure drop (ΔP) and the corresponding flow rate. Transient measurements were obtained by gradually increasing the applied pressure (up to 0.3 MPa) while continuously recording outflow at high frequency. Root hydraulic conductance (kg s−1) was normalized to the total length of absorbing roots, yielding specific root hydraulic conductance (kg s−1 m−1). Steady-state measurements were used to determine the hydraulic conductance of aboveground organs. Measurements were performed on six randomly selected plants per rootstock.
2.5.2. Growth Measurements and Biomass Determination
For the aboveground portion, leaf number, total leaf area, and mean leaf area were determined using a LICOR leaf area meter (LI-3100C, LI-COR Biosciences, Lincoln, NE, USA).
For the root system, roots were separated into structural roots (>2 mm) and absorptive fine roots (<2 mm), following the criteria reported in previous studies on grapevine [6,12,13]. The entire fine root fraction from each plant was gently washed free of substrate and weighed to determine total fresh mass. Four subsamples, each weighing 4 g, were then randomly taken from each plant and scanned using a flatbed scanner coupled with WinRHIZO image analysis software (version 2016, Regent Instruments, Québec, QC, Canada) to measure root length according to standard protocols for root morphological analysis in grapevine and other perennial crops (Figure 1).
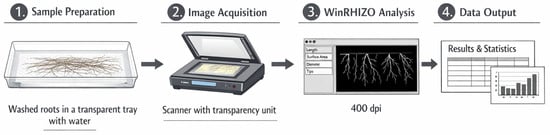
Figure 1.
Root analysis with WinRHIZO.
The total length of fine roots in each subsample was quantified with WinRHIZO and extrapolated to the entire fine root mass of the corresponding plant based on the ratio of subsample length to subsample mass. The mean root length calculated from the four 4 g subsamples was used to obtain a robust estimate of the total absorptive root length per plant.
The plant root system was then separated into structural and absorbing roots, and fresh biomass was measured immediately after sampling. All tissues were oven-dried at 70 °C until a constant weight was reached to determine dry biomass.
2.6. Statistical Analysis
All data were subjected to analysis of variance (ANOVA) to assess differences between rootstocks. When significant effects were observed, means were compared using Tukey’s HSD test at p < 0.05. Principal component analysis (PCA) (XLSTAT 2024.1, Addinsoft, Paris, France) was performed to explore multivariate patterns between physiological and morphological variables.
3. Results
The morphological parameters reported in Table 1 revealed clear and statistically significant differences between the three rootstocks. Structural root biomass (SR) was markedly lower in M2, with both fresh and dry weights approximately 60–70% lower than those of 1103 P and 420 A (Table 1). In contrast, no significant differences were observed between 1103 P and 420 A for either fresh or dry structural root biomass, indicating a similar allocation to coarse, perennial root tissues (Table 1). The behavior of the absorbing roots (ARs) followed a different pattern. As shown in Table 1, 420 A exhibited significantly higher fresh and dry absorbing root biomass than 1103 P, with increases of approximately 15–20%. M2 displayed intermediate values, which were statistically comparable with 420 A for both dry and fresh biomass. The differences in fresh weight were not statistically significant compared with 1103 P. Absorbing root length also differed significantly: Table 1 shows that 420 A and M2 exceeded 1103 P by approximately 15–20%, suggesting a more extensive fine root network in these two genotypes. The mass per unit length of absorbing roots did not differ between rootstocks; in fact, the differences were not statistically significant (Table 1). Hydraulic parameters further accentuate the differences between rootstocks. As indicated in Table 1, scion hydraulic conductance is significantly higher in M2, with values nearly twice those of 1103 P and 420 A. This significant increase may represent a compensatory mechanism associated with its reduced structural root biomass. Hydraulic conductance of the rootstock is substantially higher in 420 A and M2 than in 1103 P (Table 1). The largest difference concerns hydraulic conductivity, with M2 exhibiting values far exceeding those of the other genotypes, confirming its superior efficiency in water transport per unit root length.

Table 1.
Root morphological and hydraulic parameters measured in the three grapevine rootstocks (1103 P, 420 A, and M2). Reported variables include fresh weight of structural roots (FW-SR), dry weight of structural roots (DW-SR), fresh weight of absorbing roots (FW-AR), dry weight of absorbing roots (DW-AR), absorbing root length (ARL), hydraulic conductance of the scion (Kscion), hydraulic conductance of the rootstock (Krootstock), and hydraulic conductivity of the rootstock (Ksrootstock).
Pronounced differences emerge when examining the ratios between absorbing and structural roots. M2 exhibits values that are more than double those of 420 A and more than triple those of 1103 P, with statistically significant separation between all three genotypes. This indicates that M2 allocates a disproportionately larger fraction of its root system to fine, absorptive tissues relative to structural roots. The percentage of absorbing roots relative to total biomass shows that M2 allocates more than 70% of its total root biomass to absorbing roots, a proportion roughly 40–60% higher than that of 1103 P and 420 A. This statistically significant increase highlights a functional strategy in M2 that prioritizes absorptive capacity over structural development. Conversely, 1103 P exhibits the lowest proportion of absorbing roots, consistent with its more robust structural root system and high hydraulic conductivity reported in Table 1. Overall, the statistically significant differences in Table 2 reveal contrasting allocation strategies between the rootstocks. M2 strongly favors fine root proliferation relative to structural roots; 420 A maintains a balanced distribution with slightly higher total biomass; and 1103 P invests more heavily in structural tissues while maintaining lower proportional allocation to absorbing roots. These patterns align with the morphological and hydraulic traits described in Table 1, reinforcing the distinct functional identities of the three genotypes.
Table 2.
The derived root parameters measured in the three grapevine rootstocks (1103 P, 420 A, and M2). Reported variables include dry weight ratios between absorbing and structural roots (DW AR/SR); total root biomass expressed as dry weight (Total DW); and percentage contribution of absorbing roots to total dry biomass (AR-DW%).
The leaf traits reported in Table 3 reveal clear and statistically significant differences between the three rootstocks. The number of leaves (NL) is markedly lower in M2, representing a reduction of more than 50% compared with 1103 P and 420 A (Table 3). In contrast, 1103 P and 420 A do not differ significantly in leaf number, indicating comparable shoot development regarding the leaf number. Total leaf area (TLA) follows a similar pattern but with even more pronounced differences. More specifically, 1103 P exhibits the highest total leaf area, while M2 displays a reduction of more than 50% relative to 1103 P and approximately 40% relative to 420 A. These differences are statistically significant and reflect the reduced canopy development characteristic of M2, consistent with its lower leaf number. The average area of a single leaf (ALA), however, does not differ significantly between rootstocks. Despite the strong contrasts in leaf number and total leaf area, the size of individual leaves remains relatively stable across genotypes. This suggests that the observed differences in canopy size are driven primarily by leaf production rather than by changes in leaf expansion. Overall, the statistically supported differences in Table 3 indicate distinct patterns of canopy development between the rootstocks. 1103 P and 420 A maintain larger and more developed leaf canopies, while M2 exhibits a markedly reduced leaf area due to its lower leaf number. The lack of significant variation in average leaf size suggests that leaf morphology is conserved, whereas leaf production capacity is the main driver of canopy differences. The comparative analysis of Relative Growth Rate (RGR) reveals clear functional differences between the three rootstocks, as summarized in Table 3. Across the growth intervals, 1103 P exhibits the highest mean RGR (0.498 cm day−1), confirming its vigorous growth profile and its capacity to sustain rapid shoot elongation under favorable conditions. M2 displays an intermediate mean RGR (0.399 cm day−1), statistically indistinguishable from 1103 P according to Tukey’s HSD test (Table 3). However, the markedly lower standard error observed for M2 (ES = 0.042; Table 3) highlights a more stable and conservative growth pattern, characterized by consistent elongation across intervals rather than abrupt growth surges. This stability is consistent with the physiological behavior typically attributed to M-series rootstocks, which tend to balance moderate vigor with efficient resource allocation. Finally, 420 A shows the lowest mean RGR (0.181 cm day−1), significantly different from both 1103 P and M2 (Table 3). The higher variability observed in this rootstock suggests a more conservative growth strategy, with limited elongation during early and mid-season followed by a delayed increase in growth rate during the final interval. This pattern aligns with the known moderate-vigor profile of 420 A and its tendency toward restrained hydraulic behavior.
Table 3.
The mean values for leaf traits measured in the three grapevine rootstocks (1103 P, 420 A, and M2). Reported variables include number of leaves (NL), total leaf area (TLA), and average leaf area (ALA), and Mean Relative Growth Rate (Mean RGR).
The photosynthetic parameters reported in Table 4 reveal distinct physiological behaviors between the three rootstocks. Photosynthetic activity (An) is significantly lower in M2, which shows a reduction of approximately 20–25% compared with 1103 P and 420 A (Table 4). In contrast, 1103 P and 420 A do not differ significantly, indicating comparable carbon assimilation rates under the measurement conditions. Stomatal conductance (gs) follows a similar pattern. As shown in Table 4, M2 exhibits values that are roughly 50% lower than those of 1103 P and 420 A, with statistically significant differences. This reduced gs in M2 is consistent with its lower photosynthetic rate and suggests a more conservative stomatal behavior. Transpiration (E) also differs significantly between rootstocks: 420 A shows the highest transpiration rate, exceeding 1103 P by approximately 30% and M2 by nearly 75%. M2, conversely, displays the lowest E, reflecting its reduced stomatal conductance. Water use efficiency (WUE) presents an interesting contrast. As indicated in Table 4, M2 and 1103 P show significantly higher WUE values compared with 420 A, with increases of roughly 40–50%. This suggests that despite its lower photosynthetic rate, M2 maintains a favorable balance between carbon gain and water loss, likely due to its reduced stomatal opening. The biochemical parameters Vcmax and Jmax do not differ significantly between rootstocks (Table 4); this indicates that the intrinsic biochemical capacity for carbon fixation and electron transport is conserved across genotypes and that the observed differences in photosynthesis are primarily driven by stomatal rather than biochemical limitations. Overall, the statistically significant differences (Table 4) highlight distinct physiological strategies: 1103 P maintains high photosynthesis and stomatal conductance with moderate WUE; 420 A exhibits the highest transpiration and lowest WUE, reflecting a more water-consuming strategy; M2 shows reduced photosynthesis and stomatal conductance but compensates with the highest WUE, indicating a conservative water use strategy.
Table 4.
Photosynthetic activity (An), stomatal conductance (gs), transpiration rate (E), water use efficiency (WUE), maximum carboxylation rate of Rubisco (Vcmax), and maximum electron transport rate (Jmax) measured in the three grapevine rootstocks (1103 P, 420 A, and M2). Values are expressed in standard physiological units.
The chlorophyll fluorescence parameters reported in Table 5 reveal a generally conserved photosynthetic performance among the three rootstocks, with only limited statistically significant differences. The only parameter showing a clear and significant separation is Fv’/Fm’. As shown in Table 5, 420 A and M2 exhibit slightly higher values than 1103 P, with an increase of approximately 4–5%. This suggests a marginally higher efficiency of photosystem II under light-adapted conditions in 420 A and M2. In contrast, the effective quantum yield of PSII (ΦPSII) does not differ significantly between rootstocks, as indicated by the absence of letter groupings in Table 5. This uniformity suggests that the proportion of absorbed light used for photochemistry remains stable across genotypes. Similarly, photochemical quenching (qP) shows no statistically significant differences, with all three rootstocks displaying comparable values (Table 5). This indicates that the fraction of open PSII reaction centers is maintained at similar levels, regardless of genotype. Non-photochemical quenching (NPQ), which reflects the dissipation of excess energy as heat, also does not vary significantly between rootstocks. As shown in Table 5, NPQ values remain tightly clustered, suggesting that all three genotypes regulate thermal energy dissipation with similar efficiency. The electron transport rate (ETR) follows the same pattern: no statistically significant differences are observed, and values differ by less than 5% across rootstocks (Table 5). This indicates that the overall capacity for electron flow through PSII is largely conserved. Overall, the results presented in Table 5 indicate that chlorophyll fluorescence traits are remarkably stable among the three rootstocks. While 420 A and M2 show slightly higher PSII efficiency (Fv’/Fm’), the absence of significant differences in ΦPSII, qP, NPQ, and ETR suggests that the core photochemical machinery operates similarly across genotypes. These findings imply that the physiological differences observed in Table 1, Table 2, Table 3 and Table 4 are driven primarily by morphological and stomatal traits rather than by intrinsic differences in PSII photochemistry.
Table 5.
Chlorophyll fluorescence and photosynthetic activity parameters measured in the three grapevine rootstocks (1103 P, 420 A, and M2). Reported variables include maximum efficiency of photosystem II under light-adapted conditions (Fv’/Fm’), effective quantum yield of PSII (ΦPSII), photochemical quenching (qP), non-photochemical quenching (NPQ), and electron transport rate (ETR).
The cos2 values obtained from the PCA provide a clear picture of how individual variables align with the two principal components. Overall, the first dimension (F1) emerges as the dominant axis for most traits, particularly those related to biomass accumulation, plant size, and photosynthetic performance (Table 6). Variables such as FW SR, DW SR, the shoot–root ratios, total fresh and dry weight, and several photosynthetic parameters (including An, gs, and ETR) exhibit cos2 values close to 1 on F1, indicating that this component captures the majority of their variance (Table 6). This strong clustering suggests that F1 represents a general axis of plant vigor, integrating structural growth with physiological capacity. The high representation of traits linked to carbon assimilation and electron transport further reinforces the interpretation of F1 as a productivity-oriented dimension. In contrast, a smaller group of variables is more closely associated with the second component (F2) (Table 6). Traits such as FW AR, DW AR, ARL, ALA, WUE, and NPQ show substantially higher cos2 values on F2, indicating that this axis captures variation in allocation patterns, leaf morphology, and physiological efficiency rather than absolute biomass (Table 6). Notably, RGR is almost entirely explained by F2, suggesting that this component reflects dynamic growth processes and resource use strategies. The strong loading of NPQ and the moderate representation of Fv’/Fm’ imply that F2 also encompasses photoprotective or regulatory mechanisms, distinguishing plants based on how they manage light energy and stress. Some variables, including Vcmax, Jmax, and Tr, display a more balanced distribution between the two axes, indicating that they contribute to both structural and functional dimensions of plant performance. These traits may represent intermediate physiological processes that bridge growth capacity and regulatory responses. Taken together, the PCA structure suggests a clear differentiation between a primary axis (F1) associated with overall plant productivity and biomass accumulation and a secondary axis (F2) reflecting physiological strategies, allocation patterns, and efficiency-related traits. This separation highlights the multidimensional nature of plant responses, where absolute performance and functional adjustments contribute independently to the observed variability.
Table 6.
The cos2 values of the measured variables on the first two principal components (F1 and F2) obtained from the PCA. Higher cos2 values indicate better representation of each variable on the corresponding axis.
As shown in Table 7, the cos2 values highlight clear differences in how well each observation is represented by the first two principal components. M2 observations display an exceptionally high cos2 on F1 (0.9864), indicating that its position in the PCA space is almost entirely explained by the first dimension (Table 7). This suggests that M2 aligns strongly with the dominant gradient captured by F1, likely reflecting the main structural or physiological pattern underlying the dataset. 420 A observations, in contrast, are predominantly associated with F2, with a cos2 value of 0.7725 (Table 7). This indicates that its variability is better captured by the second component, suggesting that 420 A expresses traits or behaviors that differ from the primary trend and instead align with the secondary axis, which may represent alternative physiological strategies or allocation patterns (Table 7). Finally, 1103 P observations show a more balanced distribution between the two components, with cos2 values of 0.6033 on F1 and 0.3967 on F2. Although F1 still explains the majority of its variance, the contribution of F2 is non-negligible (Table 7). This intermediate pattern suggests that 1103 P shares characteristics with both the main structural axis and the secondary functional axis, positioning it in a transitional region of the PCA space.
Table 7.
Squared cosine (cos2) values of three rootstock genotypes projected onto first two principal components (F1 and F2) of PCA (Figure 1).
Figure 2 reveals the clear differentiation between the three genotypes based on their physiological and morphological profiles. Genotype M2, positioned in the positive quadrant of both F1 and F2, is associated with traits such as stomatal conductance (gs), net photosynthesis (An), transpiration rate (Tr), and water use efficiency (WUE), suggesting a physiological profile characterized by high gas exchange and efficient water management. Its proximity to vectors like ΦPSII, ETR, and Fv’/Fm’ further indicates enhanced photochemical efficiency and electron transport capacity. In contrast, 1103 P and 420 A are located in the negative region of F1, with 1103 P showing a stronger alignment with traits such as root dry weight (DW-AR), root fresh weight (FW-AR), and root length (ARL), implying a more robust root system. The vector alignment suggests that 1103 P may prioritize belowground biomass allocation and hydraulic traits (e.g., Ksrootstock, Krootstock), potentially conferring drought resilience. 420 A, while also situated in the negative F1 space, is more closely associated with shoot-related traits such as shoot dry weight (DW-SR), shoot fresh weight (FW-SR), and total biomass (Total DW, Total FW). Its position suggests a genotype favoring aboveground growth, possibly at the expense of root development and physiological efficiency. The angular relationships between vectors in Figure 2 indicate strong positive correlations between photosynthetic traits (An, gs, ΦPSII, ETR) and water-related parameters (E, WUE), while biomass partitioning traits (DW/FW ratios, AR/SR ratios) form distinct clusters, reflecting divergent allocation strategies. The orthogonality between certain vectors (e.g., NPQ vs. An) suggests potential trade-offs between photoprotective mechanisms and photosynthetic performance. Overall, Figure 2 provides a comprehensive multivariate snapshot of genotype-specific trait syndromes, highlighting M2’s physiological vigor, 1103 P’s root-centric adaptation, and 420 A’s shoot-biased growth strategy.
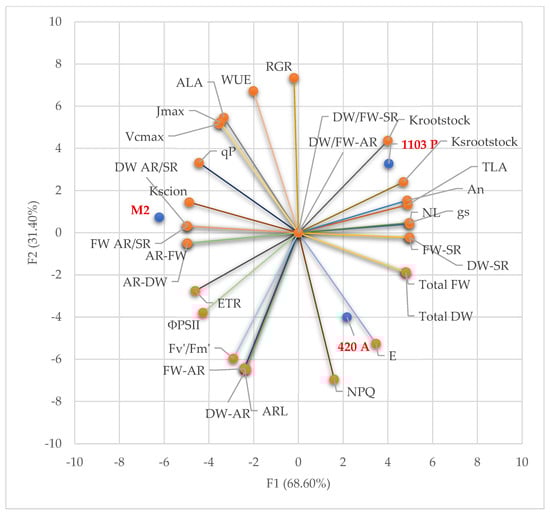
Figure 2.
The principal component analysis (PCA) biplot of morphological and physiological traits. The biplot illustrates the distribution of three genotypes, M2, 1103 P, and 420 A, along the first two principal components (F1 and F2—68.60% and 31.40%, respectively). Vectors represent the contribution and correlation of morphological and physiological traits to the principal components.
4. Discussion
The type of rootstock markedly influenced the below- and aboveground developmental patterns and water-related functional traits in Merlot N. Vines grafted onto M2 displayed a significantly higher proportion of fine root growth in the rhizosphere compared with those grafted onto 420 A and 1103 P, indicating a distinct allocation strategy within the root system. This enhanced proliferation of absorptive fine roots, coupled with comparatively reduced shoot growth, resulted in a higher root-to-shoot ratio for the M2 combination. Such a shift in biomass partitioning reflects a coordinated adjustment of carbon allocation under the experimental conditions rather than direct evidence of increased soil water uptake. In M2, the preferential investment in fine roots occurred together with a marked reduction in canopy size, which likely contributed to lower transpirational demand.
The rootstock genotype also exerted a clear influence on hydraulic behavior and overall plant water relations. During active vegetative growth, vines on 1103 P exhibited lower fine root proliferation compared with those on 420 A and M2. However, 1103 P plants displayed higher hydraulic conductance and conductivity at both root and whole-plant levels, suggesting a greater intrinsic capacity for water transport along the soil-to-shoot continuum. The extensive and deeper root morphology associated with 1103 P is likely attributable to its genetic background, including the contribution of Vitis rupestris genes promoting vigorous root system development and efficient hydraulic pathways [16,17]. Such architecture supports enhanced water extraction and internal transport, enabling the maintenance of water flow even under declining soil moisture.
The integrated functional capacity of 1103 P translates into improved plant water status and gas exchange performance, reflected in milder water stress symptoms and more optimal photosynthetic activity under the tested conditions. These outcomes align with broader characterizations of drought-tolerant rootstocks, which are able to preserve stomatal conductance, relative water content, and carbon assimilation under water deficit [18]. The structural robustness and hydraulic efficiency of 1103 P support sustained vegetative and productive vigor in scenarios of moderate water limitation, a trait profile often desirable in vineyard management.
This enhanced hydraulic efficiency has been linked to differences in the expression of specific aquaporin genes (e.g., VvPIPs and VvTIPs) that facilitate transmembrane water movement and are upregulated under drought in tolerant rootstock genotypes such as 1103 P [16]. Furthermore, rootstock-dependent modulation of endogenous ABA concentrations alters stomatal and hydraulic responses, integrating hormonal and gene regulation in adaptive response to water deficit [18].
Rootstock effects on stomatal regulation and drought response strategies have been highlighted in several studies; for example, 1103 P has been characterized as exhibiting an avoidance-type response under severe water deficit, reducing stomatal conductance and photosynthesis in a manner consistent with protective water loss regulation [18]. Studies on grapevine rootstocks have also shown that auxin transporters and signaling regulators (e.g., AUX1/PIN) are key determinants of root system plasticity under environmental stress, including drought and nutrient availability, supporting lateral root proliferation [16]. Such behavior suggests that 1103 P tightly modulates leaf gas exchange in response to declining soil water potential, contributing to overall drought resilience.
In contrast, 420 A and M2 appear to adopt comparatively more conservative stomatal regulation. Although specific detailed classifications (e.g., strict isohydric or anisohydric) are not uniformly applied to these genotypes, physiological evidence indicates that they tend to downregulate stomatal conductance under stress while maintaining relatively high water use efficiency. In M2, the significantly higher water use efficiency measured was primarily associated with reduced stomatal conductance and transpiration, rather than increased absolute water uptake. These patterns suggest a tolerance-oriented strategy, whereby stomatal closure is balanced with the need to maintain carbon assimilation, favoring physiological stability over maximum water throughput, consistent with rootstock-dependent differences in ABA signaling [18].
Taken together, the traits observed across the three rootstock genotypes illustrate distinct but functionally coherent syndromes. 1103 P prioritizes hydraulic capacity and soil exploration, enabling vigorous growth and elevated water transport even as soil moisture declines. The 420 A rootstock represents an intermediate phenotype, balancing absorptive root development with moderate transpiration tendencies and stress responsiveness. The M2 rootstock, characterized by pronounced fine root allocation, reduced canopy development, and high water use efficiency, embodies a conservative resource use strategy rather than enhanced soil water acquisition capacity. Despite lower absolute water uptake, efficient use of available water and conservative regulation of transpiration make M2 a resilient choice in irrigated systems or environments with variable water availability. It is important to acknowledge that the use of 3 L container-grown vines represents an inherent limitation of this study, and field-scale validation will be required to determine whether the physiological and hydraulic patterns observed here are maintained under real vineyard conditions.
Principal component analysis further substantiated these distinctions by aligning M2 with traits associated with efficient water use and conservative shoot responses, 420 A with allocation patterns typical of balanced growth, and 1103 P with structural and hydraulic traits indicative of robust belowground investment. Collectively, these findings highlight the importance of integrating morphological, hydraulic, and physiological trait profiles in rootstock selection, enabling tailored decisions that reflect specific environmental constraints and viticultural objectives.
5. Conclusions
This study reveals that the three grapevine rootstocks studied (1103 P, 420 A, and M2) follow distinct functional trajectories that influence root morphology and physiological adjustment to soil moisture conditions. The 1103 P rootstock is characterized by a highly effective hydraulic system and extensive structural root development, which together support continuous water delivery and a well-regulated balance between water loss and carbon assimilation even when water supply is moderately limited. In contrast, 420 A exhibits a moderate strategy, showing a balanced combination of root system traits and temperate control of transpiration that places it between the other two genotypes regarding the water use behavior. M2, on the other hand, allocates relatively more to fine absorptive roots and demonstrates elevated efficiency in water utilization, reflecting a more conservative approach that stabilizes plant function rather than maximizing water intake. While M2 plants take up less water under non-limiting conditions, their ability to use available moisture efficiently and to regulate transpiration conservatively suggests that they are particularly well suited to irrigated vineyards or environments where water availability fluctuates. Overall, these findings underscore the value of evaluating rootstock performance through an integrated perspective that encompasses structural, hydraulic, and physiological traits to align rootstock choice with specific vineyard goals and environmental constraints.
Author Contributions
Conceptualization, G.G., A.D. and R.Z.; methodology, G.G. and A.D.; software, G.G. and A.D.; validation, G.G. and A.D.; formal analysis, P.I. and F.G.V.; investigation, G.G. and A.D.; resources, G.G.; data curation, G.G. and A.D.; writing—original draft preparation, G.G. and A.D.; writing—review and editing, G.G. and A.D.; visualization, G.G. and A.D.; supervision, G.G., A.D. and R.Z.; project administration, G.G. and A.D.; funding acquisition, G.G. and A.D. All authors have read and agreed to the published version of the manuscript.
Funding
The authors gratefully acknowledge financial support from the Rural Development Programme (PSR) Calabria 2014–2020—Measure 16—Intervention 16.2.1—Operation 16.2.1.2—Pilot Project “La Vigna del Padre” (SIAN Application No. 24250071859, CUP: E59J23003100006). The authors also wish to express their sincere gratitude to the Project Manager, Salvatore Orlando, for his professionalism, and to the GAL Area Grecanica for their valuable support.
Data Availability Statement
The raw data supporting the conclusions of this article will be made available by the authors on request.
Acknowledgments
The authors wish to express their sincere gratitude to the Termine Grosso winery (Roccabernarda, KR, Italy) for generously hosting the experimental trials and providing essential logistical support. Their collaboration and commitment greatly contributed to the successful execution of this research.
Conflicts of Interest
The authors declare no conflicts of interest.
References
- Fraga, H.; García de Cortázar Atauri, I.; Malheiro, A.C.; Santos, J.A. Modelling climate change impacts on viticultural yield, phenology and stress conditions in Europe. Glob. Change Biol. 2018, 24, 3771–3787. [Google Scholar] [CrossRef] [PubMed]
- Van Leeuwen, C.; Pieri, P.; Gowdy, M.; Ollat, N.; Roby, J.-P. Reduced density is an environmental friendly and cost effective solution to increase resilience to drought in vineyards in a context of climate change. OENO One 2019, 53, 129–146. [Google Scholar] [CrossRef]
- Iqbal, S.; Elatafi, E.; Tariq, K.; Ali, S.; Hakeem, A.; Shaonan, L.; Aziz, R.B.; Mauligen, E.Q.; Fang, J. Drought stress in viticulture: An update review of the effects, mechanisms, tolerance strategies, and mitigation approaches. J. Soil Sci. Plant Nutr. 2025, 25, 9049–9091. [Google Scholar] [CrossRef]
- Flor, L.; Toro, G.; Carriquí, M.; Buesa, I.; Sabater, A.; Medrano, H.; Escalona, J.M. Impact of severe water stress on drought resistance mechanisms and hydraulic vulnerability segmentation in grapevine: The role of rootstock. J. Exp. Bot. 2025, 76, 3141–3157. [Google Scholar] [CrossRef] [PubMed]
- Charrier, G.; Torres Ruiz, J.M.; Badel, E.; Burlett, R.; Choat, B.; Cochard, H.; Delzon, S. Evidence for Hydraulic Vulnerability Segmentation and Lack of Xylem Refilling Under Tension. Plant Physiol. 2016, 172, 1657–1668. [Google Scholar] [CrossRef] [PubMed]
- Alonso-Forn, D.; Buesa, I.; Flor, L.; Sabater, A.; Medrano, H.; Escalona, J.M. Implications of root morphology and anatomy for water deficit tolerance and recovery of grapevine rootstocks. Front. Plant Sci. 2025, 16, 1541523. [Google Scholar] [CrossRef] [PubMed]
- Bonarota, M.S.; Toups, H.S.; Bristow, S.T.; Santos, P.; Jackson, L.E.; Cramer, G.R.; Barrios-Masias, F.H. Drought response and recovery mechanisms of grapevine rootstocks grafted to a common Vitis vinifera scion. Plant Stress 2024, 11, 100346. [Google Scholar] [CrossRef]
- Ismail, A.; Gajjar, P.; Darwish, A.G.; Abuslima, E.; Islam, T.; Mohamed, A.G.; Tsolova, V.; Nick, P.; El Kayal, W.; El Sharkawy, I. Redox and osmotic homeostasis: Central drivers of drought resilience in grapevine rootstocks. Plant Physiol. Biochem. 2025, 221, 109618. [Google Scholar] [CrossRef] [PubMed]
- Bianchi, D.; Ricciardi, V.; Pozzoli, C.; Grossi, D.; Caramanico, L.; Pindo, M.; Stefani, E.; Cestaro, A.; Brancadoro, L.; De Lorenzis, G. Physiological and transcriptomic evaluation of drought effect on own-rooted and grafted grapevine rootstocks (1103P and 101-14MGt). Plants 2023, 12, 1080. [Google Scholar] [CrossRef] [PubMed]
- Bernardo, S.; Marguerit, E.; Ollat, N.; Gambetta, G.A.; Saint Cast, C.; de Miguel, M. Root system ideotypes: What is the potential for breeding drought-tolerant grapevine rootstocks? J. Exp. Bot. 2025, 76, 2970–2984. [Google Scholar] [CrossRef] [PubMed]
- Barrios-Masias, F.H.; Knipfer, T.; McElrone, A.J. Differential responses of grapevine rootstocks to water stress are associated with adjustments in fine root hydraulic physiology and suberization. J. Exp. Bot. 2015, 66, 6069–6078. [Google Scholar] [CrossRef] [PubMed]
- Herrera, J.C.; Savi, T.; Mattocks, J.; De Berardinis, F.; Scheffknecht, S.; Hietz, P.; Rosner, S.; Forneck, A. Container volume affects drought experiments in grapevines: Insights on xylem anatomy and time of dehydration. Plant Cell Environ. 2021, 44, 3160–3176. [Google Scholar] [CrossRef] [PubMed]
- Corso, M.; Vannozzi, A.; Maza, E.; Vitulo, N.; Meggio, F.; Pitacco, A.; Telatin, A.; D’Angelo, M.; Feltrin, E.; Negri, A.S.; et al. Comprehensive transcript profiling of two grapevine rootstock genotypes contrasting in drought susceptibility links the phenylpropanoid pathway to enhanced tolerance. J. Exp. Bot. 2015, 66, 5739–5752. [Google Scholar] [CrossRef] [PubMed]
- Lanari, V.; Silvestroni, O.; Palliotti, A.; Green, A.; Sabbatini, P. Plant and leaf physiological responses to water stress in potted ‘Vignoles’ grapevine. HortScience 2015, 50, 1492–1497. [Google Scholar] [CrossRef]
- Farquhar, G.; von Caemmerer, S.; Berry, J. A biochemical model of photosynthetic CO2 assimilation in leaves of C3 species. Planta 1980, 149, 78–90. [Google Scholar] [CrossRef] [PubMed]
- Labarga, D.; Mairata, A.; Puelles, M.; Martín, I.; Albacete, A.; García Escudero, E.; Pou, A. The rootstock genotypes determine drought tolerance by regulating aquaporin expression at the transcript level and phytohormone balance. Plants 2023, 12, 718. [Google Scholar] [CrossRef] [PubMed]
- Lukšić, K.; Mucalo, A.; Smolko, A.; Brkljačić, L.; Marinov, L.; Hančević, K.; Ozretić Zoković, M.; Bubola, M.; Maletić, E.; Karoglan Kontić, J. Biochemical response and gene expression to water deficit of Croatian grapevine cultivars (Vitis vinifera L.) and a specimen of Vitis sylvestris. Plants 2023, 12, 3420. [Google Scholar] [CrossRef] [PubMed]
- Rossdeutsch, L.; Edwards, E.; Cookson, S.J.; Barrieu, F.; Gambetta, G.A.; Delrot, S.; Ollat, N. ABA-mediated responses to water deficit separate grapevine genotypes by their genetic background. BMC Plant Biol. 2016, 16, 91. [Google Scholar] [CrossRef] [PubMed]
Disclaimer/Publisher’s Note: The statements, opinions and data contained in all publications are solely those of the individual author(s) and contributor(s) and not of MDPI and/or the editor(s). MDPI and/or the editor(s) disclaim responsibility for any injury to people or property resulting from any ideas, methods, instructions or products referred to in the content. |
© 2026 by the authors. Licensee MDPI, Basel, Switzerland. This article is an open access article distributed under the terms and conditions of the Creative Commons Attribution (CC BY) license.