Abstract
Actinidia deliciosa is a globally important economic fruit crop, and its fruit quality and yield are profoundly influenced by light and environmental conditions. Sucrose phosphate synthase (SPS), a key rate-limiting enzyme in the sucrose biosynthesis pathway, plays a central role in regulating carbon metabolism and sucrose accumulation in plants. However, comprehensive studies of the SPS gene family in A. deliciosa are still lacking, particularly regarding its expression in response to different light qualities. In this study, genome-wide identification of the SPS gene family in A. deliciosa was conducted using bioinformatics approaches. A total of 31 SPS genes were identified and named AdSPS1 to AdSPS31 on the basis of their chromosomal positions. The encoded proteins were predicted to be acidic, hydrophilic, and primarily localized in the chloroplast. All the AdSPS proteins contained the conserved domains Sucrose_synth, Glyco_trans_1, and S6PP, indicating potential roles in sucrose metabolism. Phylogenetic analysis classified the 31 AdSPS members into three subfamilies, A, B, and C, comprising 20, 5, and 6 members, respectively. Collinearity analysis revealed extensive syntenic relationships among AdSPS genes across different chromosomes, suggesting that gene duplication events contributed to the expansion of this gene family. Promoter cis-acting element analysis revealed that light-responsive elements were the most abundant among all the detected elements in the upstream regions of the AdSPS genes, implying potential regulation by light signals. Different light qualities significantly affected the contents of sucrose, glucose, and fructose, as well as SPS activity in kiwifruit leaves, with the highest activity observed under the R3B1 (red–blue light 3:1) treatment. Spearman’s correlation analysis indicated that AdSPS3 was significantly negatively correlated with sucrose, fructose, glucose, and SPS activity, suggesting a potential role in negatively regulating sugar accumulation in kiwifruit leaves, whereas AdSPS12 showed positive correlations with these parameters, implying a role in promoting sucrose synthesis. To further explore the light response of the AdSPS genes, eight representative members were selected for qRT‒PCR analysis under red light, blue light, and combined red‒blue light treatments. These results demonstrated that light quality significantly influenced SPS gene expression. Specifically, AdSPS6 and AdSPS24 were highly responsive to R1B1 (1:1 red‒blue light), AdSPS9 was significantly upregulated under R6B1 (6:1 red‒blue light), AdSPS21 was strongly induced by blue light, and AdSPS12 expression was suppressed. This study systematically identified and analyzed the SPS gene family in A. deliciosa, revealing its structural characteristics and light-responsive expression patterns. These findings suggest that AdSPS genes may play important roles in light-regulated carbon metabolism. These results provide a theoretical foundation and valuable genetic resources for further elucidating the molecular mechanisms of sucrose metabolism and light signal transduction in kiwifruit.
1. Introduction
Sucrose is a primary product of photosynthesis in plants and plays a vital role in carbon assimilation, energy distribution, and signal transduction [1]. Sucrose phosphate synthase (SPS) is a rate-limiting enzyme in the sucrose biosynthetic pathway. It catalyzes the formation of sucrose-6-phosphate (S6P) from uridine diphosphate glucose (UDPG) and fructose-6-phosphate (F6P), which is subsequently converted to sucrose by sucrose phosphatase (SPP) [2]. Therefore, SPS plays a key role in regulating sucrose synthesis in leaves and sucrose accumulation in fruits [3]. The SPS gene family has been identified in various plant species, with four members reported in Arabidopsis thaliana [4] and tomato [5], five in pineapple [6] and rice [7], seven in soybean [8] and apple [9], and eight in tobacco [10] and pear [11]. Despite variations in gene number among species, all SPS proteins contain three conserved domains characteristic of the family: Sucrose_synth (PF00862), Glycos_transf_1 (PF00534), and S6PP (PF05116) [12].
The expression patterns and functions of SPS family members in different plants clearly exhibit species specificity. In A. thaliana, the loss of AtSPSA1 and AtSPSC suppresses sucrose synthesis under light conditions and restricts starch degradation in darkness [13]. SPS genes have been shown to be significantly upregulated during stages of rapid sucrose accumulation in developing fruits of banana, melon, and citrus, thereby promoting sugar biosynthesis and storage [14,15,16]. In sweet cherry, silencing PavSPSA1 can reduce sucrose content in fruits and delay fruit coloration and ripening [17]. The overexpression of SoSPS1 in sugarcane enhances SPS activity and increases sucrose and soluble sugar contents, thereby improving yield and quality [18]. SPS genes also play crucial roles in stress responses. For example, heterologous expression of maize ZmSPS in potato can increase leaf SPS activity, enhance the translocation of photosynthates to tubers, delay leaf senescence, and improve tuber yield and quality [19]. In tomato, SlSPS positively regulates plant growth and heat stress tolerance by increasing SPS activity and sucrose content, thus making SlSPS an important factor in maintaining productivity under heat stress [20]. In beans, PvSPS4 enhances salt tolerance by modulating sugar metabolism and ion homeostasis in roots, underscoring its regulatory role in sink tissues [21].
Light, one of the most critical environmental cues, not only drives photosynthesis but also regulates the expression of carbon metabolism-related genes via light signaling pathways. In banana, both SPS activity and sucrose content increase with increasing photoperiod [22]. In bayberry, blue light significantly elevates the expression of MrSPS1, MrSPS2, and MrSPS3, resulting in increased levels of sucrose, fructose, and glucose [23]. Blue light can also promote sucrose accumulation in postharvest peach fruit by enhancing SPS activity [24]. In melon, red light promotes ethylene biosynthesis and upregulates SPS gene expression, thereby increasing sucrose accumulation [25]. In maize, red light enhances SPS activity, whereas far-red light has an inhibitory effect [26]. In watermelon, red and red‒blue mixed light induces ClHY5 expression and suppresses ClPIF3, enhancing ClHY5 binding to the G-box element of the ClSPS1 promoter. This process promotes ClSPS1 transcription, increases SPS activity, and elevates fruit sucrose content [27]. Conversely, under low-light stress, melon plants showed a marked decline in SPS activity and sucrose accumulation in leaves and fruit [28]. These findings collectively suggest that SPS genes play central roles in plant growth and development, carbon metabolism, and stress adaptation and that their expression is tightly regulated by environmental factors such as light.
In recent years, studies on sugar accumulation in kiwifruit have increased considerably, yet research focusing on carbon assimilation and sucrose-biosynthesis-related genes in source tissues (such as leaves) has remained very limited. Existing studies primarily concentrate on differences in fruit sugar content and fruit quality, while insufficient attention has been paid to the expression patterns and environmental response characteristics of key sucrose-metabolism genes such as SPS in leaves. As a rate-limiting enzyme in sucrose biosynthesis, SPS in leaves is directly involved in the synthesis, export, and transport of photosynthetically derived sucrose, and it functions as a central regulatory node linking photosynthetic carbon fixation with whole-plant carbon allocation. However, systematic identification and functional characterizations of the AdSPS gene family in kiwifruit leaves are still lacking. In addition, a large number of elite kiwifruit cultivars have been bred in China in recent years, showing substantial variation in leaf photosynthetic capacity and carbon metabolic efficiency [29], which further underscores the necessity of investigating AdSPS genes and their light-regulated mechanisms in leaves. Actinidia deliciosa, a hexaploid species of the genus Actinidia in the family Actinidiaceae, is a dioecious woody perennial vine that is widely cultivated for its sweet flavor, high sugar content, and rich nutritional profile, and is therefore highly favored by consumers worldwide [30,31,32]. Despite its agricultural importance, the SPS gene family has not yet been characterized in A. deliciosa. In this study, we performed genome-wide identification of AdSPS gene family members in A. deliciosa and systematically analyzed their physicochemical properties, phylogenetic relationships, gene structures, conserved motifs, domains, and cis-acting elements. Moreover, we investigated the expression profiles of these genes under different light quality treatments. These results provide theoretical insights into the light-mediated regulation of carbon metabolism in kiwifruit and lay a foundation for future functional studies of SPS genes.
2. Materials and Methods
2.1. Identification of AdSPS Gene Family Members
The genome sequence of A. deliciosa was downloaded from the China National Center for Bioinformation (https://www.cncb.ac.cn/, accessed on 2 January 2025) [33]. The protein sequences of A. thaliana SPS gene family members, including AtSPSA1 (AT5G20280), AtSPSA2 (AT5G11110), AtSPSB (AT1G04920), and AtSPSC (AT4G10120), were obtained from The Arabidopsis Information Resource (https://www.arabidopsis.org/, accessed on 2 January 2025) [4]. These sequences were used as queries to perform a local BLASTP search via the BLAST function in TBtools (version 2.363) [34] against the A. deliciosa protein database. Redundant sequences were manually removed to obtain putative AdSPS gene family members. To confirm the domain composition, the candidate sequences were submitted to the SMART database (http://smart.embl.de/, accessed on 4 January 2025) for conserved domain analysis. The candidate proteins lacking one or more of the characteristic SPS domains (PF00862, PF00534, and PF05116) [35] were excluded. The remaining sequences were designated AdSPS family members and named on the basis of their chromosomal positions.
2.2. Analysis of Physicochemical Properties, Secondary Structure, and Subcellular Localization
The physicochemical properties of AdSPS proteins, including amino acid length, molecular weight, theoretical isoelectric point (pI), instability index, grand average of hydropathicity (GRAVY), and the aliphatic index, were analyzed via the “Protein Parameters Calc” tool in TBtools (version 2.363). The secondary structures were predicted via the Prabi server (https://npsa-prabi.ibcp.fr/, accessed on 7 January 2025). The subcellular localization of AdSPS proteins was predicted via the Cell-PLoc 2.0 server (http://www.csbio.sjtu.edu.cn/, accessed on 7 January 2025).
2.3. Gene Structure, Conserved Motif, and Conserved Domain Analysis
The conserved motifs of AdSPS proteins were identified via the MEME server (https://meme-suite.org/meme/tools/meme, accessed on 7 January 2025) with default parameters. Visualization of motif distribution was performed via the “Simple MEME Wrapper” and “Visualize Motif Pattern” tools in TBtools (version 2.363). Gene structures, including exon–intron organization, were analyzed and visualized using the “Gene Structure View” function in TBtools (version 2.363). Conserved domains were further verified and visualized via the “Batch SMART” tool in TBtools (version 2.363) on the basis of amino acid sequences.
2.4. Chromosomal Mapping, Synteny, Phylogenetic, and Cis-Acting Element Analysis
The chromosomal positions of the AdSPS genes were retrieved from the A. deliciosa genome annotation files and visualized via the “Gene Location Visualize from GTF/GFF” tool in TBtools (version 2.363). Intraspecies and interspecies synteny analyses were conducted via TBtools (version 2.363) with the “Advanced Circos,” “One Step MCScanX—Super Fast,” and “Dual Synteny Plot” tools on the basis of genome information from A. deliciosa and A. thaliana. For phylogenetic analysis, full-length SPS protein sequences from A. deliciosa, A. thaliana, Oryza sativa, Litchi chinensis, Malus domestica, Vitis vinifera, and Zea mays [36] were aligned via MEGA 11 software. A phylogenetic tree was constructed via the neighbor-joining method with 1000 bootstrap replicates. The raw phylogenetic tree was further visualized and refined via the iTOL online platform (https://itol.embl.de/ accessed on 8 January 2025). To identify cis-acting elements, the 2000 bp upstream of the AdSPS genes were extracted and analyzed via the PlantCARE server (https://bioinformatics.psb.ugent.be/webtools/plantcare/html/ accessed on 8 January 2025). The identified elements were visualized via the “Basic BioSequence Viewer” tool in TBtools (version 2.363).
2.5. Plant Materials and Light Treatments
The experimental materials were one-year-old potted seedlings of A. deliciosa ‘Zhongmi No. 2′ selected from the kiwifruit germplasm repository at the Zhengzhou Fruit Research Institute, Chinese Academy of Agricultural Sciences. Healthy and uniform seedlings were selected for the study. Light supplementation was conducted via LED light sources with different spectral compositions: white light (400~770 nm, W), red light (660 nm, R), and blue light (450 nm, B). The light intensity was set at 200 μmol·m−2·s−1, with a photoperiod of 12 h per day (07:00~19:00), and the ambient temperature was maintained at 25 °C ± 1 °C. Six light quality treatments were established: white light (W, as the control), red light (R), red-to-blue light ratios of 6:1 (R6B1), 3:1 (R3B1), and 1:1 (R1B1), and blue light (B). The photosynthetic photon flux density (PPFD) was set at 200 μmol·m−2·s−1 for all treatments. Prior to treatment, the seedlings were pruned such that 2~3 buds were retained per plant. After bud break, only one vigorous shoot was retained on each plant. Supplemental lighting assays began when the third leaf was fully expanded. The light treatments lasted for 4 weeks. Each treatment included 10 plants with three biological repetitions. At the end of the experiment, leaf samples were collected, immediately frozen in liquid nitrogen, and stored at −80 °C for subsequent analyses.
2.6. Determination of Glucose, Fructose, and Sucrose Contents
Sucrose content was determined using a commercial assay kit provided by Solarbio Science & Technology Co., Ltd. (Beijing, China) according to the manufacturer’s instructions. Three biological replicates were included for each treatment. The contents of glucose and fructose were determined by the high-performance liquid chromatography (HPLC) method, with optimized parameters based on the recommended method [37]. All measurements were conducted with three biological replicates.
2.7. Determination of Sucrose Phosphate Synthase (SPS) Activity
The activity of sucrose phosphate synthase (SPS) was determined using a Plant SPS Assay Kit provided by Solarbio Science & Technology Co., Ltd. (Beijing, China). All procedures were performed in accordance with the manufacturer’s instructions. Each treatment included three biological replicates.
2.8. qRT‒PCR Analysis of the AdSPS Gene Family
The leaf samples were thoroughly ground into a fine powder in liquid nitrogen, and total RNA was extracted via a Plant RNA Extraction Kit (Vazyme, Nanjing, China) according to the manufacturer’s instructions. First-strand cDNA was synthesized from the RNA via a reverse transcription kit (Toyobo, Shanghai, China). The qRT‒PCR primers were designed via Primer 5.0 software with default parameters (Table 1). qRT‒PCR was performed via FastStart Universal SYBR Green Master Mix (Roche, Switzerland) in a 20 μL reaction system containing 10 μL of 2 × Master Mix, 0.4 μL each of forward and reverse primers (final concentration 200 nM), 1 μL of cDNA template (250 ng/μL), and 8.2 μL of ddH2O. PCR amplification was carried out on a LightCycler 480 Real-Time PCR System (Roche, Basel, Switzerland), and raw fluorescence data were acquired and processed using LightCycler® 480 Software (Roche, Switzerland). The thermal cycling program consisted of four stages: initial denaturation at 95 °C for 5 min; 45 cycles of denaturation at 95 °C for 10 s, annealing at 60 °C for 10 s, and extension at 72 °C for 10 s; a melting curve analysis step at 95 °C for 5 s and 65 °C for 1 min; and a final hold at 4 °C for 1 min. Each sample was analyzed with three biological replicates. The AdActin gene was used as the internal reference, and relative expression levels were calculated via the 2–ΔΔCt method [38].

Table 1.
Sequences of primers used in this study.
2.9. Statistical Analysis
Excel 2010 was used to organize and sort the experimental data, and Origin 2024 software was used for graphing. Statistical analyses were performed using R software (version 4.3.1). Significant differences among treatments were determined via analysis of variance (ANOVA) followed by Duncan’s multiple range test at p < 0.05.
3. Results
3.1. Identification of AdSPS Gene Family Members
On the basis of sequence homology with A. thaliana SPS proteins and conserved domain analysis, a total of 31 SPS family members were identified in the A. deliciosa genome and named AdSPS1 to AdSPS31 according to their chromosomal locations (Table 2). The length of the deduced amino acid sequences ranged from 957 (AdSPS7) to 1157 (AdSPS26) aa, with corresponding molecular weights ranging from 108.21 kDa to 128.94 kDa. The theoretical isoelectric points (pIs) ranged from 5.85 (AdSPS28) to 7.34 (AdSPS23); only AdSPS23 and AdSPS26 presented pI values above 7.0, suggesting that they may be weakly basic, whereas the others are acidic. All AdSPS proteins were predicted to be unstable proteins with instability indices exceeding 30%. The aliphatic index ranged from 82.68 (AdSPS23) to 88.69 (AdSPS9), and all the members presented negative grand average of hydropathicity (GRAVY) values, indicating a hydrophilic nature. Subcellular localization predictions suggested that all AdSPS proteins are localized to the chloroplast (Table 2), implying a potential role in photosynthesis-related processes.
Table 2.
Information on members of the AdSPS gene family.
Secondary structure analysis revealed that AdSPS proteins predominantly consist of alpha helices (40.22~50.68%), extended strands (8.25~12.72%), beta turns (2.97~4.78%), and random coils (36.34~43.49%) (Table 3), indicating similar folding patterns across family members.
Table 3.
Predicted secondary structure of AdSPS family proteins.
3.2. Chromosomal Distribution of AdSPS Genes
The chromosomal locations of the AdSPS genes were visualized via TBtools (version 2.363) (Figure 1). These 31 genes were unevenly distributed across 26 chromosomes. Among them, chromosomes Chr06A, Chr06B, Chr06C, Chr06D, and Chr06E each contained two AdSPS genes, whereas the other chromosomes each carried one gene, which was consistent with the genome annotation.
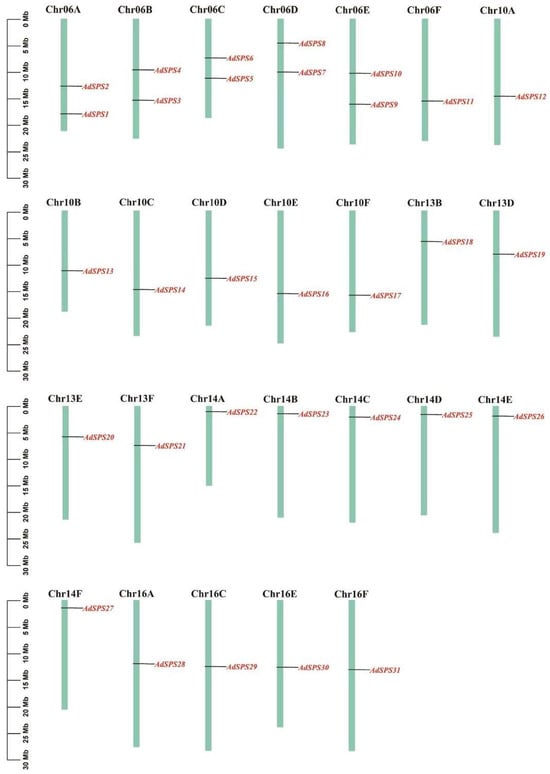
Figure 1.
Chromosomal location of AdSPS genes.
3.3. Gene Structure, Conserved Motifs, and Domain Architecture of AdSPS Genes
Gene structure analysis revealed that the AdSPS genes contained 13 or 14 exons, with 20 members possessing 13 exons and the remaining 11 members having 14 exons (Figure 2). Conserved motif analysis revealed that, with the exception of AdSPS7, the other proteins contained 10 conserved motifs distributed throughout the protein sequences, indicating a high degree of conservation (Figure 2). All AdSPS proteins were found to harbor three highly conserved domains: Sucrose_synth (PF00862, yellow), Glycos_transf_1 (PF00534, pink), and S6PP (PF05116, red) (Figure 3), which are located at the N-terminal, middle, and C-terminal regions, respectively. These domains represent typical features of SPS proteins involved in sucrose metabolism. In addition, a few members (e.g., AdSPS2, AdSPS6, and AdSPS10) possessed an additional Glyco_trans_4_4 domain, which may reflect specialized glycosyltransferase functions. Low-complexity regions were observed at the N- or C-terminal regions of some proteins, which may contribute to specific structural or regulatory roles.
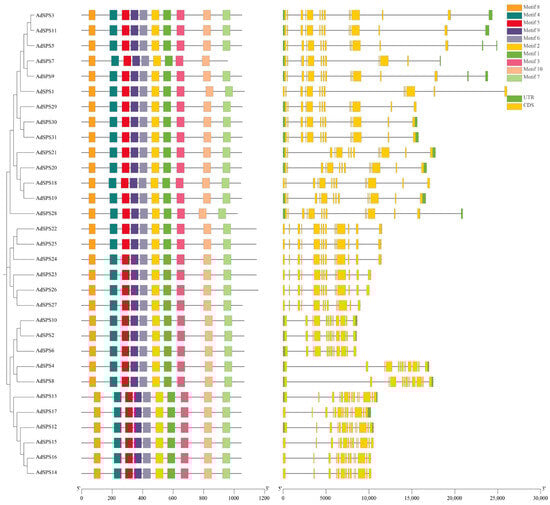
Figure 2.
Gene structure and conserved motif analysis of AdSPS family members.
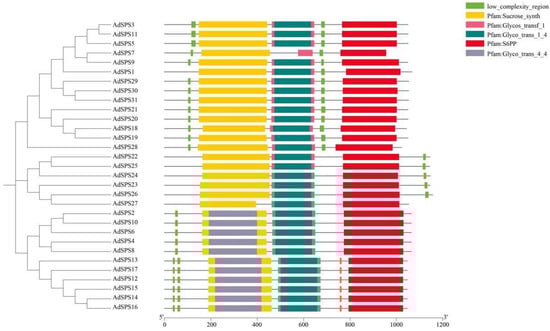
Figure 3.
Conserved domain analysis of AdSPS family proteins.
3.4. Synteny Analysis of AdSPS Genes
To explore the evolutionary origins of the AdSPS genes, both intragenomic and interspecies synteny analyses were performed via TBtools (version 2.363). Within A. deliciosa, multiple syntenic gene pairs were identified (Figure 4), suggesting that the expansion of the AdSPS gene family may have resulted from whole-genome duplication (WGD) or segmental duplication (SD) events. Additionally, some gene pairs located adjacent to the same chromosome may have originated from tandem duplication (TD) events.
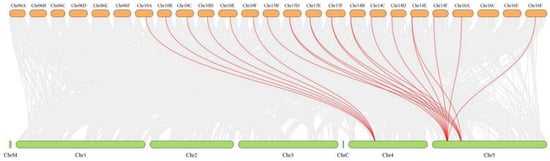
Figure 4.
Interspecies collinearity analysis of SPS genes between A. deliciosa and A. thaliana.
As A. deliciosa is a hexaploid species comprising multiple subgenomes (designated A~F), numerous syntenic relationships were observed among the subgenomes, indicating that many AdSPS genes were retained during polyploidization. Comparative synteny analysis with A. thaliana identified three major orthologous gene clusters: AtSPSC corresponding to AdSPS12~17, AtSPSA1 to AdSPS18~21, and AtSPSA2 to AdSPS23~27 (Figure 5). The AtSPS genes were located mainly on chromosomes 4 and 5, whereas the syntenic AdSPS genes were distributed on chromosomes such as Chr10, Chr13, and Chr14 in A. deliciosa.
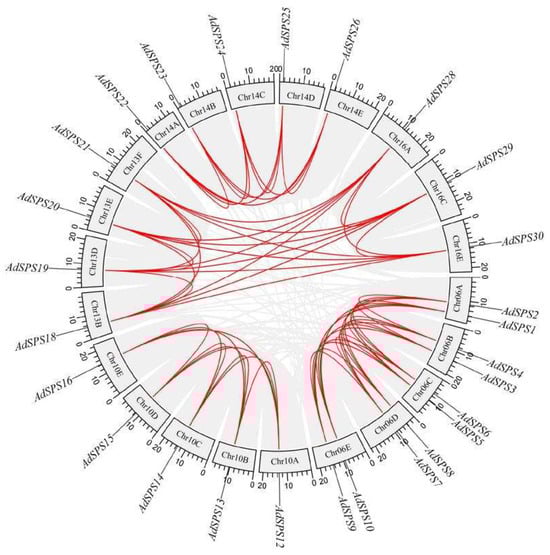
Figure 5.
Intraspecies collinearity analysis of SPS genes in A. deliciosa.
3.5. Phylogenetic Analysis of AdSPS Genes
A phylogenetic tree was constructed using 50 SPS protein sequences from A. deliciosa (31), A. thaliana (4), Litchi chinensis (4), Malus domestica (3), Oryza sativa (5), Vitis vinifera (1), and Zea mays (2) (Figure 6). These SPS proteins are classified into four distinct subfamilies. The AdSPS members were distributed mainly among subfamilies A (20), B (5), and C (6). Several paralogous gene pairs formed closely related clades, including AdSPS3/AdSPS11, AdSPS7/AdSPS9, AdSPS30/AdSPS31, AdSPS18/AdSPS19, AdSPS22/AdSPS24, AdSPS26/AdSPS27, AdSPS2/AdSPS10, AdSPS4/AdSPS8, and AdSPS14/AdSPS16, which indicates that they have high homology in evolution.
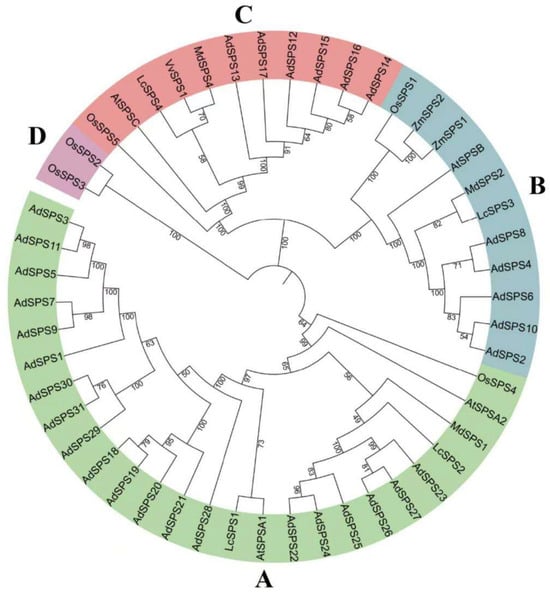
Figure 6.
Phylogenetic analysis of SPS genes in A. deliciosa, A. thaliana, O. sativa, L. chinensis, M. domestica, V. vinifera, and Z. mays.
3.6. Cis-Acting Element Analysis of AdSPS Gene Promoters
A total of 858 cis-acting elements were identified within the 2000 bp upstream promoter regions of the AdSPS genes (Figure 7). The most abundant elements were light-responsive elements, suggesting that AdSPS genes may be regulated by light signaling. In addition, multiple hormone-responsive elements, including those responsive to salicylic acid (SA), methyl jasmonate (MeJA), gibberellin (GA), auxin (IAA), and abscisic acid (ABA), were detected, indicating the potential involvement of AdSPS genes in hormonal regulation. Elements associated with abiotic and biotic stress responses, such as low-temperature and anaerobic stress, were also identified. Furthermore, elements related to circadian rhythm, cell cycle control, and meristem-specific expression were present, implying that AdSPS genes may participate in diverse developmental and environmental response pathways.
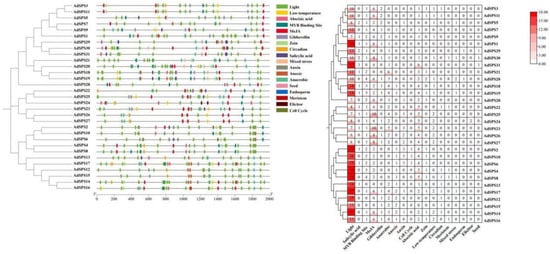
Figure 7.
Cis-acting element analysis of the AdSPS gene family.
3.7. Effects of Different Light Quality Treatments on Sugar Contents in Kiwifruit Leaves
The contents of sucrose, glucose, and fructose in kiwifruit leaves were measured under different light treatments. The results showed that light quality significantly affected the accumulation of all three sugars (Figure 8). Sucrose content was highest under R3B1 treatment (15.01 mg·g−1), which was significantly higher than other treatments. R treatment resulted in a sucrose content of 12.97 mg·g−1, second only to B treatment. Glucose content was highest under R and R3B1 treatments (6.57 and 6.95 mg·g−1) and lowest under B and R6B1 treatments (3.16 and 3.64 mg·g−1). Fructose content showed a similar trend to glucose, with the highest contents under R and R3B1 (5.84 and 5.98 mg·g−1) and lower levels under B and R6B1 (3.85 and 3.90 mg·g−1).
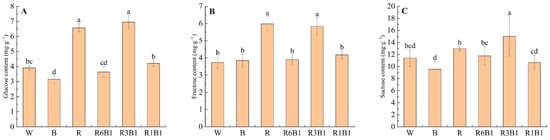
Figure 8.
(A) Glucose content; (B) Fructose content; (C) Sucrose content in kiwifruit leaves under different light quality treatments. Each value in the graph shows the mean with the standard deviation of three replicates. According to Duncan’s multiple range tests, different small letters indicate significant difference at p < 0.05. W, white; B, blue light; R, red light; red-to-blue light ratios of 6:1 (R6B1), 3:1 (R3B1), and 1:1 (R1B1).
3.8. Effects of Sucrose Phosphate SYNTHASE (SPS) Activity in Kiwifruit Leaves Under Different Light Quality Treatments
SPS activity in kiwifruit leaves was measured under different light treatments, and the results showed that SPS activity differed significantly among the treatments (Figure 9). SPS activity was highest under R3B1 treatment (780.11 U·g−1 FW), significantly higher than the other treatments. Under R, R6B1, and W treatments, SPS activity were 701.70 U·g−1 FW, 657.67 U·g−1 FW, 655.00 U·g−1 FW, respectively, which were all at intermediate levels. The lowest SPS activity was observed under B (508.93 U·g−1 FW) and R1B1 (554.38 U·g−1 FW) treatments. Overall, SPS activity was highest under R3B1 treatment, and lowest under B and R1B1 treatments.
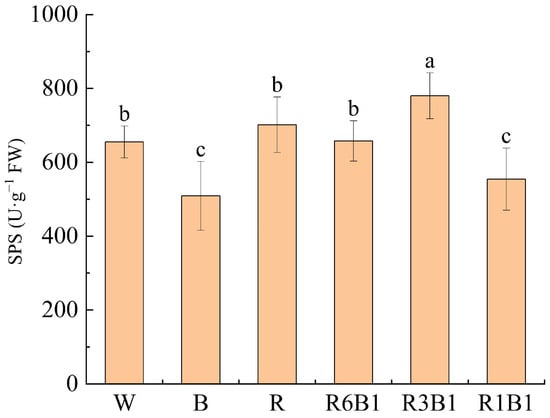
Figure 9.
Sucrose phosphate synthase (SPS) activity in kiwifruit leaves under different light quality treatments. Each value in the graph shows the mean with the standard deviation of three replicates. According to Duncan’s multiple range tests, different small letters indicate significant difference at p < 0.05. W, white; B, blue light; R, red light; red-to-blue light ratios of 6:1 (R6B1), 3:1 (R3B1), and 1:1 (R1B1).
3.9. Expression Patterns of AdSPS Genes Under Different Light Qualities
To investigate the response of AdSPS genes to light quality, eight representative genes were selected on the basis of sequence specificity and phylogenetic relationships. Gene-specific primers were designed, and their relative expression levels were analyzed via qRT‒PCR under six different light conditions: W, B, R, R1B1, R3B1, and R6B1 (Figure 10). The expression of AdSPS1, AdSPS3, and AdSPS28 was highest under white or blue light and significantly decreased under red and red–blue mixed light, indicating potential suppression by red light. AdSPS6 and AdSPS24 presented similar expression trends, with the lowest expression under red light and progressive upregulation as the proportion of blue light increased. Conversely, AdSPS9 and AdSPS21 were highly induced under the R1B1 and R6B1 treatments, suggesting a preference for red–blue mixed light environments. In contrast, the expression of AdSPS12 was inhibited by blue light, but the difference was not pronounced under different red–blue mixed lights. These findings suggest that AdSPS genes exhibit differential expression patterns in response to light quality, implying that functional diversification within the family involves the regulation of light-regulated carbon metabolism.
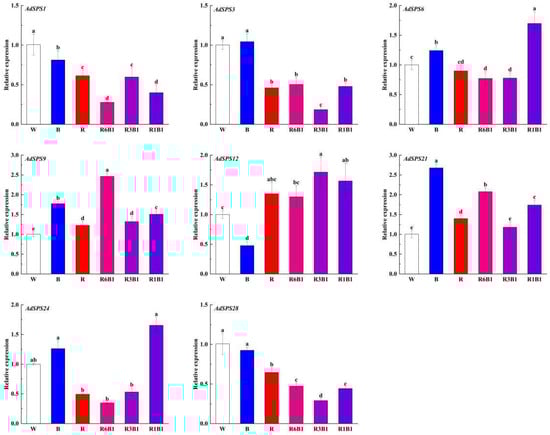
Figure 10.
Expression of AdSPS family members under different red and blue light treatments. According to Duncan’s multiple range tests, different small letters indicate significant difference at p < 0.05.
3.10. AdSPS Gene Expression and Its Correlations with Sugar Content and SPS Activity
Spearman’s rank correlation analysis was performed to evaluate the relationships between eight AdSPS genes and the contents of sucrose, fructose, glucose, and SPS activity (Table 4). AdSPS3 showed significant negative correlations with sucrose (ρ = −0.83, p < 0.05), fructose (ρ = −0.89, p < 0.05), glucose (ρ = −0.94, p < 0.01), and SPS activity (ρ = −0.83, p < 0.05). AdSPS12 showed a significant positive correlation with glucose (ρ = 0.89, p < 0.05) and positive correlations with sucrose, fructose, and SPS activity. Other genes (AdSPS1, AdSPS6, AdSPS9, AdSPS21, AdSPS24, and AdSPS28) exhibited weak or non-significant correlations with all sugars content and SPS activity.
Table 4.
Correlation Matrix Between AdSPS Gene Expression and the Contents of Sucrose, Fructose, Glucose, and SPS Activity.
4. Discussion
The SPS gene family has been extensively studied in various plants, with increasing attention given to its roles in sucrose synthesis, regulation of carbon metabolism, and stress responses. In this study, 31 AdSPS gene family members were identified on the basis of whole-genome data from A. deliciosa. This number is significantly greater than the four members reported in the model plant A. thaliana [4] and the eight in tobacco [10]. This difference is likely attributed to the allohexaploid nature of A. deliciosa, which has a complex genome structure and has undergone multiple genome duplication events [33]. Chromosomal distribution and collinearity analyses further support this hypothesis, showing that multiple AdSPS genes exhibit significant collinearity across different chromosomes. Additionally, the close arrangement of some genes on the same chromosome suggests that tandem duplication has played a critical role in the expansion of this gene family [39].
Physicochemical property analysis indicated that AdSPS proteins are generally acidic and hydrophilic and exhibit a certain degree of instability. Secondary structure predictions revealed that AdSPS proteins predominantly consist of α-helices and random coils, which is consistent with the characteristics observed in SPS family proteins from potato [40] and lemon [41]. Subcellular localization predictions indicated that all AdSPS proteins are likely localized to the chloroplast, suggesting their primary involvement in carbon assimilation and sucrose synthesis in photosynthetic tissues. However, these predictions are based solely on in silico analyses and may not fully capture possible dual localizations or cytosolic distribution, as observed in other species such as apple [9] and soybean [8], where SPS proteins can also function in the cytoplasm or nucleus. This potential discrepancy highlights the need for experimental validation, such as GFP-fusion protein assays, to confirm the precise subcellular localization of AdSPS isoforms in kiwifruit. Understanding the true localization is important because SPS primarily functions in the cytoplasm in many species [42].
Exon‒intron structure analysis revealed that the number of exons in AdSPS family members mostly ranges from 13–14, a feature similar to that of SPS family genes in tomato [5] and apple [42], reflecting a high degree of structural conservation during evolution. Motif analysis further revealed high consistency in motif composition and arrangement among AdSPS members, indicating conserved protein sequences. Conserved domain analysis confirmed the functional specificity of the SPS family; all AdSPS members contained Sucrose_synth, glyco_transf_1, and S6PP domains, suggesting coordinated roles in sucrose metabolism.
Phylogenetic analysis clustered the AdSPS proteins into three subfamilies (A, B, and C), containing 20, 5, and 6 members, respectively. Previous studies have reported that these three subfamilies are broadly present in both monocots and dicots, whereas a fourth subfamily (D) is exclusive to monocots [43]. Eighteen AdSPS proteins were paired within the same clades, indicating high homology. Intraspecific collinearity analysis revealed three collinear gene pairs between the AdSPS and AtSPS genes, demonstrating evolutionary conservation alongside certain degrees of gene family expansion [44].
Cis-acting element analysis of the AdSPS promoter regions revealed enrichment of light-responsive, hormone-responsive, and stress-responsive elements, suggesting that this gene family may play important roles in light signaling pathways, hormonal regulation, and responses to biotic and abiotic stresses. These findings were consistent with observations in cucumber [45] and rapeseed [46]. The binding of different transcription factors to these cis-acting elements modulates gene expression under various conditions, thereby determining the biological functions of these genes [47]. The high abundance of light-responsive elements indicated a significant role for AdSPS genes in the light response.
The present study demonstrated that light quality had a significant impact on the contents of sucrose, glucose, and fructose, as well as on SPS activity in kiwifruit leaves. Among the treatments, the R3B1 combination resulted in the highest levels of sugar accumulation and SPS activity. This observation is consistent with previous findings in tomato, where the R3B1 ratio was shown to promote sugar accumulation, suggesting that this light proportion may be most favorable for carbon assimilation and sucrose biosynthesis [48]. Similarly, studies in lettuce have reported that red–blue light markedly enhances sucrose content and the activities of SPS and other key enzymes involved in carbohydrate metabolism, thereby facilitating sugar accumulation [49]. In the current study, SPS activity and sucrose content exhibited similar variation patterns under different light treatments, indicating that elevated SPS activity may constitute an important physiological basis for sucrose accumulation in kiwifruit leaves. These findings align with reports in other plant species showing that SPS activity is positively associated with sugar accumulation [50,51].
Expression profiling of eight representative AdSPS genes under different light quality treatments revealed significant differential expression patterns. The functional divergence of the SPS family in light response pathways is suggested. For example, AdSPS1, AdSPS3, and AdSPS28 presented relatively high expression under white or blue light, indicating their possible positive roles in photosynthesis pathways induced by natural or blue light. Conversely, red light suppressed the expression of AdSPS6 and AdSPS24; however, as the proportion of red light decreased and blue light increased, their expression levels increased accordingly. AdSPS12 was inhibited by blue light, but this inhibition was alleviated when red light was combined with blue light. AdSPS9 and AdSPS21 showed increased expression under red–blue mixed light treatments, especially R6B1 and R1B1, suggesting that these genes might be more sensitive to synergistic red–blue light signals and may be involved in integrating light signals to regulate the activity of sucrose synthesis-related enzymes. Notably, red–blue mixed light has been shown to optimize photosynthesis and carbon metabolism efficiency in various plants [52,53,54].
Spearman’s correlation analysis revealed that AdSPS3 was significantly negatively correlated with sucrose, fructose, glucose, and SPS activity, suggesting that AdSPS3 may act as a negative regulator of sugar accumulation in kiwifruit leaves. SPS is a multigene family with substantial functional diversity and redundancy; therefore, weak or even negative correlations between individual SPS genes and sucrose accumulation or overall SPS enzymatic activity are commonly observed in many plant species. This negative correlation suggests feedback regulation, tissue-specific specialization, or post-translational control. Similar phenomena have been reported in crops such as maize [55], Arabidopsis thaliana [56], apple [57], and pear [11]. In contrast, AdSPS12 was positively correlated with glucose, sucrose, fructose, and SPS activity, indicating a potential role in promoting sucrose synthesis. These correlation patterns were consistent with the gene expression profiles under different light quality treatments: for example, AdSPS3 was repressed under red–blue mixed light, corresponding to increased SPS activity and sugar accumulation, whereas AdSPS12 was upregulated under mixed light, supporting its positive regulatory function. Other AdSPS genes exhibited weak or non-significant correlations with sugars and SPS activity, suggesting that their contributions to leaf sugar metabolism under the tested conditions are limited and reflecting functional divergence and potential tissue- or condition-specific regulation within the SPS gene family. Different SPS isoforms in kiwifruit leaves may play distinct roles in light-mediated carbon metabolism; some isoforms, such as AdSPS12, may act as activators promoting sucrose synthesis and accumulation, whereas others, such as AdSPS3, may function as repressors, potentially limiting sugar accumulation through feedback regulation or tissue-specific effects. This hypothesis still requires further confirmation through functional validation experiments.
Previous studies on SPS gene families in apple [9], pear [11] and citrus [58] have mainly focused on their roles in fruit sugar accumulation during development, emphasizing positive regulation of sucrose synthesis in sink tissues and cultivar-dependent differences. Although functional divergence among SPS family members has been reported, these studies largely lack evidence for environmentally driven regulation. In contrast, the present study shifts the focus to source leaves and light-quality regulation in kiwifruit. By integrating genome-wide identification, promoter analysis, red–blue light treatments, physiological measurements, and transcriptional profiling, we demonstrate pronounced functional differentiation among AdSPS family members in response to light quality. In addition, the R3B1 light regime was identified as an optimal red–blue ratio for promoting sugar accumulation and SPS activity in kiwifruit leaves. Light-quality-mediated regulation of SPS gene expression highlights a broader regulatory role of SPS in carbon allocation plasticity in perennial crops. Unlike annual species, perennial crops must coordinate source–sink relationships and carbon reserve balance across multiple growing seasons [59]. Different red–blue light regimes may fine-tune sucrose synthesis rates and transport patterns by modulating SPS expression, thereby enabling plants to optimize the balance between vegetative growth and carbon storage under fluctuating light environments. This provides new insights into the physiological mechanisms by which perennial crops adapt to canopy light heterogeneity. Collectively, these findings extend the functional paradigm of SPS genes beyond fruit development and highlight their potential roles in light-mediated carbon metabolism.
5. Conclusions
Comprehensive identification of SPS genes in the hexaploid genome of Actinidia deliciosa revealed a total of 31 members, significantly more than in other diploid plant species. Conserved domain analysis showed that all SPS family members contain the Sucrose_synth, Glyco_transf_1, and S6PP domains, and cis-element analysis indicated abundant light-responsive regulatory motifs, highlighting evolutionary conservation and potential responsiveness to light. Chromosomal mapping further revealed that these genes are distributed across 26 chromosomes with notable syntenic relationships. Different light qualities significantly affected the contents of sucrose, glucose, and fructose, as well as SPS activity in kiwifruit leaves, with the highest sugar accumulation and SPS activity observed under the R3B1 treatment. Spearman’s correlation analysis indicated that AdSPS3 was significantly negatively correlated with sucrose, fructose, glucose, and SPS activity, suggesting a potential role in negatively regulating sugar accumulation, whereas AdSPS12 showed positive correlations, implying a role in promoting sucrose synthesis. It should be noted that this study focused exclusively on leaves under specific light conditions, without examining other tissues or developmental stages, and functional validation of these genes was not performed. Future studies could employ tissue-specific expression analyses, overexpression, or knockdown experiments to further elucidate the precise roles of individual SPS genes in light-regulated sugar accumulation.
Author Contributions
Conceptualization, L.L. and J.C.; methodology, Y.Z., M.L. (Meng Li), P.W., D.C., X.S. and H.G.; software, Y.Z., X.S. and H.G.; validation, M.L. (Meng Li) and L.L.; formal analysis, X.S. and H.G.; investigation, Y.Z.; resources, M.L. (Ming Li), P.W., D.C., M.L. (Meng Li) and L.L.; data curation, Y.Z., M.L. (Ming Li), P.W., D.C., M.L. (Meng Li) and L.L.; writing—original draft preparation, Y.Z.; writing—review and editing, Y.Z. and J.C.; visualization, M.L. (Meng Li) and L.L.; supervision, L.L. and J.C.; project administration, J.C.; funding acquisition, J.C. All authors have read and agreed to the published version of the manuscript.
Funding
This work was supported by the National Key Research and Development Program (2022YFD1600700), the Scientific and Technological Project in Henan Province (242102110221), the Special Fund for Henan Agriculture Research System (HARS-22-09-S), the Agricultural Science and Technology Innovation Program, Chinese Academy of Agricultural Sciences (CAAS-ASTIP-2025-ZFRI-03), and the China Agriculture Research System of MOF and MARA (CARS-26).
Data Availability Statement
The raw data supporting the conclusions of this article will be made available by the authors on request.
Conflicts of Interest
The authors declare no conflicts of interest.
References
- Yoon, J.; Cho, L.H.; Tun, W.; Jeon, J.S.; An, G. Sucrose signaling in higher plants. Plant Sci. 2021, 302, 110789. [Google Scholar] [CrossRef] [PubMed]
- Lunn, J.E.; MacRae, E. New complexities in the synthesis of sucrose. Curr. Opin. Plant Biol. 2003, 6, 208–214. [Google Scholar] [CrossRef]
- Lunn, J.E. Sucrose-phosphatase gene families in plants. Gene 2003, 303, 187–196. [Google Scholar] [CrossRef] [PubMed]
- Wang, J.; Du, J.J.; Mu, X.P.; Wang, P.F. Cloning and characterization of the Cerasus humilis sucrose phosphate synthase gene (ChSPS1). PLoS ONE 2017, 12, e0186650. [Google Scholar]
- Duan, Y.K.; Yang, L.; Zhu, H.J.; Zhou, J.; Sun, H.; Gong, H.J. Structure and Expression Analysis of Sucrose Phosphate Synthase, Sucrose Synthase and Invertase Gene Families in Solanum lycopersicum. Int. J. Mol. Sci. 2021, 22, 4835. [Google Scholar] [CrossRef]
- Wu, J.Y.; Chen, M.; Yao, Y.L.; Fu, Q.; Zhu, Z.Y.; Zhang, X.M. Identification, characterisation, and expression profile analysis of the sucrose phosphate synthase gene family in pineapple (Ananas comosus). J. Hortic. Sci. Biotechnol. 2022, 97, 201–210. [Google Scholar] [CrossRef]
- Okamura, M.; Aoki, N.; Hirose, T.; Yonekura, M.; Ohto, C.; Ohsugi, R. Tissue specificity and diurnal change in gene expression of the sucrose phosphate synthase gene family in rice. Plant Sci. 2011, 181, 159–166. [Google Scholar] [CrossRef]
- Shen, J.F.; Xu, Y.R.; Yuan, S.L.; Jin, F.X.; Huang, Y.; Chen, H.F.; Shan, Z.H.; Yang, Z.L.; Chen, S.L.; Zhou, X.N.; et al. Genome-Wide Identification of GmSPS Gene Family in Soybean and Expression Analysis in Response to Cold Stress. Int. J. Mol. Sci. 2023, 24, 12878. [Google Scholar] [CrossRef] [PubMed]
- Zhang, L.H.; Zhu, L.C.; Xu, Y.; Lü, L.; Li, X.G.; Li, W.H.; Liu, W.D.; Ma, F.W.; Li, M.J.; Han, D.G. Genome-wide identification and function analysis of the sucrose phosphate synthase MdSPS gene family in apple. J. Integr. Agric. 2023, 22, 2080–2093. [Google Scholar] [CrossRef]
- Li, B.G.; Su, H.; Wang, S.B.; Gao, J.P.; Wang, Z.; Yang, J.; Xu, X. Identification of the sucrose phosphate synthase (SPS) gene family reveals the positive role of NtSPS5 and NtSPS6 in drought stress tolerance of tobacco. Chem. Biol. Technol. Agric. 2025, 12, 1–16. [Google Scholar] [CrossRef]
- Lü, J.H.; Wang, Y.Z.; Cheng, R.; Wang, G.M.; Zhang, S.L.; Wu, J.; Zhang, H.P. Identification and expression analysis of SUS and SPS gene families related to sucrose synthesis in pears. Acta Hortic. Sin. 2018, 45, 421–435. [Google Scholar] [CrossRef]
- Jiang, S.Y.; Chi, Y.H.; Wang, J.Z.; Zhou, J.X.; Cheng, Y.S.; Zhang, B.L.; Ma, A.; Jeevanandam, V.; Srinivasan, R. Sucrose metabolism gene families and their biological functions. Sci. Rep. 2015, 5, 17583. [Google Scholar] [CrossRef] [PubMed]
- Volkert, K.; Debast, S.; Voll, L.M.; Voll, H.; Schießl, I.; Hofmann, J.; Schneider, S.; Börnke, F. Loss of the two major leaf isoforms of sucrose-phosphate synthase in Arabidopsis thaliana limits sucrose synthesis and nocturnal starch degradation but does not alter carbon partitioning during photosynthesis. J. Exp. Bot. 2014, 65, 5217–5229. [Google Scholar] [CrossRef] [PubMed]
- do Nascimento, J.R.O.; Cordenunsi, B.R.; Lajolo, F.M.; Alcocer, M.J.C. Banana sucrose-phosphate synthase gene expression during fruit ripening. Planta 1997, 203, 283–288. [Google Scholar] [CrossRef]
- Zheng, C.C.; Tian, H.M.; Fan, J.; Wang, X.F.; Yu, X.Y. Cloning and characterization of a sucrose phosphate synthase-encoding gene from muskmelon. J. Am. Soc. Hortic. Sci. 2007, 132, 557–562. [Google Scholar] [CrossRef]
- Komatsu, A.; Moriguchi, T.; Koyama, K.; Omura, M.; Akihama, T. Analysis of sucrose synthase genes in citrus suggests different roles and phylogenetic relationships. J. Exp. Bot. 2002, 53, 61–71. [Google Scholar] [CrossRef] [PubMed]
- Qi, X.L.; Liu, C.L.; Song, L.L.; Li, M. Functional analysis of sucrose phosphate synthase gene PavSPS in sweet cherry. Acta Hortic. Sin. 2021, 48, 1446–1456. [Google Scholar] [CrossRef]
- Anur, R.M.; Mufithah, N.; Sawitri, W.D.; Sakakibara, H.; Sugiharto, B. Overexpression of Sucrose Phosphate Synthase Enhanced Sucrose Content and Biomass Production in Transgenic Sugarcane. Plants 2020, 9, 200. [Google Scholar] [CrossRef]
- Ishimaru, K.; Hirotsu, N.; Kashiwagi, T.; Madoka, Y.; Nagasuga, K.; Ono, K.; Ohsugi, R. Overexpression of a maize SPS gene improves yield characters of potato under field conditions. Plant Prod. Sci. 2008, 11, 104–107. [Google Scholar] [CrossRef]
- Zhang, Y.Y.; Zeng, D.W.; Liu, Y.H.; Zhu, W.M. SlSPS, a sucrose phosphate synthase gene, mediates plant growth and thermotolerance in tomato. Horticulturae 2022, 8, 549. [Google Scholar] [CrossRef]
- Niron, H.; Türet, M. pvSPS4 is involved in regulation of root sugar balance in common bean under salt stress. Plant Gene 2023, 35, 100427. [Google Scholar] [CrossRef]
- Li, A.M.; Liao, F.; Qin, C.X.; Wang, M.; Chen, Z.L.; Zhang, B.Q.; Gao, Y.J.; Pan, Y.Q.; Huang, D.L. Sucrose Phosphate Synthase Genes in Plants: Its Role and Practice for Crop Improvement. J. Agric. Food Chem. 2024, 72, 18335–18346. [Google Scholar] [CrossRef]
- Shi, L.Y.; Cao, S.F.; Shao, J.R.; Chen, W.; Yang, Z.F.; Zheng, Y.H. Chinese bayberry fruit treated with blue light after harvest exhibit enhanced sugar production and expression of cryptochrome genes. Postharvest Biol. Technol. 2016, 111, 197–204. [Google Scholar] [CrossRef]
- Zhang, Y.; Sun, Y.; Wang, Y.; Zhou, D.; Tu, K. Effects of blue and red LED treatments on carotenoid and soluble sugar metabolism in postharvest nectarine fruit and their correlation. Plant Physiol. Biochem. 2025, 224, 109897. [Google Scholar] [CrossRef] [PubMed]
- Guan, J.Y.; Liang, X.; Gao, G.; Yang, F.; Qi, H.Y. The interaction between CmPIF8 and CmACO1 under postharvest red light treatment might affect fruit ripening and sucrose accumulation in oriental melon fruit. Postharvest Biol. Technol. 2024, 209, 112717. [Google Scholar] [CrossRef]
- Vassey, T.L. Phytochrome mediated regulation of sucrose phosphate synthase activity in maize. Plant Physiol. 1988, 88, 540–542. [Google Scholar] [CrossRef]
- Lü, T.H. Effect of Red and Blue Light Supplement on Sugar and Pigment Accumulation in Watermelon Fruit. Ph.D. Thesis, Shenyang Agricultural University, Shenyang, China, 2022. [Google Scholar]
- Yang, L.; Chen, J.; Sun, X.; Li, J.; Chen, N. Inhibition of sucrose and galactosyl-sucrose oligosaccharide metabolism in leaves and fruits of melon (Cucumis melo L.) under low light stress. Sci. Hortic. 2019, 244, 343–351. [Google Scholar] [CrossRef]
- Dai, L. Screening of Pollination Cultivars, Postharvest Storage Methods, and Photosynthetic Characteristics in Kiwifruit. Master’s Thesis, Nanjing Agricultural University, Nanjing, China, 2015. [Google Scholar]
- Warrington, I.J.; Weston, G.C. Kiwifruit Science and Management; Ray Richards Publisher: Auckland, New Zealand, 1990. [Google Scholar]
- Bano, S.; Scrimgeour, F. The Export Growth and Revealed Comparative Advantage of the New Zealand Kiwifruit Industry. Int. Bus. Res. 2012, 5, 3–14. [Google Scholar] [CrossRef]
- Huang, H.W. Actinidia: Classification, Resources, Domestication and Cultivation; Science Press: Beijing, China, 2013. [Google Scholar]
- Liu, Y.B.; Zhou, Y.; Cheng, F.; Zhou, R.C.; Yang, Y.Q.; Wang, Y.C.; Zhang, X.T.; Soltis, D.E.; Xiao, N.W.; Quan, Z.J.; et al. Chromosome-level genome of putative autohexaploid Actinidia deliciosa provides insights into polyploidisation and evolution. Plant J. 2024, 118, 73–89. [Google Scholar] [CrossRef]
- Chen, C.J.; Wu, Y.; Li, J.W.; Wang, X.; Zeng, Z.H.; Xu, J.; Liu, Y.L.; Feng, J.T.; Chen, H.; He, Y.H.; et al. TBtools-II: A “one for all, all for one” bioinformatics platform for biological big-data mining. Mol. Plant 2023, 16, 1733–1742. [Google Scholar] [CrossRef]
- Chao, M.N.; Hu, H.Y.; Fu, L.N.; Wen, Q.Y.; Hu, G.H.; Luo, Y.F.; Li, Y.N.; Wang, Q.L. Identification and expression analysis of sucrose phosphate synthase gene family in upland cotton. Cotton Sci. 2020, 32, 30–41. [Google Scholar] [CrossRef]
- Huang, T.W.; Luo, X.L.; Wei, M.G.; Shan, Z.Y.; Zhu, Y.M.; Yang, Y.N.; Fan, Z.P. Molecular cloning and expression analysis of sucrose phosphate synthase genes in cassava (Manihot esculenta Crantz). Sci. Rep. 2020, 10, 20707. [Google Scholar] [CrossRef] [PubMed]
- GB 5009.8-2023; National Food Safety Standard—Determination of Fructose, Glucose, Sucrose, Maltose and Lactose in Foods. National Health Commission & State Administration for Market Regulation: Beijing, China, 2023.
- Livak, K.J.; Schmittgen, T.D. Analysis of relative gene expression data using real-time quantitative PCR and the 2(-Delta Delta C(T)) Method. Methods 2001, 25, 402–408. [Google Scholar] [CrossRef]
- Wang, F.F.; Su, Y.L.; Chen, N.Z.; Shen, S.H. Genome-Wide Analysis of the UGT Gene Family and Identification of Flavonoids in Broussonetia papyrifera. Molecules 2021, 26, 3449. [Google Scholar] [CrossRef]
- Hu, J.; Duan, Y.F.; Hu, J.X.; Zhang, S.Q.; Li, G.C. Phylogenetic and Expression Analysis of the Sucrose Synthase and Sucrose Phosphate Synthase Gene Family in Potatoes. Metabolites 2024, 14, 70. [Google Scholar] [CrossRef]
- Wang, Y.A.; Lu, C.; Yang, Y.L.; Tang, T.; Yan, X.Y.; Huang, G.X. Identification and expression analysis of key enzyme gene family of sucrose metabolism in lemon. J. South. Agric. 2023, 54, 1327–1340. [Google Scholar] [CrossRef]
- Yang, S.; Feng, Y.; Cao, X.; Hu, H.; Yang, J.; Li, W.; Hou, Y.; Ma, Z. Functional analysis of the apple SPS gene family in response to abiotic stresses. Agronomy 2024, 14, 1237. [Google Scholar] [CrossRef]
- Castleden, C.K.; Aoki, N.; Gillespie, V.J.; MacRae, E.A.; Quick, W.P.; Buchner, P.; Foyer, C.H.; Furbank, R.T.; Lunn, J.E. Evolution and function of the sucrose-phosphate synthase gene families in wheat and other grasses. Plant Physiol. 2004, 135, 1753–1764. [Google Scholar] [CrossRef] [PubMed]
- Hou, Y.Q.; Lang, H.S.; Wen, M.M.; Gu, Y.Y.; Zhu, R.J.; Tang, X.L. Identification and expression analysis of AcHSP20 gene family in kiwifruit. Biotechnol. Bull. 2024, 40, 167–178. [Google Scholar] [CrossRef]
- Xing, Y.M.; Li, X.L.; Song, X.F.; Zhang, J.J.; Yan, L.Y.; Xie, Y. Cucumber sucrose metabolism key enzyme gene family identification and expression analysis. Plant Physiol. J. 2024, 60, 1569–1578. [Google Scholar]
- Zhang, L.; Jian, H.J.; Yang, B.; Zhang, A.X.; Zhang, C.; Yang, H.; Zhang, L.Y.; Liu, L.Z.; Xu, X.F.; Lu, K.; et al. Identification and expression analysis of sucrose phosphate synthase (SPS) gene family members in Brassica napus L. Acta Agron. Sin. 2018, 44, 197–207. [Google Scholar] [CrossRef]
- Hua, Y.G.; Liu, Q.; Zhai, Y.F.; Zhao, L.M.; Zhu, J.J.; Zhang, X.D.; Jia, Q.J.; Liang, Z.S.; Wang, D.K. Genome-wide analysis of the HSP20 gene family and its response to heat and drought stress in Coix (Coix lacryma-jobi L.). BMC Genom. 2023, 24, 478. [Google Scholar] [CrossRef]
- Li, Y.; Xin, G.; Wei, M.; Shi, Q.; Yang, F.; Wang, X. Carbohydrate accumulation and sucrose metabolism responses in tomato seedling leaves when subjected to different light qualities. Sci. Hortic. 2017, 225, 490–497. [Google Scholar] [CrossRef]
- Liu, J.; Liu, W. Regulation of accumulation and metabolism circadian rhythms of starch and sucrose in two leaf-color lettuces by red:blue ratios of LED continuous light. Environ. Exp. Bot. 2022, 196, 104811. [Google Scholar] [CrossRef]
- Li, M.; Feng, F.; Cheng, L. Expression patterns of genes involved in sugar metabolism and accumulation during apple fruit development. PLoS ONE 2012, 7, e33055. [Google Scholar] [CrossRef]
- Shen, C.; Wang, J.; Jin, X.; Liu, N.; Fan, X.; Dong, C.; Shen, Q.; Xu, Y. Potassium enhances the sugar assimilation in leaves and fruit by regulating the expression of key genes involved in sugar metabolism of Asian pears. Plant Growth Regul. 2017, 83, 287–300. [Google Scholar] [CrossRef]
- Luo, S.; Zou, J.; Shi, M.; Lin, S.; Wang, D.; Liu, W.; Shen, Y.; Ding, X.; Jiang, Y. Effects of red-blue light spectrum on growth, yield, and photosynthetic efficiency of lettuce in a uniformly illuminated environment. Plant Soil Environ. 2024, 70, 305–316. [Google Scholar] [CrossRef]
- Gao, Q.; Liao, Q.H.; Li, Q.M.; Yang, Q.C.; Wang, F.; Li, J.M. Effects of LED Red and Blue Light Component on Growth and Photosynthetic Characteristics of Coriander in Plant Factory. Horticulturae 2022, 8, 1165. [Google Scholar] [CrossRef]
- Correia, C.; Magnani, F.; Pastore, C.; Cellini, A.; Donati, I.; Pennisi, G.; Paucek, I.; Orsini, F.; Vandelle, E.; Santos, C.; et al. Red and Blue Light Differently Influence Actinidia chinensis Performance and Its Interaction with Pseudomonas syringae pv. Actinidiae. Int. J. Mol. Sci. 2022, 23, 13145. [Google Scholar] [CrossRef]
- Soga-Morimoto, A.; Soga, K.; Wakabayashi, K.; Kamisaka, S.; Hoson, T. Suppression of sugar accumulation in coleoptile and mesocotyl cells by light irradiation to etiolated maize seedlings. J. Plant Physiol. 2021, 260, 153409. [Google Scholar] [CrossRef]
- Sun, J.; Zhang, J.; Larue, C.T.; Li, G.; Li, L.; Zhang, L. Decrease in leaf sucrose synthesis leads to increased leaf starch turnover and decreased RuBP regeneration-limited photosynthesis but not Rubisco-limited photosynthesis in Arabidopsis null mutants of SPSA1. Plant Cell Environ. 2011, 34, 592–604. [Google Scholar] [CrossRef] [PubMed]
- Li, H.X.; Zhu, L.C.; Zhang, Z.; Ma, F.W.; Li, M.J. Expression characteristics of sucrose phosphate synthase family genes and their relationship with sucrose content in apple. Acta Bot. Boreali-Occident. Sin. 2017, 37, 872–878. [Google Scholar] [CrossRef]
- Lu, W.; Hao, W.; Liu, K.; Liu, J.; Yin, C.; Su, Y.; Hang, Z.; Peng, B.; Liu, H.; Xiong, B.; et al. Analysis of sugar components and identification of SPS genes in citrus fruit development. Front. Plant Sci. 2024, 15, 1389767. [Google Scholar] [CrossRef] [PubMed]
- Ben El Caid, M.; Lachheb, M.; Lagram, K.; Wang, X.; Serghini, M.A. Ecotypic variation and environmental influence on saffron (Crocus sativus L.) vegetative growth: A multivariate performance analysis. J. Appl. Res. Med. Aromat. Plants 2024, 43, 100601. [Google Scholar] [CrossRef]
Disclaimer/Publisher’s Note: The statements, opinions and data contained in all publications are solely those of the individual author(s) and contributor(s) and not of MDPI and/or the editor(s). MDPI and/or the editor(s) disclaim responsibility for any injury to people or property resulting from any ideas, methods, instructions or products referred to in the content. |
© 2026 by the authors. Licensee MDPI, Basel, Switzerland. This article is an open access article distributed under the terms and conditions of the Creative Commons Attribution (CC BY) license.