Article

Exploring Salinity Tolerance in Three Halophytic Plants: Physiological and Biochemical Responses to Agronomic Management in a Half-Strength Seawater Aquaponics System

by
Ayenia Carolina Rosales-Nieblas
1,
Mina Yamada
2,*,
Bernardo Murillo-Amador
3 and
Satoshi Yamada
2
1
The United Graduate School of Agricultural Sciences, Tottori University, Tottori 680-8553, Japan
2
Faculty of Agriculture, Tottori University, Tottori 680-8553, Japan
3
Centro de Investigaciones Biológicas del Noroeste (CIBNOR) S.C., La Paz 23096, Baja California Sur, Mexico
*
Author to whom correspondence should be addressed.
Horticulturae 2025, 11(6), 623; https://doi.org/10.3390/horticulturae11060623
Submission received: 12 April 2025 / Revised: 22 May 2025 / Accepted: 31 May 2025 / Published: 2 June 2025
(This article belongs to the Special Issue Enhancing Plant Quality and Sustainability in Aquaponics Systems)

Abstract

Understanding halophyte responses to agronomic management in saline environments is crucial for optimizing their cultivation. This study assessed the physiological and biochemical responses of three halophytic species, ice plant (Mesembryanthemum crystallinum L.), romeritos (Suaeda edulis Flores Olv. and Noguez), and sea asparagus (Salicornia europaea L.) cultivated in half-strength seawater aquaponics (approximately 250 mM NaCl) under the following rooting media treatments: (C) untreated rearing water (RW), (pH) pH-adjusted to 5.5 RW, (pH+S) pH-adjusted to 5.5 RW with nutrient supplementation, and (NS) standard nutrient solution + 5 mM NaCl. Salinity was the primary factor influencing plant responses, while agronomic management played a secondary role. Ice plants exhibited stable growth across treatments due to their strong succulence, high water content, and antioxidative system, requiring minimal management, though optimal pH may enhance nutrient availability. Romeritos showed high treatment variability yet maintained biomass production via Na+ compartmentalization, with C treatment supporting better osmotic regulation, while pH adjustments and mineral supplementation induced stress under HSW. Sea asparagus sustained growth across all treatments, likely due to effective K+ retention and osmoregulation, reducing the need for additional management. These findings highlight species-specific salinity tolerance mechanisms and suggest that minimal agronomic management can effectively support halophyte cultivation in saline aquaponic systems.

1. Introduction

A significant proportion of staple crops cultivated for human consumption are highly sensitive to salinity, which adversely affects both yield and quality [1,2]. Current projections estimate that the salinization of arable land will increase by up to 50% by 2050 [3], particularly in arid and semi-arid regions [4], resulting in substantial economic burdens for the agricultural sector [5]. Sodium ( N a + ) and chloride ( C l ) are the most harmful ions associated with salinity stress, as their accumulation in the root zone impairs water uptake, disrupts ion homeostasis, inhibits photosynthesis, and accelerates premature senescence [6,7,8,9,10]. Salinity also induces oxidative stress by promoting the formation of excessive reactive oxygen species (ROS), leading to cellular damage [5,11].
In contrast to glycophytes, halophytes have evolved specific mechanisms that enable them to survive in high-salinity environments. Some species can tolerate salt concentrations exceeding 200 mM NaCl, and in certain cases, some halophytes exhibit inhibition at low salinity levels, indicating a reliance on elevated salt concentrations for optimal performance [12,13]. Halophytes have potential agricultural applications beyond soil remediation, including food production, biofuels, fiber, pharmaceuticals, and oil production [14,15,16,17,18,19,20]. Their tolerance involves integrated morphological, physiological, and biochemical strategies, such as ion homeostasis, osmoprotectants biosynthesis, antioxidative defense systems, transcription factor regulation, and specialized structures such as salt bladders [3,4].
Numerous studies have investigated the response of halophytes to saline conditions. For instance, sea asparagus (Salicornia europaea L.) shows optimal growth at 200–400 mM NaCl, with higher salinity levels negatively affecting physiological and anatomical traits [21]. Homayouni et al. [22] reported that increased salinity (300–500 mM NaCl) enhanced stress-related metabolite accumulation and antioxidant enzyme activities in three Salicornia species while negatively impacting pigment and mineral content. In contrast, ice plant (Mesembryanthemum crystallinum L.) showed no significant reduction in growth when irrigated with varying seawater concentrations, although its vegetative stage was prolonged [23]. However, while these studies have advanced our understanding of halophyte responses to salinity, they are generally limited to controlled saline conditions and do not fully explore alternative cultivation systems or agronomic practices.
Saline aquaponics systems have recently gained attention as a sustainable and innovative approach for halophyte cultivation. These systems repurpose aquaculture rearing water, which often contains moderate to high salinity levels and essential nutrients that support plant growth [24,25]. This integrated method addresses critical challenges such as freshwater scarcity and soil salinization while contributing to global food security [26]. A particularly promising model is the half-strength seawater aquaponics system, which supports the cultivation of salt-tolerant species, such as tilapia (Oreochromis niloticus), and provides a more suitable environment for diverse halophyte species by reducing the mineral content of seawater to approximately half, including NaCl (approximately 250 mM) [24].
Despite its advantages, this system presents several limitations, including mineral deficiencies and high pH levels that can lead to nutrient precipitation [27,28]. While some studies have shown species-specific responses of halophytes to saline aquaculture rearing water [25,29,30], there is a limited understanding of how agronomic management strategies influence the physiological and biochemical mechanisms underlying salinity tolerance. Most existing research has emphasized growth outcomes under conditions such as nutrient supplementation, cutting regimes, and LED lighting [25,31,32,33,34], yet the internal plant responses to these factors remain underexplored.
Our previous work assessed the growth of three edible halophytes, ice plant (M. crystallinum L.), romeritos (Suaeda edulis Flores Olv. and Noguez), and sea asparagus (S. europaea L.), under half-strength seawater aquaponics, testing the effects of pH adjustments, mineral supplementation, and standard nutrient solution conditions. Results indicated that pH adjustment enhanced growth in ice plant, while romeritos and sea asparagus remained stable across treatments [24]. While this confirmed the viability of saline aquaponics for halophyte production, a deeper understanding of their adaptive mechanisms is essential to optimize cultivation practices, refine species selection, and enhance long-term system sustainability. Furthermore, such research highlights the broader potential of halophytes as future crops for sustainable agriculture [4,35,36,37,38].
This study aims to explore salinity tolerance mechanisms by evaluating the physiological and biochemical responses of the aforementioned halophytes cultivated in a half-strength seawater aquaponics system under varying agronomic management strategies, primarily based on pH adjustments and nutrient supplementation. We hypothesize that these interventions will enhance plant performance by improving nutrient availability, reducing oxidative stress, and optimizing osmotic regulation. Additionally, we expect species-specific responses, with some halophytes benefiting more than others. By comparing these responses, this study seeks to determine the most suitable agronomic conditions for optimizing halophyte cultivation in saline aquaponic systems.

2. Materials and Methods

2.1. Aquaculture

Nile tilapia (Oreochromis niloticus L.) were reared at the Faculty of Agriculture, Tottori University, Japan, using a closed 1600 L recirculating aquaculture system (800 L freshwater and 800 L coastal groundwater). Fish were fed daily with a commercial diet (Eel EP Profit Suiken d1.5, Feed One Corporation, Yokohama, Japan). Water loss from evaporation was compensated with half-strength seawater. Rearing water was sampled every four days, and N O 3 -N concentrations were monitored using a nitrate reflectometer (RQ flex plus 10, Merck, Darmstadt, Germany). Once N O 3 -N eached 4 mM, and all rearing water was collected for plant experiments.

2.2. Plant Cultivation

Seeds of ice plant (Mesembryanthemum crystallinum L.), romeritos (Suaeda edulis Flores Olvera and Noguez), and sea asparagus (Salicornia europaea L.) were germinated in moistened vermiculite and irrigated with freshwater. Once seedlings reached approximately 2 cm, they were transplanted into 4 L pots with the standard nutrient solution of Tottori University [39]. Salinity acclimation was performed by adding 50 mM NaCl every 3 days until target levels were reached, except in the NS treatment. Ice plant, romeritos, and sea asparagus cultivation lasted 42, 34, and 22 days, respectively.

2.3. Experimental Design and Treatments

Plants were subjected to four different treatments of the rooting medium based on various agronomic management strategies, including pH adjustment and mineral supplementation. The treatments were C as control (untreated rearing water), pH (rearing water and pH adjustment to 5.5), pH+S (rearing water, pH adjustment to 5.5, and nutrient supplementation to reach the same concentration as a standard nutrient solution), and NS (standard nutrient solution and 5 mM NaCl). Each treatment consisted of 4 experimental units, comprising 4 replicates of 3 plants each for ice plant and 5 plants each for romeritos and sea asparagus. The mineral concentrations and pH levels of each treatment for the cultivation of the three species are presented in Table 1. In the treatment pH+S nutrient supplementation of phosphorous (P), iron (Fe), manganese (Mn), copper (Cu), and zinc (Zn) was required to achieve the same concentrations as NS treatment in the 3 species; those were supplemented by adding phosphoric acid (H3PO4), EDTA ferric (C10H13FeN2O8), manganese sulfate (MnSO4∙5H2O), zinc sulfate heptahydrate (ZnSO4∙7H2O), and copper sulfate pentahydrate (CuSO4∙5H2O).

2.4. Rooting Media Management

The pH of the rooting media was measured every 3 days and adjusted to 5.5 in the corresponding treatments by adding potassium hydroxide (KOH) or sulfuric acid (H2SO4) as needed. Weekly transpiration measurements were conducted, with a control pot containing an identical solution volume to the experimental pots used to quantify evaporation. Evapotranspiration was measured in each pot, and the evaporation from the control was subtracted to determine water loss through transpiration. Water level reductions were calculated using a ruler from a pre-marked 4 L level in each pot. The rooting medium was exchanged weekly during the whole cultivation period.

2.5. Plant Biometric Measurements

The total plants per replication were harvested and separated as leaves, stems, and roots for ice plant and romeritos and as shoots, main stems, and roots for sea asparagus. The fresh weight (FW) of each part was determined. Subsequently, a subsample of fresh leaves and shoots was taken to evaluate the leaf area (LA) using ImageJ software (ImageJ version 1.54 g, National Institutes of Health, Bethesda, MD, USA). The dry weight (DW) of each part was measured by drying the samples in an oven (MOV-212F; Sanyo Electric Corporation, Osaka, Japan) set at 70 °C for 48 h. FW and DW were used to calculate water content (WC) as follows: (FW − DW)/DW. The shoot/root ratio was measured as the ratio between the aerial part DW and root DW. Specific leaf area (SLA) was measured as the ratio of leaf area to dry weight (DW). Leaf succulence was calculated as (FW − DW)/LA. Two additional subsamples of fresh leaves or shoots were taken: one to measure chlorophyll and betalain, and the other was immediately frozen in liquid nitrogen and stored at −80 °C for analysis of oxidative stress markers, osmotic pressure, and antioxidant enzymes.

2.6. Cation and Anion Content in Plant Aqueous Extracts

Approximately 0.5 g of leaves or shoots stored at −80 °C were ground with liquid nitrogen using a mortar and pestle. The ground sample was added to a microtube and centrifuged at 12,000× g and 4 °C for 20 min. The supernatant was diluted with distilled water and filtered through a 0.45 µm membrane filter. The anions chloride ( C l ), nitrite ( N O 2 ), nitrate ( N O 3 ), phosphate ( P O 4 3 ), sulfate ( S O 4 2 ), and oxalate ( C 2 H 2 O 4 2 ), and the cations sodium ( N a + ), ammonium ( N H 4 + ), potassium ( K + ), magnesium ( M g 2 + ), and calcium ( C a 2 + ) were measured by ion chromatography (10A Series; Shimadzu Corporation, Kyoto, Japan). A solution containing 1.8 mM sodium carbonate and 1.7 mM sodium bicarbonate and another solution containing 4 mM methanesulphonic acid was used as an anion and cation eluent, respectively.

2.7. Leaf Osmotic Potential

Leaf osmotic potential was measured using an osmometer (Vapro® 5600, ELITechGroup, Paris, France) from plant aqueous extracts used for ion analysis. Values were converted to megapascals (MPA) using the equation Ψs = −CRT, where C is the molar concentration (mmol kg−1), R is the universal gas constant (8.314∙10−6 MPa mmol−1 K−1), and T is the temperature in Kelvin (298.15 K). The individual ion contributions were calculated similarly and expressed as a percentage of the total osmotic potential.

2.8. Chlorophyll and Betalain Content

To determine the content of chlorophyll (a + b) and betalain (betacyanin + betaxanthin), approximately 1 g of fresh sample was added to a test tube containing 99.5% (v v−1) ethanol and stored overnight. Consequently, samples were ground using a Polytron homogenizer (Kinematic Polytron CH-6010, Kinematic, Malters, Switzerland), and the extracts were filtered through filter paper (No. 5C) and made up to 50 mL with ethanol. Absorbance was measured at 665, 649, 538, and 480 nm using a spectrophotometer (U-5100 Spectrophotometer, HITACHI High Technologies, Tokyo, Japan). Chlorophyll content was calculated according to the equation of Wintermans and Mots [40], and betalain content was calculated according to Castellanos-Santiago and Yahia [41].

2.9. Oxidative Stress Markers

2.9.1. Leaf MDA Content

The malondialdehyde (MDA) content of the leaves and shoots was measured using the TBARs method [42]. Approximately 0.25 g of frozen sample was weighed and placed in a test tube, where 5 mL of cooled 5% (w v−1) trichloroacetic acid (TCA) was added and homogenized using a Polytron homogenizer. Samples were centrifuged at 12,000× g for 15 min at 4 °C using a centrifuge (CF15RXII, HITACHI, Tokyo, Japan). Then, 1.5 mL of supernatant was transferred to a tube, and 1.5 mL of 0.67% (w v−1) 2-thiobarbituric acid was added. The samples were then placed in a hot water bath at 100 °C for 30 min. The tubes were immediately transferred to the ice bath for 30 min to stop the reaction. The cooled samples were centrifuged at a speed of 10,000× g at 4 °C for 5 min. The MDA concentration was calculated by subtracting the non-specific absorbance (600 nm) from the specific absorbance (532 nm) of the reactive substances and applying the molar extinction coefficient (155 mM−1 cm−1).

2.9.2. Leaf Hydrogen Peroxide (H2O2) Content

The hydrogen peroxide (H2O2) content in the leaves and shoots was determined following the method described by Tanaka et al. [43]. About 0.5 g of frozen leaf samples was ground in 5 mL of cold acetone using a mortar and pestle. Subsequently, 2 mL of the extract was centrifuged at 4 °C for 10 min at 3000× g. A 1 mL aliquot of the resulting supernatant was transferred to a new tube, to which 0.23 mL of a 17 M (28%) ammonia solution and 0.1 mL of 20% (v v−1) titanium chloride were added. The mixture was centrifuged under the same conditions as before, and the supernatant was discarded. The precipitate was washed with 1 mL of acetone and then centrifuged again; the process was repeated until the precipitate had turned completely white. The resulting white precipitate was resuspended in 3 mL of 1 M sulfuric acid and incubated overnight. The following day, the H2O2 content was quantified by measuring the absorbance of the solution at 410 nm. A standard curve was prepared using H2O2 concentrations ranging from 0 to 500 ppm.

2.10. Activities of Antioxidant Enzymes

2.10.1. Crude Enzyme Extraction

Approximately 0.3 g of frozen leaves and shoots samples were ground in a mortar with liquid nitrogen. Around 60 mg of PVPP (polyvinylpolypyrrolidone) was added to the sample and homogenized with 5 mL of 50 mM K-P buffer containing 1 mM ascorbic acid (pH 7.8). From the sample, 2 mL was transferred to a microtube and centrifuged at 12,500× g and 4 °C for 20 min, and the supernatant was used as a crude enzyme extract for an enzyme activity assay.

2.10.2. CAT, APX, GR, and SOD Activities

Catalase (CAT), ascorbate peroxidase (APX), and glutathione reductase (GR) were measured according to Tanaka et al. [44]. Superoxide dismutase (SOD) was measured according to Tanaka and Sugahara [45].
For the CAT activity assay, 1 mL of assay mixture containing 100 mM K-P buffer (pH 7.8), 20 mM H2O2, and 2% (v v−1) crude enzyme extract was measured in the specific absorbance of H2O2 (230 nm) using a spectrophotometer. The amount of H2O2 scavenged by CAT per minute (mmol min−1) was calculated from the decline in absorbance and the extinction coefficient of 0.04 mM−1 cm−1.
For APX activity, 1 mL of an assay mixture containing 100 mM K-P buffer, 0.5 mM L-ascorbic acid, and 2% (v v−1) crude enzyme extract was measured for the specific absorbance of L-ascorbic acid (290 nm) using a spectrophotometer. The amount of L-ascorbic acid oxidized per minute (mmol min−1) was calculated from the decline in absorbance and the extinction coefficient of 2.8 mM−1 cm−1.
For GR activity, 1 mL of assay mixture containing 50 mM K-P buffer, 0.1 mM EDTA, 0.02 mM reduced NADPH, 0.02 mM oxidized glutathione, and 5% (v v−1) crude enzyme extract was measured for the specific absorbance of NADPH (340 nm) using a spectrophotometer. The amount of NADPH oxidation per minute (mmol min−1) was calculated from the decline in absorbance and the extinction coefficient of 6.2 mM−1 cm−1.
For SOD activity, 1 mL of the crude enzyme extract was placed in a dialysis membrane and dialyzed in 10 mM K-P buffer for 12 h at 4 °C. The K-P buffer was replaced every 3 h. Then, 1 mL of assay mixture containing 50 mM K-P buffer, 0.1 mM EDTA, 0.1 mM xanthine, 10 µM cytochrome c, 5% (v v−1) of the dialyzed crude enzyme extract, and 1.6 × 10⁻² U xanthine oxidase were measured in specific absorbance of reduced cytochrome c (550 nm) using a spectrophotometer. Distilled water was added as a control instead of the crude enzyme extract. The increase in absorbance of the control was defined as v, 1 unit was defined as v/V = 0.05, and 1 unit of SOD activity was calculated as V/v–1. Furthermore, the SOD activity value in 1 mL (Unit min−1) was converted using the required amount of crude enzyme extract at that time.

2.10.3. Protein Assay

The protein content of the dialyzed crude enzyme extracts was measured using the method described by Bradford [46]. Bovine serum albumin was used as a standard sample for the calibration curve, and the activity of each enzyme was expressed as enzyme activity per protein, taking into account the total protein content.

2.11. Statistical Analysis

Statistical analyses were performed using the GraphPad Prism 10 software program (GraphPad Software version 10.4.1, Inc., La Jolla, CA, USA). Data are presented as means ± standard error. One-way analysis of variance was used to assess significant differences (p < 0.05) among treatments, followed by Tukey’s honestly significant differences (HSD) test. Principal component analysis (PCA) and hierarchical cluster analysis were performed to establish the relationships between leaf traits and identify clusters across different rooting mediums.

3. Results

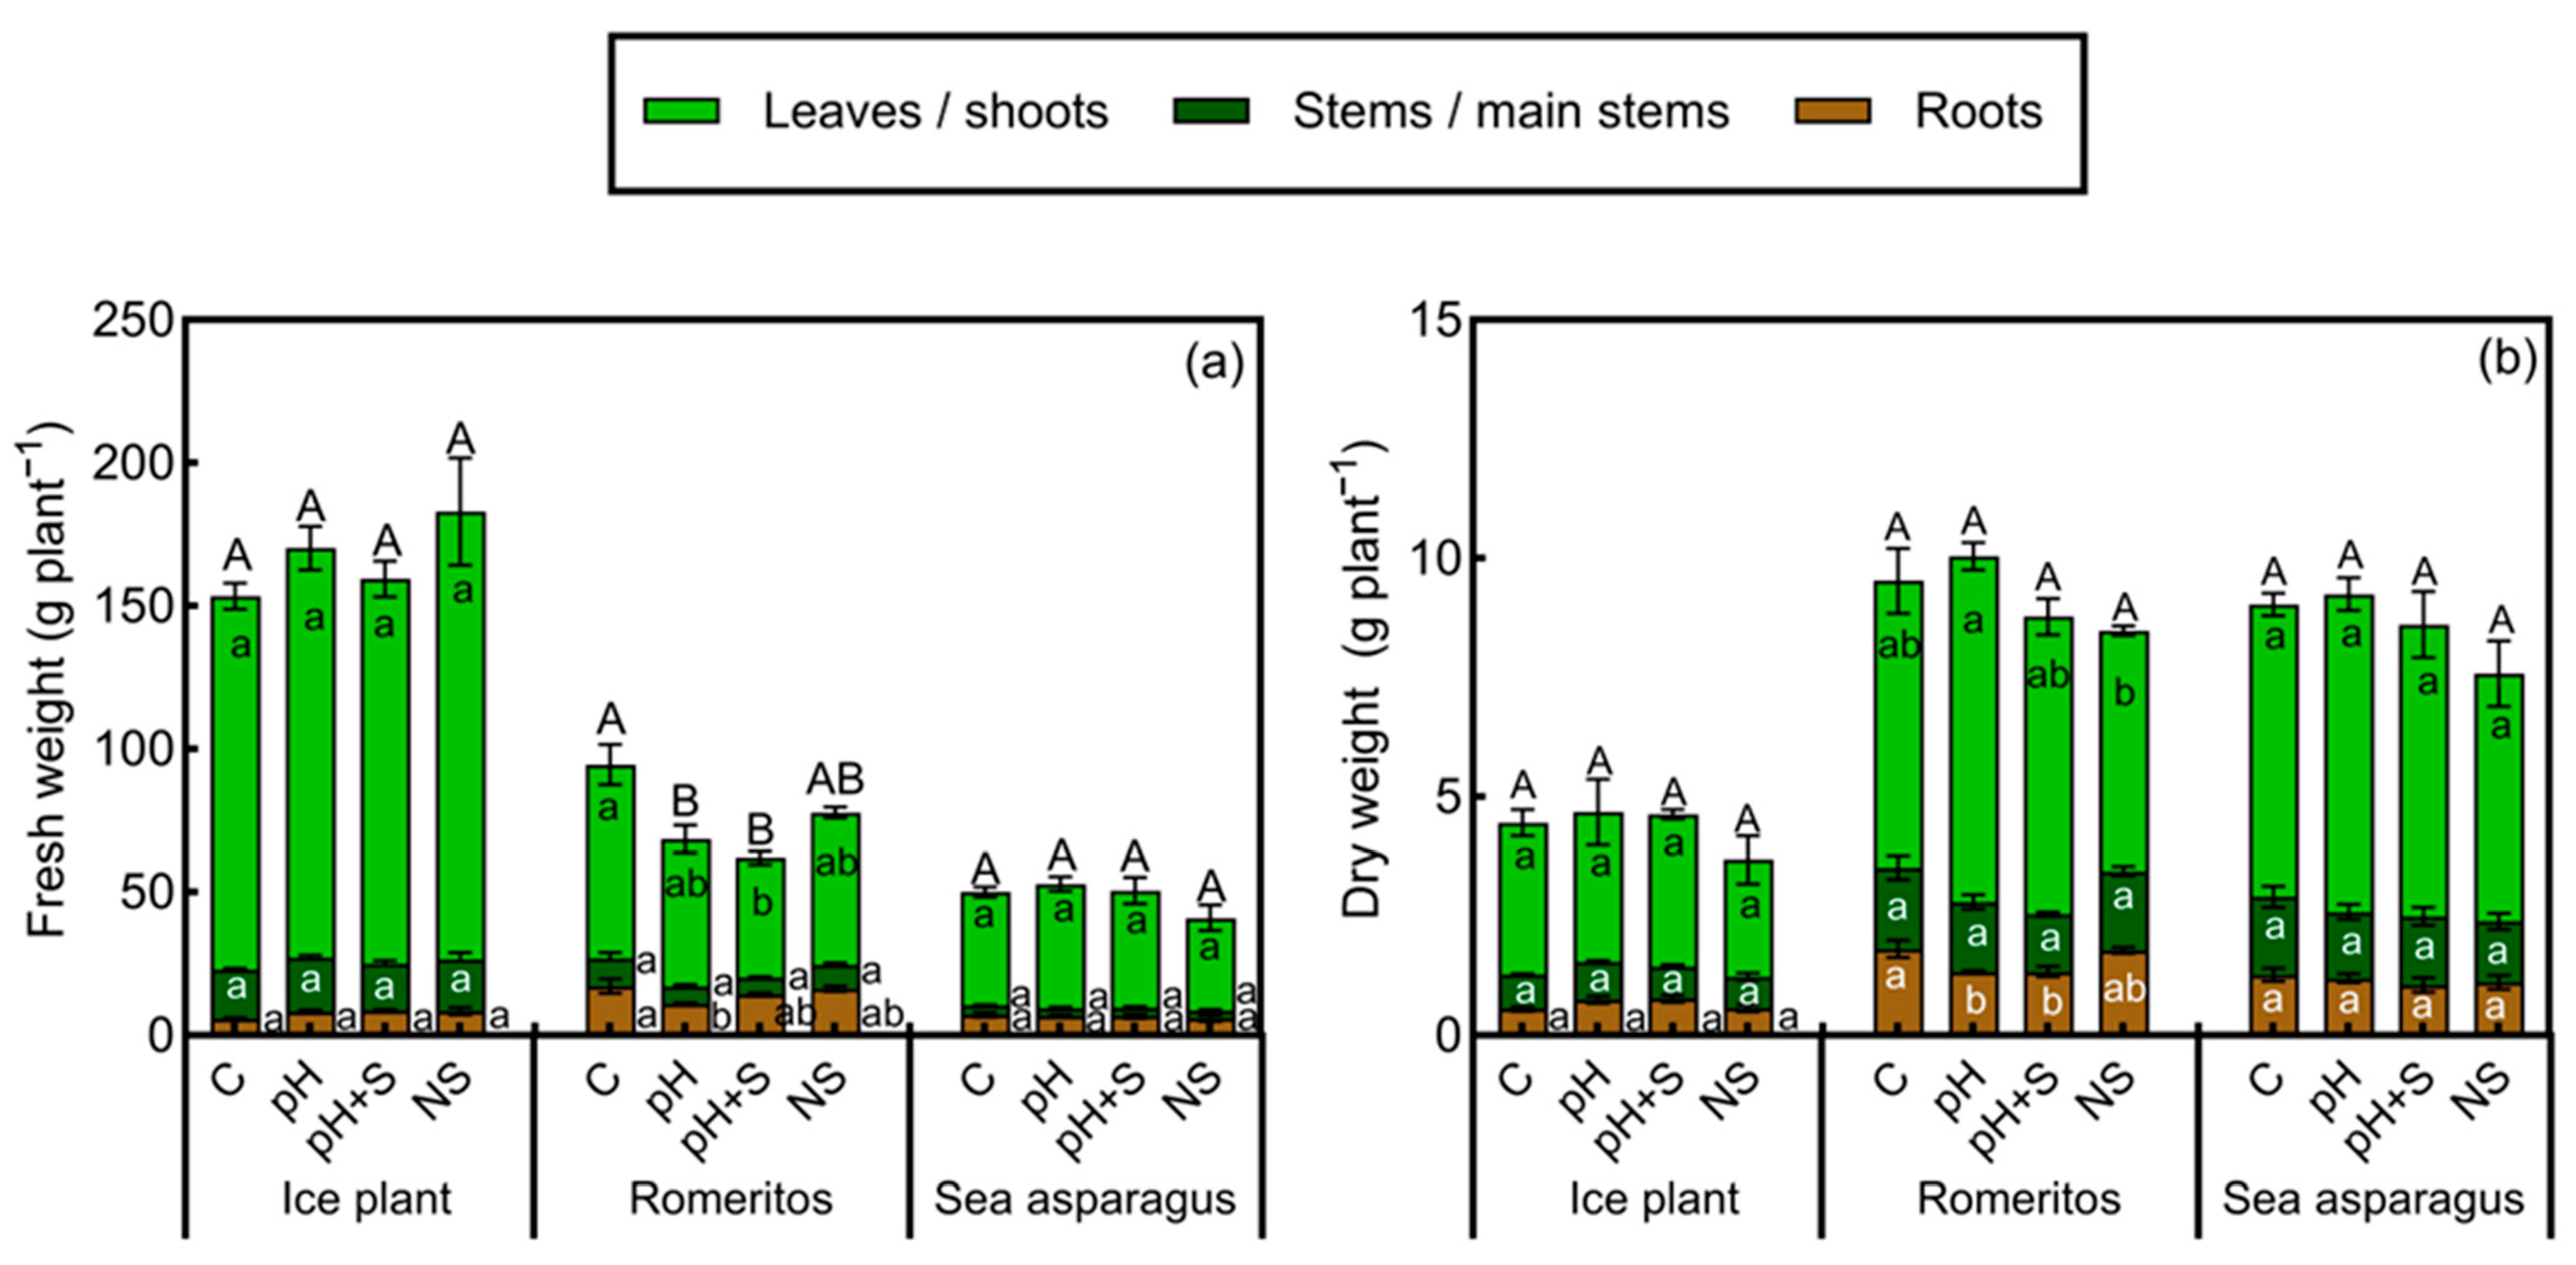
3.1. Growth Parameters

Romeritos exhibited significant differences in fresh weight (FW) and dry weight (DW) of leaves and roots among treatments, with the control (C) showing the highest FW accumulation in both organs and total biomass production (Figure 1a). During the experiment, plants in the pH and pH+S treatments experienced significant water loss, as evidenced by wilting symptoms (Figure S1); however, no chlorosis or dryness was observed. This water deficit effect was reflected in the lower FW recorded in these treatments (Figure 1a), as well as reduced leaf area (LA) and water content (WC) (Table 2). Additionally, transpiration rates in romeritos declined significantly in the final week of cultivation under pH and pH+S (Figure 2b). Specific leaf area was lowest in treatments utilizing rearing water (C, pH, and pH+S), while succulence (S) was highest in C and lowest in NS, with no significant differences between pH and pH+S (Table 2). The shoot/root ratio was highest in pH, followed by pH+S (Table 2). Regarding DW, a more significant leaf biomass accumulation was observed in treatments using rearing water, while in roots, the highest biomass was observed in C (Figure 1b).
In contrast, ice plant and sea asparagus did not exhibit significant differences in the evaluated growth parameters. Only a few significant differences were detected in weekly transpiration rates. Ice plant showed no clear trend in transpiration among treatments throughout the cultivation period (Figure 2a), whereas, in romeritos and sea asparagus, the NS treatment exhibited the highest transpiration rates over time (Figure 2b,c).

3.2. Cation and Anion Content in Leaves or Shoots

Ion accumulation varied significantly across treatments in ice plant. Sodium ( N a + ) and chloride ( C l ) were higher in rearing water treatments (C, pH, pH+S), while potassium ( K + ) was highest in NS (Table 3 and Table 4). Magnesium ( M g 2 + ) followed a similar pattern to N a + and C l (Table 3). Ammonium ( N H 4 + ) was undetectable except in NS (Table 3). Nitrate ( N O 3 ) was higher in rearing water treatments, whereas nitrite (( N O 2 ) peaked in pH. Oxalate ( C 2 H 2 O 4 2 ) was highest in NS, while sulfate ( S O 4 2 ) and phosphate ( P O 4 3 ) showed no significant differences (Table 4).
In romeritos, N a + and C l were highest in pH and pH+S, with the lowest levels in NS (Table 3 and Table 4). Potassium accumulated most in pH+S and NS, while N H 4 + was present in all treatments except C, peaking in pH+S (Table 3). Nitrate was higher in C, pH, and pH+S, while P O 4 3 was highest in pH+S, followed by NS (Table 4). Oxalate levels were highest in C, whereas pH and pH+S had the lowest values (Table 4). Sulfate and N O 2 showed no significant differences (Table 4).
Sea asparagus exhibited similar trends. Sodium and C l were highest in rearing water treatments and lowest in NS, where K + was also most abundant (Table 3 and Table 4). Ammonium peaked in NS and was undetectable in C (Table 3). Phosphate was highest in NS, while sulfate increased in pH-adjusted treatments (pH, pH+S, NS) (Table 4). Oxalate levels remained unchanged across treatments (Table 4).

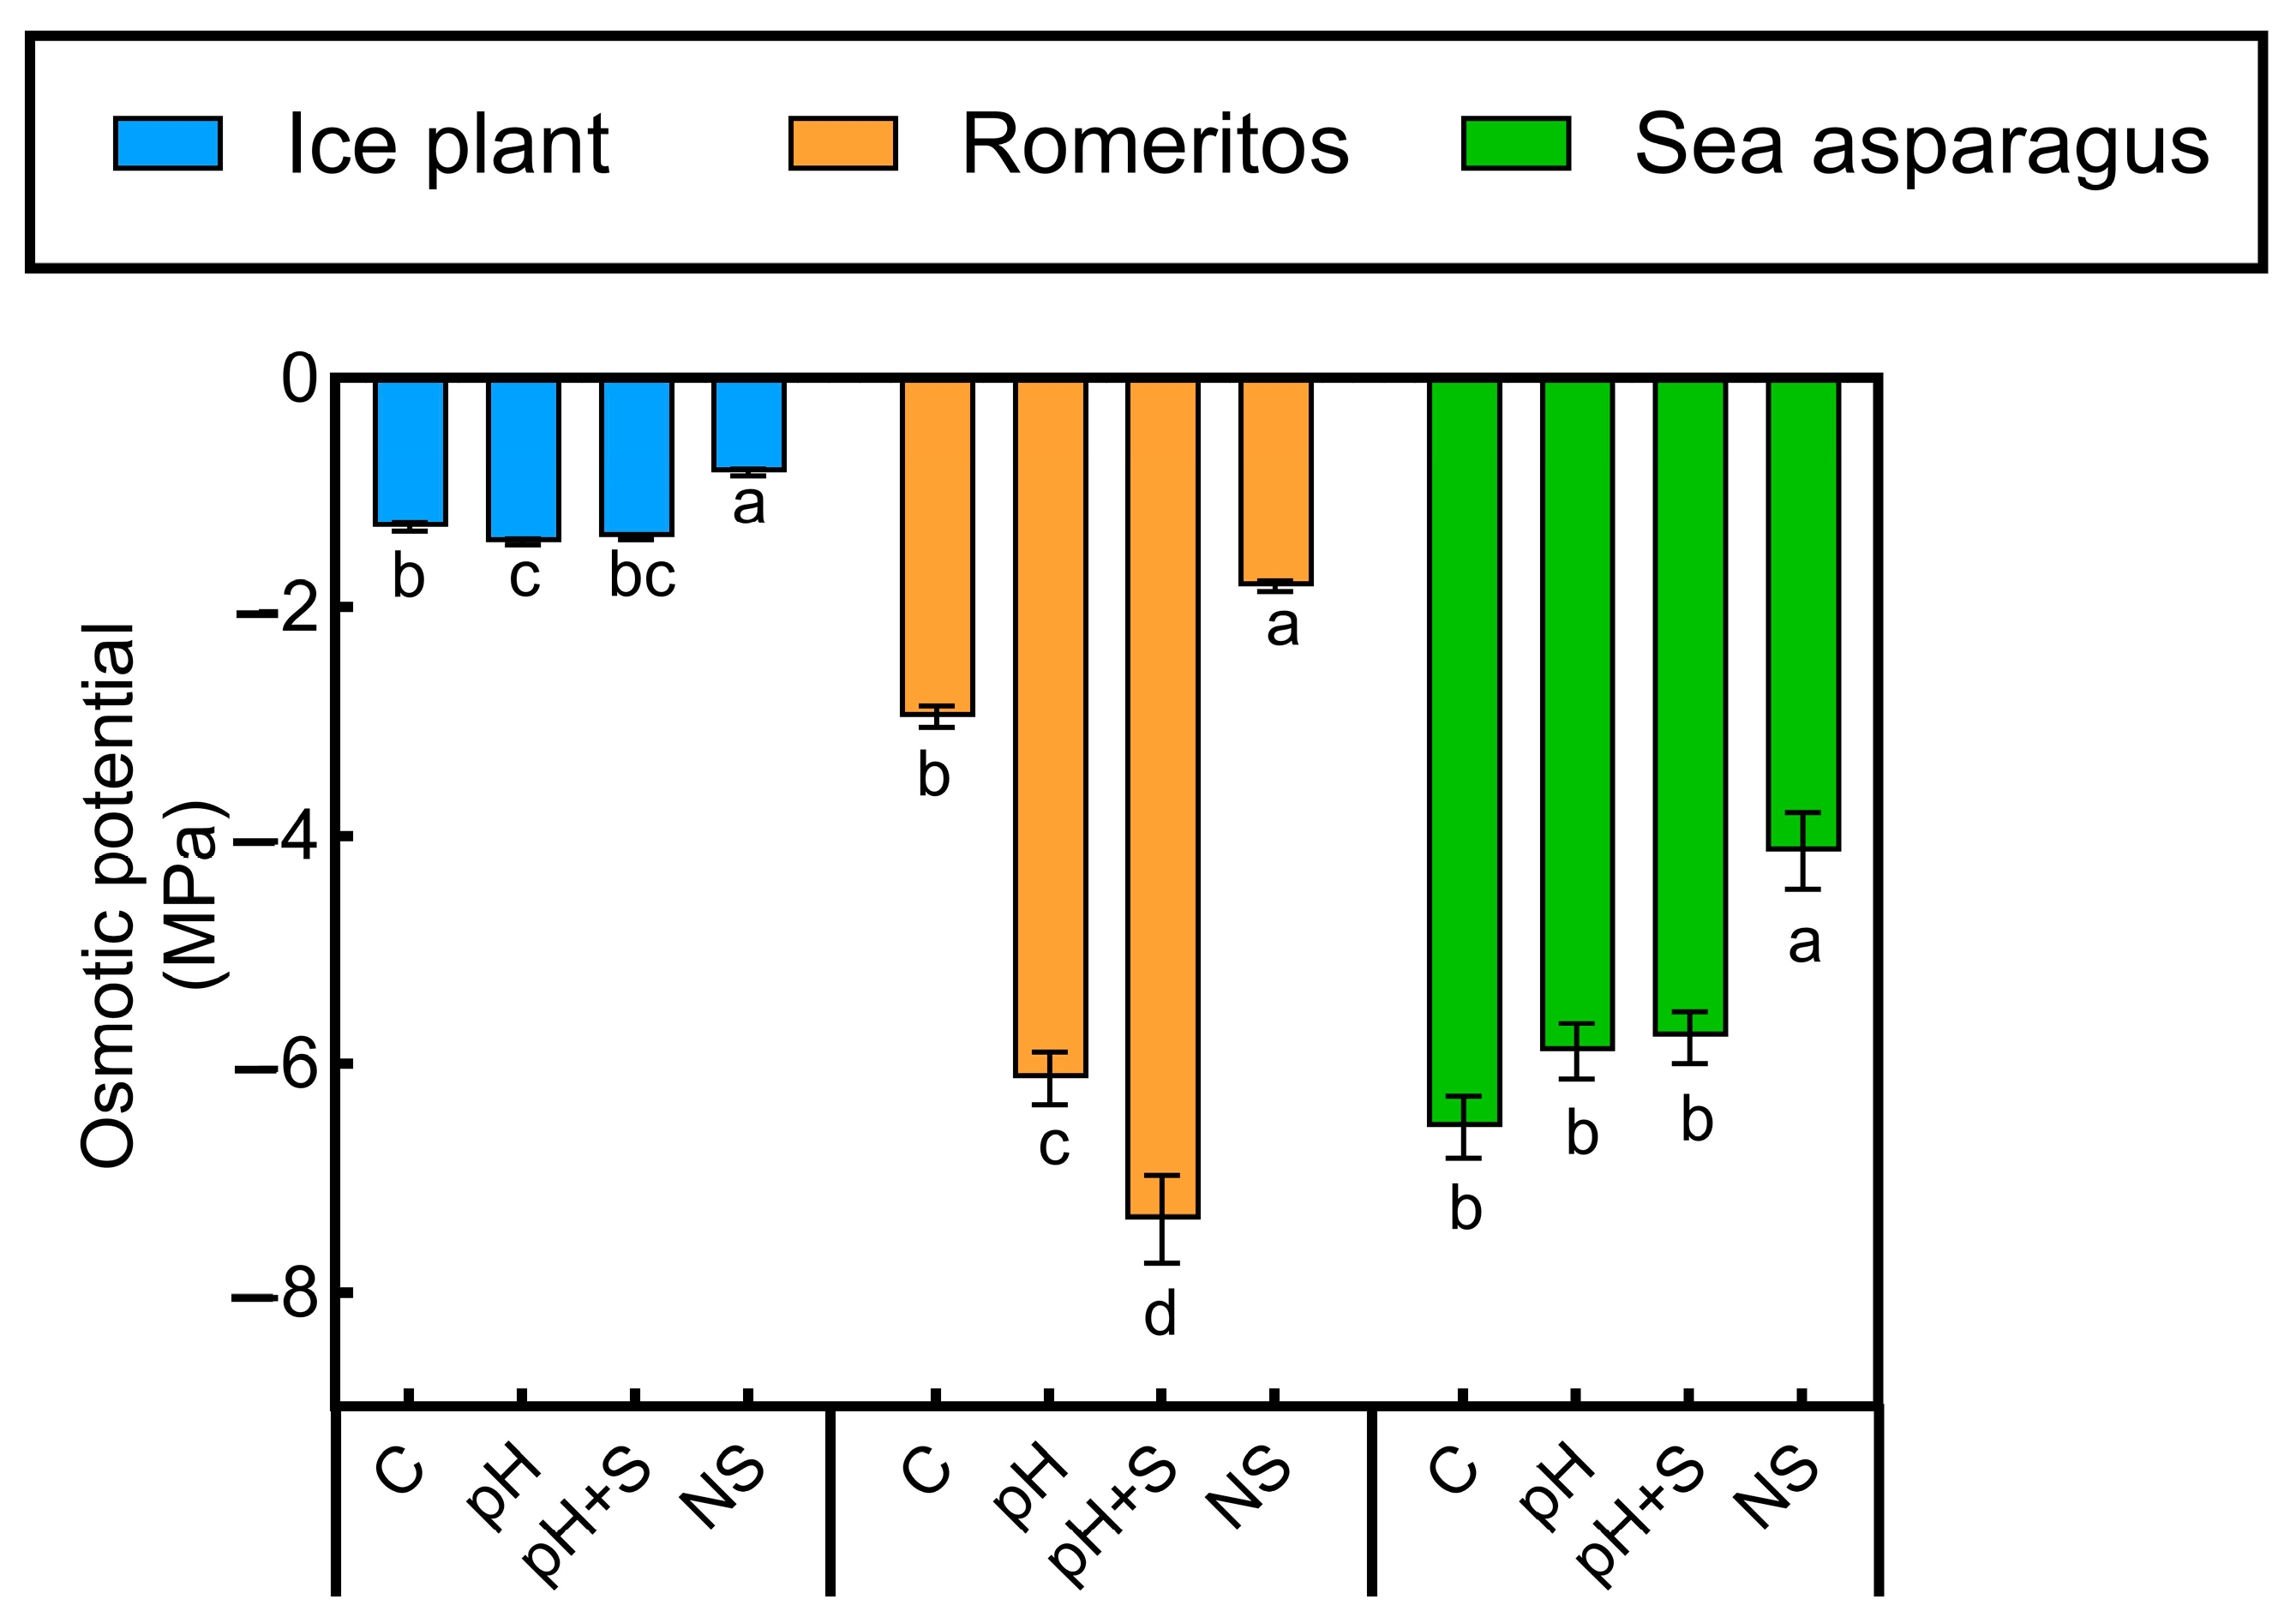
3.3. Osmotic Potential Response

Osmotic potential (Ψs) varied significantly across treatments in all species. Ice plant had the highest Ψs, with NS showing significantly higher values than rearing water treatments (C, pH, pH+S), which had minor variations. In romeritos, Ψs was lowest in pH and pH+S, coinciding with visible wilting. Sea asparagus also showed lower Ψs in rearing water treatments compared to NS, with no major differences among C, pH, and pH+S (Figure 3). Cation and anion contributions to Ψs varied by species and treatment (Figure 4). In all species, N a + , K + , and C l were the dominant contributors, while M g 2 + , N O 3 , P O 4 3 , S O 4 2 , and C 2 H 2 O 4 2 showed species-specific trends. In ice plant, N a + contribution was highest in rearing water treatments, lowest in NS (24.33%), while K + showed the opposite pattern, peaking in NS (11.69%). C l was highest in pH (37.58%) and lowest in NS (17.78%). P O 4 3 and C 2 H 2 O 4 2 were highest in NS, while M g 2 + , N O 3 , and S O 4 2 showed no significant variation. In romeritos N a + was highest in pH (36.94%) and lowest in NS (21.04%). C l remained stable across treatments. K + and M g 2 + were highest in NS. Nitrate and N O 2 , peaked in C, while P O 4 3 and S O 4 2 were highest in NS. Oxalate contributed most to C and NS but was minimal in pH and pH+S. For sea asparagus N a + and C l contributions remained stable. Ammonium, K + , M g 2 + , N O 3 , P O 4 3 , and C 2 H 2 O 4 2 were highest in NS. Sulfate peaked in pH and NS. In all species, total ion contributions did not reach 100%, indicating the presence of other osmolytes, such as soluble sugars and organic acids, influencing Ψs (Figure 4).

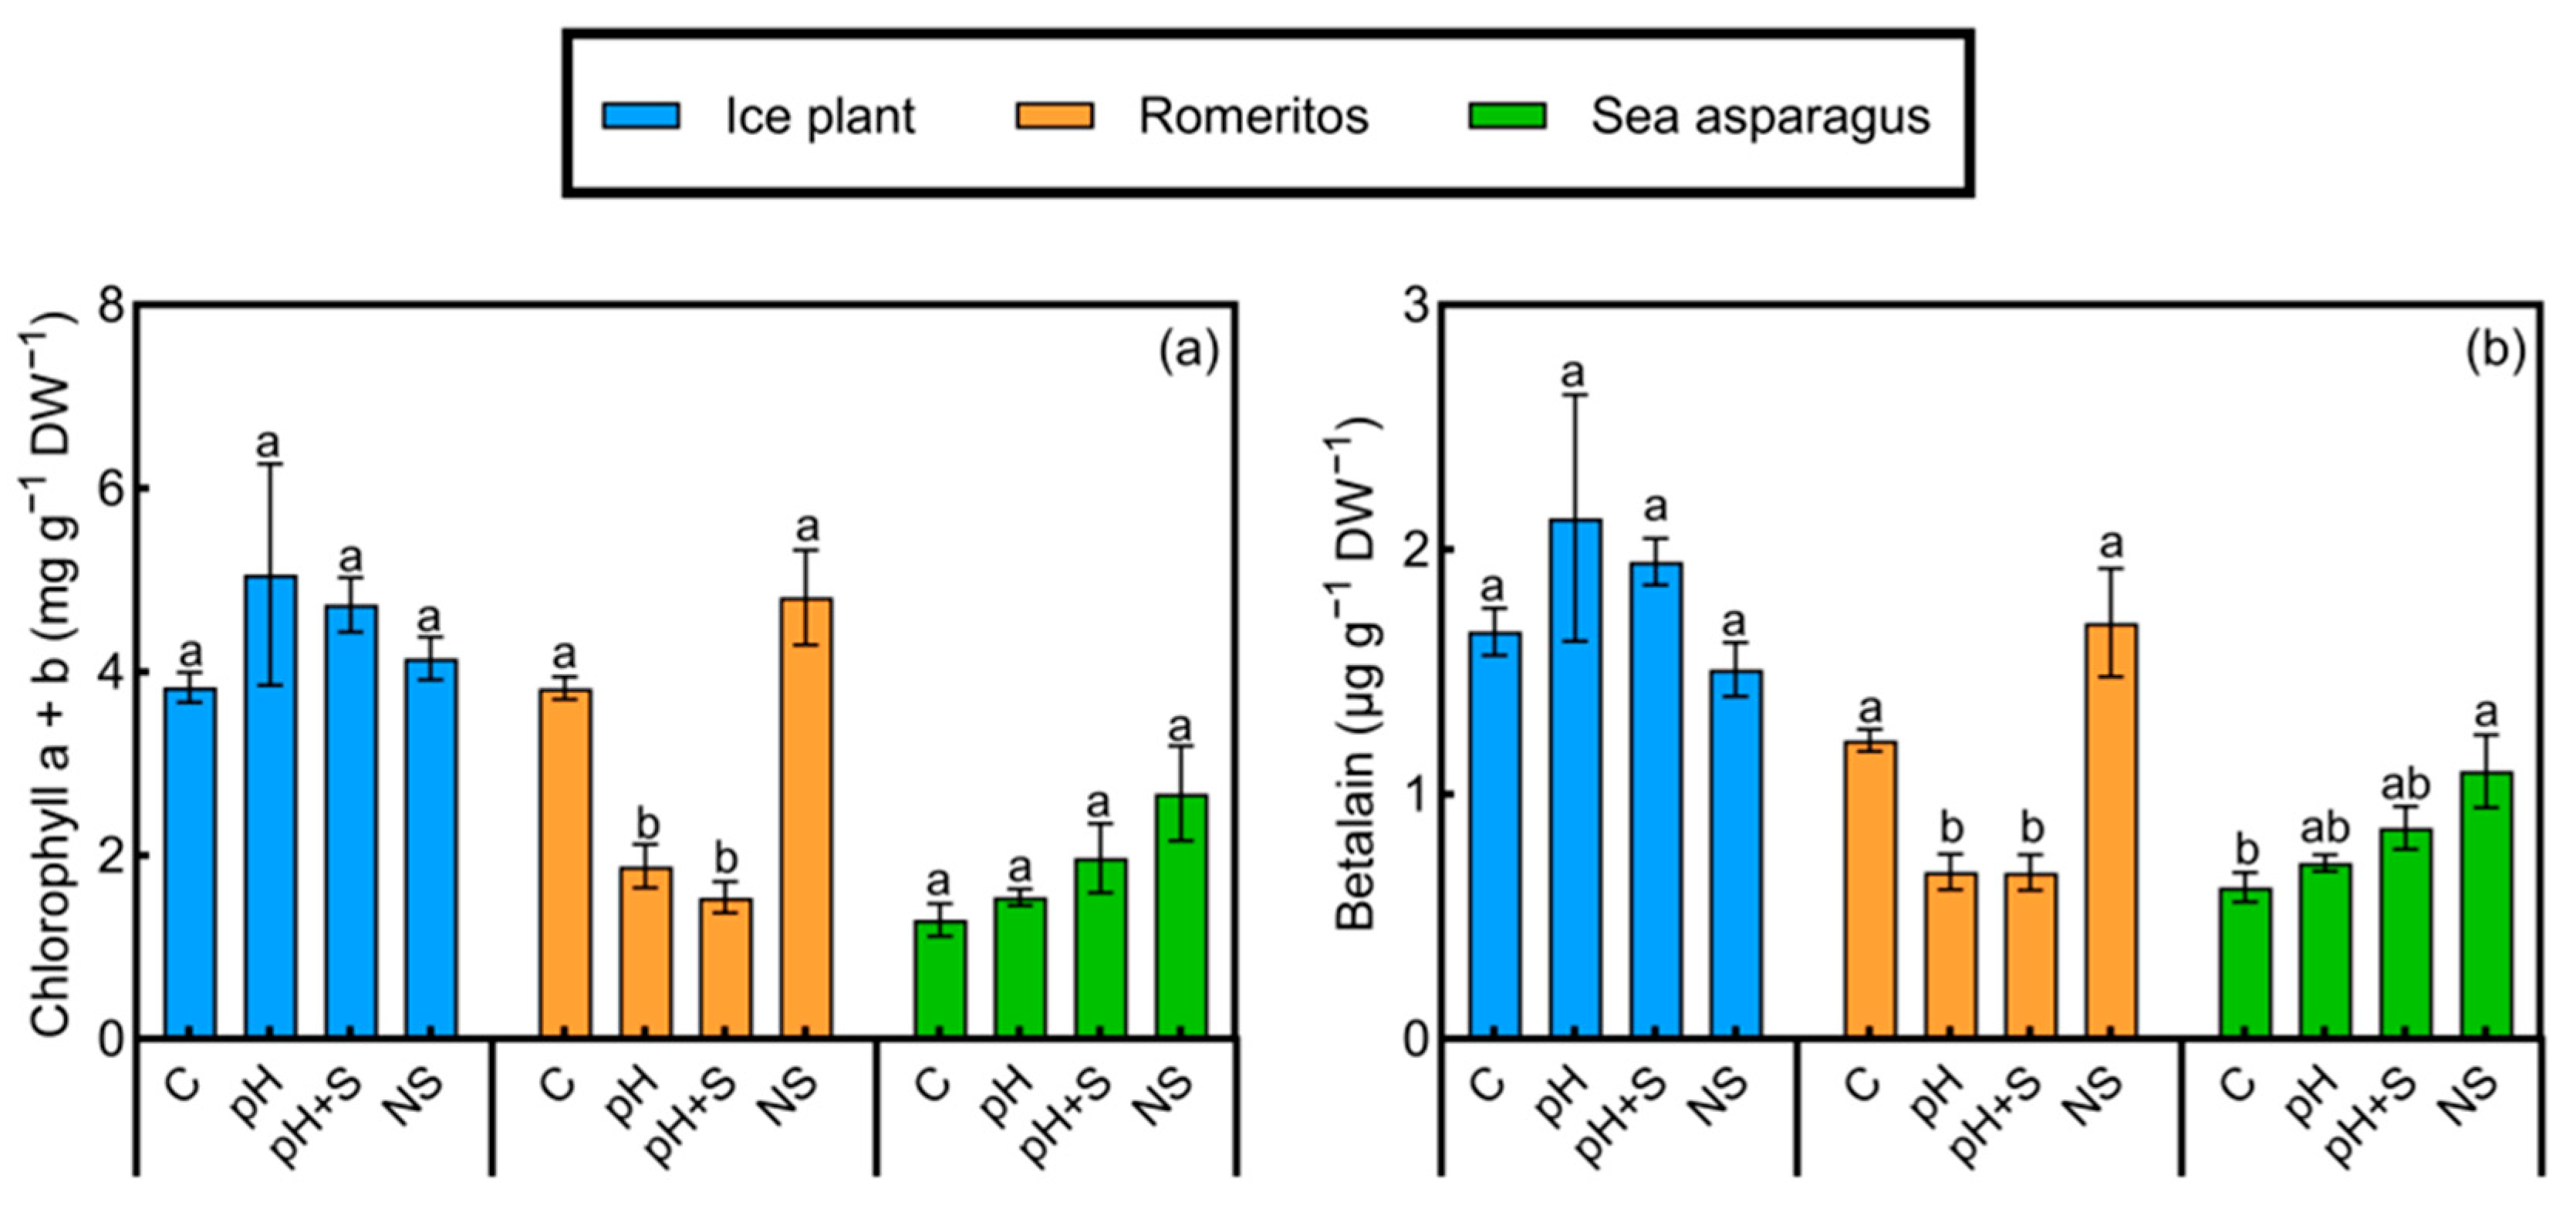
3.4. Pigment Response

Chlorophyll a + b content did not show significant differences among treatments in ice plant and sea asparagus (Figure 5a). In contrast, romeritos exhibited significant variations, with the highest chlorophyll levels observed in C and NS treatments (Figure 5a). For betalain content, no significant differences were found among treatments in ice plant (Figure 5b). However, significant differences were observed in romeritos and sea asparagus. Romeritos displayed a pattern similar to that of chlorophyll content, with the highest betalain levels in the C and NS treatments. In sea asparagus, NS treatment resulted in the highest betalain content, while the lowest value was recorded under the C treatment, with no significant differences between pH and pH+S (Figure 5b).

3.5. Malondialdehyde and Hydrogen Peroxide Levels

Malondialdehyde (MDA) content did not exhibit significant differences among treatments in ice plant. However, in romeritos and sea asparagus, MDA concentrations were significantly higher in the NS treatment, while no differences were observed among treatments exposed to rearing water (C, pH, and pH+S) (Figure 6a).
Hydrogen peroxide (H2O2) levels varied significantly among treatments in ice plants and romeritos but not in sea asparagus. In ice plant, the highest H2O2 concentration was observed in the NS treatment, while the lowest was in pH+S. Similarly, romeritos exhibited the highest H2O2 levels in NS and the lowest in pH (Figure 6b).

3.6. Antioxidant Enzyme Responses

In ice plant, significant differences were observed in ascorbate peroxidase (APX), superoxide dismutase (SOD), and glutathione reductase (GR), while catalase (CAT) activity remained relatively stable across treatments. Ascorbate peroxidase activity was higher in pH+S and significantly lower in NS. The highest value of SOD was observed in C and the lowest in pH+S. The activity of GR was significantly reduced in NS compared to C (Table 5).
For romeritos, all enzymes showed significant differences among treatments. Catalase activity decreased under NS compared to C. The activity of APX was higher in pH and pH+S and lower in NS. The response of SOD followed a similar trend, being highest in pH and pH+S while significantly lower in NS. Glutathione reductase activity was significantly reduced in pH and NS compared to the control (Table 5).
Sea asparagus showed significant differences among treatments only in SOD, with the highest activity in C and the lowest in NS (Table 5).

3.7. Overall Effects

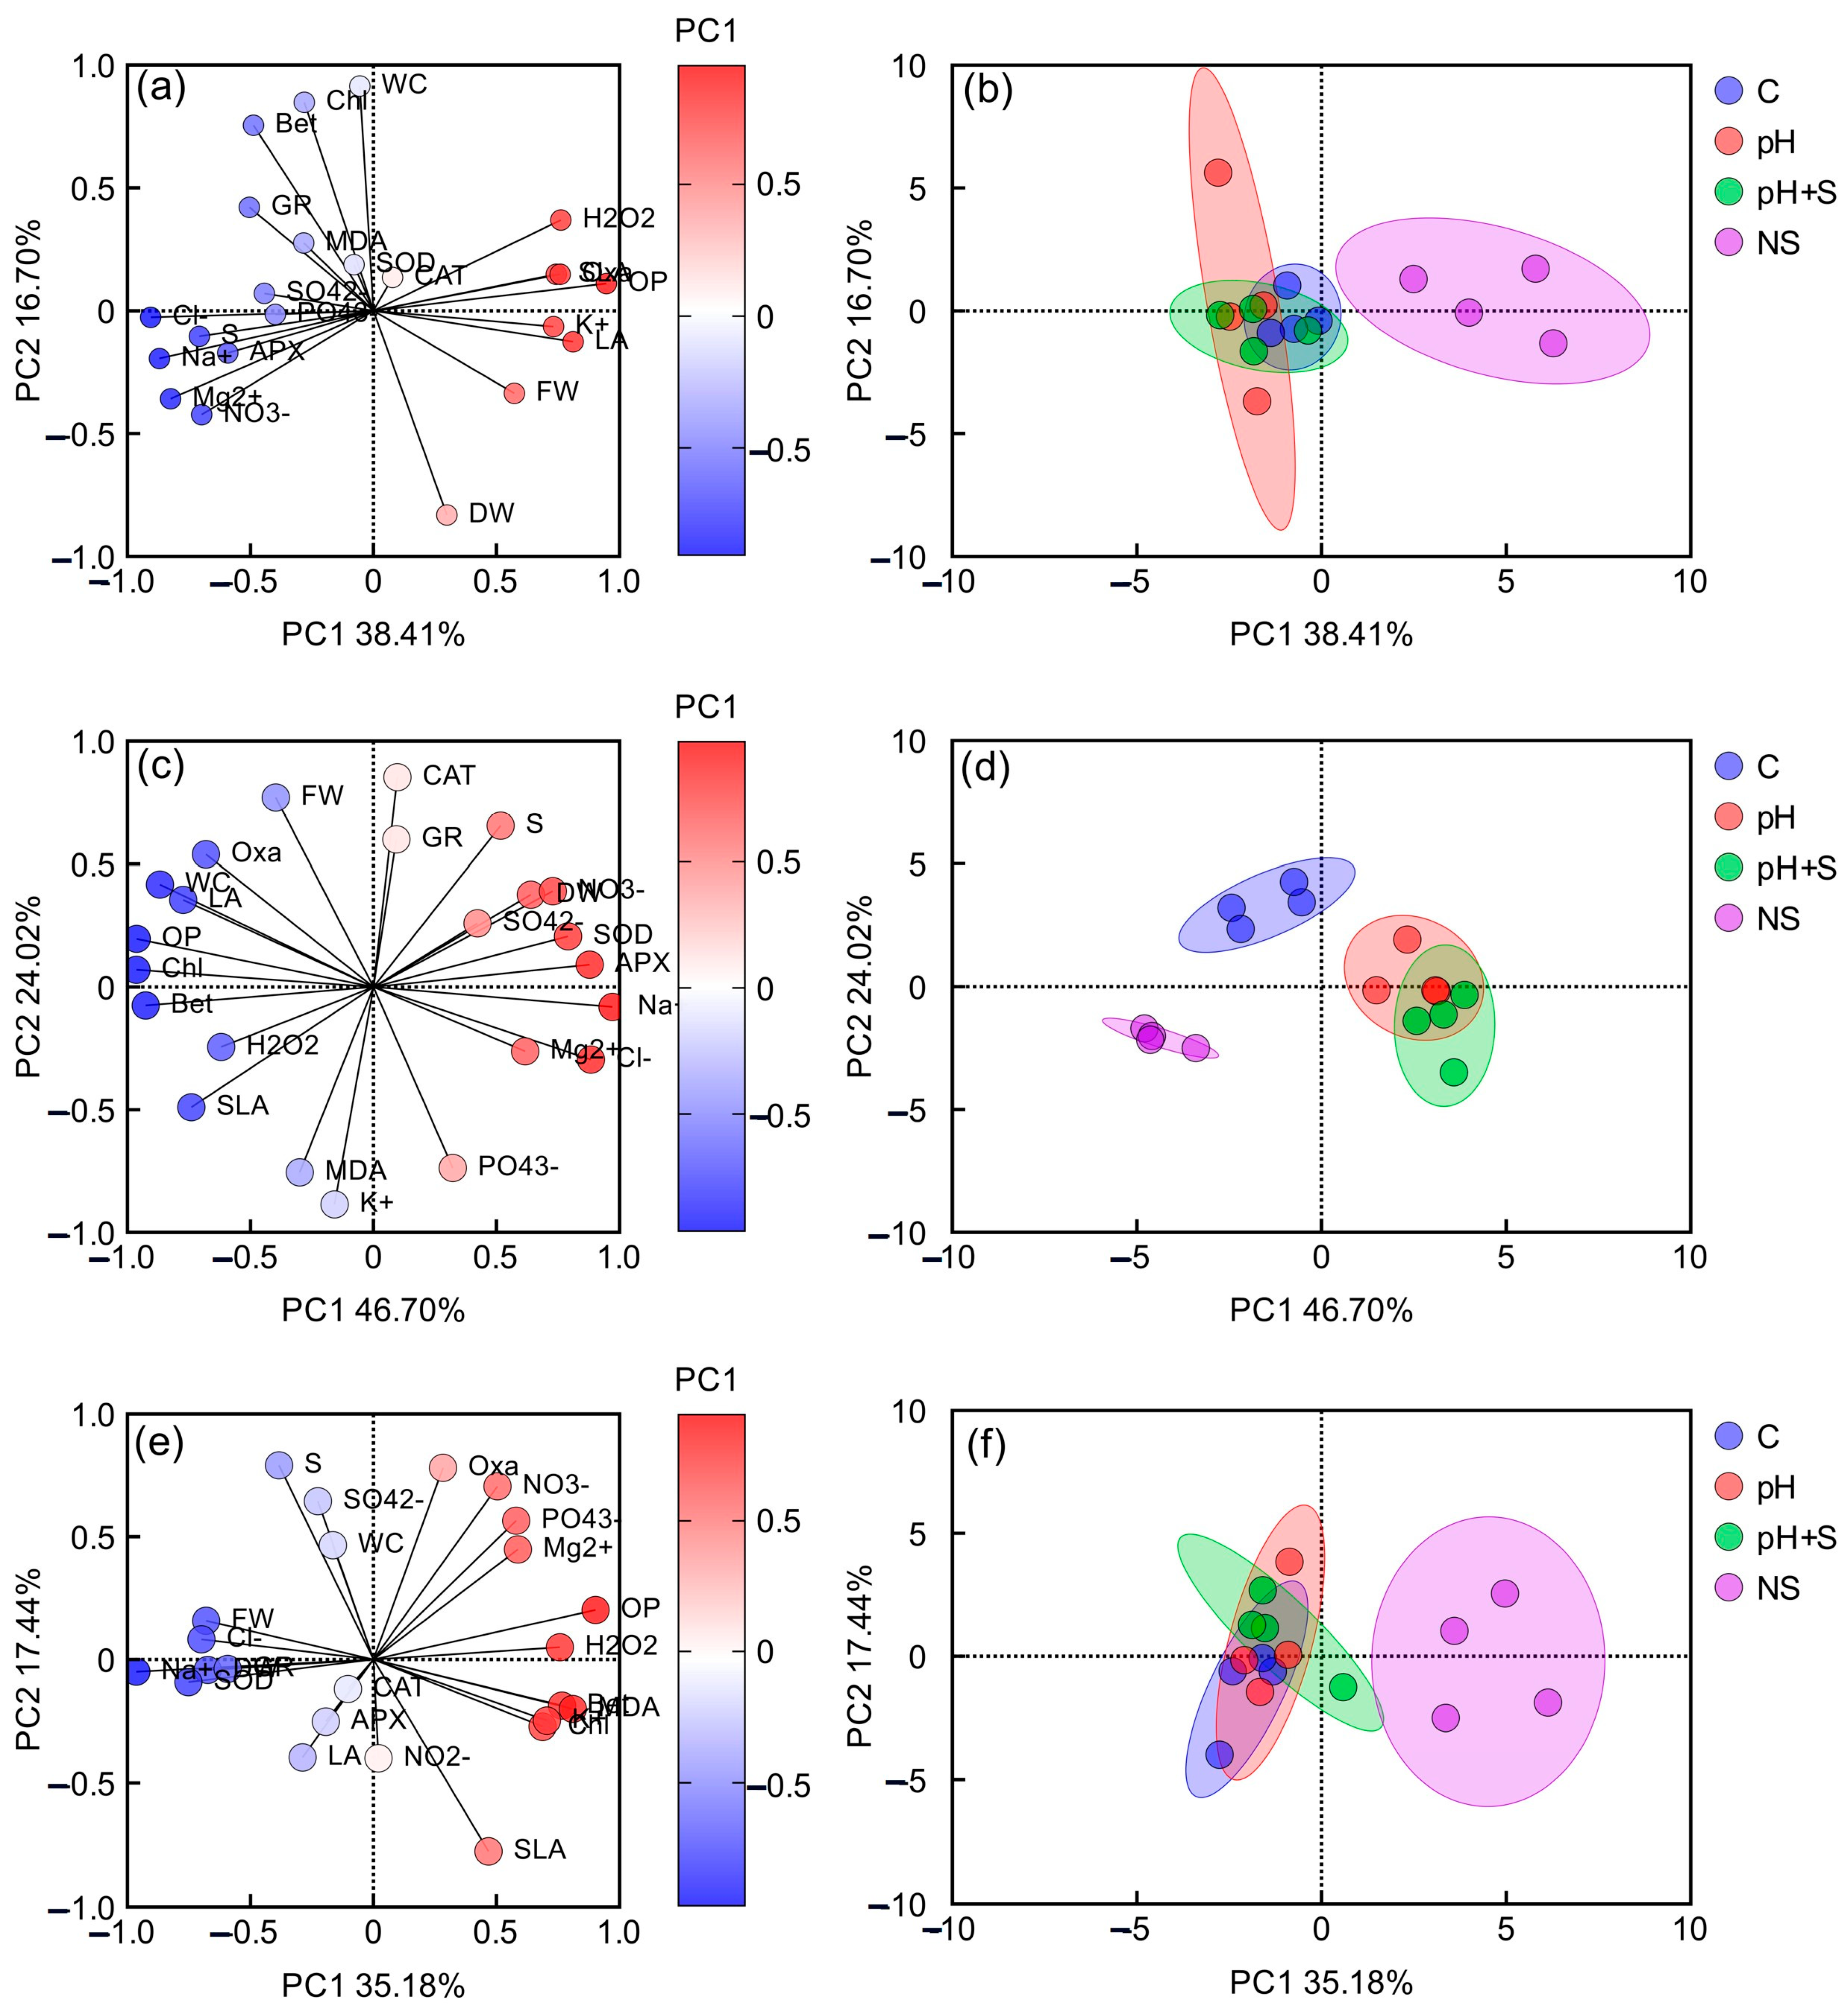
3.7.1. Principal Component Analysis

Principal component analysis (PCA) was conducted separately for each species (Figure 7).
In ice plant, the first two principal components (PCs) explained 56.11% of the total variation (PC1: 38.41%, PC2: 16.70%). The NS treatment was distinct from rearing water treatments (C, pH, pH+S). PC1 was positively correlated with K + , C 2 H 2 O 4 2 , FW, LA, SLA, OP, and H2O2 (aligned with NS cluster) and negatively correlated with N a + , C l , M g 2 + , N O 3 , S, and APX (aligned with rearing water treatments). PC2 separated variables like chlorophyll (Chl), betalain (Bet), and WC from DW (Figure 7a,b). Malondialdehyde, SOD, S O 4 2 , P O 4 3 , GR, and CAT were positioned near the center of the biplot, indicating their minimal contribution to the variation explained by the first two PCs (Figure 7a)
In romeritos, PCs explained 70.72% of variation (PC1: 46.70%, PC2: 24.02%). Treatments pH and pH+S clustered positively with N O 3 , N a + , C l , M g 2 + , DW, SOD, and APX, while C and NS clustered negatively with C 2 H 2 O 4 2 , WC, LA, SLA, Chl, Bet, OP, and H2O2. PC2 separated P O 4 3 , MDA, and K + from CAT, GR, S, and FW (Figure 7c,d).
For sea asparagus, PCs explained 52.62% of variation (PC1: 35.18%, PC2: 17.44%). NS clustered with P O 4 3 , M g 2 + , K + , OP, H2O2, MDA, Chl, and Bet, while rearing water treatments aligned with FW, DW, C l , N a + , SOD, and GR. Moreover, S, WC, S O 4 2 , N O 3 , and C 2 H 2 O 4 2 were positively correlated with PC2, whereas SLA exhibited a negative correlation with PC2. Similar to some variables of ice plant, CAT, APX, LA, and N O 2 were positioned near the center of the biplot, indicating a minimal contribution to the first two PCs (Figure 7e,f).

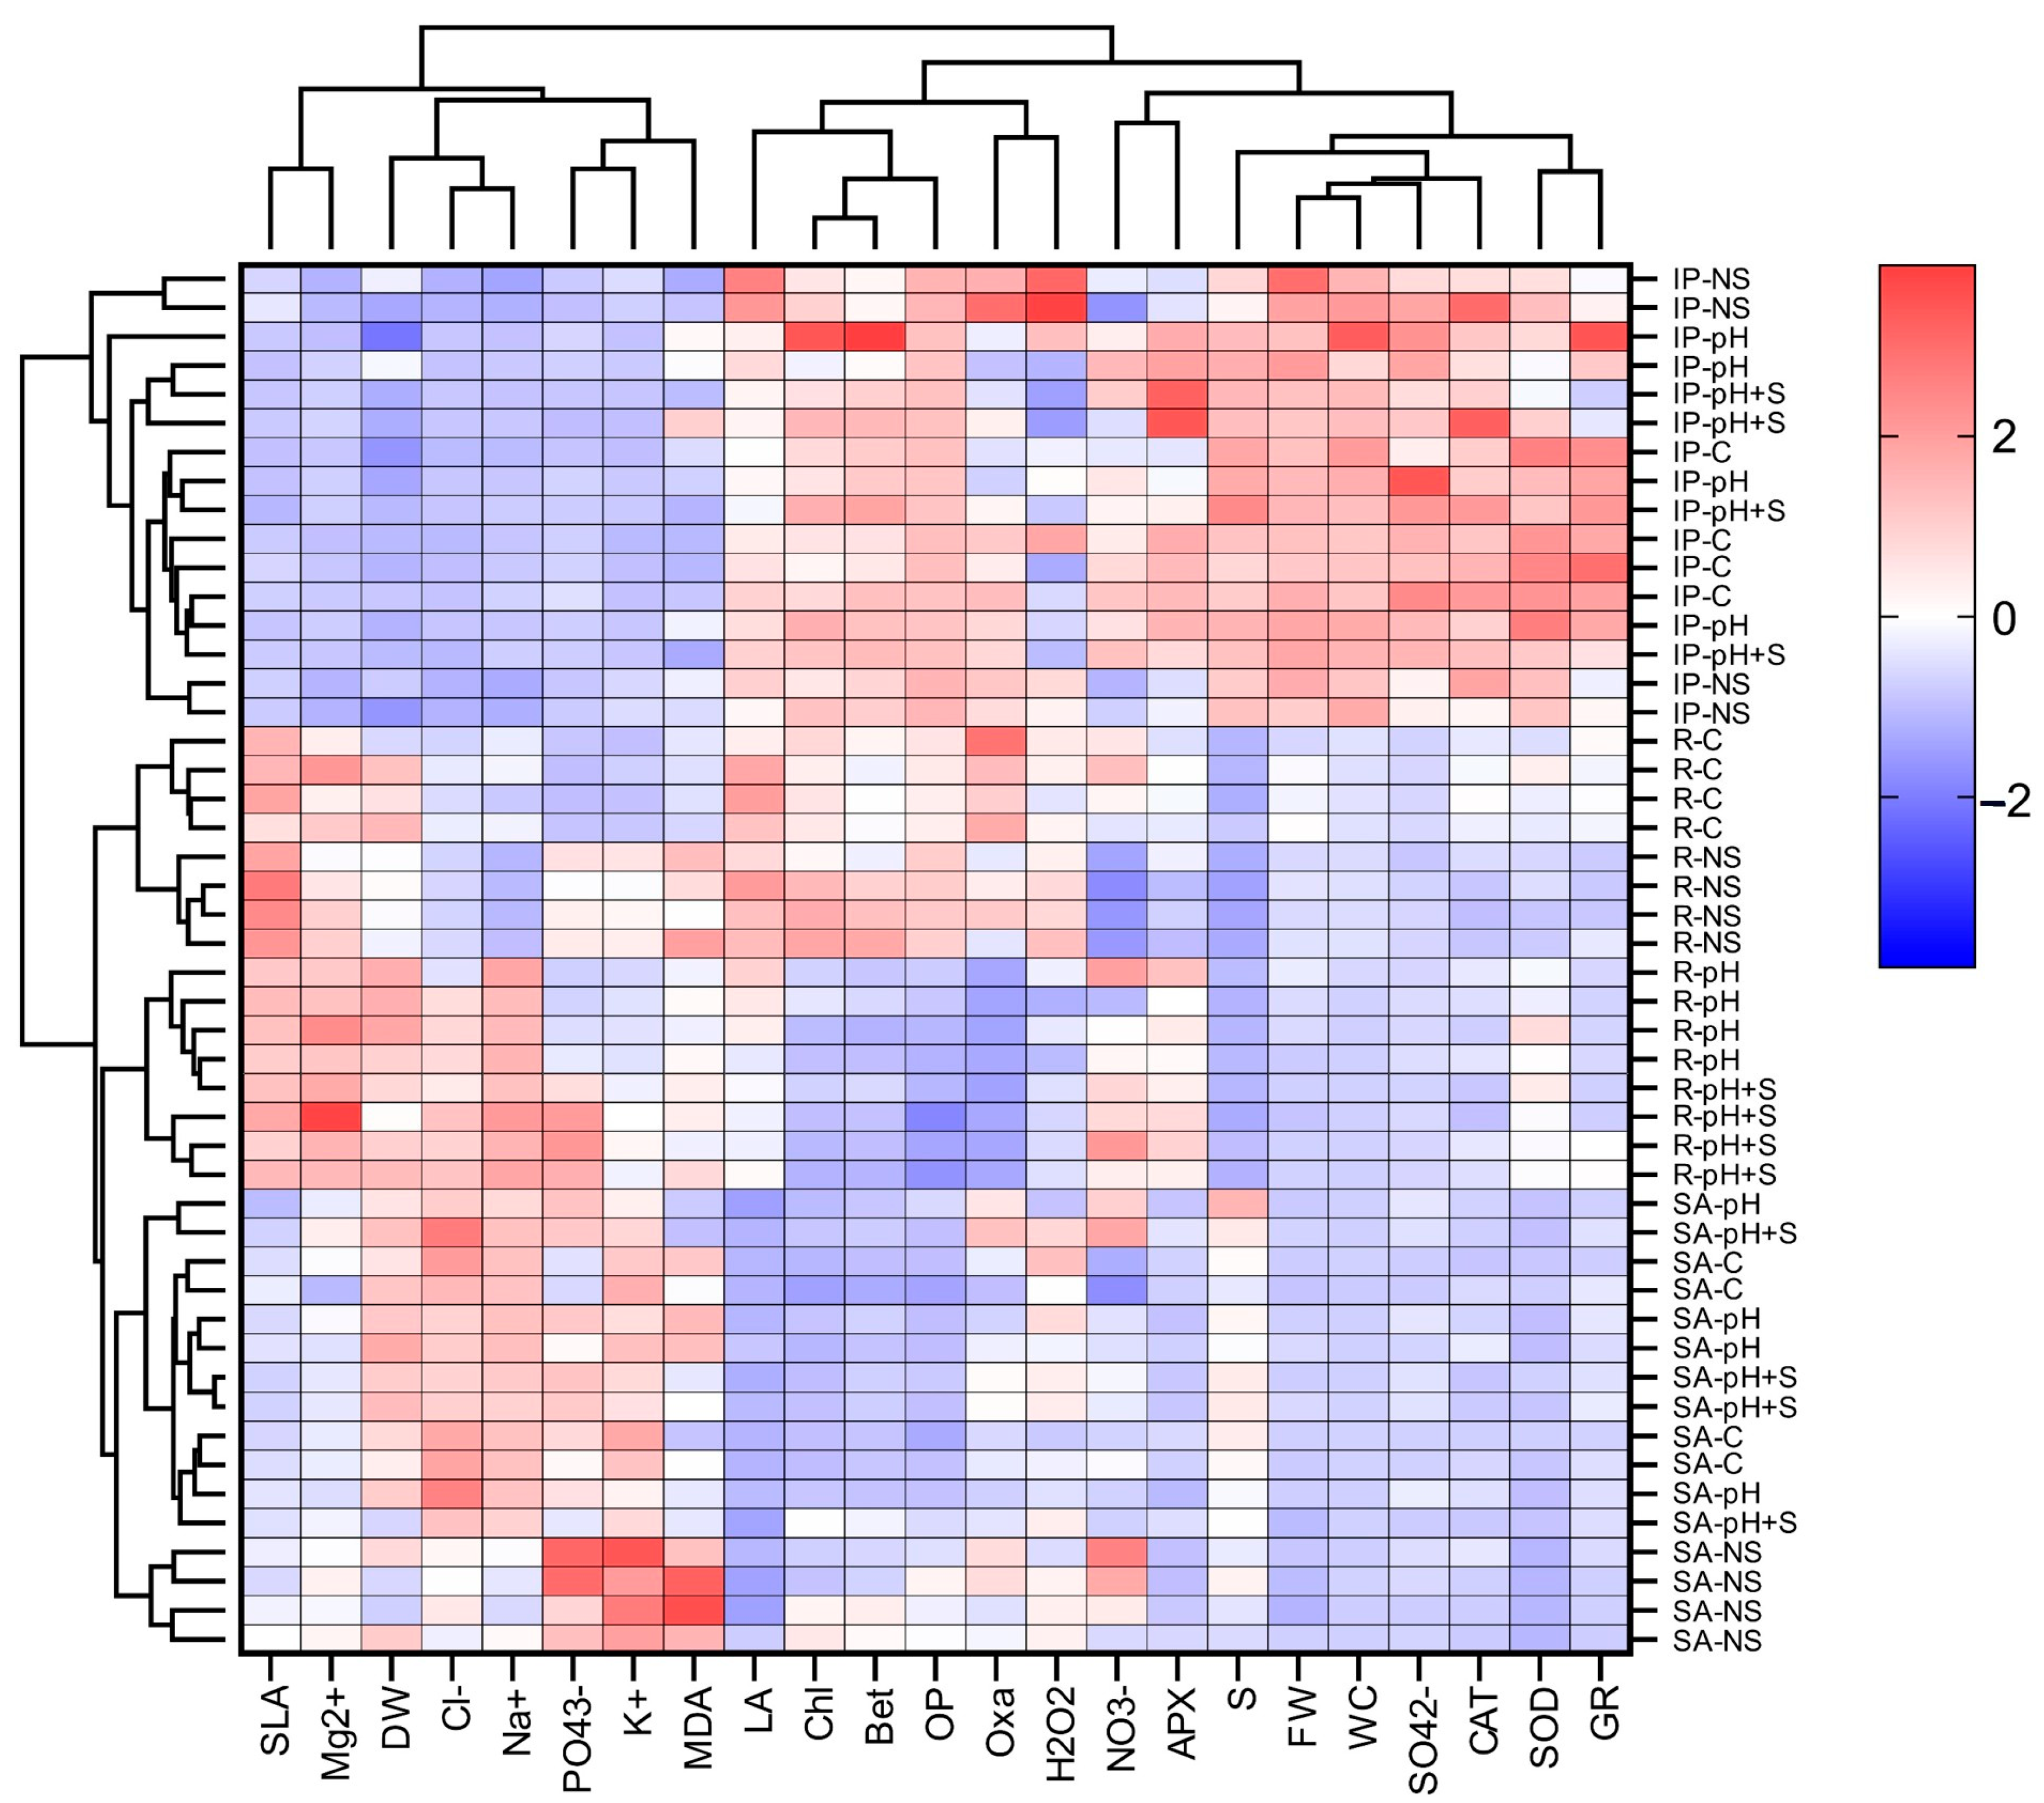
3.7.2. Hierarchical Clustering

Hierarchical clustering analysis was conducted to identify patterns among variables, treatments, and species, with results visualized in a heatmap (Figure 8). The analysis revealed two primary species clusters: one corresponding to ice plant and the other grouping romeritos and sea asparagus. Treatment clustering varied by species. In ice plant, treatments did not form distinct clusters, suggesting a more uniform response across conditions. In romeritos, two clusters emerged: one grouping C and NS, and another combining pH and pH+S, indicating treatment-specific physiological differences. In sea asparagus, the NS treatment was separated from those under rearing water conditions (C, pH, and pH+S), reflecting a pronounced influence of salinity on its response. Clustering among variables revealed three distinct groups. The first cluster included SLA, M g 2 + , DW, C l , N a + , P O 4 3 , K + , and MDA, which were predominantly elevated in romeritos and sea asparagus, with variations across treatments. The second cluster comprised LA, Chl, Bet, OP, C 2 H 2 O 4 2 , and H2O2, which were highest in ice plant and in the C and NS treatments of romeritos. The third cluster included N O 3 , APX, S, FW, WC, S O 4 2 , CAT, SOD, and GR, which exhibited the highest values in ice plant. The heatmap (Figure 8) visually represents these clustering patterns, with red indicating higher concentrations and blue denoting lower concentrations, effectively summarizing species- and treatment-specific responses.

4. Discussion

4.1. Growth Parameters and Water Relations

Significant growth reduction in romeritos was observed under pH and pH+S treatments, characterized by decreased fresh biomass, water content, and leaf area, accompanied by visible wilting and reduced transpiration in the final week (Figure 1; Table 2). These results contrast with those of Rosales-Nieblas et al. [24], where pH-adjusted treatments enhanced yield, likely due to differences in the frequency of pH management. In hydroponics, nutrient availability is highly sensitive to pH fluctuations [47,48,49,50], and frequent adjustments can disrupt ion transport, thereby increasing the energy cost of regulation, which is already a significant metabolic burden [51]. The use of strong acids or bases for pH correction may also increase the solution’s ionic strength and electrical conductivity (EC), reducing osmotic potential and impairing water uptake [52,53,54,55]. The observed dehydration in romeritos aligns with these stress responses [53].
In contrast, the NS treatment, which also underwent constant pH adjustments, did not exhibit similar stress, likely due to its lower salinity and better ionic balance [49,56]. Additionally, the weekly replacement of rearing water, rich in Na, Cl, K, Mg, and B, may have led to excessive uptake and ionic imbalances, particularly problematic for halophytes that rely on stable ion homeostasis [12,50,57,58]. This effect was not observed in Rosales-Nieblas et al. [24], where water was replaced every three weeks and container volume was larger (30 L vs. 4 L). A smaller volume would lead to more rapid depletion due to evapotranspiration, increasing EC and the risk of mineral toxicity [53,59].
As with FW, significant dry weight (DW) differences were found only in romeritos (Figure 1). Unlike FW, however, DW was higher in treatments using rearing water (C, pH, and pH+S), consistent with Rosales-Nieblas et al. [24]. Despite reduced water uptake in pH and pH+S due to osmotic stress, biomass accumulation was maintained, likely through metabolic adjustments such as increased osmoprotectant production [60,61]. The lowest DW and succulence in NS may be related to its low Na content, as romeritos, an obligate halophyte, performs optimally under moderate to high NaCl levels (up to 750 mM) [62]. Succulence supports salt tolerance by expanding vacuolar capacity for ion storage [63,64]. Higher shoot–root ratios in pH treatments suggest a preferential allocation of biomass to shoots, potentially limiting salt accumulation through reduced transpirational flow, an adaptive response to osmotic stress [10,65]. Root characteristics may also contribute to the differing stress responses observed among species. Plants commonly adapt to environmental stress by altering root morphology, such as changes in root size or structure [66]. In halophytes, certain levels of salinity can even stimulate root growth. For example, in S. salsa, increased salinity has been associated with a reduction in root diameter, which increases the specific surface area and may enhance nutrient and salt uptake efficiency [67]. However, the impact of salinity on root development can vary among species and appears to depend strongly on the specific growing conditions [63]. Although root traits were not evaluated in this study, future investigations into these aspects could provide deeper insight into their contribution to salinity tolerance mechanisms.
In contrast, ice plant and sea asparagus exhibited stable growth and transpiration rates across all treatments (Figure 1 and Figure 2), highlighting their intrinsic tolerance to saline conditions and ability to maintain a water balance. The resilience of ice plant may be attributed to its possession of epidermal bladder cells, which function as storage structures for water and salt, as well as its ability to switch from C3 to CAM metabolism under stress conditions [68,69,70,71]. Similarly, sea asparagus growth has been shown to improve under NaCl concentration of 200–400 mM by accumulating Na in its tissues and compartmentalizing it within vacuoles, facilitating osmotic adjustment and maintaining turgor pressure [72].

4.2. Ionic Pool and Osmotic Regulation

To evaluate osmotic regulation mechanisms, ion concentrations and osmotic potential were measured in aqueous extracts of fresh tissues. In ice plant, PCA (Figure 7a) revealed a strong correlation between K + , oxalate ( C 2 H 2 O 4 2 ), and osmotic potential, particularly in the NS treatment, which had the highest values of these variables. While N a + and C l were the main contributors to osmotic potential across treatments, their influence was reduced in NS, where K + , P O 4 3 , and C 2 H 2 O 4 2 played a larger roles, indicating a shift toward K + -based osmotic adjustment under low salinity (Figure 4). Oxalate also likely contributed to ROS scavenging and membrane stability [73].
The higher proportion of unidentified osmolytes in NS (Figure 4) suggests the involvement of organic solutes like proline or sugars. In rearing water treatments, C l , N a + , M g 2 + , and N O 3 were more closely linked to osmotic potential, reflecting the composition of the rearing water. The observed reduction in K + under high N a + conditions suggests ionic antagonism, a typical halophyte response [74]. This may involve HAK-type transporters (e.g., McHAK), which support K + uptake despite N a + stress by compensating for the inhibition of the K + channel (MKT1) [75,76]. Although gene expression was not assessed, N a + uptake likely involves HKT-type transporters [77]. At the same time, vacuolar sequestration occurs via N a + / H + antiporters powered by V-ATPase, which increases activity under salt stress [78,79]. This facilitates cytosolic osmotic balance and is complemented by the synthesis of compatible solutes, such as pinitol and proline [71,80].
In romeritos, osmotic potential was lowest in pH and pH+S (Figure 3), coinciding with visible stress symptoms and high N a + and C l concentrations. These ions were the main contributors to osmotic adjustment across treatments (Figure 4), confirming their key role in halophyte tolerance [62]. While N a + contribution remained stable among rearing water treatments, C l levels showed no significant variation. In contrast K + contributed more to NS, likely due to reduced N a + competition at transport sites [81].
Romeritos likely maintained osmoregulation under salt stress through selective ion transport, such as N a + exclusion at the root level via SOS1 transporters, K + uptake through HKT and AKT1 channels, and vacuolar N a + sequestration by N a + / H + antiporters, supported by H + -ATPase and H + -PPase activity [82,83,84,85]. Consistent C l contributions suggest vacuolar compartmentalization via C l / H + antiporters or chloride channels, as reported for SaCLCc1 and SaCLCd in S. altissima [86,87]. Higher N O 3 in rearing water treatments may reflect the activation of nitrate transporters (NRTs) under salinity [88]. However, its greater contribution to osmotic potential in C and NS suggests cytosolic accumulation under low-stress conditions [89]. Phosphate was elevated in pH+S due to supplementation and remained high in NS, indicating stable uptake under mild stress. Oxalate, a key component in ion homeostasis and osmoregulation, has been reported to increase under saline conditions [89,90]. However, in this study C 2 H 2 O 4 2 content and its contribution to osmotic potential were significantly higher in C and NS, whereas pH and pH+S exhibited lower levels (Table 4; Figure 4). This suggests that under stress conditions, plants may prioritize the synthesis of alternative organic acids over C 2 H 2 O 4 2 to support metabolic and osmotic adjustments.
In sea asparagus, ion accumulation, and osmotic contributions were primarily driven by salinity rather than treatment type. Rearing water increased N a + and C l , while NS promoted N H 4 + and K + uptake (Table 3 and Table 4). Phosphate and S O 4 2 levels rose under pH-adjusted treatments, with M g 2 + , N O 2 , N O 3 , and C 2 H 2 O 4 2 remaining stable. Although N a + and C l were the main osmotic contributors, their influence declined slightly in NS, where ions like N H 4 + , K + , M g 2 + , N O 3 , and P O 4 3 became more significant due to reduced ionic competition (Figure 4) [89]. Sulfate and C 2 H 2 O 4 2 contributions also increased under pH adjustments. High N a + accumulation in shoots without growth inhibition suggests effective vacuolar sequestration via tonoplast N a + / H + antiporters, powered by - H + -ATPase (SeVHA-A) and V- H + -PPase (SeVP1) [72,91]. These mechanisms allow N a + to act as a key osmotic regulator.

4.3. Pigments, Stress Markers, and Antioxidant Responses

In the ice plant, chlorophyll a + b and betalain levels did not differ significantly across treatments (Figure 5a,b), consistent with previous findings that salinity has a minimal impact on pigment content in this species [24,92]. Conversely, romeritos showed reduced pigment concentrations under pH and pH+S treatments (Figure 5a,b). Principal component analysis (Figure 7c) revealed a strong correlation between pigments, osmotic potential, and water content. Chlorophyll decline under salt stress is linked to impaired gas exchange and reduced binding proteins, though it may also help limit ROS accumulation [93,94,95,96]. Lower betalain levels in romeritos suggest a metabolic shift toward other osmoprotectants, such as glycine betaine or proline, over pigment production [97]. In sea asparagus, chlorophyll levels remained unaffected, consistent with previous findings that show stabilization at high salinity (>400 mM NaCl) [21]. Betalain concentration was highest in NS (Figure 5b), possibly due to its role in scavenging ROS during senescence [98], which may have increased under lower salinity conditions that influence shoot anatomy and aging [21,99].
Hydrogen peroxide (H2O2), a key ROS, is involved in both oxidative stress and essential physiological functions [100]. Membrane damage from ROS is often assessed via malondialdehyde (MDA), a marker of lipid peroxidation [101]. To mitigate oxidative damage and regulate reactive oxygen species (ROS) functions, the antioxidant system is essential for maintaining ROS homeostasis [102]. In ice plant, SOD activity was consistent across treatments (Table 5), indicating a consistent first line of defense against ROS. Under low salinity (NS), H2O2 was highest, while APX and GR were lowest (Table 5), possibly due to insufficient induction of the ascorbate–glutathione cycle responsible for H2O2 detoxification. This aligns with previous studies that have reported increased APX and GR activity in halophytes under saline conditions [103,104,105]. Additionally, other enzymatic pathways, such as oxalate oxidase, may have contributed to elevated H2O2 levels, aligning with higher oxalate concentrations [106,107]. In contrast, pH+S exhibited high APX activity and low H2O2 content (Table 5; Figure 6b), indicating efficient ROS detoxification. The accumulation of H2O2 in pH+S likely originated from alternative metabolic or oxidative stress pathways [107] rather than from SOD activity, which was the lowest in this treatment. The improved antioxidant enzyme activity observed under the pH+S treatment may be attributed to both nutrient supplementation and pH adjustment, which likely enhanced the efficiency of ROS scavenging. This is consistent with the role of micronutrients such as Fe, Cu, Zn, Mn, and Ni, which serve as essential cofactors of antioxidant enzymes. These micronutrients often precipitate or become less bioavailable due to the formation of insoluble hydroxides or phosphates, which limits their uptake even when present in the nutrient solution [53,108]. Additionally, C and pH showed increased GR activity (Table 5), which likely facilitates glutathione regeneration and maintains redox homeostasis [103]. Among treatments exposed to rearing water, only slight variations were observed in APX and GR activity (Table 5). These findings align with Hsieh et al. [109], who reported that the ascorbate–glutathione cycle plays a crucial role in H2O2 scavenging in ice plant under salinity stress. Catalase activity remained stable across treatments (Table 5) despite previous reports showing high and stable CAT activity in ice plants cultivated at 400 mM NaCl [110], suggesting that ice plant possesses a robust antioxidant defense system capable of preventing excessive lipid peroxidation.
Romeritos exhibited the highest H2O2 and MDA content under NS (Figure 6a,b), indicating oxidative stress and suppressed antioxidant activity, which is consistent with previous reports [62]. Additionally, Yamada et al. [62] noted that the activities of CAT, APX, SOD, and GR decreased under low salinity conditions. This trend is consistent with our results, where the NS treatment exhibited the lowest activity of these enzymes, correlating with the highest accumulation of H2O2 and MDA (Figure 6a,b). Reduced leaf succulence in NS may have exacerbated light-induced ROS production due to the limited availability of water molecules to absorb red light [62]. In pH and pH+S, elevated SOD and APX activities suggest a protective adaptive response to stress-induced ROS. Chloroplasts are a primary site of ROS generation [111], and under stress conditions, reduced stomatal conductance and CO2 assimilation can lead to the formation of excited triplet chlorophyll molecules. These interfere with the photosynthetic electron transport chain, leading to excessive ROS production [112,113]. This aligns with the observed reduction in chlorophyll content in these treatments. Additionally, within chloroplasts, photosystems I and II serve as significant sites of superoxide radical (O2•⁻) production. In PS I, most O2•⁻ is converted to H2O2 by SOD [114]. The elevated activity of SOD and APX in pH and pH+S (Table 5) suggests that these plants prioritized maintaining redox homeostasis through ROS detoxification rather than sustaining high transpiration rates. Despite this antioxidant upregulation, water uptake remained limited under these treatments, indicating that while the antioxidant response was likely effective at the cellular level, it may have been insufficient to mitigate systemic stress impacts [115]. Similar findings were reported in S. salsa under chilling stress, where SOD and APX activity initially increased, while ROS levels declined; however, later, antioxidant activity dropped as the stress intensified [116]. This supports the interpretation that antioxidant responses serve as an early protective mechanism but may not entirely prevent broader stress-induced damage under sustained or complex stress conditions. Conversely, C exhibited higher CAT and GR activity and showed no apparent signs of stress. Instead, plants demonstrated better growth performance and greater succulence. Notably, C had the second highest H2O2 content after NS, which may have facilitated efficient CAT function, as CAT requires higher H2O2 levels than APX to operate effectively [117]. These results suggest that plants under C maintained a well-balanced redox state, supporting growth while effectively mitigating oxidative stress.
Sea asparagus showed no significant differences in H2O2 across treatments (Figure 6b), though the highest MDA was under NS (Figure 6a). Only SOD activity varied significantly (Table 5), being lowest in NS and highest under saline treatments. This pattern contrasts with findings in Salicornia europaea and other Salicornia species, where MDA and SOD activity typically increase with salinity [22,104,118,119,120]. Other enzymes (CAT, APX, and GR) remained generally low, suggesting reliance on non-enzymatic mechanisms like ion compartmentalization and osmolyte accumulation [22,119]. These findings support the idea that moderate salinity activates sea asparagus tolerance mechanisms, while low salinity (NS) may impair membrane stability. Across all species, low salinity conditions (NS) were consistently associated with elevated levels of MDA and/or H2O2 despite limited antioxidant enzyme activity. This suggests that, under these conditions, oxidative stress was more indicative of cellular damage rather than a signaling event triggering effective antioxidant responses.

4.4. General Outcomes

Each species exhibited distinct physiological responses, but overall, the observed differences appeared to be primarily driven by salinity levels rather than agronomic management strategies.
Hierarchical clustering analysis identified two main species groups, with ice plant forming a separate cluster from sea asparagus and romeritos (Figure 8). Ice plant demonstrated the highest values for FW, S, WC, pigments, antioxidant enzyme activity, S O 4 2 , C 2 H 2 O 4 2 , and OP. This species’ strong succulence plays a crucial role in thermal dissipation, which, in combination with its robust antioxidative system, likely reduces ROS production and protects photosynthetic pigments from damage. Additionally, ice plant is known to accumulate secondary metabolites with antioxidant and osmoregulatory functions [23,121,122,123].
Romeritos showed greater variability among treatments, primarily due to stress symptoms in pH and pH+S. Despite this, it achieved higher DW and SLA than the other species (Figure 1b; Table 2), consistent with its known salinity tolerance via N a + compartmentalization [62]. Elevated C l and N a + in pH and pH+S (Table 3 and Table 4) and their increased contribution to osmotic potential (Figure 4) suggest a strategy to reduce internal osmotic potential and improve water uptake [62]. In contrast, C and NS treatments showed similar responses in WC, LA, SLA, pigments, and OP, as supported by PCA (Figure 7c), indicating adequate water and osmotic regulation. This finding is consistent with observations in Suaeda salsa, where optimal salinity promotes growth during long-term cultivation through antioxidant and osmotic mechanisms [124]. Although no significant differences were observed during the study period, longer cultivation might reveal enhanced growth at the species’ optimal salinity (250 mM NaCl) [62]. Additionally, the presence of unidentified osmotic contributors in the pH and pH+S treatments (22.6% and 24.8%, respectively) could indicate the synthesis of osmoprotectants, which are known to play a key role in osmotic adjustment in Suaeda species [125,126]. This is particularly plausible given that medium acidification enhances nutrient solubility, ensuring the availability of micronutrients essential for the biosynthesis of compatible solutes [127]. Further investigation into these unidentified compounds could provide deeper insights into osmoregulation mechanisms in romeritos. Moreover, romeritos may possess a broader optimal pH range, potentially explaining the similar response observed between C and NS.
Sea asparagus showed higher DW, C l , and N a + under rearing water treatments, while P O 4 3 , K + , and MDA were highest in NS (Figure 8). Although high salinity typically limits K + uptake [128,129], sea asparagus maintained higher shoot K + than the other species across all treatments, with the highest levels in NS, likely due to reduced N a + competition (Table 3). Despite having the lowest osmotic potential among species, growth remained unaffected, suggesting that osmoprotectants were present to mitigate osmotic stress [130,131]. While no significant treatment differences were observed, rearing water may offer more favorable conditions for cultivation. In later developmental stages, low salinity can cause N a + deficiency, increasing energy costs for osmotic regulation. Although not immediately detrimental, such deficiencies may have a long-term impact on physiological function and resource allocation [132].

5. Conclusions

This study highlights the species-specific responses of halophytes to agronomic management under half-strength seawater aquaponics. Salinity was the dominant factor influencing physiological traits, while agronomic management had secondary effects. Ice plant showed stable growth, strong succulence, and antioxidant capacity, indicating that minimal management is required. Romeritos maintained biomass via N a + compartmentalization but showed stress under pH-adjusted and nutrient supplementation treatments, suggesting the control condition was more favorable. Sea asparagus exhibited effective osmoregulation and K + retention, supporting stable growth with minimal inputs. These findings highlight the potential for low-input halophyte cultivation in saline environments and support future research into osmoprotectants and the long-term sustainability of these systems.

Supplementary Materials

The following supporting information can be downloaded at https://www.mdpi.com/article/10.3390/horticulturae11060623/s1, Figure S1: Ice plant (a), romeritos (b), and sea asparagus (c) cultivated under four different rooting media (C = untreated rearing water; pH = rearing water with pH adjustment to 5.5; pH+S = rearing water with pH adjustment to 5.5 and nutrient supplementation; NS = standard nutrient solution + 5 mM NaCl).

Author Contributions

Conceptualization, M.Y. and S.Y.; methodology, M.Y. and S.Y.; validation, S.Y., M.Y., B.M.-A. and A.C.R.-N.; formal analysis, A.C.R.-N.; investigation, A.C.R.-N. and B.M.-A.; resources, B.M.-A. and S.Y.; data curation, A.C.R.-N.; writing—original draft preparation, A.C.R.-N. and S.Y.; writing—review and editing, all authors; visualization, B.M.-A. and A.C.R.-N.; supervision, S.Y. and M.Y.; project administration, S.Y.; funding acquisition, S.Y. All authors have read and agreed to the published version of the manuscript.

Funding

This research was financially supported by the Japan Society for the Promotion of Science KAKENHI, grant number JP23K05184.

Data Availability Statement

The data presented in this study is available on request from the corresponding author.

Acknowledgments

The authors would like to thank SECIHTI for the scholarship received and Tottori University for the workspace during this study.

Conflicts of Interest

The authors declare no conflicts of interest.

References

  1. Liang, W.; Ma, X.; Wan, P.; Liu, L. Plant salt-tolerance mechanism: A review. Biochem. Biophys. Res. Commun. 2018, 495, 286–291. [Google Scholar] [CrossRef] [PubMed]
  2. Deinlein, U.; Stephan, A.B.; Horie, T.; Luo, W.; Xu, G.; Schroeder, J.I. Plant salt-tolerance mechanisms. Trends Plant Sci. 2014, 19, 371–379. [Google Scholar] [CrossRef] [PubMed]
  3. Bahmani, K.; Noori, S.A.S.; Darbandi, A.I.; Akbari, A. Molecular mechanisms of plant salinity tolerance: A review. Aust. J. Crop Sci. 2015, 9, 321–336. [Google Scholar]
  4. Abobatta, W.F. Plant responses and tolerance to extreme salinity: Learning from halophyte tolerance to extreme salinity. In Salt and Drought Stress Tolerance in Plants: Signaling Networks and Adaptive Mechanisms; Hasanuzzaman, M., Tanveer, M., Eds.; Springer: Cham, Switzerland, 2020; pp. 177–210. [Google Scholar] [CrossRef]
  5. Hassanuzzaman, M.; Tanveer, M. Salt and Drougth Stress Tolerance in Plants: Signaling Networks and Adaptive Mechanisms; Springer: Cham, Switzerland, 2020; pp. i–x. [Google Scholar]
  6. Jacoby, B. Mechanisms involved in salt tolerance of plants. In Handbook of Plant and Crop Stress, 2nd ed.; Pessarakli, M., Ed.; Marcel Dekker Inc.: New York, NY, USA, 1999; pp. 97–124. [Google Scholar]
  7. Hasegawa, P.M.; Bressan, R.A.; Zhu, J.K.; Bohnert, H.J. Plant cellular and molecular responses to high salinity. Annu. Rev. Plant Physiol. Plant Mol. Biol. 2000, 51, 463–499. [Google Scholar] [CrossRef] [PubMed]
  8. Flowers, T.J.; Yeo, A.R. Breeding for salinity resistance in crop plants: Where next? Aust. J. Plant Physiol. 1995, 22, 875–884. [Google Scholar] [CrossRef]
  9. Tester, M.; Davenport, R. Na+ tolerance and Na+ transport in higher plants. Ann. Bot. 2003, 91, 503–527. [Google Scholar] [CrossRef]
  10. Munns, R.; Schachtman, D.P.; Condon, A.G. The significance of a two-phase growth response to salinity in wheat and barley. Aust. J. Plant Physiol. 1995, 22, 561–569. [Google Scholar] [CrossRef]
  11. Apel, K.; Hirt, H. Reactive oxygen species: Metabolism, oxidative stress, and signal transduction. Annu. Rev. Plant Biol. 2004, 55, 373–399. [Google Scholar] [CrossRef]
  12. Flowers, T.J.; Colmer, T.D. Salinity tolerance in halophytes. New Phytol. 2008, 179, 945–963. [Google Scholar] [CrossRef]
  13. Rozema, J.; Schat, H. Salt tolerance of halophytes, research questions reviewed in the perspective of saline agriculture. Environ. Exp. Bot. 2013, 82, 83–95. [Google Scholar] [CrossRef]
  14. Nikalje, G.C.; Srivastava, A.K.; Pandey, G.K.; Suprasanna, P. Halophytes in biosaline agriculture: Mechanism, utilization and value addition. Land Degrad. Dev. 2017, 29, 1081–1095. [Google Scholar] [CrossRef]
  15. Lokhande, V.H.; Suprasanna, P. Prospects of halophytes in understanding and managing abiotic stress tolerance. In Environmental Adaptations and Stress Tolerance of Plants in the Era of Climate Change; Ahmad, P., Prasad, M.N.V., Eds.; Springer: New York, NY, USA, 2012; pp. 29–56. [Google Scholar]
  16. Mahmoud, A.H. Production of quinoa (Chenopodium quinoa) in the marginal environments of south mediterranean region: Nile Delta, Egypt. Egypt J. Soil Sci. 2017, 57, 329–337. [Google Scholar] [CrossRef]
  17. Attia-Ismail, S. Nutritional and feed value of halophytes and salt tolerant plants. In Halophytic and Salt-Tolerant Feedstuffs, Impacts on Nutrition, Physiology and Reproduction of Livestock; El shaer, H.M., Squires, V.R., Eds.; CRC Press: New York, NY, USA, 2015; Volume 106, pp. 106–126. [Google Scholar] [CrossRef]
  18. Ahmed, F.A.; Lofty, R.A. Phytochemical evaluation of some selected medicinal plants growing wildly in southeastern Egypt. Middle East J. Appl. Sci. 2015, 5, 1239–1246. [Google Scholar]
  19. Thevs, N.; Zerbe, S.; Kyosev, Y.; Rozi, A.; Tang, B.; Abdusalih, N.; Novitskiy, Z. Apocynum venetum L. and Apocynum pictum Schrenk (Apocynaceae) as multi-functional and multi-service plant species in Central Asia: A review on biology, ecology, and utilization. J. Appl. Bot. Food Qual. 2012, 85, 159–167. [Google Scholar]
  20. Sharma, R.; Wungrampha, S.; Singh, V.; Pareek, A.; Sharma, M.K. Halophytes as bioenergy crops. Front. Plant Sci. 2016, 7, 1372. [Google Scholar] [CrossRef]
  21. Cárdenas-Pérez, S.; Rajabi, D.A.; Leszczynski, K.; Lubinska-Mielinska, S.; Ludwiczak, A.; Piernik, A. Salicornia europaea L. functional traits indicate its optimum growth. Plants 2022, 11, 1051. [Google Scholar] [CrossRef]
  22. Homayouni, H.; Razi, H.; Izadi, M.; Alemzadeh, A.; Kazemeini, S.A.; Niazi, A.; Vicente, O. Temporal changes in biochemical responses to salt stress in three salicornia species. Plamts 2024, 13, 979. [Google Scholar] [CrossRef]
  23. Atzori, G.; de Vos, A.C.; van Rijsselberghe, M.; Vignolini, P.; Rozema, J.; Mancuso, S.; van Bodegom, P.M. Effects of increased seawater salinity irrigation on growth and quality of the edible halophyte Mesembryanthemum crystallinum L. under field conditions. Agric. Water Manag. 2017, 187, 37–46. [Google Scholar] [CrossRef]
  24. Rosales-Nieblas, A.C.; Yamada, M.; Murillo-Amador, B.; Endo, M.; Yamada, S. Evaluation of the cultivation of three halophytic plants under half-strength seawater aquaponics. Agronomy 2025, 15, 277. [Google Scholar] [CrossRef]
  25. Pucinelli, M.; Marchioni, I.; Botrini, L.; Carmassi, G.; Pardossi, A.; Pistelli, L. Growing Salicornia europaea L. with saline hydroponic or aquaculture wastewater. Horticulturae 2024, 10, 196. [Google Scholar] [CrossRef]
  26. Spradlin, A.; Saha, S. Saline aquaponics: A review of challenges, opportunities, components, and system design. Aquaculture 2022, 555, 738173. [Google Scholar] [CrossRef]
  27. Endo, M. Chapter 9.2—Aquaponics in plant factory. In Plant Factory Using Artificial Light; Anpo, M., Fukuda, H., Wada, T., Eds.; Elsevier: Amsterdam, The Netherlands, 2019; pp. 339–352. [Google Scholar] [CrossRef]
  28. Fimbres-Acedo, Y.E.; Traversari, S.; Cacini, S.; Costamagna, G.; Ginepro, M.; Massa, D. Testing the effect of high pH and low nutrient concentration in four vegetables in hydroponics. Agronomy 2023, 13, 41. [Google Scholar] [CrossRef]
  29. Chu, Y.T.; Brown, P.B. Evaluation of pacific whiteleg shrimp and three halophytic plants in marine aquaponic systems under three salinities. Sustainability 2021, 13, 269. [Google Scholar] [CrossRef]
  30. Maciel, E.; Domingues, P.; Domingues, M.R.M.; Calado, R.; Lillebo, A. Halophyte plants from sustainable marine aquaponics are a valuable source of omega-3 polar lipids. Food Chem. 2020, 320, 126560. [Google Scholar] [CrossRef]
  31. Kaburagi, E.; Yamada, M.; Baba, T.; Fujiyama, H.; Murillo-Amador, B.; Yamada, S. Aquaponics using saline groundwater: Effect of adding microelements to fish wastewater on the growth of Swiss chard (Beta vulgaris L. spp. Cicla). Agric. Water Manag. 2020, 227, 105851. [Google Scholar] [CrossRef]
  32. Doncato, K.B.; Costa, C.S.B. Micronutrient supplementation needs for halophytes in saline aquaponics with BFT system water. Aquaculture 2021, 531, 735815. [Google Scholar] [CrossRef]
  33. Doncato, K.B.; Costa, C.S.B. Effects of cutting on vegetative development and biomass quality of perennial halophytes grown in saline aquaponics. Hortic. Bras. 2022, 40, 432–440. [Google Scholar] [CrossRef]
  34. Doncato, K.B.; Costa, C.S.B. Evaluation of nitrogen and phosphorus nutritional needs of halophytes for saline aquaponics. Hortic. Environ. Biotechnol. 2023, 64, 355–370. [Google Scholar] [CrossRef]
  35. Tuteja, N. Mechanisms of high salinity tolerance in plants. Methods Enzymol. 2007, 428, 419–438. [Google Scholar] [CrossRef]
  36. Zhu, J.K.; Hasegawa, P.M.; Bressan, R.A.; Bohnert, H.J. Molecular aspects of osmotic stress in plants. Crit. Rev. Plant Sci. 1997, 16, 253–277. [Google Scholar] [CrossRef]
  37. Hamdy, A. Saline irrigation: Assessment and management techniques. In Halophytes and Biosaline Agriculture; Chouck-Allah, R., Malcolm, C.V., Hamdy, A., Eds.; Marcel Dekker Inc.: New York, NY, USA, 1996; pp. 147–180. [Google Scholar]
  38. Carillo, P.; Annunziata, M.G.; Pontecorvo, G.; Fuggi, A.; Woodrow, P. Salinity stress and salt tolerance. In Abiotic Stress in Plants—Mechanisms and Adaptations; Shanker, A., Venkateswarlu, B., Eds.; InTech: London, UK, 2011. [Google Scholar] [CrossRef]
  39. Kaburagi, E.; Morikawa, Y.; Yamada, M.; Fujiyama, H. Sodium enhances nitrate uptake in swiss chard (Beta vulgaris var. cicla). Soil Sci. Plant Nutr. 2014, 60, 651–658. [Google Scholar] [CrossRef]
  40. Wintermans, J.F.; Mots, A. Spectrophotometric characteristics of chlorophylls a and b and their pheophytins in ethanol. Biochim. Biophys. Acta 1965, 109, 448–453. [Google Scholar] [CrossRef]
  41. Castellanos-Santiago, E.; Yahia, E.M. Identification and quantification of betalains from the fruits of 10 mexican prickly pear cultivars by high-performance liquid chromatography and electrospray ionization mass spectrometry. J. Agric. Food Chem. 2008, 56, 5758–5864. [Google Scholar] [CrossRef] [PubMed]
  42. Ghanem, M.E.; Albacete, A.; Martínez-Andújar, C.; Acosta, M.; Romero-Aranda, R.; Dodd, I.C.; Lutts, S.; Pérez-Alfocea, F. Hormonal changes during salinity-induced leaf senescence in tomato (Solanum lycopersicum L.). J. Exp. Bot. 2008, 59, 3039–3050. [Google Scholar] [CrossRef]
  43. Tanaka, H.; Yamada, S.; Masunaga, T.; Yamamoto, S.; Tsuji, W.; Murillo-Amador, B. Comparison of nutrient uptake and antioxidative response among four Labiatae herb species under salt stress condition. Soil Sci. Plant Nutr. 2018, 64, 589–597. [Google Scholar] [CrossRef]
  44. Tanaka, K.; Otsubo, T.; Kondo, N. Participation of hydrogen peroxide in the inactivation of calvin-cycle SH enzymes in SO2-fumigated spinach leaves. Plant Cell Physiol. 1982, 36, 1089–1095. [Google Scholar] [CrossRef]
  45. Tanaka, K.; Sugahara, K. Role of superoxide dismutase in defense against SO2 toxicity and an increase in superoxide dismutase activity with SO2 fumigation. Plant Cell Physiol. 1980, 21, 601–611. [Google Scholar] [CrossRef]
  46. Bradford, M.M. A rapid and sensitive method for the quantitation of microgram quantities of protein utilizing the principle of protein-dye binding. Anal. Biochem. 1976, 72, 248–254. [Google Scholar] [CrossRef]
  47. Asao, T. Hydroponics: A Standard Methodology for Plant Biological Researches; InTech: Rijeka, Croatia, 2012; pp. 1–10. [Google Scholar] [CrossRef]
  48. Urrestarazú, M. Tratado de Cultivo Sin Suelo, 3rd ed.; Mundi-Prensa: Madrid, Spain, 2004; p. 17. [Google Scholar]
  49. Frick, J.; Mitchell, C.A. Stabilization of pH in solid matrix hydroponic systems. HortScience 2004, 28, 981–984. [Google Scholar] [CrossRef]
  50. Bugbee, B. Nutrient management in recirculating hydroponic culture. Acta Hortic. 2004, 648, 99–112. [Google Scholar] [CrossRef]
  51. Blatt, M.R. A charged existence: A century of transmembrane ion transport in plants. Plant Physiol. 2024, 195, 79–110. [Google Scholar] [CrossRef] [PubMed]
  52. Singh, H.; Dunn, B.; Payton, M. Hydroponic pH modifiers affect plant growth and nutrient content in leafy greens. J. Hortic. Res. 2019, 27, 31–36. [Google Scholar] [CrossRef]
  53. Ali Al Meselmani, M. Nutrient Solution for Hydroponics. In Recent Research and Advances in Soilless Culture; Turan, M., Ed.; InTech: London, UK, 2023. [Google Scholar] [CrossRef]
  54. Hewitt, E.J. Sand and water culture methods used in the study of plant nutrition. Soil Sci. Soc. Am. J. 1953, 17, 301. [Google Scholar] [CrossRef]
  55. Chrysargyris, A.; Petropoulos, S.A.; Prvulovic, D.; Tzortzakis, N. Performance of hydroponically cultivated geranium and common verbena under salinity and high electrical conductivity levels. Agronomy 2021, 11, 1237. [Google Scholar] [CrossRef]
  56. Steiner, A.A. A universal method for preparing nutrient solutions of a certain desired composition. Plant Soil 1961, 15, 134–154. [Google Scholar] [CrossRef]
  57. Sanadhya, P.; Agarwal, P.; Agarwal, P.K. Ion homeostasis in a salt-secreting halophytic grass. Aob Plants 2015, 7, plv055. [Google Scholar] [CrossRef]
  58. Guo, Q.; Meng, L.; Han, J.; Mao, P.; Tian, X.; Zheng, M.; Mur, L.A.J. SOS1 is a key systemic regulator of salt secretion and K+/Na+ homeostasis in the recretohalophyte Karelinia caspia. Environ. Exp. Bot. 2020, 177, 104098. [Google Scholar] [CrossRef]
  59. Carmassi, G.; Incrocci, L.; Malorgio, M.; Tognoni, F.; Pardossi, A. A simple model for salt accumulation in closed-loop hydroponics. Acta Hortic. 2003, 614, 149–154. [Google Scholar] [CrossRef]
  60. Szabados, L.; Kovács, H.; Zilberstein, A.; Bouchereau, A. Plants in extreme environments: Importance of protective compounds in stress tolerance. In Plant Responses to Drought and Salinity Stress Developments in a Post-Genomic Era, Advances in Botanical Research; Turkan, I., Ed.; Academic Press: Orlando, FL, USA, 2011; Volume 57, pp. 105–150. [Google Scholar] [CrossRef]
  61. Parida, A.K.; Das, A.B. Salt tolerance and salinity effects on plants: A review. Ecotox. Environ. Saf. 2005, 60, 324–349. [Google Scholar] [CrossRef]
  62. Yamada, M.; Kasami, K.; Urushigaki, R.; Murillo-Amador, B.; Yamada, S. Mechanisms of halophilic and salt tolerance in Suaeda edulis Flores Olv. & Noguez. Soil Sci. Plant Nutr. 2025, 1–10. [Google Scholar] [CrossRef]
  63. Belkheiri, O.; Mulas, M. The effects of salt stress on growth, water relations and ion accumulation in two halophyte Atriplex species. Environ. Exp. Bot. 2013, 86, 17–28. [Google Scholar] [CrossRef]
  64. Ungar, I.A. Ecophysiology of Vascular Halophytes; CRC Press: Boca Raton, FL, USA, 1991; p. 209. [Google Scholar] [CrossRef]
  65. Pitman, M.G. Transport across the root and shoot/root interactions. In Salinity Tolerance in Plants: Strategies for Crop Improvement; Staples, R.C., Toenniessen, G.H., Eds.; John Wiley & Sons: New York, NY, USA, 1984; p. 93. [Google Scholar]
  66. LiangPeng, Y.; Jian, M.A.; Yan, L.I. Impact of salt stress on the features and activities of root system for three desert halophyte species in their seedling stage. Sci. China Ser. D 2007, 50, 97–106. [Google Scholar] [CrossRef]
  67. Wang, S.; Zhao, Z.; Ge, S.; Peng, B.; Zhang, K.; Hu, M.; Mai, W.; Tian, C. Root morphology and rhizosphere characteristics are related to sat tolerance of Suaeda salsa and Beta vulgaris L. Front. Plant Sci. 2021, 12, 677767. [Google Scholar] [CrossRef]
  68. Lüttge, U.; Fischer, E.; Steudle, E. Membrane potentials and salt distribution in epidermal bladders and photosynthetic tissue of Mesembryanthemum crystallinum L. Plant Cell Environ. 1978, 1, 121–129. [Google Scholar] [CrossRef]
  69. Agarie, S.; Shimoda, T.; Shimizu, Y.; Baumann, K.; Sunagawa, H.; Kondo, A.; Ueno, O.; Nakahara, T.; Nose, A.; Cushman, J.C. Salt tolerance, salt accumulation, and ionic homeostasis in an epidermal bladder-cell-less mutant of the common ice plant Mesembryanthemum crystallinum. J. Exp. Bot. 2007, 58, 1957–1967. [Google Scholar] [CrossRef]
  70. Abd El-Gawad, A.M.; Shehata, H.S. Ecology and development of Mesembryanthemum crystallinum L. in the deltaic mediterranean coast of Egypt. Egypt. J. Basic Appl. Sci. 2014, 1, 29–37. [Google Scholar] [CrossRef]
  71. Adams, P.; Nelson, D.E.; Yamada, S.; Chmara, W.; Jensen, R.G.; Bohnert, H.J.; Griffiths, H. Growth and development of Mesembryanthemum crystallinum (Aizoaceae). New Phytol. 1998, 138, 171–190. [Google Scholar] [CrossRef]
  72. Lv, S.; Jiang, P.; Chen, X.; Fan, P.; Wang, X.; Li, Y. Multiple compartmentalization of sodium conferred salt tolerance in Salicornia europaea. Plant Physiol. Biochem. 2012, 51, 47–52. [Google Scholar] [CrossRef]
  73. Hameed, A.; Ahmed, M.Z.; Hussain, T.; Aziz, I.; Ahmad, N.; Gul, B.; Nielsen, B.L. Effects of salinity stress on chloroplast structure and function. Cells 2021, 10, 2023. [Google Scholar] [CrossRef]
  74. Rozema, J. An ecophysiological study on the response to salt of four halophytic and glycophytic Juncus species. Flora 1976, 165, 197–209. [Google Scholar] [CrossRef]
  75. Su, H.; Golldack, D.; Katsuhara, M.; Zhao, C.; Bohnert, H.J. Expression and stress-dependent induction or potassium channel transcripts in the common ice plant. Plant Physiol. 2001, 125, 604–614. [Google Scholar] [CrossRef] [PubMed]
  76. Su, H.; Golldack, D.; Zhao, C.; Bohnert, H.J. The expression of HAK-type K+ transporters is regulated in response to salinity stress in common ice plant. Plant Physiol. 2002, 129, 1482–1493. [Google Scholar] [CrossRef] [PubMed]
  77. Rus, A.; Yokoi, S.; Sharkuu, A.; Reddy, M.; Lee, B.H.; Matsumoto, T.K.; Koiwa, H.; Zhi, J.K.; Bressan, R.A.; Hasegawa, P.M. AtHKT1 is a salt tolerance determinant that controls Na+ entry into plant roots. Proc. Natl. Acad. Sci. USA 2001, 98, 14150–14155. [Google Scholar] [CrossRef] [PubMed]
  78. Barkla, B.J.; Zingarelli, L.; Blumwald, E.; Smith, J.A.C. Tonoplast Na+/H+ antiport activity and its energization by the vacuolar H+-ATPase in the halophytic plant Mesembryanthemum crystallinum L. Plant Physiol. 1995, 109, 549–556. [Google Scholar] [CrossRef]
  79. Ratajczak, R.; Richter, J.; Lüttge, U. Adaptation of the tonoplast V-type H+-ATPase of Mesembryanthemum crystallinum to salt stress, C3-CAM transition and plant age. Plant Cell Environ. 1994, 17, 1101–1112. [Google Scholar] [CrossRef]
  80. Vernon, D.M.; Bohnert, H.J. A novel methyl transferase induced by osmotic stress in the facultative halophyte Mesembryanthemum crystallinum. EMBO J. 1992, 11, 2077–2085. [Google Scholar] [CrossRef]
  81. Schachtman, D.P.; Schroeder, J.I. Structure and transport mechanism of a high-affinity potassium uptake transporter from higher plants. Nature 1994, 370, 655–658. [Google Scholar] [CrossRef]
  82. Wang, W.; Liu, Y.; Duan, H.R.; Yin, X.X.; Cui, Y.N.; Chai, W.W.; Song, X.; Flowers, T.J.; Wang, S. SsHKT1;1 is coordinated with SsSOS1 and SsNHX1 to regulate Na+ homeostasis in Suaeda salsa under saline conditions. Plant Soil 2020, 449, 117–131. [Google Scholar] [CrossRef]
  83. Lebaudy, A.; Véry, A.A.; Sentenac, H. K+ channel activity in plants: Genes, regulations and functions. FEBS Lett. 2007, 581, 2357–2366. [Google Scholar] [CrossRef]
  84. Qiu, N.; Chen, M.; Guo, J.; Bao, H.; Ma, X.; Wang, B. Coordinate up-regulation of V-H+-ATPase and vacuolar Na+/H+ antiporter as a response to NaCl treatment in a C3 halophyte Suaeda salsa. Plant Sci. 2007, 172, 1218–1225. [Google Scholar] [CrossRef]
  85. Want, B.; Lüttge, V.; Ratajczak, R. Effects of salt treatment and osmotic stress on V-ATPase and V-PPase in leaves of the halophyte Suaeda salsa. J. Exp. Bot. 2001, 52, 2355–2365. [Google Scholar] [CrossRef]
  86. Nedelyaeva, O.I.; Popova, L.G.; Volkov, V.S.; Balnokin, Y.V. Molecular cloning and characterization of SaCLCd, SaCLCf, and SaCLCg, novel proteins of the chloride channel family (CLC) from the halophyte Suaeda altissima (L.) Pall. Plants 2022, 11, 409. [Google Scholar] [CrossRef] [PubMed]
  87. Nedelyaeva, O.I.; Shuvalov, A.V.; Mayorova, O.V.; Yurchenko, A.A.; Popova, L.G.; Balnokin, Y.V.; Karpichev, I.V. Cloning and functional analysis of SaCLCc1, a gene belonging to the chloride channel family (CLC), from the halophyte Suaeda altissima (L.) Pall. Dokl. Biochem. Biophys. 2018, 481, 186–189. [Google Scholar] [CrossRef] [PubMed]
  88. Liu, J.; Li, J.; Deng, C.; Liu, Z.; Yin, K.; Zhang, Y.; Zhao, Z.; Zhao, R.; Zhao, N.; Zhou, X.; et al. Effect of NaCl on ammonium and nitrate uptake and transport in salt-tolerant and salt-sensitive poplars. Three Physiol. 2024, 44, tpae020. [Google Scholar] [CrossRef]
  89. Ashraf, M.; Shahzad, S.M.; Imtiaz, M.; Rizwan, M.S. Salinity effects on nitrogen metabolism in plants—Focusing on the activities of nitrogen metabolizing enzymes: A review. J. Plant Nutr. 2018, 41, 1065–1081. [Google Scholar] [CrossRef]
  90. Libert, B.; Franceschi, V.R. Oxalate in crop plants. J. Agric. Food Chem. 1987, 35, 926–938. [Google Scholar] [CrossRef]
  91. Apse, M.P.; Aharon, G.S.; Snedden, W.A.; Blumwald, E. Salt tolerance conferred by overexpression of a vacuolar Na+/H+ antiport in Arabidopsis. Science 1999, 285, 1256–1258. [Google Scholar] [CrossRef]
  92. Barker, D.H.; Marszalek, J.; Zimpfer, J.F.; Adams, W.W., III. Changes in photosynthetic pigment composition and absorbed energy allocation during salt stress and CAM induction in Mesembryanthemum crystallinum. Funct. Plant Biol. 2004, 31, 781–787. [Google Scholar] [CrossRef]
  93. Koyro, H.W.; Huchzermeyer, B. Breeding for abiotic stress tolerance in maize. In Abiotic Stress: Plant Resistance Through Breeding and Molecular Approaches; Ashraf, M., Harris, P.J.C., Eds.; The Haworth Press: New York, NY, USA, 2005; pp. 545–576. [Google Scholar]
  94. Sudhir, P.; Murthy, S.D.S. Effects of salt stress on basic processes of photosynthesis. Photosynthetica 2004, 42, 481–486. [Google Scholar] [CrossRef]
  95. Koyro, H.W.; Zörb, C.; Debez, A.; Huchzermeyer, B. The effect of hyper-osmotic salinity on protein pattern and enzyme activities of halophytes. Funct. Plant Biol. 2013, 40, 787–804. [Google Scholar] [CrossRef]
  96. Akcin, A.; Yalçin, E. Effect of salinity stress on chlorophyll, carotenoid content, and proline in Salicornia prostrata Pall. And Suaeda prostrata Pall. subsp. prostrata (Amaranthaceae). Braz. J. Bot. 2016, 39, 101–106. [Google Scholar] [CrossRef]
  97. Cerillo-Rojas, G.V.; Tiscareño-Andrade, M.; Ochoa-Alfaro, A.E.; Pérez-Molphe, B.E.; Soria-Guerra, R.E.; Morales-Domínguez, J.F. In vitro propagation, isolation and expression studies of Suaeda edulis genes involved in the osmoprotectans biosynthesis. Phyton-Int. J. Exp. Bot. 2020, 89, 715–726. [Google Scholar] [CrossRef]
  98. Parida, A.K.; Kumari, A.; Panda, A.; Rangani, J.; Agarwal, P.K. Photosynthetic pigments, betalains, proteins, sugars, and minerals during Salicornia brachiata senescence. Biol. Plant. 2018, 62, 343–352. [Google Scholar] [CrossRef]
  99. Ungar, I.A.; Benner, D.K.; McGraw, D.C. The distribution and growth of Salicornia europaea on an inland salt pan. Ecology 1979, 60, 329–336. [Google Scholar] [CrossRef]
  100. Li, J.T.; Qiu, Z.B.; Zhang, X.W.; Wang, L.S. Exogenous hydrogen peroxide can enhance tolerance of wheat seedlings to salt stress. Acta physiol. Plant 2011, 33, 835–842. [Google Scholar] [CrossRef]
  101. Halliwell, B.; Gutteridge, J.M.C. Free Radicals in Biology and Medicine, 5th ed.; Oxford University Press: Oxford, UK, 2015; p. 270. [Google Scholar]
  102. Noctor, G.; Foyer, C.H. Ascorbate and glutathione: Keeping active oxygen under control. Annu. Rev. Plant Physiol. Plant Mol. Biol. 1998, 49, 249–279. [Google Scholar] [CrossRef]
  103. Asada, K. Production and scavenging of reactive oxygen species in chloroplasts and their functions. Plant Physiol. 2006, 141, 391–396. [Google Scholar] [CrossRef] [PubMed]
  104. Parida, A.K.; Jha, B. Salt tolerance mechanisms in mangroves: A review. Trees 2010, 24, 199–217. [Google Scholar] [CrossRef]
  105. Parida, A.K.; Das, A.B.; Mohanty, P. Defense potentials to NaCl in a mangrove, Bruguiera parviflora: Differential changes of isoforms of some antioxidative enzymes. J. Plant Physiol. 2004, 161, 531–542. [Google Scholar] [CrossRef]
  106. Voothuluru, P.; Mäkelä, P.; Zhu, J.; Yamaguchi, M.; Cho, I.J.; Oliver, M.J.; Simmonds, J.; Sharp, R.E. Apoplastic hydrogen peroxide in the growth zone of the maize primary root. Increased levels differentially modulate root elongation under well-watered and water-stressed conditions. Front. Plant Sci. 2020, 11, 392. [Google Scholar] [CrossRef]
  107. Kawano, T. Roles of the reactive oxygen species-generating peroxidase reactions in plant defense and growth induction. Plant Cell Rep. 2003, 21, 829–837. [Google Scholar] [CrossRef]
  108. Gupta, R.; Verma, N.; Tewari, R.J. Micronutrient deficiency-induced oxidative stress in plants. Plant Cell Rep. 2024, 43, 213. [Google Scholar] [CrossRef]
  109. Hsieh, L.C.; Lee, C.C.; Zhang, K.F.; Chang, H.H.; Li, C.H.; Huang, H.J. Transcriptomic and enzymatic analysis of peroxidase families at the early growth stage of halophyte ice plant (Mesembryanthemum crystallinum L.) under salt stress. Bot. Stud. 2025, 66, 5. [Google Scholar] [CrossRef]
  110. Shevyakova, N.I.; Rakitin, V.Y.; Stetsenko, L.A.; Aronova, E.E.; Kuznetsov, V.V. Oxidative stress and fluctuations of free and conjugated polyamines in the halophyte Mesembryanthemum crystallinum L. under NaCl salinity. Plant Growth Regul. 2006, 50, 69–78. [Google Scholar] [CrossRef]
  111. Raja, V.; Majeed, U.; Kang, H.; Andrabi, K.I.; John, R. Abiotic stress: Interplay between ROS, hormones and MAPKs. Environ. Exp. Bot. 2017, 137, 142–157. [Google Scholar] [CrossRef]
  112. Shakirova, F.M.; Allagulova, C.R.; Maslennikova, D.R.; Klyuchnikova, E.O.; Avalbaev, A.M.; Bezrukova, M.V. Salicylic acid-induced protection against cadmium toxicity in wheat plants. Environ. Exp. Bot. 2016, 122, 19–28. [Google Scholar] [CrossRef]
  113. Singh, A.; Kumar, A.; Yadav, S.; Singh, I.K. Reactive oxygen species-mediated signaling during abiotic stress. Plant Gene 2019, 18, 100–173. [Google Scholar] [CrossRef]
  114. Hasanuzzaman, M.; Nahar, K.; Fujita, M. Plant response to salt stress and role of exogenous protectants to mitigate salt-induced damages. In Ecophysiology and Responses of Plants under Salt Stress; Ahmed, P., Azooz, M.M., Prasad, M.N.V., Eds.; Springer: New York, NY, USA, 2013; pp. 25–87. [Google Scholar]
  115. Zandalinas, S.I.; Fichman, Y.; Devireddy, A.R.; Sengupta, S.; Azad, R.K.; Mittler, R. System signaling during abiotic stress combination in plants. Proc. Natl. Acad. Sci. USA 2020, 117, 13810–13820. [Google Scholar] [CrossRef]
  116. Sui, N. Photoinhibition of Suaeda salsa to chilling stress is related to energy dissipation and water-water cycle. Photosynthetica 2015, 53, 207–212. [Google Scholar] [CrossRef]
  117. Willekens, H.; Chamnongpol, S.; Davey, M.; Schraudner, M.; Langebartels, C.; Van Montagu, M.; Inzé, D.; Van Camp, W. Catalase is a sink for H2O2 and is indispensable for stress defence in C3 plants. EMBO J. 1997, 16, 4806–4816. [Google Scholar] [CrossRef]
  118. Aghaleh, M.; Niknam, V.; Ebrahimzadeh, H.; Razavi, K. Salt stress effects on growth, pigments, proteins and lipid peroxidation in Salicornia persica and S. europaea. Biol. Plant 2009, 53, 243–248. [Google Scholar] [CrossRef]
  119. Aghaleh, M.; Niknam, V.; Ebrahimzadeh, H.; Razavi, K. Effect of salt stress on physiological and antioxidative responses in two species of Salicornia (S. persica and S. europaea). Acta Physiol. Plant 2011, 33, 1261–1270. [Google Scholar] [CrossRef]
  120. Moghaddam, A.; Larijani, H.R.; Oveysi, M.; Moghaddam, H.R.T.; Nasri, M. Alleviating the adverse effects of salinity stress on Salicornia persica using sodium nitroprusside and potassium nitrate. BMC Plant Biol. 2023, 23, 166. [Google Scholar] [CrossRef] [PubMed]
  121. Slesak, I.; Miszalski, Z.; Karpinska, B.; Niewiadomska, E.; Ratajczak, R.; Karpinski, S. Redox control of oxidative stress responses in the C3-CAM intermediate plant Mesembryanthemum crystallinum. Plant Physiol. Biochem. 2002, 40, 669–677. [Google Scholar] [CrossRef]
  122. Agarie, S.; Kawaguchi, A.; Kodera, A.; Sunagawa, H.; Kojima, H.; Nose, A.; Nakahara, T. Potential of the common ice plant, Mesembryanthemum crystallinum as a new high-functional food as evaluated by polyol accumulation. Plant Prod. Sci. 2009, 12, 37–46. [Google Scholar] [CrossRef]
  123. Ibdah, M.; Krins, A.; Seidlitz, H.K.; Heller, W.; Strack, D.; Vogt, T. Spectral dependence of flavonol and betacyanin accumulation in Mesembryanthemum crystallinum under enhanced ultraviolet radiation. Plant Cell Environ. 2002, 25, 1145–1154. [Google Scholar] [CrossRef]
  124. Guo, J.; Wang, H.; Wang, B. NaCl enhanced the vegetative growth of halophyte Suaeda salsa by improving the ability of antioxidant and osmotic adjustment. IOP Conf. Ser. Earth Environ. Sci. 2019, 237, 052024. [Google Scholar] [CrossRef]
  125. Zang, W.; Miao, R.; Zhang, Y.; Yuan, Y.; Pan, Q.; Zhou, Z. Metabolic and molecular basis for the salt and alkali responses of Suaeda corniculate. Environ. Exp. Bot. 2021, 192, 104643. [Google Scholar] [CrossRef]
  126. Behr, J.H.; Bouchereau, A.; Berardocco, S.; Seal, C.E.; Flowers, T.J.; Zörb, C. Metabolic and physiological adjustment of Suaeda maritima to combined salinity and hypoxia. Ann. Bot. 2017, 119, 965–976. [Google Scholar] [CrossRef]
  127. Hussain, S.; Khalid, M.F.; Hussain, M.; Ali, M.A.; Nawaz, A.; Zakir, I.; Fatima, Z.; Ahmad, S. Role of micronutrients in salt stress tolerance to plants. In Plant Nutrients and Abiotic Stress Tolerance; Hasanuzzaman, M., Fujita, M., Oku, H., Nahar, K., Hawrylak-Nowak, B., Eds.; Springer: Singapore, 2018; p. 363. [Google Scholar] [CrossRef]
  128. Raddatz, N.; Morales de los Ríos, L.; Lindahl, M.; Quintero, F.J.; Pardo, J.M. Coordinated transport of nitrate, potassium, and sodium. Front. Plant Sci. 2020, 11, 247. [Google Scholar] [CrossRef]
  129. Ushakova, S.A.; Kovaleva, N.P.; Gribovskaya, I.V.; Dolgushev, V.A.; Tikhomirova, N.A. Effect of NaCl concentration on productivity and mineral composition of Salicornia europaea as a potential crop for utilization NaCl in LSS. Adv. Space Res. 2005, 36, 1349–1353. [Google Scholar] [CrossRef]
  130. Flowers, T.J.; Hajibagher, M.A.; Yeo, A.R. Ion accumulation in the cell walls of rice plants growing under saline conditions: Evidence for the Oertli hypothesis. Plant Cell Environ. 1991, 14, 319–325. [Google Scholar] [CrossRef]
  131. Moghaieb, R.E.A.; Saneoka, H.; Fujita, K. Effect of salinity on osmotic adjustment, glycine betaine accumulation and the betaine aldehyde dehydrogenase gene expression in two halophytic plants, Salicornia europaea and Suaeda maritima. Plant Sci. 2004, 166, 1345–1349. [Google Scholar] [CrossRef]
  132. Fussy, A.; Papenbrock, J. Molecular analysis of the reactions in Salicornia europaea to varying NaCl concentrations at various stages of development to better exploit its potential as a new crop plant. Front. Plant Sci. 2024, 15, 1454541. [Google Scholar] [CrossRef]
Figure 1. (a) Fresh weight (FW) and (b) dry weight (DW) of ice plant, romeritos, and sea asparagus cultivated under four different rooting media (C = untreated rearing water; pH = rearing water with pH adjustment to 5.5; pH+S = rearing water with pH adjustment to 5.5 and nutrient supplementation; NS = standard nutrient solution + 5 mM NaCl). The values are mean ± SE (n = 4). Different uppercase letters indicate significant differences in total plant weight among treatments, while lowercase letters indicate significant differences within each plant organ among treatments, based on Tukey’s honestly significant difference (HSD) test (p < 0.05).
Horticulturae 11 00623 g001
Figure 2. Transpiration per week of (a) ice plant, (b) romeritos, and (c) sea asparagus cultivated under four different rooting media (C = untreated rearing water; pH = rearing water with pH adjustment to 5.5; pH+S = rearing water with pH adjustment to 5.5 and nutrient supplementation; NS = standard nutrient solution + 5 mM NaCl). The values are mean ± SE (n = 4), *, **, *** mean significant at p < 0.05, 0.01, or 0.001.
Horticulturae 11 00623 g002
Figure 3. Leaf or shoot osmotic potential of ice plant, romeritos, and sea asparagus cultivated under four different rooting media (C = untreated rearing water; pH = rearing water with pH adjustment to 5.5; pH+S = rearing water with pH adjustment to 5.5 and nutrient supplementation; NS = standard nutrient solution + 5 mM NaCl). The values are mean ± SE (n = 4). The different letters on the top of the error bars indicate significant differences among treatments based on Tukey’s honestly significant difference (HSD) test (p < 0.05).
Horticulturae 11 00623 g003
Figure 4. Contribution of ions to the total osmotic potential of ice plant, romeritos, and sea asparagus cultivated under four different rooting media (C = untreated rearing water; pH = rearing water with pH adjustment to 5.5; pH+S = rearing water with pH adjustment to 5.5 and nutrient supplementation; NS = standard nutrient solution + 5 mM NaCl).
Horticulturae 11 00623 g004
Figure 5. (a) Chlorophyll a + b and (b) betalain of ice plant, romeritos, and sea asparagus cultivated under four different rooting media (C = untreated rearing water; pH = rearing water with pH adjustment to 5.5; pH+S = rearing water with pH adjustment to 5.5 and nutrient supplementation; NS = standard nutrient solution + 5 mM NaCl). The values are mean ± SE (n = 4). The different letters on the top of the error bars indicate significant differences among treatments based on Tukey’s honestly significant difference (HSD) test (p < 0.05).
Horticulturae 11 00623 g005
Figure 6. (a) Malondialdehyde (MDA) and (b) hydrogen peroxide content of ice plant, romeritos, and sea asparagus cultivated under four different rooting media (C = untreated rearing water; pH = rearing water with pH adjustment to 5.5; pH+S = rearing water with pH adjustment to 5.5 and nutrient supplementation; NS = standard nutrient solution + 5 mM NaCl). The values are mean ± SE (n = 4). The different letters on the top of the error bars indicate significant differences among treatments based on Tukey’s honestly significant difference (HSD) test (p < 0.05).
Horticulturae 11 00623 g006
Figure 7. Principal component analysis (PCA) per species. Loading plot of the first two principal components for the examined variables of (a) ice plant, (c) romeritos, and (e) sea asparagus. Abbreviations, FW: fresh weight; DW: dry weight; LA: leaf area; SLA: specific leaf area; WC: water content; S: succulence; Chl: chlorophyll a + b; Bet: betalain; Cl: chloride; N O 2 : nitrite; N O 3 : nitrate; P O 4 3 : phosphate; S O 4 2 : sulfate; Oxa: oxalate; Na+: sodium; K+: potassium; Mg2+: magnesium; OP: osmotic potential; MDA: malondialdehyde; H2O2: hydrogen peroxide; CAT: catalase; APX: ascorbate peroxidase; SOD: superoxide dismutase; GR: glutathione reductase). PCA score plots of (b) ice plant, (d) romeritos, and (f) sea asparagus cultivated under four rooting media treatments (C = untreated rearing water; pH = rearing water with pH adjustment to 5.5; pH+S = rearing water with pH adjustment to 5.5 and nutrient supplementation; NS = standard nutrient solution + 5 mM NaCl).
Horticulturae 11 00623 g007
Figure 8. Hierarchical clustering heat map of the variables evaluated in leaves of ice plant (IP) and romeritos (R), and in shoots of sea asparagus (SA), cultivated under four different rooting media (C = untreated rearing water; pH = rearing water with pH adjustment to 5.5; pH+S = rearing water with pH adjustment to 5.5 and nutrient supplementation; NS = standard nutrient solution + 5 mM NaCl). Abbreviations, FW: fresh weight; DW: dry weight; LA: leaf area; SLA: specific leaf area; WC: water content; S: succulence; Chl: chlorophyll a + b; Bet: betalain; Cl: chloride; N O 2 : nitrite; N O 3 : nitrate; P O 4 3 : phosphate; S O 4 2 : sulfate; Oxa: oxalate; Na+: sodium; K+: potassium; Mg2+: magnesium; OP: osmotic potential; MDA: malondialdehyde; H2O2: hydrogen peroxide; CAT: catalase; APX: ascorbate peroxidase; SOD: superoxide dismutase; GR: glutathione reductase.
Horticulturae 11 00623 g008
Table 1. Composition of the rooting media per treatment and species.
Ice PlantRomeritosSea Asparagus
CpHpH+SNS *CpHpH+SNS *CpHpH+SNS *
pH 7.95.55.55.57.85.55.55.58.05.55.55.5
T-NmM5.95.95.94.06.66.66.64.04.64.64.64.0
N O 3 -N4.94.94.94.04.24.24.24.03.73.73.74.0
N O 2 -N----0.10.10.1-0.10.10.1-
N H 4 + -N0.070.070.07-0.050.050.05-0.20.20.2-
P0.20.20.40.40.10.10.40.40.10.10.40.4
K9.059.059.052.09.19.19.12.08.98.98.92.0
Ca1.21.21.21.01.21.21.21.01.061.061.061.0
Mg22.022.022.02.025.425.425.42.023.223.223.22.0
Na262.4262.4262.45.0263.6263.6263.65.0250.6250.6250.65.0
Cl311.6311.6311.65.0307.5307.5307.55.0297.2297.2297.25.0
BµM216.4216.4216.418.0213.8213.8213.818.0209.8209.8209.818.0
Fe--35.035.0--35.035.0--35.035.0
Mn0.60.69.09.00.50.59.09.00.60.69.09.0
Zn--1.01.0--1.01.0--1.01.0
Cu--0.10.1--0.10.1--0.10.1
* Tottori University standard nutrient solution [39].
Table 2. Leaf area, specific leaf area, water content, succulence, and root/shoot ratio of ice plant, romeritos, and sea asparagus cultivated under four different rooting media (C = untreated rearing water; pH = rearing water with pH adjustment to 5.5; pH+S = rearing water with pH adjustment to 5.5 and nutrient supplementation; NS = standard nutrient solution + 5 mM NaCl).
Leaf Area
(cm2 plant−1)
Specific Leaf Area
(cm2 g−1 FW)
Leaf or Shoot Water Content
(g g−1 DW)
Leaf or Shoot Succulence
(g water cm2)
Shoot/Root
Ratio
IceC785.01 ± 47.226.01 ± 0.3040.97 ± 3.710.16 ± 0.0097.30 ± 0.92
plantpH783.90 ± 35.905.49 ± 0.1250.46 ± 9.770.17 ± 0.0035.38 ± 0.89
pH+S737.76 ± 59.105.49 ± 0.3341.17 ± 0.870.18 ± 0.0125.12 ± 0.40
NS1058.17 ± 154.746.71 ± 0.4444.98 ± 3.240.14 ± 0.0097.92 ± 1.90
nsnsnsnsns
RomeritosC1020.72 ± 101.68 a15.23 ± 1.06 b10.28 ± 0.20 a0.06 ± 0.005 a4.31 ± 0.25 bc
pH742.77 ± 73.14 ab14.42 ± 0.34 b6.07 ± 0.50 b0.05 ± 0.002 ab6.60 ± 0.39 a
pH+S623.68 ± 23.90 b15.07 ± 0.75 b5.68 ± 0.12 b0.05 ± 0.003 ab5.68 ± 0.55 ab
NS1025.43 ± 74.19 a19.25 ± 0.85 a9.54 ± 0.42 a0.04 ± 0.002 b3.77 ± 0.12 c
***********
SeaC290.47 ± 1.607.39 ± 0.365.50 ± 0.450.11 ± 0.0066.33 ± 0.67
asparaguspH297.18 ± 40.826.79 ± 0.665.49 ± 0.050.12 ± 0.0156.76 ± 0.27
pH+S270.29 ± 23.776.69 ± 0.245.68 ± 0.170.12 ± 0.0047.28 ± 0.67
NS278.72 ± 51.858.48 ± 0.595.25 ± 0.290.10 ± 0.0085.80 ± 0.05
nsnsnsnsns
The values represent mean ± s.e. (n = 4). Values within columns of each parameter followed by different letters are significantly different based on Tukey’s honestly significant difference (HSD) test (p < 0.05). ns, *, **, *** mean not significant or significant at p < 0.05, 0.01, or 0.001, respectively.
Table 3. Amount of cations ( N a + : sodium, N H 4 + : ammonium, K + : potassium, M g 2 + : magnesium) in leaves or shoots aqueous extracts of ice plant, romeritos, and sea asparagus cultivated under four different rooting media (C = untreated rearing water; pH = rearing water with pH adjustment to 5.5; pH+S = rearing water with pH adjustment to 5.5 and nutrient supplementation; NS = standard nutrient solution + 5 mM NaCl).
N a + N H 4 + K + M g 2 +
mMmMmMmM
IceC217.48 ± 23.38 aN.D.18.58 ± 1.33 b8.54 ± 0.29 a
plantpH215.44 ± 7.27 aN.D.25.01 ± 1.45 b9.23 ± 0.61 a
pH+S229.72 ± 11.67 aN.D.23.46 ± 1.44 b9.66 ± 0.41 a
NS81.94 ± 14.54 b0.72 ± 0.0538.36 ± 2.47 a6.00 ± 0.28 b
*** ******
RomeritosC377.50 ± 51.15 bN.D.24.35 ± 2.57 c23.86 ± 3.35
pH907.11 ± 30.68 a2.36 ± 1.4343.91 ± 2.16 b27.84 ± 2.48
pH+S950.49 ± 50.14 a4.06 ± 1.5166.57 ± 4.40 a34.11 ± 5.59
NS154.59 ± 8.12 c0.24 ± 0.1580.92 ± 5.35 a20.96 ± 1.80
***ns***ns
SeaC827.45 ± 2.85 aN.D.131.62 ± 7.34 b12.60 ± 2.00
asparaguspH796.83 ± 32.27 a2.74 ± 1.63 b96.80 ± 10.18 b13.33 ± 0.89
pH+S770.98 ± 22.34 a2.69 ± 0.97 b101.72 ± 1.80 b15.04 ± 1.39
NS423.96 ± 50.48 b29.24 ± 2.56 a187.81 ± 19.31 a17.05 ± 0.69
*********ns
N.D.: not detected. The values represent mean ± s.e. (n = 4). Values within columns of each parameter followed by different letters are significantly different based on Tukey’s honestly significant difference (HSD) test (p < 0.05). ns and *** mean not significant or significant at p < 0.001, respectively.
Table 4. Amount of anions ( C l : chloride, N O 2 : nitrite, N O 3 : nitrate, P O 4 3 : phosphate, S O 4 2 : sulfate, C 2 H 2 O 4 2 : oxalate) in leaves or shoots of aqueous extracts of ice plant, romeritos, and sea asparagus cultivated under four different rooting media (C = untreated rearing water; pH = rearing water with pH adjustment to 5.5; pH+S = rearing water with pH adjustment to 5.5 and nutrient supplementation; NS = standard nutrient solution + 5 mM NaCl).
C l N O 2 N O 3 P O 4 3 S O 4 2 C 2 H 2 O 4 2
mMmMmMmMmMmM
IceC155.42 ± 17.04 a0.79 ± 0.06 b48.44 ± 4.11 a4.59 ± 0.555.42 ± 0.8934.98 ± 5.30 ab
plantpH217.47 ± 6.73 a1.08 ± 0.2 a51.51 ± 2.97 a4.59 ± 0.187.30 ± 1.0923.10 ± 5.35 b
pH+S200.01 ± 27.68 a0.98 ± 0.6 ab48.43 ± 5.15 a3.57 ± 0.375.27 ± 0.6130.14 ± 3.48 ab
NS58.98 ± 3.40 bN.D.28.68 ± 4.20 b3.51 ± 0.254.13 ± 0.7549.11 ± 7.08 a
******nsns*
RomeritosC442.78 ± 47.12 b2.20 ± 0.1147.30 ± 4.54 a3.01 ± 0.21c1.07 ± 0.0350.59 ± 5.90 a
pH871.04 ± 139.58 a1.43 ± 0.7845.59 ± 8.21 a5.51 ± 0.57 c1.20 ± 0.066.78 ± 0.26 c
pH+S1209.98 ± 81.90 a0.62 ± 0.0755.19 ± 4.82 a18.67 ± 1.98 a1.05 ± 0.036.90 ± 0.31 c
NS346.29 ± 8.19 bN.D.19.48 ± 1.04 b11.12 ± 0.74 b0.90 ± 0.1329.49 ± 4.63 b
***ns*****ns***
SeaC1491.79 ± 62.03 a1.20 ± 0.5629.01 ± 5.318.83 ± 1.90 b0.81 ± 0.05 b19.29 ± 2.46
asparaguspH1310.94 ± 191.92 ab1.49 ± 0.5339.69 ± 5.0013.62 ± 1.39 ab1.56 ± 0.19 a23.12 ± 4.02
pH+S1343.63 ± 207.20 ab0.87 ± 0.3344.10 ± 7.2913.43 ± 2.19 ab1.28 ± 0.18 ab30.68 ± 4.66
NS729.63 ± 70.67 b1.35 ± 0.6355.49 ± 9.1921.88 ± 3.80 a1.07 ± 0.12 ab29.84 ± 4.06
*nsns**ns
N.D.: not detected. The values represent mean ± s.e. (n = 4). Values within columns of each parameter followed by different letters are significantly different based on Tukey’s honestly significant difference (HSD) test (p < 0.05). ns, *, **, *** mean not significant or significant at p < 0.05, 0.01, or 0.001, respectively.
Table 5. Antioxidant enzyme activity of ice plant, romeritos, and sea asparagus cultivated under four different rooting media (C = untreated rearing water; pH = rearing water with pH adjustment to 5.5; pH+S = rearing water with pH adjustment to 5.5 and nutrient supplementation; NS = standard nutrient solution + 5 mM NaCl).
CAT *1
(mmol H2O mg−1 Protein min−1)
APX *2
(mmol ASC mg−1 Protein min−1)
SOD *3
(unit mg−1 Protein min−1)
GR *4
(mmol NADPH mg−1 Protein min−1)
IceC203.15 ± 17.620.34 ± 0.07 ab62.73 ± 2.04 a0.39 ± 0.03 a
plantpH165.22 ± 7.470.37 ± 0.06 ab42.54 ± 9.96 ab0.37 ± 0.06 a
pH+S241.44 ± 42.680.50 ± 0.13 a35.46 ± 4.87 b0.17 ± 0.07 ab
NS207.41 ± 49.390.12 ± 0.01 b40.63 ± 2.57 ab0.13 ± 0.01 b
ns*****
RomeritosC85.90 ± 7.35 a0.15 ± 0.01 ab18.70 ± 3.32 ab0.12 ± 0.007 a
pH57.07 ± 7.45 ab0.26 ± 0.04 a24.07 ± 3.53 a0.04 ± 0.002 b
pH+S43.27 ± 11.57 b0.27 ± 0.02 a23.55 ± 1.91 a0.08 ± 0.029 ab
NS31.41 ± 8.02 b0.07 ± 0.03 b9.06 ± 1.50 b0.03 ± 0.015 b
*******
SeaC40.34 ± 5.860.08 ± 0.0047.25 ± 0.65 a0.05 ± 0.011
asparaguspH54.77 ± 7.600.04 ± 0.0113.63 ± 0.43 bc0.07 ± 0.006
pH+S30.80 ± 2.720.08 ± 0.0195.88 ± 1.06 ab0.03 ± 0.006
NS43.24 ± 8.690.05 ± 0.0141.06 ± 0.10 c0.05 ± 0.008
nsns***ns
*1 CAT: catalase; *2 APX: ascorbate peroxidase; *3 SOD: superoxide dismutase; *4 GR: glutathione reductase. The values represent mean ± s.e. (n = 4). Values within columns of each parameter followed by different letters are significantly different based on Tukey’s honestly significant difference (HSD) test (p < 0.05). ns, *, **, *** mean not significant or significant at p < 0.05, 0.01, or 0.001, respectively.
Disclaimer/Publisher’s Note: The statements, opinions and data contained in all publications are solely those of the individual author(s) and contributor(s) and not of MDPI and/or the editor(s). MDPI and/or the editor(s) disclaim responsibility for any injury to people or property resulting from any ideas, methods, instructions or products referred to in the content.

