Abstract
Strawberry anthracnose caused by Colletotrichum siamense threatens global strawberry production. Traditional chemical control faces environmental and safety challenges, making resistant cultivar development critical for sustainability. This study aimed to rank 10 cultivars’ resistance to C. siamense Cs.4J and clarify temporal redox and transcriptomic drivers of resistance. We evaluated resistance using the disease index (DI), observed oxidative stress indicators [peroxidase (POD), hydrogen peroxide (H2O2), malondialdehyde (MDA), catalase (CAT)], and conducted Kyoto Encyclopedia of Genes and Genomes (KEGG) pathway analysis and weighted gene coexpression network analysis (WGCNA). Significant resistance differences emerged: ‘Tianxianzui’ (TXZ) was resistant (DI 10.0–20.0%), while ‘Miaoxiang7’ (MX7) was highly susceptible (DI > 50%). ‘MX7’ showed sustained POD overactivation, progressive H2O2 accumulation, and high MDA (severe oxidative damage); ‘TXZ’ maintained redox balance via earlier CAT activation. KEGG identified 5 key pathways (e.g., phenylpropanoid biosynthesis), and Weighted Gene Co-expression Network Analysis (WGCNA) revealed 2 core modules (resistance-related red, susceptibility-related brown) plus 2 hub genes (FvRNF144B-like [Fragaria vesca RING Finger Protein 144B-like], FaPHR1-like [Fragaria × ananassa PHR1-like]). ‘TXZ’ and ‘MX7’ represent resistant/susceptible cultivars; early CAT activation for redox balance is a key resistance trait. The 5 pathways and 2 hub genes provide a theoretical basis for future functional validation and exploring strawberry–C. siamense interaction mechanisms.
1. Introduction
Strawberry cultivation is global and expanding, with China now the leading producer and consumer []. A major threat to this global production system is strawberry anthracnose, which is caused by Colletotrichum spp. and ranks among the most destructive diseases of strawberries. It inflicts heavy losses by impairing both crop yield and fruit quality across growing regions [,,].
The disease thrives in warm, humid environments—conditions that accelerate pathogen dissemination—and can infect multiple strawberry tissues, including leaves, runners, petioles, petals, and fruits. Infected plants exhibit distinct symptoms, such as leaf spotting, crown rot, and fruit rot []. Compounding management difficulties, Colletotrichum spp. persist in soil and plant residues, establishing long-term infestations that are challenging to eliminate. Under optimal environmental conditions, the fungus produces large quantities of conidia; these spores are dispersed via rain, wind, and irrigation, triggering secondary infections that escalate into widespread disease outbreaks [].
Chemical fungicides have traditionally been used for controlling strawberry anthracnose; they work well and are easy to apply. However, increasing concerns over food safety and environmental sustainability have put a damper on their use in agriculture []. Moreover, the overuse of these fungicides has caused Colletotrichum spp. to develop tolerance, increasing the difficulty of managing the disease [].
Previous studies have tested the anthracnose resistance of dozens of strawberry varieties and have revealed large differences in the susceptibility of different cultivars [,]. Even so, no cultivated strawberry variety has proven completely immune to the disease. This underscores just how complex the host–pathogen interaction is—and why more research is needed. In China, where strawberry production is a major agricultural activity, there is an urgent need to assess anthracnose resistance in local strawberry germplasms. These evaluations could provide valuable clues for selecting and breeding resistant varieties and clearing a path toward more sustainable strawberry farming.
Recent research on plant–pathogen interactions across different crops has revealed conserved molecular mechanisms for fighting pathogens. In tomatoes (Solanum lycopersicum), mitogen-activated protein kinase (MAPK) signaling cascades coordinate the activation of defense responses [,]. In rice (Oryza sativa), phenylpropanoid biosynthesis bolsters both structural and chemical defenses [,]. For strawberries specifically, research has pinpointed FaNPR3 as a negative regulator of WRKY transcription factors; silencing this gene increases resistance to Colletotrichum spp. []. Parallel work in tea (Camellia sinensis) has shown that the CsMYB72-CsPR10-9 module helps balance salicylic acid (SA)/jasmonic acid (JA) hormone signaling to optimize immune responses []. Notably, homologous MYB transcription factors and PR genes in Fragaria × ananassa are also involved in SA/JA crosstalk and oxidative stress regulation during C. siamense infection, suggesting conservation of this regulatory module in strawberry anthracnose resistance. Epigenetic changes also play a role; for example, MTA1-mediated m6A RNA methylation in Magnaporthe oryzae (rice blast fungus, responsible for rice blast disease) regulates autophagy and is essential for the pathogen’s virulence []. Although direct evidence in Fragaria × ananassa is limited, m6A RNA methylation has been linked to stress responses in Rosaceae species and may similarly modulate strawberry–C. siamense interactions by regulating host defense gene expression or pathogen colonization efficiency. These findings highlight the potential of tweaking these conserved regulatory networks to improve crop traits and suggest that we could target epigenetic mechanisms to increase anthracnose resistance in strawberries, either through molecular breeding or gene editing.
In this study, we evaluated the resistance of 10 strawberry varieties to C. siamense. After the plants were inoculated with C. siamense, we analyzed differences in disease severity, cytological responses, and transcriptomic changes between resistant and susceptible varieties. These results may help to elucidate the molecular mechanisms underlying resistance and identify precisely potential candidate genes involved in the defense response to anthracnose. Ultimately, this research supports the greater goal of creating anthracnose-resistant strawberry varieties via molecular breeding.
2. Materials and Methods
2.1. Plant Materials
In this study, 10 strawberry varieties were tested, including 9 octoploid varieties and 1 decaploid variety (Table 1). All strawberry seedlings used in the experiment were provided by the Ningbo Academy of Agricultural Sciences, Zhejiang Province. Twenty seedlings of each cultivar were planted in pots with a 13 cm inner diameter, using a mixed substrate of peat, perlite, and vermiculite at a 3:1:1 volume ratio. All the seedlings were cultivated in a climate chamber at the College of Agriculture and Biotechnology, Zhejiang University (Hangzhou, Zhejiang Province, China), under controlled environmental conditions: a day/night temperature regime of 25 °C/22 °C, a relative humidity ranging from 70% to 80%, and a 14 h photoperiod. This study did not involve any wild plant species, and all materials were obtained from cultivated sources. The experimental research complied with the relevant institutional guidelines.

Table 1.
Strawberry varieties.
2.2. Isolation of Strawberry Anthracnose Isolate Cs.4J
The Colletotrichum siamense isolate Cs.4J was obtained from anthracnose-infected leaves of ‘Mengzhifu’ (collected in Ningbo, Zhejiang Province, China: 30.307589° N, 120.195549° E). For pathogen isolation, 10 symptomatic leaves were selected, and 0.5 cm × 0.5 cm tissue fragments were excised from the boundary between diseased and healthy areas. These fragments were surface sterilized by sequential treatment with 75% ethanol (0.5 min) and 3% NaOCl (2 min), followed by three rinses with sterile distilled water. After air-drying, the sterilized tissues were plated on potato dextrose agar (PDA) and incubated in the dark at 25 °C for 5 days. Once colonies emerged, purification was performed three times. The purified Cs.4J mycelium was preserved in 50% glycerol solution at −80 °C.
2.3. Sequence Amplification of Cs.4J rDNA
Genomic DNA was extracted via the Cetyltrimethylammonium Bromide (CTAB) method []. The fungal Internal Transcribed Spacer (ITS) region was amplified via Polymerase Chain Reaction (PCR) with the universal primers ITS1 and ITS4 []. For further confirmation of the pathogenic fungal species, the β-microtubulin gene (TUB) was amplified using primers T1 and Bt2b, the calmodulin gene (CAL) using primers CL1C and CL2C, the actin gene (ACT) using primers ACT-512F and ACT-783R, and the chitin synthase A gene (CHS-1) using primers CHS-79F and CHS-354R (Table 2) [,,,]. The PCR products were sequenced and BLASTed against the NCBI BLAST database (https://blast.ncbi.nlm.nih.gov/Blast.cgi, accessed on 13 January 2024) to identify the pathogenic fungal species.

Table 2.
Primers used in the study with sequences and sources.
2.4. Pathogenicity Assay of Cs.4J
Mycelia were cultured on potato dextrose broth (PDB) and shaken for 7 days at a speed of 100 rpm to induce conidiation. A conidial suspension (1.5 × 10⁶ spores/mL) was subsequently inoculated onto the fourth newly grown leaves of healthy strawberries using the spray inoculation method. For each strawberry variety, six leaves were selected for the experiment. These inoculated strawberry plants were grown in a climatic chamber (25 °C (day)/22 °C (night); 70% to 80% relative humidity; 14 h photoperiod). To clarify the pathogenic link between the phytopathogen and strawberry anthracnose, we adhered to Koch’s postulates by reisolating the phytopathogens from the junction of symptomatic and asymptomatic tissues. Five days post-inoculation (dpi), disease spots were observed and photographed, with lesion diameter and expansion dynamics recorded systematically. The phylogenetic identity of the reisolated strains was confirmed by sequencing the ITS region.
2.5. Statistical Disease Index and Incidence
To evaluate disease resistance, all strawberry plants were grown under uniform conditions. For each cultivar, 12 healthy leaves were selected, with 1 leaf collected from each of 12 independent seedlings to avoid pseudoreplication. These 12 seedlings were first randomized in the climate chamber and then assigned to 3 experimental trays following a randomized complete block design (RCBD)—each tray served as a block to minimize microenvironmental variation across the chamber. Leaf selection from each seedling was standardized and randomized to eliminate sampling bias.
Detached leaves were used for accuracy and efficiency: (1) They eliminate plant-level confounders (e.g., nutrient transport, root activity) that obscure cultivar-specific resistance; (2) Their flat surfaces enable uniform spore coverage (avoiding overlap/shading in intact plants); (3) They support efficient phenotyping (less space, unobstructed lesion observation/ImageJ measurement).
Nine of the 12 leaves (petioles wrapped in sterile water-moistened cotton for humidity) were sprayed with 15 mL of 1.5 × 10⁶ spores/mL anthracnose suspension (spread to coat both adaxial/abaxial surfaces); the remaining 3 were treated with sterile water as controls. No technical replicates were included (biological variation was prioritized). After 3–5 min of drying, leaves were sealed with parafilm and incubated (25 °C day/22 °C night, 70–80% RH, 14 h photoperiod). Disease progression was monitored daily, with lesion photography at 24, 48, or 120 hpi (upon significant spot emergence).
The disease indices and incidences of 10 strawberry cultivars were determined at 11 dpi. Disease severity was evaluated via an anthracnose grading system adapted from Wang [], as detailed in Table 3. Lesion areas were measured with ImageJ 1.8.0 software (National Institute of Mental Health, Bethesda, MD, USA). The disease resistance level of each cultivar was subsequently classified according to the criteria specified in Table 4 []. Statistical analyses were performed using GraphPad Prism 10.1.2. Differences in disease index and lesion area among multiple cultivars were analyzed by one-way analysis of variance (ANOVA) followed by Duncan’s multiple range test for post hoc comparisons. A significance level (α) was set at 0.05, and p-values were adjusted for multiplicity via Duncan’s method. The letter labeling method used in figures to indicate significant differences was consistent with the results of the ANOVA and post hoc test.

Table 3.
Criteria for classifying disease grade.

Table 4.
Criteria for classifying resistance in strawberry.
Strawberry resistance classification followed the criteria outlined in Table 3, with ratings determined by disease index values. The disease incidence and index were calculated via Formulas (1) and (2), respectively:
Disease incidence (%) = (NDL/NIL) × 100
Disease index (%) = Σ(NDLDG × SLDS)/NIL × MDG) × 100
Note: NDL (number of diseased leaves), NIL (number of inoculated leaves), NDLDG (number of diseased leaves in each disease grade), SLDS (scale level of disease grade), and MDG (maximum disease grade).
2.6. Morphological and Histological Observations
According to the results of the disease resistance evaluation, the resistant variety ‘TXZ’ and the susceptible variety ‘MX7’ were selected for infection progression observation via Trypan blue staining. Trypan blue was dissolved in a mixed solution of ethanol, phenol, water, and lactic acid at a volume ratio of 2:1:1:1 (ethanol:phenol:water:lactic acid). At 0, 6, 12, 24, 48, and 120 h after Cs.4J inoculation, the harvested strawberry leaves were soaked in Trypan blue staining solution, heated for 5 min, and subsequently moved to a 2.5 g/mL saturated chloral hydrate solution. This process was continued until the leaf tissues were transparent. The decoloured leaves were then photographed and observed under a Leica DM2500.
2.7. Measurements of Antioxidant Enzyme Activities and Oxidative Stress Biomarkers in Pathogen-Infected Plant Leaves
Leaf samples at 0, 12, 24, 48, and 120 hpi were collected, and superoxide dismutase (SOD), CAT, POD, MDA and H2O2 were measured. Approximately 0.1 g of leaf tissue was homogenized in 1 mL of extraction buffer under ice-cold conditions. The activities of SOD, CAT, and POD, as well as the concentrations of MDA and H2O2, were measured using commercial assay kits from Solarbio (Beijing, China) with the following product catalog numbers: SOD assay kit (Cat: BC0175), CAT assay kit (Cat: BC0205), POD assay kit (Cat: BC0095), MDA assay kit (Cat: BC0025), and H2O2 assay kit (Cat: BC3595). Absorbance was determined using a microplate reader. The activities of SOD, CAT, and POD were normalized against leaf fresh weight (FW) and expressed as units per gram of fresh weight (U/g FW). For MDA and H2O2, their concentrations were quantified via standard curves and presented as nanomoles per gram of fresh weight (nmol/g FW) and micromoles per gram of fresh weight (μmol/g FW), respectively. Three biological replicates ( n = 3) were set up for each time point (each replicate derived from an independent seedling) to ensure result reliability. No technical replicates were included for enzyme activity and biomarker measurements. Statistical analyses were performed using GraphPad Prism 10.1.2. Differences between ‘TXZ’ and ‘MX7’ across time points were analyzed by repeated-measures two-way ANOVA (factors: cultivar and time) followed by Tukey’s honest significant difference (HSD) test for post hoc pairwise comparisons. A significance level (α) was set at 0.05, and p-values were adjusted for multiplicity via the Tukey method. Symbols indicating significant differences in the figures correspond to the adjusted p-values from the post hoc test.
2.8. Transcriptome Sequencing of Resistant and Susceptible Varieties
‘TXZ’ (resistant variety) and ‘MX7’ (susceptible variety) were selected for transcriptome sequencing due to their marked differences in anthracnose resistance phenotypes, which facilitates the investigation of molecular mechanisms underlying resistance. The inoculation method was described in Section 2.5. For each variety, three leaves were collected and immediately flash-frozen in liquid nitrogen. These samples were labeled the 0 h (0 h) time point and stored at −80 °C, with three biological replicates prepared per variety. The remaining leaves in the tray were sealed with cling film and incubated under controlled conditions. Subsequent sampling was performed at 24, 48, and 120 hpi, with three biological replicates collected at each time point. All the frozen samples were subsequently delivered to Shanghai Meiji Bioinformatics Co., Ltd. (https://www.majorbio.com/, Shanghai, China), for RNA sequencing (RNA-seq) analysis.
Total RNA was extracted from the leaves of ‘TXZ’ and ‘MX7’ via the Plant Total RNA Extraction Kit (OMEGA, Bienne, Switzerland). The RNA quality was assessed via agarose gel electrophoresis and a NanoDrop spectrophotometer (Nano300,Allsheng Instruments Co., Ltd., Hangzhou, China). The RNA libraries were prepared according to the manufacturer’s protocol, with sequencing conducted on the Illumina NovaSeq 6000 platform to generate raw data. The raw reads were processed via fastx_toolkit_0.0.14, SeqPrep, Sickle, and fastp 0.19.5 to filter out low-quality sequences and adapters, yielding high-quality clean reads. These sequences were aligned to the strawberry reference genome (https://www.rosaceae.org/species/fragaria_x_ananassa/genome_v1.0.a1, accessed on 15 July 2024) via HISAT2 (http://daehwankimlab.github.io/hisat2/, accessed on 11 August 2024). The alignment results were used for downstream gene expression analysis.
Transcriptome sequencing and analysis were performed by Shanghai Meiji Bioinformatics Co., Ltd. (Shanghai, China). Gene expression levels were quantified via the use of transcripts per million (TPM) values. Pearson correlation coefficients were calculated to assess the reproducibility of the biological replicates. Principal component analysis (PCA) was performed to evaluate the transcriptional differences between resistant and susceptible varieties at different time points postinoculation. Differentially expressed genes (DEGs) were identified via DESeq2, with a significance threshold of |log2-fold change| > 1 and adjusted p value < 0.05.
2.9. WGCNA
WGCNA of the transcriptome data was performed in R. First, pairwise correlations among all the genes were calculated to generate a similarity matrix, which was then converted into an adjacency matrix—with a soft threshold (β) applied to amplify strong correlations and weaken weak correlations. This adjacency matrix was used to construct a topological overlap matrix, enabling the calculation of intergene distances. These distances supported hierarchical clustering tree building and gene module delineation via dynamic tree pruning.
After WGCNA, target structural genes and transcription factors within the same modules were identified. Pearson correlation coefficients between these genes were further computed in R on the basis of their relative expression levels. Notably, WGCNA was focused on identifying modules linked to disease resistance and susceptibility, with the following parameters: soft threshold (β) = 18, minimum number of genes per module (minModuleSize) = 30, minimum module membership-eigengene correlation (minKMEtoStay) = 0.3, and module merging threshold (mergeCutHeight) = 0.25.
For hub gene identification in the key modules, Connectivity (within-module connectivity) was used as the core criterion. Connectivity was computed as the sum of adjacency weights between a gene and all other genes in the module, reflecting the strength of coexpression relationships with other genes in the same module.
2.10. Real-Time Quantitative PCR
Total RNA extracted from the strawberry (Fragaria × ananassa) transcriptome was reverse transcribed to cDNA for real-time quantitative PCR (RT–qPCR). First-strand cDNA was synthesized from 1 µg of total RNA via a Vazyme (China) reverse transcription kit with random hexamer primers. RT–qPCRs, which included a cDNA template and gene-specific primers in SYBR Green mix (Vazyme), were run in three technical replicates per biological sample on a LightCycler 480 II instrument (Roche, Switzerland). The thermal cycling conditions were as follows: initial denaturation at 95 °C for 30 s, followed by 40 cycles of denaturation at 95 °C for 5 s and annealing at specific temperatures (e.g., 60 °C) for 30 s, with final melting curve analysis (65–95 °C, 0.5 °C increment every 5 s). Relative gene expression was calculated via the 2−ΔΔCt method, with Glyceraldehyde-3-phosphate dehydrogenase (GAPDH) as the internal reference for data normalization. For each cultivar (‘TXZ’/‘MX7’) and time point (0/24/48/120 hpi), three biological replicates were included—each biological replicate was derived from an independent strawberry seedling, consistent with the transcriptome sampling design to avoid pseudoreplication. The primer sequences are provided in Table S1.
3. Results
3.1. Classification Status of Pathogenic Fungi
The sequencing results revealed that the ITS sequence shared 99.81% similarity with that of Colletotrichum siamense (accession number: OL653146.1) in the NCBI database. Following PCR amplification and sequencing of the CAL, GAPDH, CHS-1, ACT, and TUB genes, comprehensive analysis of multigene data confirmed that strain Cs.4J was identified as C. siamense, which belongs to the Colletotrichum gloeosporioides species complex.
This study conducted morphological observations of purified Cs.4J. On PDA incubated at 25 °C for 7 days, strain Cs.4J developed fluffy, dense colonies with grayish-white aerial hyphae (Figure 1a). Mycelial fragments of this isolate were subsequently transferred to liquid PDB and incubated under shaking conditions for 7 days. Microscopic examination revealed cylindrical, hyaline, aseptate conidia (13.7–18.8 μm × 4.3–5.8 μm) with rounded ends; these aseptate, fusiform conidia were consistent with the typical morphological characteristics of C. siamense (Figure 1b). Inoculation of healthy strawberry leaves with Cs.4J induced the development of typical anthracnose symptoms (brown sunken lesions) within 5 days. Furthermore, the reisolated strain from infected leaves presented ITS sequences identical to those of the original isolate, confirming its pathogenicity (Figure 1c).
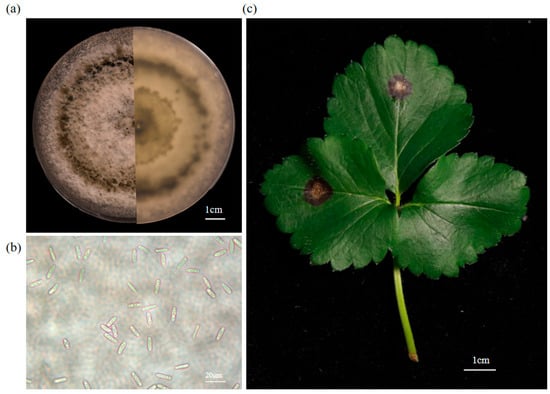
Figure 1.
Characterization of the morphology and pathogenicity of Cs.4J. (a) Cs.4J was isolated from diseased strawberry plants and purified through three rounds of purification. (b) Spore suspension prepared by subculturing Cs.4J mycelia in PDB for 7 days, observed under a light microscope; scale bar. (c) Two strawberry compound leaves were plug-inoculated with Cs.4J mycelial agar plugs, resulting in the formation of concentric, ring-shaped, brown, and depressed lesions. In contrast, the control leaf (plug-inoculated with PDA medium alone) remained asymptomatic.
3.2. Resistance of Different Strawberry Varieties to Cs.4J
The disease indices of 10 strawberry cultivars were measured at 11 dpi, and the results revealed that the resistance of different strawberry varieties to Cs.4J significantly differed (Figure 2, Table 5). Among the S varieties, ‘MX7’ was selected over ‘FY1’ due to its more representative and stable susceptible phenotype, which allows for a clearer contrast with resistant genotypes. Specifically, the disease indices of ‘FY1’ and ‘MX7’ exceeded 50%, classifying them as S strawberries; three varieties (‘NY’, ‘ZJ’, and ‘XQX’) with disease indices ranging from 30% to 50% were categorized as MS; and four varieties (‘HZZ’, ‘XLX’, ‘HY’, and ‘TX’) with disease indices between 20% and 30% were designated as MR. Notably, ‘TXZ’ was classified as a R strawberry genotype, characterized by nearly invisible lesions and a DI of 14.81 ± 3.703 d. Consequently, ‘MX7’ and ‘TXZ’ were selected as representative varieties for downstream analysis. Their pronounced phenotypic divergence ensures that subsequent investigations can effectively elucidate the molecular mechanisms underlying anthracnose resistance.
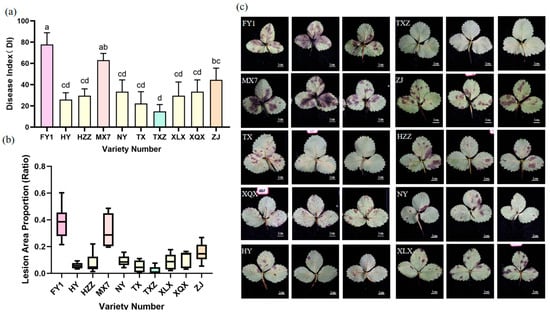
Figure 2.
Comparison of lesion sizes and disease severity induced by inoculation with Cs.4J on leaves of different strawberry varieties. (a) Statistical analysis of DI on leaves of 10 strawberry varieties following inoculation with Cs.4J. Each data point represents the mean ± 95% confidence interval (95% CI) of three biological replicates (n = 3). Statistical analysis was performed using a unified method of one-way ANOVA followed by Duncan’s multiple range test for post hoc comparisons (p < 0.05). Different lowercase letters above the bars indicate significant differences. (b) Distribution of lesion area proportion (ratio of diseased area to total leaf area) among 10 distinct strawberry varieties at 11 dpi, visualized by box plots. Box plots display the median (center line), interquartile range (box), and 95% CI (whiskers) to illustrate data distribution characteristics. Statistical analysis was consistent with (a) (one-way ANOVA + Duncan’s multiple range test. (c) Representative leaf symptoms of 10 strawberry varieties at 11 dpi, showing the phenotypic variation in lesions.

Table 5.
Disease rates, indices and resistance rates of 10 strawberry varieties.
3.3. Microscopic Analysis of the Interaction of Cs.4J with ‘TXZ’ and ‘MX7’
At 0 hpi with Cs.4J, initial infection structures were observed on the leaf surfaces of both the ‘TXZ’ and ‘MX7’ strawberry cultivars. In both cultivars, individual scattered conidia (Co) were detected, with no obvious infection-related structures present in the surrounding tissues, and no typical infection structures had yet formed. By 6 hpi, conidia began to germinate and form germ tubes (Gts), with increasing numbers of these structures extending radially. At 12 hpi, infection structures exhibited stage-specific progression: the short germ tubes further elongated to form primary hyphae (Ph), which attached to the host epidermal cells. By 24 hpi, infection structures on strawberry leaves had become more complex: hyphal networks expanded from the initial inoculation sites, penetrated the epidermis and entered the mesophyll tissue. Appressoria (Ap) formed densely in the infected areas, developing into clustered structures that enclosed host cells (Figure 3).
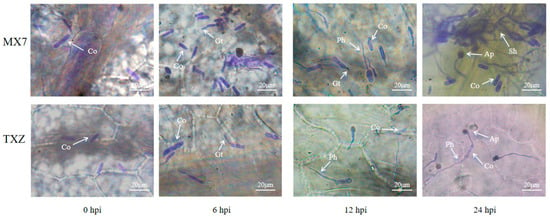
Figure 3.
Progression of Cs.4J infection in ‘TXZ’ and ‘MX7’. Nonwounding foliar inoculation of ‘TXZ’ and ‘MX7’ strawberry leaves via spray application of a Cs.4J conidial suspension, with infection progression photographed at 0, 6, 12, and 24 hpi. (Co: conidium; Ph: primary hypha; Ap: appressorium; Gt: germination tube; Sh: secondary hypha).
3.4. Comparative Oxidative Stress Responses and Antioxidant Defense Mechanisms in ‘TXZ’ and ‘MX7’ Infected with Cs.4J
To comprehensively evaluate the oxidative response to Cs.4J infection, we quantified the SOD, CAT, and POD activities; MDA content; and H2O2 accumulation in the ‘MX7’ and ‘TXZ’ strawberry cultivars at 0, 12, 24, 48, and 120 hpi. The temporal analysis of SOD activity in ‘MX7’ and ‘TXZ’ revealed distinct trends: at 0 hpi, ‘TXZ’ presented significantly greater SOD activity than did ‘MX7’ (p < 0.05), while both strains maintained stable and statistically similar activity levels between 12 and 24 hpi (ns). Subsequently, ‘MX7’ exhibited a marked and biologically meaningful increase in SOD activity at 48 hpi, surpassing ‘TXZ’ with extremely high statistical significance (p < 0.0001). This elevated activity persisted, maintaining a statistically and biologically significant difference at 120 hpi (p < 0.01). These findings indicate a pronounced divergence in their enzymatic responses to Cs.4J infection over time, with ‘MX7’ demonstrating a delayed yet robust SOD activation relative to ‘TXZ’ (Figure 4a).
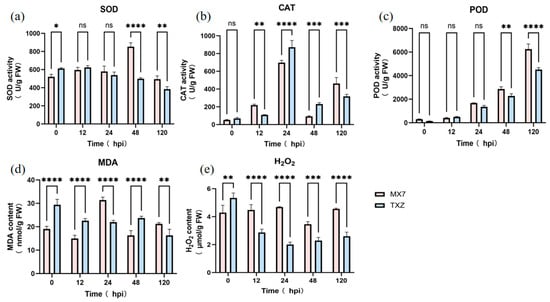
Figure 4.
Effects of Cs.4J on the SOD, CAT, POD, and contents of MDA and H2O2 in strawberry varieties with different resistance levels. (a–c) SOD, CAT, and POD activities in ‘MX7’ and ‘TXZ’. (d,e) MDA and H2O2 contents in ‘MX7’ and ‘TXZ’. Mean ± SD of three biological replicates (n = 3). Statistical analysis was performed using repeated-measures two-way ANOVA (factors: cultivar and time) followed by Tukey’s HSD test for post hoc pairwise comparisons (p-values adjusted for multiplicity via Tukey’s method). ns, p > 0.05; *, p ≤ 0.05; **, p ≤ 0.01; ***, p ≤ 0.001; ****, p ≤ 0.0001.
Critical divergence emerged in hydrogen peroxide metabolism. CAT activity peaked earlier in ‘TXZ’ at 24 hpi (958.4 nmol/min/g), significantly exceeding ‘MX7’s’ concurrent level (727.1 nmol/min/g). Notably, ‘MX7’ displayed delayed CAT activation, reaching 513.2 nmol/min/g only at 120 hpi. This temporal disparity coincided with compensatory POD upregulation in ‘MX7’, where POD activity increased to 6684.0 U/g at 120 hpi, markedly surpassing ‘TXZ’s maximum POD activity (4664.0 U/g). Elevated POD levels were observed earlier in ‘MX7’ than in ‘TXZ’, becoming significantly greater at 48 hpi, with activity ranging from 2724.0 to 3080.0 U/g versus ‘TXZ’s’ 2148.0 to 2484.0 U/g, demonstrating chronic oxidative burden (Figure 4b,c).
Oxidative damage biomarkers confirmed these physiological distinctions []. The accumulation of MDA in the susceptible ‘MX7’ strain (30.2–32.7 nmol/g) at 24 hpi confirmed increased membrane lipid peroxidation. Sustained H2O2 accumulation in ‘MX7’ increased at 4.6 μmol/g by 120 hpi, which was almost twice the ‘TXZ’ maximum level (2.6 μmol/g) (Figure 4d,e). These findings collectively demonstrated that the compensatory POD upregulation of the susceptible cultivar failed to prevent exacerbated oxidative damage [,].
3.5. Transcriptome Sequencing Data Statistics
To investigate the potential molecular mechanism associated with anthracnose resistance, a comprehensive analysis of gene expression dynamics in strawberry leaves following inoculation with C. siamense was conducted. Transcriptome sequencing was conducted on 24 samples, which comprised three biological replicates for each of the resistant cultivar ‘TXZ’ and highly susceptible cultivar ‘MX7’ at four time points: 0 h, 24 hpi, 48 hpi, and 120 hpi (when disease spots first appeared). Specifically, the sample set was structured as 2 cultivars × 4 time points × 3 biological replicates, ensuring systematic coverage of gene expression profiles across resistant and susceptible genotypes during the infection process.
We generated transcriptome data from 24 samples, yielding a total of 160.67 Gb of clean reads, with each individual sample producing no less than 6.01 Gb of clean data. The key quality metrics further confirmed the reliability of the data: the GC content was greater than 45%, the error rate was approximately 0.02%, and the proportions of bases with Q20 (error probability < 1%) and Q30 (error probability < 0.1%) scores exceeded 98.90% and 96.44%, respectively. These metrics clearly show that the transcriptome data are high enough in quality to support all subsequent analyses, including WGCNA, for which the scale independence (Figure S1) and mean connectivity (Figure S2) were validated to ensure robust network construction.
The detailed sequencing statistics are provided in Table 6. For clarity, ‘TXZ’ denotes samples from the anthracnose-resistant cultivar ‘TXZ’, whereas ‘MX7’ refers to samples from the susceptible cultivar ‘MX7’. Each sample group included three biological replicates to ensure reproducibility of the results (Table S2).

Table 6.
Sequencing data statistics.
The clean reads were aligned to the reference genome (https://www.rosaceae.org/species/fragaria_x_ananassa/genome_v1.0.a1, accessed on 15 August 2024), with an average of 91.17% successfully mapped to the strawberry reference genome. Among these, an average of 15.57% of the clean reads were multimapped to the reference genome, whereas an average of 75.60% were uniquely mapped.
3.6. Gene Expression Level Analysis and Sample Correlation Analysis
Hierarchical clustering and Pearson correlation coefficient analyses (Figure 5a) jointly validated the data reliability: triplicate biological replicates (e.g., TXZ_0h-1/2/3, MX7_0h-1/2/3) formed tight distinct clusters with R2 > 0.99, confirming the exceptional reproducibility of the transcriptomic data. Principal component analysis (PCA), as shown in Figure 5b, revealed tight clustering of biological replicates within identical timepoints per cultivar, confirming exceptional experimental reproducibility. Notably, the resistant ‘TXZ’ and susceptible ‘MX7’ cultivars presented pronounced transcriptional divergence at 0, 24, and 48 hpi, indicating robust pathogen-induced transcriptional reprogramming. To focus on early divergent responses, we pre-specified the 0–48 hpi timepoints for subsequent differential expression analysis. Gene expression levels in the boxplot were quantified using Fragments Per Kilobase of transcript per Million mapped reads (FPKM)—a common metric for normalizing transcriptomic data to account for transcript length and sequencing depth. Boxplot analysis (Figure 5c) revealed both the dispersion of FPKM-based gene expression distributions within individual samples and enabled cross-sample comparisons of global expression patterns.
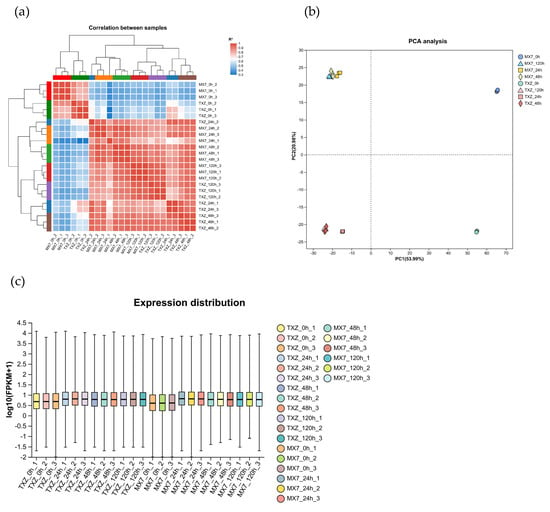
Figure 5.
Validation of transcriptome data reproducibility and sample analysis. (a) Sample correlation heatmap. (b) PCA: Samples from the same cultivar (‘TXZ’/’MX7’) at identical time points cluster tightly in the principal component space. (c) Gene expression distribution boxplot: the transformed log10(FPKM + 1) expression levels exhibit consistent distribution ranges across all samples, with medians clustered between 2–3 log10 units and low dispersion, confirming that data stability is suitable for downstream analysis.
3.7. Differential Expression Gene Screening
We identified 25,143 DEGs (|log2FC| > 1, adj. p < 0.05): 12,715 up- and 12,428 down-regulated across contrasts. Venn analysis revealed 3889 DEGs common to all timepoints and time-specific sets (0 h: 3597; 24 h: 1612; 48 h: 2119). Additionally, 3889 DEGs were shared among all three comparison groups, with 840 DEGs shared between TXZ-0 h-vs-MX7-0 h and TXZ-24 h-vs-MX7-24 h but absent in TXZ-48 h-vs-MX7-48 h, 572 DEGs shared between TXZ-0 h-vs-MX7-0 h and TXZ-48 h-vs-MX7-48 h but absent in TXZ-24 h-vs-MX7-24 h, and 1662 DEGs shared between TXZ-24 h-vs-MX7-24 h and TXZ-48 h-vs-MX7-48 h but absent in TXZ-0 h-vs-MX7-0 h. To further investigate genes potentially associated with disease resistance, we selected DEGs identified in the TXZ-0 h-vs-MX7-0 h, TXZ-24 h-vs-MX7-24 h, and TXZ-48 h-vs-MX7-48 h comparison groups, along with the shared set of 1662 DEGs exhibiting expression differences at both 24 h and 48 h (but absent at 0 h), for subsequent analyses (Figure 6).
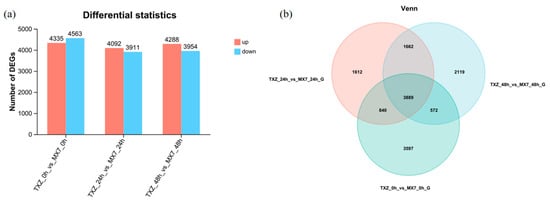
Figure 6.
Differential gene expression analysis. (a) Statistical analysis of DEGs: The bar graph illustrates the number of DEGs identified in different pairwise comparison groups across time points. The horizontal axis represents the comparison groups, including ‘TXZ’ versus ‘MX7’ at 0, 24 and 48 hpi with C. siamense (denoted as TXZ-0 h-vs-MX7-0 h-G, TXZ-24 h-vs-MX7-24 h-G, and TXZ-48 h-vs-MX7-48 h-G, respectively). On the vertical axis, DEG numbers are shown; red bars denote upregulated genes, and blue bars signify downregulated genes. (b) Venn diagram analysis reveals shared and uniquely distributed DEGs across the 0 h, 24 h, and 48 h comparison groups.
3.8. Validation of Differential Genes by RT–qPCR
We used RT–qPCR to verify the reliability of our transcriptome data. From the 1662 DEGs identified in the earlier analysis, seven key genes were selected for validation because they presented significant expression changes and strong links to disease resistance. These genes included snap_masked-Fvb6-3-processed-gene-117.14, maker-Fvb4-3-augustus-gene-137.46, maker-Fvb3-3-augustus-gene-26.33, maker-Fvb6-2-aug-ustus-gene-11.26, maker-Fvb3-1-snap-gene-127.20, maker-Fvb2-2-augustus-gene-64.50, and maker-Fvb1-2-augustus-gene-1.52. The RT–qPCR results revealed a high level of consistency between the two datasets: the FPKM values from RNA-seq and the relative expression levels measured via RT–qPCR (calculated via the 2−ΔΔCt method) (Figure 7). This finding confirms that our RNA-seq data are both reliable and reproducible, providing solid support for the use of the identified DEGs in further in-depth functional analyses.
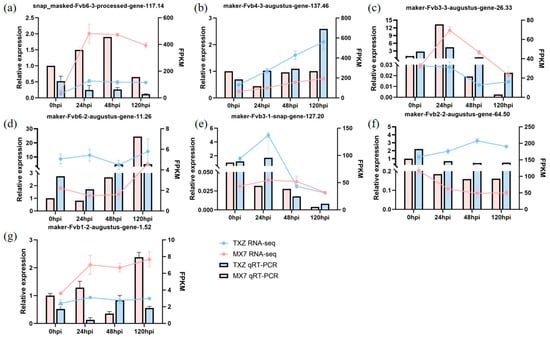
Figure 7.
RT–qPCR analysis of disease resistance-related candidate genes. (a) snap_masked-Fv-b6-3-processed-gene-117.14. (b) maker-Fvb4-3-augustus-gene-137.46. (c) maker-Fvb3-3-augustus-gene-26.33. (d) maker-Fvb6-2-augustus-gene-11.26. (e) maker-Fvb3-1-snap-gene-127.20. (f) maker-Fvb2-2-a-ugustus-gene-64.50. (g) maker-Fvb1-2-augustus-gene-1.52. The error bars indicate ± SE from three biological replicates (n = 3) (technical replicates, n = 3). GAPDH was used as an internal reference gene for validation. Statistical analysis was performed using two-way ANOVA (factors: cultivar and time) followed by Tukey’s HSD test (p-values adjusted for multiplicity via Tukey’s method).
3.9. KEGG Pathway Enrichment Reveals Temporal Metabolic Reprogramming During Pathogen Invasion
We analyzed the KEGG pathway enrichment of DEGs across three infection stages (0 h, 24 h, and 48 h) in ‘TXZ’ and ‘MX7’ strawberry plants and detected clear, dynamic changes in both metabolic and defense-related networks over time (Figure 8).
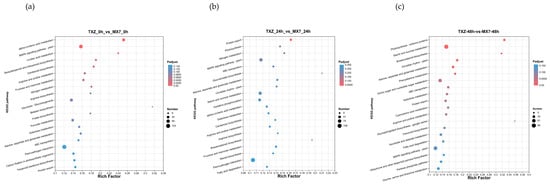
Figure 8.
KEGG enrichment analysis of DEGs. (a) KEGG enrichment at 0 h; (b) 24 hpi; (c) 48 hpi. Y-axis, pathways; X-axis, DEG-to-pathway ratio.
At the initial infection stage (0 h), lipid metabolism pathways were the most active: α-linolenic acid metabolism (map00592) and linoleic acid metabolism (map00591) showed the strongest enrichment. Moreover, MAPK signaling (map04016) and sesquiterpenoid biosynthesis (map00909) were also significantly enriched, which suggests that early defense responses rely on fast signal transmission and the production of specialized metabolites (Figure 8a, Table S3).
By 24 hpi, phenylpropanoid-related pathways were in the center stage. For example, phenylalanine metabolism was 3.2-fold more enriched than at 0 h—a shift that aligns with the activation of lignin biosynthesis genes (these genes help strengthen plant cell structures against pathogens). During this period, nitrogen utilization pathways (such as arginine biosynthesis [map00220]) and carbon fixation mechanisms (map00710) also reached their peak enrichment, which suggests that strawberries redirected resources to fuel their defense efforts (Figure 8b, Table S4).
In the late infection stage (48 hpi), two key pathways remained prominent: plant–pathogen interaction (map04626) and ABC transporters (map02010). This observation points to ongoing pathogen recognition and cellular detoxification processes. Notably, phenylalanine metabolism remained highly active throughout the entire infection period, whereas photosynthesis-related pathways gradually weakened. This trade-off clearly demonstrates how plants prioritize resources under stress (Figure 8c, Table S5).
Taken together, these time-dependent changes—spanning primary metabolism, specialized defense compound production, and signaling pathways—paint a clear functional picture: lipid-based signaling kicks off the initial rapid defense response, whereas phenylpropanoid metabolism and transporter systems take over to sustain long-term defense. Additionally, identifying these stage-specific enriched pathways provides a critical framework for understanding how pathogens drive coordinated changes in the strawberry transcriptome.
3.10. Construction of Coexpression Modules via WGCNA
To ensure the accuracy of the WGCNA, genes with low TPM values or small coefficients of variation (indicating consistent expression levels across samples with minimal changes) were filtered out, as they typically represent noise. Genes with a mean expression level < 1 and a coefficient of variation < 0.1 were removed, resulting in a final set of 3697 genes for constructing gene coexpression modules.
A critical step in WGCNA is determining the optimal soft threshold (power, β) to ensure the coexpression network conforms to a scale-free topology. We analyzed the scale-free topology curve and R2 values (Figure S1), where Figure S1 depicts the scale-free topology model fit (R2) across different soft threshold values, and Figure S2 illustrates the mean connectivity of genes in the network. When power = 18, the scale-free topology fitting index R2 reached 0.886 (surpassing the standard threshold of R2 ≥ 0.8 for reliable scale-free networks), and the mean connectivity was 44.6517 (remaining at a moderate and biologically meaningful level). Thus, power = 18 was selected as the soft threshold for subsequent analyses, with other parameters set as follows: minModuleSize = 30, minKMEtoStay = 0.3, and mergeCutHeight = 0.25.
On the basis of the correlation of gene expression levels, WGCNA was used to construct a clustering tree and divide the genes into modules. In this study, seven coexpression modules were constructed and are displayed in different colors (Figure 9a).
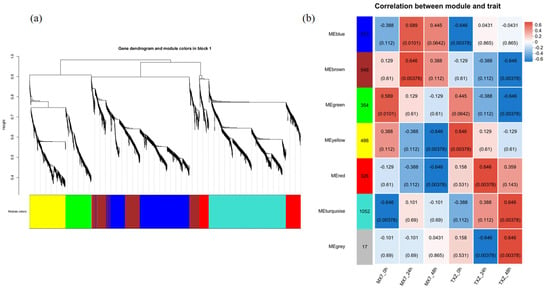
Figure 9.
Identification of functional gene modules via WGCNA (a) Coexpression module dendrogram constructed from 3697 high-quality genes, yielding seven distinct modules color-coded by function. (b) Module–trait correlation analysis identified core resistance/susceptibility modules: the brown module (549 genes) significantly correlated with susceptibility in ‘MX7’, whereas the red module (326 genes) correlated with resistance in ‘TXZ’. Each cell contains two lines of values: the upper value is the correlation coefficient (corr) between the module and the corresponding sample, and the lower value is the statistical significance p-value of this correlation. The color intensity of the cell corresponds to the absolute value of the correlation coefficient. Modules with |corr| > 0.6 and p < 0.05 were considered significantly associated with sample traits.
By analyzing the correlation between modules and samples, with an absolute correlation value (cor) > 0.6 and p < 0.05 as the criteria, the 3697 genes were divided into seven modules: blue (913 genes), brown (549 genes), turquoise (1052 genes), gray (17 genes), yellow (486 genes), green (354 genes), and red (326 genes) (Figure 9b). The analysis revealed that the characteristic genes of the modules were associated with different infection stages.
The analysis of the correlation between gene modules and traits in strawberry cultivars ‘TXZ’ and ‘MX7’ revealed significant associations that provide insights into the genetic basis of disease resistance and susceptibility. Among the modules, the brown and red modules exhibited notable correlations with the resistant and susceptible traits, respectively.
We analyzed the brown module, which contains 549 genes, and found that its gene expression profile tends to correlate positively with that of the susceptible cultivar ‘MX7’ but negatively with that of the resistant cultivar ‘TXZ’. This pattern suggests that these genes might promote susceptibility-related pathways in plants, possibly by becoming more highly expressed or functionally activated in ‘MX7’ during pathogen infection.
The red module, with 326 genes, shows a strong positive correlation with the resistant ‘TXZ’ and a nonsignificant negative correlation with the susceptible ‘MX7’. This finding points to the red module playing a role in disease resistance mechanisms, as its genes appear more active or functionally relevant in the resistant genotype. The positive link with ‘TXZ’ indicates that these genes likely help the plant fight pathogen infection (Table S6).
3.11. Searching for Hub Genes Related to Disease Resistance via Weighted Gene Coexpression Networks
To further pinpoint the key regulatory genes in the brown and red modules, we first constructed coexpression networks and mapped the intra-module gene interaction patterns, with detailed supporting data provided in Tables S7 and S8. Leveraging network topology features, we then identified hub genes—characterized by high intramodular connectivity and functional importance to module architecture. Using network topology features, we identified hub genes—defined by their high connectivity and importance to the module’s structure. Specifically, we selected the top 10 candidate hub genes from each module, focusing on those with strong coexpression links and central roles in shaping the network (Figure 10a,b). Among these genes, two genes stood out: maker-Fvb1-2-augustus-gene-1.52 and maker-Fvb6-2-augustus-gene-11.26, which we found to be closely related to plant disease susceptibility and resistance.
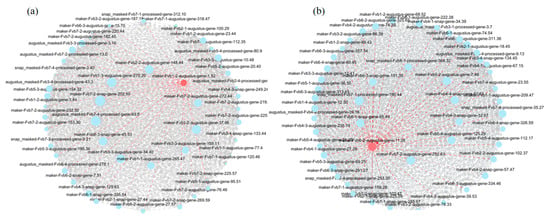
Figure 10.
Hub gene identification in disease resistance-associated MEred and MEbrown modules. (a) Key regulatory genes in the brown (MEbrown) module. (b) Key regulatory genes in the red (MEred) module. Each node represents a gene, with the node size corresponding to its degree. Larger nodes indicate higher within-module connectivity.
One of these genes, the strawberry gene FvRNF144B-like (encoded by maker-Fvb1-2-augustus-gene-1.52), is a canonical RBR (RING1-BRcat-Rcat)-type E3 (E3 Ubiquitin Ligase) ubiquitin ligase. Its catalytic core for ubiquitin transfer lies in the N-terminal RING-HC domain and C-terminal BRcat/Rcat domains []. We suspect that FvRNF144B-like enhances disease resistance through nondegradative ubiquitination, similar to how potato StRFP1 works. Instead of targeting the protein StGPT1 for degradation, StPRF1 uses ubiquitination to drive StGPT1 accumulation in chloroplasts. This activates both the oxidative pentose phosphate pathway (OPPP) and pattern-triggered immunity (PTI). This mechanism may regulate the localization and buildup of chloroplast-linked immune factors (such as Reactive Oxygen Species (ROS) metabolic enzymes), possibly facilitating bidirectional transport between chloroplasts and the endosomal membrane system. This notable shift from the traditional view of E3 ligases only mediating protein breakdown revealed a new ubiquitination-based protein relocalization process in plant immunity []. In contrast, while grape VyPUB21 enhances systemic acquired resistance (SAR) by degrading the suppressor protein VyNIMIN, FvRNF144B-like might target similar suppressors (such as NIMIN homologs) in the SA pathway [].
The other key gene, Fvb6-2-Augustus-gene-11.26 in strawberry, corresponds to FaPHR1-like—a homolog of MYB-like helix-turn-helix (HTH) transcriptional regulator family proteins. In Arabidopsis, PHR1-driven pathways improve tolerance to drought and salinity by regulating ROS scavenging and ion balance []. Characterizing these hub genes across different species not only supports their role in plant stress responses but also lays the groundwork for future research involving the use of genetic engineering and breeding to increase crop resilience.
4. Discussion
Strawberry anthracnose, caused by a complex of pathogens, features C. siamense as one of its primary and highly infectious causal agents. Significant differences in resistance to C. siamense among various strawberry cultivars. Understanding the disparities between resistant and susceptible strawberry cultivars is crucial for elucidating their pathogenic mechanisms and developing disease-resistant varieties [,,].
We first evaluated the disease resistance of ten strawberry cultivars, identifying ‘FY1’ and ‘MX7’ as susceptible and ‘TXZ’ as resistant. Notably, this finding on ‘TXZ’ contrasts with the results of Shi et al. [], who reported ‘TXZ’ as susceptible in their screening for powdery mildew (Podosphaera aphanis) resistance. The observed difference in resistance between our study and theirs likely stems from the distinct pathogens used, which in turn trigger different resistance responses following inoculation.
Plants produce a range of endogenous antioxidants to alleviate the oxidative damage caused by ROS []. Among these enzymes, three key antioxidant enzymes, SOD, CAT, and POD, play critical roles in mediating resistance to biotic and abiotic stresses [,,]. SOD efficiently converts O2−. to H2O2 and O2, whereas CAT further facilitates the conversion of H2O2 to H2O and O2 []. In our study, after inoculation with Cs.4J, ‘TXZ’ maintained significantly lower H2O2 accumulation than did the susceptible ‘MX7’ throughout the infection period (adjusted p < 0.05, Tukey’s HSD test). This superior redox homeostasis in ‘TXZ’ arises from its sustained high CAT activity, which enables efficient H2O2 detoxification while preserving stable SOD function.
In contrast, ‘MX7’ only results in a delayed and inadequate POD response, which leads to chronic oxidative damage and membrane degradation [,]. Crucially, KEGG pathway analysis revealed the underlying metabolic framework, revealing temporally coordinated shifts that support this defensive difference []. Early activation of fatty acid metabolism (alpha-linolenic acid and linoleic acid pathways) and MAPK signaling at 0 hpi indicates the rapid initiation of defensive responses. By 24 hpi, a marked enrichment of phenylpropanoid metabolism drives lignin synthesis for cell wall fortification—a structural barrier that may limit pathogen spread and ROS diffusion. Concurrently, the peak activation of nitrogen utilization (e.g., arginine biosynthesis) and carbon fixation pathways signals the reallocation of resources toward defense [,].
WGCNA identified key regulatory modules (MEbrown, MEred) that are strongly associated with resistance, directly connecting gene expression networks to the observed metabolic shifts []. Among these modules, hub genes shed light on core regulatory mechanisms. FaPHR1-like, identified as a central hub in the MEred module, acts as a key transcription factor that dynamically suppresses excessive ROS accumulation. Its role in activating antioxidant biosynthesis pathways (encoding SOD and POD) provides the molecular basis for ‘TXZ’-specific traits: efficient H2O2 scavenging (via high CAT activity) and maintenance of membrane integrity. This FaPHR1-like-mediated antioxidant defense works in tandem with phenylpropanoid-driven cell wall fortification to form a robust physical and biochemical barrier against pathogens [].
Furthermore, the hub gene FvRNF144B-like, an E3 ubiquitin ligase enriched in resistance-associated modules, potentially regulates defense responses through targeted protein degradation, potentially influencing hormone signaling pathways such as ABA (Abscisic Acid) [,,,]. This finding aligns with the KEGG observations of JA precursor pathway activation at 0 hpi and SA-mediated defense signatures []. The persistence of plant–pathogen interaction pathways and ABC transporters at 48 hpi (KEGG), coupled with the ongoing suppression of photosynthesis, reflects the sustained defense commitment in ‘TXZ’, likely coordinated by regulatory hubs such as FaPHR1-like and FvRNF144B-like identified through WGCNA. This integrated view—from physiological outcome (lower ROS, membrane integrity) to metabolic execution (phenylpropanoids, antioxidants, resource allocation) and transcriptional regulation (hub TFs [Transcription Factors], ubiquitin ligases)—suggests the importance of antioxidant homeostasis and hormone signaling crosstalk in conferring resistance. This notion converges with findings from multiomics studies in strawberry under stress [] and is further supported by the coordinated expression patterns of ABA, JA, and SA signaling-related genes observed in our transcriptome data.
5. Conclusions
In this study, the C. siamense strain Cs.4J was isolated and identified. Resistance screening of 10 strawberry cultivars against Cs.4J revealed distinct disease susceptibility levels: one resistant (R), six moderately resistant (MR), one moderately susceptible (MS), and two susceptible (S) cultivars. The infection process and physiological responses were compared between the representative resistant cultivar ‘TXZ’ and the susceptible cultivar ‘MX7’ following inoculation with Cs.4J. Transcriptome sequencing was subsequently performed to analyze the DEGs, KEGG pathway enrichment, and WGCNA. WGCNA revealed two candidate genes (FaRNF144B-like and FaPHR1-like) that are significantly associated with disease resistance/susceptibility. Future work will employ CRISPR-Cas9 (Clustered Regularly Interspaced Short Palindromic Repeats-CRISPR Associated Protein 9) technology to generate knockout and overexpression strains for these candidate genes. Functional validation will assess their potential as high-priority molecular targets for breeding anthracnose-resistant strawberry cultivars.
Supplementary Materials
The following supporting information can be downloaded at: https://www.mdpi.com/article/10.3390/horticulturae11121427/s1. Figure S1: Scale independence. Figure S2: Mean Connectivity. Table S1: Primers used for PCR amplification in this study; Table S2: Quality status of transcriptome; Table S3: KEGG pathway-related information at 0 h; Table S4: KEGG pathway-related information at 24 h; Table S5: KEGG pathway-related information at 48 h; Table S6: Expression level changes of genes related to brown and red modules; Table S7: Information of hub genes screened from the brown module in WGCNA; Table S8: Information of hub genes screened from the red module in WGCNA.
Author Contributions
Y.X.: editing, original draft, validation, investigation analysis, investigation, and data curation. J.Y.: review, original draft, validation, investigation, and data curation. J.H.: review, investigation, and data curation. W.C.: review, investigation, and supervision. Y.Z.: provided guidance on cultivation management, and site support. W.H.: provided the cultivation site. Y.M.: review and editing, supervision, resources, project administration, and conceptualization. B.M.: review, supervision, resources, project administration, funding acquisition, and conceptualization. All authors have read and agreed to the published version of the manuscript.
Funding
This study was supported by two grants: the Key Research and Development Program of Ningbo City & “Project Bidding with Clear Objectives” Project (2023Z112) and the Project of Breeding New High-Quality Strawberry Varieties and Constructing the Industrialization System of Seedlings (KYY-516108-0001).
Institutional Review Board Statement
Ethics approval and consent to participate Not applicable.
Informed Consent Statement
Not applicable.
Data Availability Statement
The original data presented in the study are openly available in the National Center for Biotechnology Information (NCBI) with the BioProject accession number PRJNA1292136. For additional information, please contact the corresponding author.
Conflicts of Interest
Author Yuanxiang Zhong was employed by the company Hangzhou Zhijun Gaoji Technology Co., Ltd. The remaining authors declare that the research was conducted in the absence of any commercial or financial relationships that could be construed as a potential conflict of interest.
References
- Amil-Ruiz, F.; Blanco-Portales, R.; Muñoz-Blanco, J.; Caballero, J.L. The strawberry plant defense mechanism: A molecular review. Plant Cell Physiol. 2011, 52, 1873–1903. [Google Scholar] [CrossRef]
- Fang, X.L.; Phillips, D.; Li, H.; Sivasithamparam, K.; Barbetti, M.J. Severity of crown and root diseases of strawberry and associated fungal and oomycete pathogens in Western Australia. Australas. Plant Pathol. 2011, 40, 109–119. [Google Scholar] [CrossRef]
- Adhikari, T.B.; Chacon, J.G.; Fernandez, G.E.; Louws, F.J. First Report of Anthracnose Causing Both Crown and Fruit Rot of Strawberry by Colletotrichum siamense in North Carolina. Plant Dis. 2019, 103, 1775. [Google Scholar] [CrossRef]
- Ji, Y.; Li, X.; Gao, Q.H.; Geng, C.; Duan, K. Colletotrichum species pathogenic to strawberry: Discovery history, global diversity, prevalence in China, and the host range of top two species. Phytopathol. Res. 2022, 4, 42. [Google Scholar] [CrossRef]
- Wang, C.H.; Jiang, Z.T.; Huang, R.J.; Shi, G.C.; Wang, P.P.; Xue, L. The occurrence and control to strawberry anthracnose in China. Acta Hortic. 2017, 1156, 797–800. [Google Scholar] [CrossRef]
- Freeman, S.; Katan, T.; Shabi, E. Characterization of Colletotrichum Species Responsible for Anthracnose Diseases of Various Fruits. Plant Dis. 1998, 82, 596–605. [Google Scholar] [CrossRef] [PubMed]
- Zhang, H.Y.; Godana, E.A.; Sui, Y.; Yang, Q.; Zhang, X.; Zhao, L. Biological control as an alternative to synthetic fungicides for the management of grey and blue mould diseases of table grapes: A review. Crit. Rev. Microbiol. 2020, 46, 450–462. [Google Scholar] [CrossRef] [PubMed]
- Han, Y.C.; Zeng, X.G.; Xiang, F.Y.; Zhang, Q.H.; Guo, C.; Chen, F.Y.; Gu, Y.C. Carbendazim sensitivity in populations of Colletotrichum gloeosporioides complex infecting strawberry and yams in Hubei Province of China. J. Integr. Agric. 2018, 17, 1391–1400. [Google Scholar] [CrossRef]
- Mangandi, J.; Peres, N.A.; Whitaker, V.M. Identifying resistance to crown rot caused by Colletotrichum gloeosporioides in strawberry. Plant Dis. 2015, 99, 954–961. [Google Scholar] [CrossRef]
- Meng, X.; Zhang, S. MAPK cascades in plant disease resistance signaling. Annu. Rev. Phytopathol. 2013, 51, 245–266. [Google Scholar] [CrossRef]
- Rodriguez, M.C.; Petersen, M.; Mundy, J. Mitogen-activated protein kinase signaling in plants. Annu. Rev. Plant Biol. 2010, 61, 621–649. [Google Scholar] [CrossRef]
- Dixon, R.A.; Achnine, L.; Kota, P.; Liu, C.J.; Reddy, M.S.; Wang, L. The phenylpropanoid pathway and plant defence—A genomics perspective. Mol. Plant Pathol. 2002, 3, 371–390. [Google Scholar] [CrossRef] [PubMed]
- Agrawal, G.K.; Rakwal, R.; Jwa, N.S. Rice (Oryza sativa L.) OsPR1b gene is phytohormonally regulated in close interaction with light signals. Mol. Genet. Genom. 2002, 278, 290–298. [Google Scholar] [CrossRef] [PubMed]
- Súnico, V.; Higuera, J.J.; Amil-Ruiz, F.; Arjona-Girona, I.; López-Herrera, C.J.; Muñoz-Blanco, J.; Maldonado-Alconada, A.M.; Caballero, J.L. FaNPR3 Members of the NPR1-like Gene Family Negatively Modulate Strawberry Fruit Resistance against Colletotrichum acutatum. Plants 2024, 13, 2261. [Google Scholar] [CrossRef] [PubMed]
- Tao, Y.; Wang, P.; Gong, Y.; Xu, L.L.; Wu, J.; Wang, A.N.; Wang, L.; Hu, J.B.; Dong, K.; Zhu, J.Y.; et al. A Positive Regulator CsPR10-9 Confers Resistance to Anthracnose (Colletotrichum gloeosporioides) Is Negatively Regulated by CsMYB72 in Tea Plants. Plant Cell Environ. 2025, 48, 6965–6981. [Google Scholar] [CrossRef]
- Ren, Z.; Tang, B.; Xing, J.; Liu, C.; Cai, X.; Hendy, A.; Kamran, M.; Liu, H.; Zheng, L.; Huang, J.; et al. MTA1-mediated RNA m6A modification regulates autophagy and is required for infection of the rice blast fungus. New Phytol. 2022, 235, 247–262. [Google Scholar] [CrossRef]
- Allen, G.C.; Flores-Vergara, M.A.; Krasynanski, S.; Kumar, S.; Thompson, W.F. A modified protocol for rapid DNA isolation from plant tissues using cetyltrimethylammonium bromide. Nat. Protoc. 2006, 1, 2320–2325. [Google Scholar] [CrossRef]
- Adam, L.; Ellwood, S.; Wilson, I.; Saenz, G.; Xiao, S.; Oliver, R.P.; Turner, J.G.; Somerville, S. Comparison of Erysiphe cichoracearum and E. cruciferarum and a survey of 360 Arabidopsis thaliana accessions for resistance to these two powdery mildew pathogens. Mol. Plant Microbe Interact. 1999, 12, 1031–1043. [Google Scholar] [CrossRef]
- O’Donnell, K.; Sutton, D.A.; Rinaldi, M.G.; Sarver, B.A.; Balajee, S.A.; Schroers, H.J.; Summerbell, R.C.; Robert, V.A.; Crous, P.W.; Zhang, N.; et al. Internet-accessible DNA sequence database for identifying fusaria from human and animal infections. J. Clin. Microbiol. 2010, 48, 3708–3718. [Google Scholar] [CrossRef]
- Duarte, I.G.; Veloso, J.S.; Amaral, A.G.G.; Silva, A.C.D.; Silva, H.R.; Balbino, V.D.Q.; Vieira, W.A.D.S.; Castlebury, L.; Câmara, M.P.S. Colletotrichum siamense causing anthracnose on Etlingera elatior. Crop Prot. 2022, 162, 106092. [Google Scholar] [CrossRef]
- Weir, B.S.; Johnston, P.R.; Damm, U. The Colletotrichum gloeosporioides species complex. Stud. Mycol. 2012, 73, 115–180. [Google Scholar] [CrossRef] [PubMed]
- Carbone, I.; Kohn, L.M. A method for designing primer sets for speciation studies in filamentous ascomycetes. Mycologia 1999, 91, 553–556. [Google Scholar] [CrossRef]
- Wang, F.; Ma, Y.; Gao, X.; Li, J.; Zhang, S. Research on Identification Technology of Strawberry Varieties’ Resistance to Anthracnose. J. Fruit Sci. 2008, 25, 542–547. [Google Scholar] [CrossRef]
- Feng, W.; Shi, J.; Jin, J.; Duan, Z.Y.; Liang, X.; Luo, J.; Qiu, L.; Luo, J.; Xu, X.; Wen, Y.; et al. Comprehensive Evaluation of Resistance of Different Strawberry Varieties to Xanthomonas fragariae. Sci. Hortic. 2023, 325, 112647. [Google Scholar] [CrossRef]
- Hsu, K.C.; Hsu, P.F.; Chen, Y.C.; Lin, H.C.; Hung, C.C.; Chen, P.C.; Huang, Y.L. Oxidative stress during bacterial growth characterized through microdialysis sampling coupled with HPLC/fluorescence detection of malondialdehyde. J. Chromatogr. B-Anal. Technol. Biomed. Life Sci. 2016, 1019, 112–116. [Google Scholar] [CrossRef]
- Li, A.; Zhang, R.; Pan, L.; Tang, L.; Zhao, G.; Zhu, M.; Chu, J.; Sun, X.; Wei, B.; Zhang, X.; et al. Transcriptome analysis of H2O2-treated wheat seedlings reveals a H2O2-responsive fatty acid desaturase gene participating in powdery mildew resistance. PLoS ONE 2011, 6, e28810. [Google Scholar] [CrossRef]
- Ma, H.; Zou, F.; Li, D.; Wan, Y.; Zhang, Y.; Zhao, Z.; Wang, X.; Gao, H. Transcription Factor MdbHLH093 Enhances Powdery Mildew Resistance by Promoting Salicylic Acid Signaling and Hydrogen Peroxide Accumulation. Int. J. Mol. Sci. 2023, 24, 9390. [Google Scholar] [CrossRef]
- Huang, Y.; Yang, J.; Sun, X.; Li, J.H.; Cao, X.Q.; Yao, S.Z.; Han, Y.H.; Chen, C.T.; Du, L.L.; Li, S.; et al. Perception of viral infections and initiation of antiviral defence in rice. Nature 2025, 641, 173–181. [Google Scholar] [CrossRef]
- Wu, X.; Zhou, X.; Lin, T.; Zhang, Z.; Wu, X.; Zhang, Y.; Liu, Y.; Tian, Z. Accumulation of dually targeted StGPT1 in chloroplasts mediated by StRFP1, an E3 ubiquitin ligase, enhances plant immunity. Hortic. Res. 2024, 11, uhae241. [Google Scholar] [CrossRef]
- Wang, L.; Bian, L.; Shi, Q.L.; Li, X.; Sun, Y.D.; Li, M.; Zhao, A.Q.; Peng, X.Y.; Yu, Y.H. The Vitis yeshanensis U-box E3 ubiquitin ligase VyPUB21 enhances resistance to powdery mildew by targeting degradation of NIM1-interacting (NIMIN) protein. Plant Cell Rep. 2024, 43, 93. [Google Scholar] [CrossRef]
- Sun, C.; Liao, D.H.; Wu, S. The advances of PHR and SPX in the nutrition signaling pathway. J. Plant Nutr. Fertil. 2021, 27, 1080–1090. [Google Scholar] [CrossRef]
- Zhang, L.; Song, L.; Xu, X.; Zou, X.; Duan, K.; Gao, Q. Characterization and Fungicide Sensitivity of Colletotrichum Species Causing Strawberry Anthracnose in Eastern China. Plant Dis. 2020, 104, 1960–1968. [Google Scholar] [CrossRef]
- Zhang, Y.; Yu, H.; Hu, M.; Wu, J.; Zhang, C. Fungal Pathogens Associated with Strawberry Crown Rot Disease in China. J. Fungi 2022, 8, 1161. [Google Scholar] [CrossRef] [PubMed]
- Ji, Y.; Geng, C.; Song, L.; Zhang, L.Q.; Yang, J.; Gao, Q.H.; Han, Y.C.; Duan, K. Different responses to elevated temperature in the representative strains of strawberry pathogenic Colletotrichum spp. from eastern China. Mycol. Prog. 2023, 22, 3. [Google Scholar] [CrossRef]
- Shi, J.; Cheng, Y.; Liang, X.; Yang, H.L.; Ma, Y.Y.; Wei, F.; Qiu, L.J.; Li, X.X.; Lu, L.J.; Zhao, W.J.; et al. Evaluation of host resistance and susceptibility to Podosphaera aphanis NWAU1 infection in 19 strawberry varieties. Sci. Hortic. 2023, 315, 111977. [Google Scholar] [CrossRef]
- Sun, J.; Lin, H.; Zhang, S.; Lin, Y.; Wang, H.; Lin, M.; Hung, Y.C.; Chen, Y. The roles of ROS production-scavenging system in Lasiodiplodia theobromae (Pat.) Griff. & Maubl.-induced pericarp browning and disease development of harvested longan fruit. Food Chem. 2018, 247, 16–22. [Google Scholar] [CrossRef]
- Ahmad, P.; Jaleel, C.A.; Salem, M.A.; Nabi, G.; Sharma, S. Roles of enzymatic and nonenzymatic antioxidants in plants during abiotic stress. Crit. Rev. Biotechnol. 2010, 30, 161–175. [Google Scholar] [CrossRef] [PubMed]
- Torres, M.A.; Jones, J.D.; Dangl, J.L. Reactive oxygen species signaling in response to pathogens. Plant Physiol. 2006, 141, 373–378. [Google Scholar] [CrossRef]
- Jiang, X.; Lin, H.; Lin, M.; Chen, Y.; Wang, H.; Lin, Y.; Shi, J.; Lin, Y. A novel chitosan formulation treatment induces disease resistance of harvested litchi fruit to Peronophythora litchii in association with ROS metabolism. Food Chem. 2018, 266, 299–308. [Google Scholar] [CrossRef]
- Liang, X.; Wei, F.; Yang, H.; Fan, L.; Cai, X.; Ma, Y.; Shi, J.; Xing, K.; Qiu, L.; Li, X.; et al. Flagella-Driven Motility Is Critical to the Virulence of Xanthomonas fragariae in Strawberry. Plant Dis. 2023, 107, 3506–3516. [Google Scholar] [CrossRef]
- Mashabela, M.D.; Tugizimana, F.; Steenkamp, P.A.; Piater, L.A.; Dubery, I.A.; Mhlongo, M.I. Metabolite profiling of susceptible and resistant wheat (Triticum aestivum) cultivars responding to Puccinia striiformis f. sp. tritici infection. BMC Plant Biol. 2023, 23, 293. [Google Scholar] [CrossRef]
- Zhang, C.; Zhang, H.; Lin, W.; Chai, J.; Shangguan, X.; Zhao, T. ZmDREB1A controls plant immunity via regulating salicylic acid metabolism in maize. Plant J. 2025, 121, e17226. [Google Scholar] [CrossRef]
- Dong, N.Q.; Lin, H.X. Contribution of phenylpropanoid metabolism to plant development and plant-environment interactions. J. Integr. Plant Biol. 2021, 63, 180–209. [Google Scholar] [CrossRef]
- Langfelder, P.; Horvath, S. WGCNA: An R package for weighted correlation network analysis. BMC Bioinform. 2008, 9, 559. [Google Scholar] [CrossRef]
- Cao, Q.; Huang, L.; Li, J.; Qu, P.; Tao, P.; Crabbe, M.J.C.; Zhang, T.; Qiao, Q. Integrated transcriptome and methylome analyses reveal the molecular regulation of drought stress in wild strawberry (Fragaria nilgerrensis). BMC Plant Biol. 2022, 22, 613. [Google Scholar] [CrossRef]
- Cheng, M.C.; Hsieh, E.J.; Chen, J.H.; Chen, H.Y.; Lin, T.P. Arabidopsis RGLG2, functioning as a RING E3 ligase, interacts with AtERF53 and negatively regulates the plant drought stress response. Plant Physiol. 2012, 158, 363–375. [Google Scholar] [CrossRef]
- Chen, Y.T.; Liu, H.; Stone, S.; Callis, J. ABA and the ubiquitin E3 ligase KEEP ON GOING affect proteolysis of the Arabidopsis thaliana transcription factors ABF1 and ABF3. Plant J. 2013, 75, 965–976. [Google Scholar] [CrossRef]
- Bueso, E.; Rodriguez, L.; Lorenzo-Orts, L.; Gonzalez-Guzman, M.; Sayas, E.; Muñoz-Bertomeu, J.; Ibañez, C.; Serrano, R.; Rodriguez, P.L. The single-subunit RING-type E3 ubiquitin ligase RSL1 targets PYL4 and PYR1 ABA receptors in plasma membrane to modulate abscisic acid signaling. Plant J. 2014, 80, 1057–1071. [Google Scholar] [CrossRef] [PubMed]
- Wu, Q.; Zhang, X.; Peirats-Llobet, M.; Belda-Palazon, B.; Wang, X.; Cui, S.; Yu, X.; Rodriguez, P.L.; An, C. Ubiquitin Ligases RGLG1 and RGLG5 Regulate Abscisic Acid Signaling by Controlling the Turnover of Phosphatase PP2CA. Plant Cell 2016, 28, 2178–2196. [Google Scholar] [CrossRef] [PubMed]
- Stone, S.L.; Williams, L.A.; Farmer, L.M.; Vierstra, R.D.; Callis, J. KEEP ON GOING, a RING E3 ligase essential for Arabidopsis growth and development, is involved in abscisic acid signaling. Plant Cell 2006, 18, 3415–3428. [Google Scholar] [CrossRef] [PubMed]
- Lee, M.B.; Han, H.; Lee, S. The role of WRKY transcription factors, FaWRKY29 and FaWRKY64, for regulating Botrytis fruit rot resistance in strawberry (Fragaria × ananassa Duch.). BMC Plant Biol. 2023, 23, 420. [Google Scholar] [CrossRef] [PubMed]
Disclaimer/Publisher’s Note: The statements, opinions and data contained in all publications are solely those of the individual author(s) and contributor(s) and not of MDPI and/or the editor(s). MDPI and/or the editor(s) disclaim responsibility for any injury to people or property resulting from any ideas, methods, instructions or products referred to in the content. |
© 2025 by the authors. Licensee MDPI, Basel, Switzerland. This article is an open access article distributed under the terms and conditions of the Creative Commons Attribution (CC BY) license (https://creativecommons.org/licenses/by/4.0/).