Abstract
The use of biostimulants offers a sustainable strategy to improve crop quality. This study assessed the effects of an arbuscular mycorrhizal fungi inoculum (consisting of species Claroideoglomus claroideum, Claroideoglomus etunicatum, Funneliformis geosporum, Funneliformis mosseae and Rhizophagus irregularis) and an 0.5% aqueous extract of Landoltia punctata on the growth and biochemical composition of lettuce (Lactuca sativa L. cv. ‘Dubáček’) under indoor conditions. Four variants were tested: control (C), mycorrhiza (M), L. punctata extract (L), and their combination (M + L), with biometric, physiological, and biochemical parameters evaluated. Simultaneously, the amino acid profile of Landoltia extract was determined, and the degree of plant colonization by mycorrhizal fungi was evaluated. While biostimulant treatments did not affect above-ground biomass, L. punctata extract (L and M + L) significantly raised chlorophyll a (by 15.9% and 16.0%) and chlorophyll b (by 55.5% and 42.8%) compared to the control. The combined treatment (M + L) achieved the highest total phenolic content (254.28 mg/kg). All treated variants significantly reduced leaf nitrate content, with M and M + L being most effective (−35.1% and −33.6%). Amino acid metabolomic analysis showed that the extract is rich in γ-aminobutyric acid, valine, phenylalanine, tryptophan, and other proteinogenic amino acids that may drive its biostimulant effects. Microscopy confirmed successful root colonisation in mycorrhizal variants (58% in M, 42% in M + L). Although the biostimulants did not significantly affect growth, their application is recommended to improve lettuce quality by enhancing photosynthetic pigments and phenolic compounds while reducing nitrate content, indicating their potential for producing safe, higher-quality crops.
1. Introduction
Since the 1950s, agriculture has primarily aimed at intensifying production by increasing crop yields. This goal has largely been pursued through heavy use of mineral fertilizers and pesticides [1], whose global consumption continues to rise [2,3,4]. However, the overuse of these agrochemicals contributes to soil degradation, water contamination and greenhouse gas emissions [5,6,7,8,9,10,11]. Between 2001 and 2022, global consumption of mineral fertilizers (N, P, K), for example, increased from 93.1 to 119.9 kg/ha of arable land, while global pesticide use rose from 1.5 to 2.4 kg/ha over the same period [2,3,4].
Therefore, there is an urgent need to seek and apply natural-based alternatives that will not further burden arable soils environmentally, while supporting the development of beneficial microorganisms and maintaining or even increasing the yield and nutritional parameters of cultivated crops. This definition includes a group of substances collectively referred to as plant biostimulants. According to Regulation (EU) 2019/1009 of the European Parliament, the group of plant biostimulants is divided into microbial and non-microbial categories. Microbial products contain beneficial fungi, bacteria, or their combination. Non-microbial products include those based on (1) humic and fulvic acids, (2) protein hydrolysates and other N-containing compounds, (3) chitosan and other biopolymers, (4) inorganic substances (beneficial elements), and (5) seaweed and plant extracts, or combinations of these [12,13].
Rossini, Ruggeri, and Rossini [14] found that a mixture of seaweed extracts and microorganisms applied with a reduced nitrogen fertilizer dose (100 kg/ha) achieved a wheat yield comparable to the standard dose (150 kg/ha), thus saving 33% of nitrogen. A similar trend was observed by Fall et al. [15], who found that the combination of mycorrhizal inoculum with 50% doses of N, P, and K outperformed the 100% dose of N, P, and K in terms of growth and nutrient content in maize grown both in the greenhouse and in the field.
The group of arbuscular mycorrhizal fungi (AMF) consists of an obligate symbiotic class of fungi, the Glomeromycetes, which currently includes five orders: Archeosporales, Diversisporales, Entrophosphorales, Glomerales, and Paraglomerales [16,17]. These fungi encompass hundreds of species that colonize a diverse range of plants—from liverworts, ferns, and gymnosperms to angiosperms, with the exception of certain families such as Brassicaceae and Araceae [18,19]. In economically important crops, the presence of AMF is associated with increased nutrient and water uptake, often leading to higher yields, as well as positive changes in the plants’ primary and secondary metabolomes, which enhance their resistance to stress factors and improve the nutritional value of the crops [20,21,22].
Landoltia punctata (G. Meyer) D. H. Les & D. J. Crawford belongs to the family Araceae, subfamily Lemnoideae, and is an aquatic plant freely floating on or just below the water surface. Its body consists of a frond measuring 1–3 mm and 2–5 roots [23,24]. Most studies on representatives of Lemnoideae focus on their ecological significance, especially wastewater bioremediation, where they effectively remove heavy metals, dyes, nanomaterials, microplastics, organic pollutants, pesticides, and pharmaceuticals [25,26,27,28,29,30]. Some studies also examine the use of duckweed biomass as an alternative fertilizer for cereals [31,32,33], tomatoes [34], and leafy vegetables [35,36,37]. However, few studies have so far focused on the biostimulant effects of these plants, and all have concerned only Lemna minor. The aqueous extract of L. minor has been tested on maize under optimal [38] and stress conditions of increased NaCl [39] and Cu [40], on olive trees under optimal [41] and stress conditions of increased NaCl [42], and also on tomatoes [43].
This study examined the effects of a well-established and commonly used group of biostimulants—AMF—alongside a newly emerging biostimulant derived from an aqueous extract of the aquatic plant L. punctata (clone no. 5562). Although both types of biostimulants act via different mechanisms, they may have complementary effects on nitrogen metabolism, particularly regarding nitrate accumulation. The main aims of this research were therefore (i) to evaluate the effects of individual and combined applications of a mycorrhizal inoculum and an aqueous extract of L. punctata on lettuce biometric parameters, physiological status and biochemical composition, (ii) to assess mycorrhizal root colonization, and (iii) to conduct a metabolomic analysis of amino acids in the aqueous extract of L. punctata.
2. Materials and Methods
Plant Material and Growing Conditions
The experiment was conducted under indoor conditions at the Faculty of Agronomy, Mendel University, located at Zemědělská 1, 61300 Brno, Czech Republic. Seeds of leaf lettuce cultivar ‘Dubáček’ (MORAVOSEED CZ S.A., Mikulov, Czech Republic) were sown into a universal peat substrate (BAHAG AG, Mannheim, Germany) in plastic trays on 3 March 2025. Two of the four prepared variants were treated with mycorrhizal inoculum before sowing.
The prepared trays were placed inside an indoor tent, type BudBox PRO Titan I+ HL 200 (BudBox™ Ltd., Harrogate, UK) and were cultivated under constant conditions until harvest. Throughout the entire experiment, a temperature regime of 23/20 °C day/night was maintained, and the relative humidity was maintained in the range of 60–80% using exhaust fans and humidifiers. Just above the edge of the trays, the photosynthetic photon flux density (PPFD) was measured using Seconic SpectroMeter C-800 (Seconic Corporation, Tokyo, Japan), averaging 218.6 ± 27.27 µmol/m2/s with a red to blue light ratio of 20:1. The photoperiod was set to 18 h of light and 6 h of darkness. Irrigation was carried out daily—1.5 litres of settled tap water per tray. During the short-term cultivation of lettuce, no additional fertilization was required.
Experimental Design
The experiment included 4 variants, each represented by one plastic tray (87 × 124 × 43 cm). The trays were distributed among the variants according to a completely randomised design. Each variant contained 12 plants. The experiment included the following variants:
- (1)
- C—control variant without any treatment;
- (2)
- M—variant treated with mycorrhizal inoculum;
- (3)
- M + L—variant treated with a combination of mycorrhizal inoculum and Landoltia punctata (clone no. 5562) extract;
- (4)
- L—variant treated with L. punctata (clone no. 5562) extract.
Biostimulant Preparation and Application
Two types of biostimulant products were used in this experiment. The first was an AMF inoculum containing Claroideoglomus claroideum BEG96 (N.C. Schenck & G.S. Sm.) C. Walker & A. Schüßler, Claroideoglomus etunicatum BEG92 (W.N. Becker & Gerd.) C. Walker & A. Schüßler, Funneliformis geosporum BEG199 (T.H. Nicolson & Gerd.) C. Walker & A. Schüßler, Funneliformis mosseae BEG95 (T.H. Nicolson & Gerd.) C. Walker & A. Schüßler, and Rhizophagus irregularis BEG140 (Błaszk., Wubet, Renker & Buscot) C. Walker & A. Schüßler. A proportionally consistent inoculum ratio was maintained across all fungal species resulting in a final average concentration of 145 spores/g of inoculum. The inoculum was obtained from the company Symbiom, Ltd., Sázava, Czech Republic. The other composition of this product, as declared by the manufacturer, is as follows: natural clay carriers, natural humates, seaweed extracts, ground minerals, and hydrogel particles. The mycorrhizal inoculum was applied in two variants (M and M + L) by adding 1 g of the mycorrhizal inoculum into each sowing hole prior to seed sowing.
The second biostimulant product used in this experiment was an extract from duckweed, L. punctata clone no. 5562 (a pure clone purchased from the Friedrich Schiller Institute, Jena, Germany). The L. punctata clone was cultivated in an indoor growing system at the Faculty of Horticulture, Mendel University, located at Valtická 337, 69144 Lednice, Czech Republic. L. punctata was grown in a hydroponic nutrient solution, Solinure GT 7 (ICL Group Ltd., Tel Aviv, Israel), at a concentration of 0.855 g of fertilizer per litre of tap water. The solution was acidified using 15% HNO3 to maintain the pH in the range of 6.5–7.5. L. punctata was cultivated under a PPFD of 119.5 µmol/m2/s with a 16/8 light/dark photoperiod and a daily light integral (DLI) of 6.9. The extract was obtained following the methodology of Priolo et al. [43], who also suggested using a 0.5% concentration, as it was found to be the most effective. For the purpose of extract preparation, 50 g of fresh biomass was harvested, thoroughly washed with tap water, and drained for 5 min in a sieve. The biomass was then dried at 40 °C for 72 h, and 2 g of the dry biomass was mixed with 400 mL of deionized water (pH = 7.0). The mixture was ground together in a mortar for 5 min and transferred into a vial placed on a shaker for 12 h at room temperature and 150 rpm. The suspension was then filtered and brought up to a volume of 400 mL with deionized water, resulting in a 0.5% duckweed aqueous extract (dry weight/water volume—wt/v). Lettuce leaves in variants M + L and L were treated with an extract from L. punctata at two time points—at the 5–7 true leaf stage (on 21 March 2025) and at the >10 true leaf stage (on 28 March 2025). In the first application, a dose of 2.5 mL per plant was used, and in the second, 5 mL per plant to ensure uniform coverage of the entire plant surface. The extract was freshly prepared for each treatment and applied using the FarmBot, version V1.7 (FarmBot, Inc., San Luis Obispo, CA, USA), a robotic system with a standard spray watering nozzle. The dose per plant was adjusted by modifying the movement speed of the robotic arm. The remaining portion of the extract was used for metabolomic analyses.
Harvest of Plants and Sampling
Lettuces were harvested on 7 April 2025, for the purpose of evaluating biometric parameters. Each of these parameters was measured on all 12 plants per variant (n = 12). For subsequent analyses of biochemical compounds, composite samples were prepared from three plants per variant, resulting in four replicates for analytical measurements (n = 4).
Assessment of Photosynthetic, Biometric, and Biochemical Parameters of Lettuce
Prior to harvest, Normalized Difference Vegetation Index (NDVI) and Quantum Yield (Qy) values were measured using handheld devices PlantPen NDVI 300 and FluorPen, version FP 110-LM/D (both from Photon Systems Instruments Ltd., Drásov, Czech Republic) at two time points during the experiment—on 28 March 2025 (before the second application of the Landoltia extract), and on 4 April 2025—on all 12 plants per variant (n = 12). After harvest, various biometric parameters were evaluated. Above-ground biomass was measured as the weight of the edible part using a scale with 0.1 g accuracy. Leaf area was measured using the mobile application LeafScan (developed by Carlos Anderson and Pablo Rosas-Anderson), with a white reference square of 30 cm edge length as a background. Plant height and leaf rosette diameter were measured with a ruler accurate to millimeters. Additionally, the total number of leaves per plant was recorded. Root parameters were not evaluated because the complete root system could not be extracted from the peat substrate without damage. However, fragments of roots from all of the variants were used for subsequent microscopic observation.
Among the biochemical parameters, the following were determined: the percentage of dry matter in the edible aboveground part, content of vitamin C, chlorophyll a and b, carotenoids, total phenolic compounds, flavonoids, DPPH antioxidant capacity, and nitrates.
The dry matter content of the aboveground plant biomass was determined gravimetrically using dryer type UNB300 (Memmert GmbH + Co. KG, Schwabach, Germany) at 105 °C until a constant weight of the weighing dishes was reached [44].
Vitamin C was analysed using high-performance liquid chromatography (ECOM Ltd., Prague, Czech Republic) with detector S-2600 (KNAUER Scientific Instruments Ltd., Berlin, Germany) and with an ARION® Polar C18 column (5 µm, 150 mm × 4.6 mm) and a mobile phase consisting of tetrabutylammonium hydroxide, oxalic acid, and water in a ratio of 10:20:70.
The determination of plant pigments (chlorophyll a, chlorophyll b, and carotenoids) was carried out according to the method of Holm [45]. According to this method, the pigments are extracted in acetone and subsequently measured spectrophotometrically using Specord 50 PLUS (CHROMSPEC Ltd., Mníšek pod Brdy, Czech Republic) at wavelengths of 662, 644, and 440 nm, in that order. The Holm equation [45] was used for the calculation of:
Chlorophyll a = 9.784 × A662 − 0.990 × A644;
Chlorophyll b = 21.426 × A644 − 4.650 × A662;
Total carotenoids = 4.685 × A440 − 0.268 × (chlorophyll a + chlorophyll b).
For the determination of total phenolic compounds, flavonoids, and DPPH antioxidant capacity, a methanolic extract of the samples was first prepared. Homogenized samples were extracted in 75% methanol for 24 h, filtered, and then adjusted to a final volume of 50 mL with 75% methanol. Total phenolic content was determined using the Folin–Ciocalteu reagent and a 7% sodium carbonate solution, with spectrophotometric measurement at 765 nm, according to Zloch, Čelakovský & Aujezdská [46]. The total content of flavonoids was determined using a 5% sodium nitrite solution, a 10% aluminium chloride solution, a 1 M sodium hydroxide solution, and a 1 mM catechin standard solution, with spectrophotometric measurement at 510 nm [46]. The total antioxidant capacity was determined using the DPPH spectrophotometric method, which is based on the scavenging of the DPPH+ radical cation (2,2-diphenyl-1-picrylhydrazyl). Under standard conditions, this cation exhibits a purple colour, which turns yellowish upon reduction. For the reaction, a 100 μM solution of DPPH and a 0.5 mM solution of Trolox (6-hydroxy-2,5,7,8-tetramethylchroman-2-carboxylic acid) were used. The resulting absorbance was measured at a wavelength of 515 nm [46].
Nitrate content in the samples was determined according to Zbíral [44], using an ion-selective electrode (type 07–35) and a mercury sulphate reference electrode (type RME 121), both by Monokrystaly Ltd., Přepeře, Czech Republic.
Amino Acid Metabolomic Profiling of the Landoltia punctata Extract
For the purpose of metabolome analysis in the Landoltia extract sample, 200 mL of a 0.5% extract was frozen at −18 °C and subsequently lyophilized using the AMARU device from the manufacturer Lyotrade Freeze Dryers Ltd., Prague, Czech Republic. Within the lyophilizer, the extract was first frozen for 2 h at −40 °C, then dried at a pressure ranging from 100 to 300 Pa, with the temperature not exceeding 35 °C for a duration of 36 h. The lyophilized sample was rinsed with HPLC-grade methanol (99.9%) and then diluted with the same methanol to a final volume of 100 mL.
For the analysis of the duckweed extract, high-performance liquid chromatography coupled with high-resolution mass spectrometry (HPLC-HRMS) was used. Acetonitrile hypergrade for LC-MS LiChrosolvR was supplied by Merck KGaA (Darmstadt, Germany). Acetic acid was obtained from Sigma-Aldrich Chemie GmbH (Steinheim, Germany). The Purelab Classic (ELGA LabWater, High Wycombe, Bucks, UK) was used to generate high purity water for preparation of aqueous mobile phase.
Samples were analysed for metabolomics twice on HPLC-HRMS with positive and negative polarity of MS-orbitrap. Both records from DAD detector and from high resolution mass spectrometer were monitored and saved to check the system and evaluate the results.
For the high-performance liquid chromatography part, a Dionex Ultimate 3000 (ThermoFisher Scientific, Waltham, MA, USA/Dionex RSLC, Dionex, Sunnyvale, CA, USA) was used. The column used was a Hypersil Gold column (C18) 150 mm × 2.1 mm, 3 μ (ThermoFisher Scientific, Waltham, MA, USA). Flow rate of mobile phases was 0.3 mL/min and column temperature was set to 30 °C. The HPLC mobile phase consisted of (A) acetonitrile and (B) water containing 0.1% acetic acid. Both mobile phases (A) and (B) were filtrated and degassed for 10 min in an ultrasonic bath prior to use. Gradient elution chromatography was performed starting with 10% acetonitrile (A) and 90% water (0.1% acetic acid) (B) and held for 5 min. Within a time interval (5–20 min), A% composition was increased to 90%. This composition was then maintained for 5 min, after which the system was equilibrated to initial conditions for 5 min (10% acetonitrile (A) and 90% water (0.1% acetic acid)). The following wavelengths were monitored: 254, 272, 274, and 331 nm.
MS and MSn were performed using LTQ Orbitrap XL-high resolution mass spectrometer (ThermoFisher Scientific, USA) equipped with a HESI II (Heated electrospray ionization) source. The high-resolution mass spectrometer (orbitrap) was operated in Full Scan with a resolution of 60,000. Full scan spectra were acquired over mass range m/z 50–1000 in positive mode and 65–1000 in negative mode. The resolution and sensitivity of the Orbitrap were controlled by injection of mixed standard (phenolic compounds) after analysing every 25 samples and resolution was also checked with the help of lock masses (phthalates). Blanks were also analysed during sequence. The compounds were searched in the mass library which was created from measurement of standards in MS and MSn modes of orbitrap.
Root Sample Processing for Microscopy
Sample preparation for microscopy was carried out according to methodology of Vierheilig, Schweiger & Brundrett [47]. Root samples were thoroughly rinsed with tap water, following strict procedures to avoid any cross-contamination between variants (including disinfection of tools and frequent replacement of disposable gloves). From each variant, at least 10 root segments approximately 1 cm in length were placed into Eppendorf tubes filled with PBS solution. The PBS solution was subsequently replaced with FAA fixative (formaldehyde, ethanol, acetic acid in a 10%:50%:5% ratio, plus 35% water). Samples were incubated in this fixative for 7 days.
After fixation, the samples were rinsed three times with deionized water. A pre-prepared mixture of fluorescent dyes (WGA, concanavalin A, and acid fuchsin in a 1:1:1 ratio) was then added to the samples. The root segments were incubated in this staining solution for 5 h at room temperature.
After staining, the samples were washed four times for 3 min each using PBS. During the final wash, the samples were left in PBS overnight (12 h). Prior to mounting, the PBS solution was replaced with deionized water, and the samples were gently rinsed.
Five root segments per variant were then mounted on microscope slides (root segments were aligned side by side). The roots were covered with VECTASHIELD mounting medium with DAPI and sealed with a cover slip.
The evaluation of mycorrhizal colonization of the roots was performed according to the method described by Alarcón & Cuenca [48]. For each of the 5 segments per variant, the percentage of mycorrhizal colonization was assessed, and a corresponding score was assigned on a scale from 0 to 5 (Table 1).

Table 1.
Evaluation of the degree of root colonization by mycorrhizal fungi according to Alarcón & Cuenca [48].
Confocal microscopy was completed using the LSM 800 (Carl Zeiss AG, Oberkochen, Germany) microscope at 405/420–480 nm, 488/500–550 nm, 590/617 nm, and 650/668 nm excitation/emission. Lenses used were 20x/0.8 NA. Processing of pictures was conducted in Zen Blue 3.0 software (Carl Zeiss AG, Oberkochen, Germany).
Statistical Analyses
Complete raw data are in form of supplemental material presented in Table S1. The data were processed and statistically analysed using Statistica 14 software package (DataBon Ltd., Prague, Czechia). Initially, extreme and outlying values were identified and removed using box plot analysis with a coefficient of 1.5. Subsequently, all monitored variables were tested for normality using the Shapiro–Wilk test at a significance level of α = 0.05. Simultaneously, the homogeneity of variances was assessed using Levene’s test at the same significance level (α = 0.05). For the data sets that met the assumptions of normality and homogeneity of variances, one-way analysis of variance (ANOVA) was employed. Statistically significant differences between groups were further evaluated using Fisher’s Least Significant Difference (LSD) post hoc test (α = 0.05). In cases where the data did not meet the assumptions of normality or homogeneity, the non-parametric Kruskal–Wallis ANOVA was applied. Statistically significant differences were subsequently identified through multiple comparisons of mean ranks across all groups (α = 0.05).
To investigate the relationships between measured traits, a correlation analysis was performed. Pearson’s correlation coefficient (r) was calculated to determine the strength and direction of the linear relationship between pairs of variables, conducted separately for the biometric and the analytical datasets. Statistical significance was set at α = 0.05.
3. Results
3.1. Plant Physiological Status
NDVI
Early in the plant’s development (28 March), no significant differences in the NDVI were observed among the treatments (Table 2). The Landoltia extract-only (L) treatment resulted in the highest mean NDVI of 0.604. The control group (C) and the combined treatment (M + L) showed similar mean values of 0.600 and 0.601, respectively. Interestingly, the mycorrhiza-only (M) treatment resulted in the lowest mean NDVI of 0.576.
Table 2.
Photosynthetic parameters of lettuce measured on two dates in four treatment variants.
On the second measurement date (4 April), the differences in NDVI between the treatments were also statistically insignificant. The mean NDVI values slightly decreased, with the control measuring 0.464, the M 0.507, the M + L 0.527, and the L treatment 0.509. The overall decrease in NDVI values across all groups could reflect a change in leaf physiology as the plants entered a new growth phase. Between 28 March and 4 April, the NDVI value in the control variant decreased by 0.136, while in the treated variants the decrease was noticeably lower, ranging from 0.095 to 0.069. This suggests that the application of biostimulants contributed to maintaining higher physiological activity and overall plant vitality compared to the untreated control.
Quantum Yield of Photosystem II
The quantum yield of photosystem II (Qy), which reflects the efficiency of the light-harvesting process, remained high and stable throughout the entire experiment (Table 2). Mean Qy values consistently ranged from 0.81 to 0.83 across all treatment groups at both measurement dates. Critically, no statistically significant differences were found between the variants on the first date. In spite of the significantly higher (0.82) result at M + L treatment in the second term, plants did not fundamentally alter or impair the core efficiency of the photosynthetic machinery. All plants, regardless of treatment, were photosynthetically healthy.
3.2. Biometric Parameters at Harvest
Above-ground Biomass
The above-ground fresh biomass was not significantly affected by the biostimulant applications (Table 3). The control plants (C) produced a mean biomass of 214.3 g. The application of mycorrhiza alone (M) resulted in a modest insignificant increase to 223.4 g. Both Landoltia treatments (L and M + L) showed a slight but not-significant decrease in mean biomass compared to the other variants, with mean values of 199.3 g and 199.2 g, respectively.
Table 3.
Biometric parameters of lettuce in four treatment variants.
Leaf Area, Plant Height and Diameter, and Number of Leaves
According to statistical evaluation, the applied treatments had no significant effect on leaf area, which ranged from 956.6 cm2 (in variant C) to 916.5 cm2 (in variant L). Lettuce height was also not affected by the treatment variant. It ranged from 166.8 mm (in variant M + L) to 161.8 mm (in variant M). The largest average rosette diameter was recorded in the control variant at 270.9 mm, which was significantly higher than the mean diameter in variant L (248.3 mm). All variants had an average of 28.9 leaves, with no statistically significant differences between treatments.
3.3. Qualitative and Compositional Analysis
Dry Matter Content
The mean percentage of leaf dry matter (Table 4) was highest in the Landoltia variant (4.89 ± 0.32%) and the mycorrhiza + Landoltia (M + L) variant (4.39 ± 0.81%). The control and mycorrhiza variants showed lower mean values of 3.93 ± 0.26% and 3.83 ± 0.11%, respectively. The assumption of homogeneity of variance was violated for this parameter (p < 0.05); therefore, the Kruskal–Wallis test was employed. Multiple comparison of p-values test revealed no statistically significant differences in the dry matter of leaves among the four treatment groups.
Table 4.
Qualitative parameters of lettuce in four treatment variants.
Vitamin C Content
The concentration of vitamin C (ascorbic acid), a key nutritional quality indicator, was not significantly altered by the biostimulant treatments. The highest mean concentration of vitamin C was recorded in the M + L variant (55.72 ± 4.00 mg/kg), followed by the Landoltia (49.54 ± 10.51 mg/kg) and control (49.05 ± 2.41 mg/kg) variants. The mycorrhiza variant exhibited the lowest mean value (44.08 ± 7.30 mg/kg).
Photosynthetic Pigments
The concentrations of photosynthetic pigments were significantly influenced by the treatments. For chlorophyll a, the post hoc test identified two distinct groups (Figure 1). The M + L (2001.69 ± 204.54 mg/kg) and L (2000.48 ± 101.57 mg/kg) variants showed significantly higher concentrations compared to both the control (1725.66 ± 70.15 mg/kg) and mycorrhiza (1713.91 ± 218.33 mg/kg) variants.
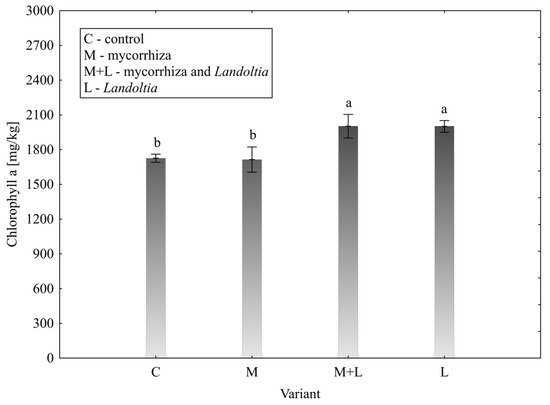
Figure 1.
Effect of treatment on total chlorophyll a content in lettuce leaves; error bars represent standard error (n = 4); different letters above the bars indicate statistically significant differences according to Fisher’s LSD post hoc test (α = 0.05).
For chlorophyll b, the analysis revealed a gradient of effects across three overlapping homogenous groups (Figure 2). The L variant (561.05 ± 36.24 mg/kg) and the M + L variant (515.51 ± 68.41 mg/kg) had significantly higher concentrations than the control variant (360.92 ± 58.39 mg/kg). The mycorrhiza variant (453.70 ± 81.20 mg/kg) did not differ significantly from either the control or the M + L and Landoltia variants, holding an intermediate position.
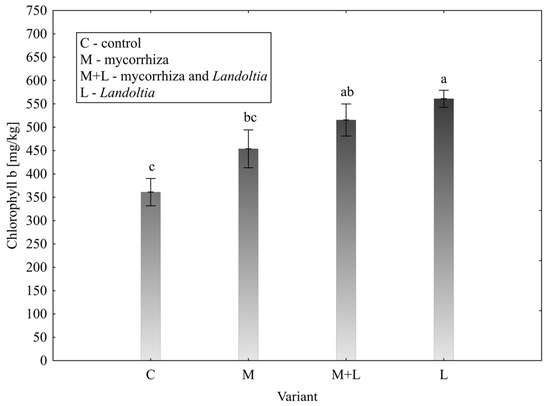
Figure 2.
Effect of treatment on total chlorophyll b content in lettuce leaves; error bars represent standard error (n = 4); different letters above the bars indicate statistically significant differences according to Fisher’s LSD post hoc test (α = 0.05).
Carotenoids
Analysis of carotenoid content (Figure 3) revealed that the control group (561.67 ± 72.13 mg/kg) had a significantly higher concentration than the mycorrhiza variant (414.02 ± 39.63 mg/kg) and M + L variant (483.30 ± 24.40 mg/kg). The Landoltia variant (520.27 ± 19.30 mg/kg) was not significantly different from the control or M + L variant.
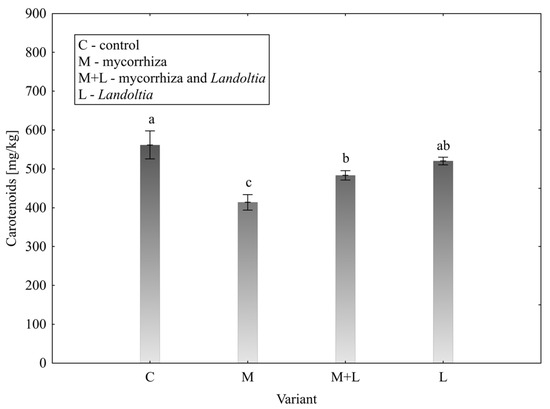
Figure 3.
Effect of treatment on the content of carotenoids in lettuce leaves; error bars represent standard error (n = 4); different letters above the bars indicate statistically significant differences according to Fisher’s LSD post hoc test (α = 0.05).
Phenolic and Flavonoid Content, Total Antioxidant Capacity
A statistically significant effect was observed on the accumulation of antioxidant compounds. The total amount of phenolic compounds (Figure 4) in control plants was 198.00 ± 16.14 mg/kg. This was significantly elevated in M + L treatment (254.28 ± 23.63 mg/kg). The rest of the treatments showed a similar level to the control—M (185.77 ± 34.61 mg/kg), L (207.84 ± 20.84 mg/kg).

Figure 4.
Effect of treatment on the content of phenolic compounds in lettuce leaves; error bars represent standard error (n = 4); different letters above the bars indicate statistically significant differences according to Fisher’s LSD post hoc test (α = 0.05).
The highest mean flavonoid content was recorded in variant M (110.22 ± 24.00 mg/kg), followed by variant M + L (105.83 ± 4.73 mg/kg), while variants C and L reached only 97.67 ± 8.79 mg/kg and 90.21 ± 20.87 mg/kg, respectively. However, no statistically significant differences were observed in the data.
The total antioxidant capacity was not significantly different among the four treatment groups. Although there were slight variations in the mean values, the post hoc tests confirmed that all variants belonged to a single homogenous group. The control group exhibited the highest mean antioxidant capacity, with a value of 126.68 ± 23.04 mg/kg; in contrast, variant M showed the lowest value of 113.14 ± 40.64 mg/kg.
Nitrate Content
The concentration of nitrates in the leaves (Figure 5), a critical parameter for food safety, was significantly affected by the treatments. The control group showed the highest mean nitrate level at 2402.08 ± 376.69 mg/kg. All biostimulant treatments significantly reduced this value, with the most effective being the M and M + L variant, which lowered the nitrate content to 1558.88 ± 192.32 and 1595.50 ± 137.00 mg/kg, respectively. A significant decrease was confirmed at the L treatment alone, too.
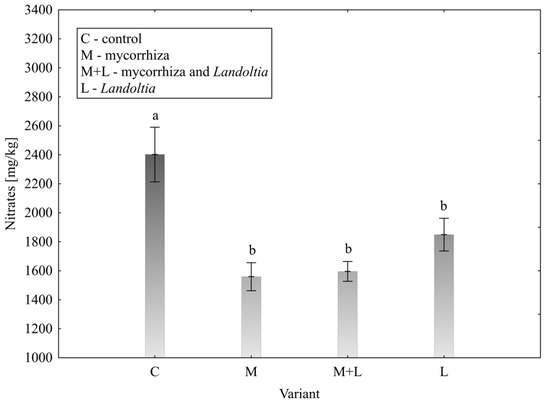
Figure 5.
Effect of treatment on the content of nitrates in lettuce leaves; error bars represent standard error (n = 4); different letters above the bars indicate statistically significant differences according to Fisher’s LSD post hoc test (α = 0.05).
Correlation Analysis
Correlation analyses were performed within the groups of biometric and analytical parameters, and Pearson correlation coefficients were calculated for all pairs of variables. Among the more significant relationships, a strong positive correlation was found between chlorophyll a and b parameters (Figure 6), with a Pearson correlation coefficient of r = 0.875. Furthermore, a strong positive correlation was also observed between carotenoid and nitrate content parameters (Figure 7), with r = 0.772.
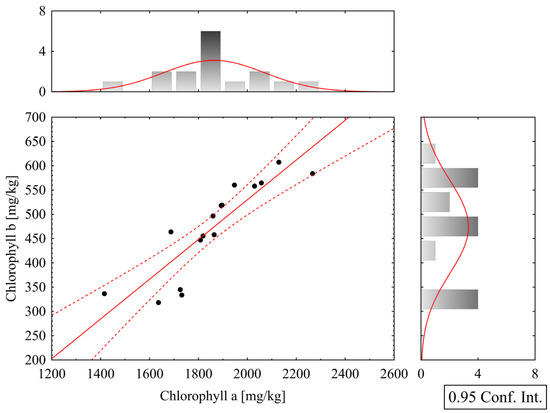
Figure 6.
Correlation graph of chlorophyll a and b content in lettuce leaves; red lines indicate the 95% confidence interval boundaries.
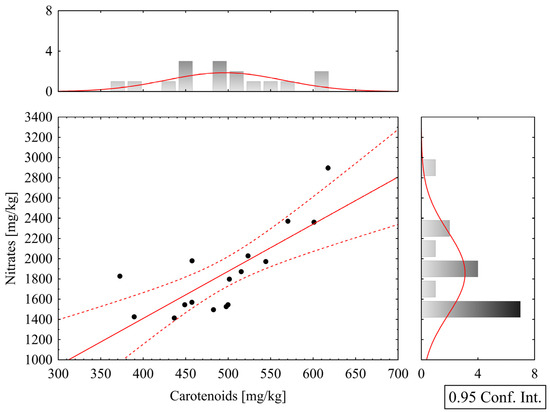
Figure 7.
Correlation graph of carotenoid and nitrate content in lettuce leaves; red lines indicate the 95% confidence interval boundaries.
3.4. Identified Amino Acids in the Aqueous Extract of Landoltia punctata
After performing a metabolomic analysis of a 0.5% aqueous extract of L. punctata (clone no. 5562), all proteinogenic amino acids (AAs) were detected, as well as two non-proteinogenic ones: gamma-aminobutyric acid (GABA) and hydroxyproline. The concentrations of individual amino acids are summarized in Table 5. The most abundant AAs were GABA and valine, with concentrations of 1548 and 1527 µg/mL, respectively, followed by phenylalanine (751 µg/mL) and tryptophan (551 µg/mL). Other highly represented AAs included alanine, leucine, arginine, aspartic acid, isoleucine, asparagine, glutamic acid, tyrosine, proline, and histidine, with concentrations ranging from 500 to 100 µg/mL. Glycine, threonine, glutamine and lysine were present, but their amounts were only in the tens of micrograms per mL. Minor amounts of methionine, hydroxyproline, serine, and cysteine (in units or less than one µg/mL) were also detected in the duckweed extract.
Table 5.
Amino acid composition in a 0.5% aqueous extract of Landoltia punctata (clone no. 5562).
3.5. Mycorrhizal Colonisation
The inoculation with AMF was confirmed as successful and treatment-specific. Microscopic analysis of the root systems revealed a complete absence of mycorrhizal structures in both the control (C) and Landoltia extract-only (L) variants, confirming a zero-colonisation rate. In contrast, plants from the combined treatment group (M + L) exhibited an evident mean colonisation of 42%. An even higher colonisation intensity was noted in the mycorrhiza-only (M), which achieved a mean rate of 58%. This successful establishment of the symbiosis is fundamental for interpreting the subsequent results.
Figure 8, Figure 9, Figure 10 and Figure 11 display a longitudinal section of a lettuce root cortex colonised by an arbuscular mycorrhizal fungus. The plant cell walls are distinguished by their blue autofluorescence, whereas the fungal structures are visualized in orange. The arrow labelled A indicates a mature, finely branched arbuscule occupying a cortical cell. Arrow M points to a developing arbuscule or a hyphal coil. The thread-like orange structures are the intercellular hyphae that proliferate within the root apoplast before penetrating host cells to form the arbuscules. Figure 8 and Figure 9 show mycorrhization in the M variant, while Figure 10 and Figure 11 in the M + L variant.
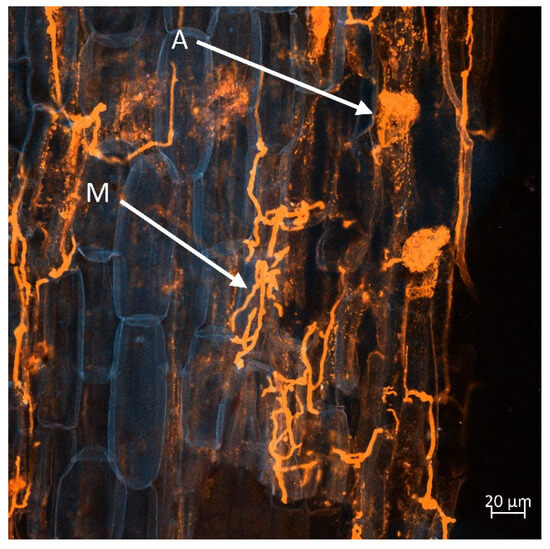
Figure 8.
An arbuscular mycorrhizal fungus colonising the root cortex of lettuce. Finely branched arbuscule (A) and a developing arbuscule or hyphal coil (M) within host cells. Fungal structures are visualised in orange, against the blue autofluorescence of the plant cell walls. Scale bar = 20 µm.
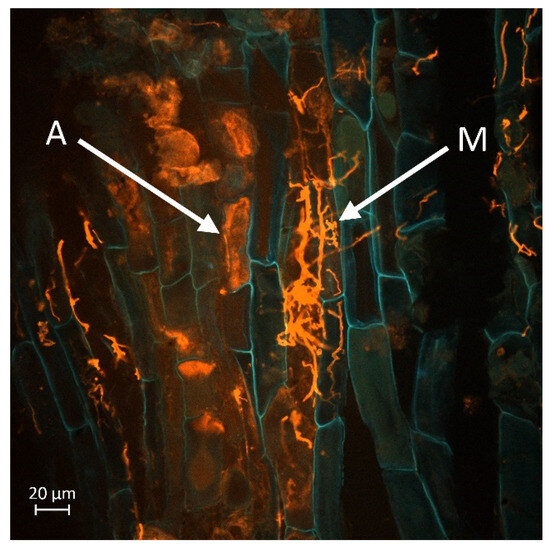
Figure 9.
Mature arbuscules of mycorrhizal fungus (A) developing in the cortical cells of a lettuce root. Newly developing arbuscule from mycelial hyphae (M). Scale bar = 20 µm.
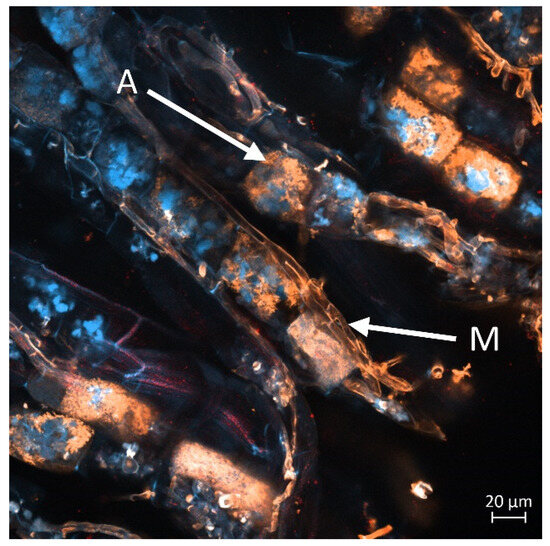
Figure 10.
Intraradical structures of an arbuscular mycorrhizal fungus within the root cortex of lettuce. The image displays intercellular hyphae forming the mycelium (M) and a developing arbuscule (A) inside a cortical cell. Scale bar = 20 µm.

Figure 11.
An extensive network of extramatrical mycelium (M) of an arbuscular mycorrhizal fungus colonising the tip of a lettuce root. This hyphal network is responsible for exploring the soil substrate and absorbing nutrients. Scale bar = 20 µm.
4. Discussion
Since this is a previously untested preparation, a metabolomic analysis of AAs in the aqueous extract of L. punctata was also conducted in order to link compositional information with potential stimulatory effects on lettuce plants. The results revealed particularly high levels of GABA, valine, phenylalanine, and tryptophan, including a complete set of proteinogenic amino acids. These data complement the findings of Regni et al. [41] and Del Buono et al. [38], who reported a metabolomic profile of Lemna minor extract containing, in addition to AAs, phytohormones, low-molecular-weight phenolic compounds (phenylpropanoids and their glycosides, flavonoids, and simple phenolic acids), glucosinolates, alkaloids, isoprenoids, tetraterpenes, and chlorophylls.
Furthermore, mycorrhizal symbiosis establishment was microscopically examined to confirm its potential influence on lettuce culture. Both mycorrhizal treatments showed average standard colonization rates of 58% (M) and 42% (M + L). AMF are known to be host-specific, meaning that different AMF species interact with different host plants at varying colonization levels, ranging from just a few percent to nearly 100% [49]. Microscopic assessment of AMF colonization confirmed that the inoculum was well suited for this plant species and can therefore be associated with the observed effects.
Photosynthetic parameters
The present study did not demonstrate significant effects of individual treatments on photosynthetic parameters. However, the substantially lower decline in NDVI values between the monitored dates across all treated variants suggests prolonged vegetation vitality and delayed chlorophyll degradation. A statistically significant increase in the quantum yield of photosystem II was observed only in the combined treatment with mycorrhiza and L. punctata extract (M + L) at the second measurement, whereas the extract alone did not show this effect.
Priolo et al. [43] reported a stronger response in tomato, where the effective quantum yield of photosystem II (ΦII, Phi2) was highest with 0.5% and 1% aqueous extracts of L. minor, although no differences were observed in the maximum quantum yield (Fv/Fm). Our results therefore suggest that the effect of L. punctata extract may be more evident in combination with mycorrhizal inoculation, though it cannot be excluded that a significant effect on ΦII could also appear under single extract application, similar to the findings of Priolo et al. [43] with L. minor.
Regni et al. [41] studied the effects of L. minor aqueous extract on olive trees, where 0.5% and 1% concentrations significantly increased net photosynthesis (Pn), stomatal conductance (gs), and substomatal CO2 concentration compared to the untreated control. A positive influence on photosystem II efficiency was also reported by Asadi et al. [50] after combined application of AMF (specifically Funneliformis mosseae, also included in our inoculum) with foliar application of 3 g/L seaweed extract. Moreover, Regni et al. [42] observed improved photosynthetic activity in olive trees treated with L. minor extract under increased salinity, similar to the findings of Miras-Moreno et al. [40] in maize exposed to excessive Cu concentrations.
Although current evidence supports the positive impact of duckweed extracts on the photosynthetic apparatus of plants, the specific effects of L. punctata extract alone and of mycorrhizal inoculation still require further clarification. Our results indicate that the observed increase in the quantum yield of photosystem II may result from their synergistic action as well as from the potential individual contributions of both treatments.
Biometric parameters
A number of studies have confirmed the positive effects of mycorrhizal inoculation on the growth and yield parameters of lettuce. For example, Zrig et al. [51] reported a 38.8% increase in lettuce yield following inoculation with F. mosseae compared to the control. Similarly, Han et al. [52] observed a 30% increase in lettuce plant height in variants inoculated with AMF (F. mosseae) compared to the control. In another experiment led by Rasouli et al. [20], co-application of AMF (F. mosseae) with foliar application of seaweed extract (3 g/L) increased the number of leaves by 44%, the average head diameter 3.6-fold, and head yield 3.4-fold compared to the control.
Although present study did not confirm statistically significant differences in biometric parameters, a similar trend was observed for above-ground biomass. The mean value in the M variant was slightly higher (223.4 g) compared to the untreated control (214.3 g). Previous studies with aqueous extracts of L. minor have also reported positive effects on biometric parameters such as fresh shoot weight, shoot dry matter, plant height, leaf area, and number of leaves, with the optimal concentration being 0.5% (the same concentration was used in this study) [38,41,43].
Regni et al. [42] further showed that salt stress induced by NaCl reduced several growth parameters in olive trees (number of leaves, lateral shoots, and plant height). However, after treatment with L. minor extract, these parameters recovered to levels comparable with unstressed controls. A similar trend was observed by Miras-Moreno et al. [40], where excess Cu caused a decline in growth parameters, but treatment with L. minor extract restored or even exceeded control values for plant height, root length, and fresh shoot weight.
The positive influence of duckweed extract on vegetative growth reported by these authors is likely related to a combination of factors: increased chlorophyll content, enhanced photosynthesis, uptake of organic N in the form of AAs via foliar nutrition, and thus accelerated protein biosynthesis.
Photosynthetic pigments and carotenoids
The study showed that variants treated with the Landoltia extract (L and M + L) had significantly higher concentrations of chlorophyll a than both the control and the mycorrhizal variant, while chlorophyll b was significantly higher only compared to the control. This suggests that compounds present in the extract may either promote chlorophyll synthesis or slow down its degradation. These findings are consistent with those of Priolo et al. [43] and Regni et al. [41].
In contrast, mycorrhizal application alone (M) in our study did not increase chlorophyll levels compared to the control, which contradicts the results of Cela et al. [53], who reported a 35% increase in chlorophyll in lettuce treated with F. mosseae at 35 days after treatment and a 50% increase at 53 days compared to the untreated control.
In our study, the sum of chlorophyll a + b was highest in the L variant (2561.53 mg/kg), followed by M + L (2517.2 mg/kg), M (2167.61 mg/kg), and the lowest in the control C (2086.58 mg/kg). An opposite trend was observed for carotenoids, which may indicate more intensive photosynthetic processes accompanied by reduced stress and thus a lower need for protective carotenoid pigments. In contrast, Priolo et al. [39] found that treatment of NaCl-stressed maize plants with L. minor extract had no effect on carotenoid content.
Qualitative parameters
Vitamin C content was not significantly affected by the treatments. Although a slight trend towards higher values was observed in the combined M + L treatment and in the L variant alone, the data did not follow a normal (Gaussian) distribution, and the variability within groups was too high to establish a statistically significant effect.
The treatments had different impacts on the antioxidant profile of lettuce. A clear synergistic effect was observed in the combined M + L variant, which resulted in a significantly higher content of total phenolic compounds compared to all other treatments. A similar synergistic effect was also reported by Rasouli et al. [20] with AMF application in combination with 3 g/L of seaweed extract. In contrast, no statistically significant differences were found in flavonoid content or in total antioxidant capacity as measured by the DPPH assay.
From a food safety perspective, one of the most valuable outcomes of this study is the significant reduction of nitrate concentrations in all biostimulant-treated variants. The M and M + L treatments were the most effective, reducing nitrate levels by 35% and 34%, respectively, compared to the control. This result is consistent with the known ability of AMF to improve nitrogen use efficiency in host plants [54]. Numerous studies demonstrate the effects of AMF on plant nitrogen metabolism. The mechanism of N uptake in the presence of AMF was concisely summarized by Shah, Nawaz, and Fahad [55], who reported that AMF primarily facilitates the uptake of NH4+. This ammonium is absorbed by the extraradical mycelium and incorporated into an organic form—arginine—via the glutamine synthetase–glutamate synthase (GS-GOGAT) system within the mycelium. In this form, nitrogen is transported, coupled with polyphosphate, to the intraradical mycelium, where the urea–arginine system releases NH4+ into the plant root. Excessive assimilation of NH4+ via this pathway may suppress the more energy-demanding assimilation of NO3−. This mechanism may thus represent a physiological explanation for why, in our experiment, the mycorrhizal variant exhibited a significantly lower nitrate content compared to the control. Another physiological explanation may be that the mycorrhizal inoculum also enhanced photosynthesis and the production of sugar compounds in plants, as observed for instance by Chen et al. [56] or Li et al. [57], which is closely linked to nitrogen metabolism and assimilation, potentially making these processes more rapid.
The Lemnoideae family is generally known for its high protein content in dry matter, consisting of a wide range of essential amino acids [58,59]. Therefore, an extract from representatives of this group could potentially act similarly to protein hydrolysate-based biostimulants. For example, Tsouvaltzis, Koukounaras, and Siomos [60] found that the Amino16® preparation reduced nitrate accumulation in lettuce (cv. ‘Simpson’) while simultaneously increasing antioxidant capacity. This theory is supported by the findings of Priolo et al. [39], who reported a significant increase in protein content in NaCl-stressed maize treated with L. minor extract, reaching levels comparable to unstressed control plants. Thus, future testing of this potentially biostimulant preparation from duckweed should also focus on total protein content.
Importantly, all measured values were well below the maximum permissible limits set by the European Commission (Regulation 2023/915), confirming the high quality and safety of the produce.
5. Conclusions
The application of arbuscular mycorrhizal fungi and an aqueous extract of Landoltia punctata did not significantly change the fresh biomass of lettuce under the experimental conditions. However, the treatments induced significant and beneficial changes in the plant’s biochemical profile. Notably, the Landoltia extract, applied both individually and in combination with mycorrhiza, led to a substantial increase in chlorophyll a and b concentrations. A clear synergistic effect was observed in the combined treatment (M + L), which was the only variant to significantly elevate the content of total phenolic compounds. Crucially, all biostimulant applications resulted in a significant reduction of nitrate levels in the leaves, a key parameter for food safety. These findings demonstrate that whilst these biostimulants may not serve as primary growth promoters in non-stressed, short-term cultivation, they are highly effective in modulating plant metabolism to enhance nutritional quality. The use of L. punctata extract, therefore, represents a promising strategy for producing lettuce with improved phytochemical content and greater consumer value. Since lettuce is a short-term crop, both biostimulants and their potentially synergistic effects should also be evaluated in longer-term crops.
Supplementary Materials
The following supporting information can be downloaded at: https://www.mdpi.com/article/10.3390/horticulturae11111310/s1, Table S1: Experimental raw data.
Author Contributions
Conceptualization, R.P. and K.P.; methodology, R.P. and K.P.; software, M.O.; validation, V.F., J.T. and K.P.; investigation, V.F. and V.S.; resources, J.T. and P.B.; data curation, K.P.; writing—original draft preparation, R.P., K.P. and V.F.; writing—review and editing, R.P., K.P. and J.T.; visualization, R.P. and K.P.; supervision, R.P. and J.T.; funding acquisition, R.P., P.B. and V.M. All authors have read and agreed to the published version of the manuscript.
Funding
This research was funded by the Ministry of Agriculture of the Czech Republic, National Agency for Agricultural Research, as part of project QK23020097—Sustainability of growing procedures in vegetable production using targeted applications and robotic platforms, by the Ministry of Education, Youth and Sports of the Czech Republic, project number CZ.02.01.01/00/22_008/0004635, and co-financed from Operational Programme Research, Development and Education—Research Infrastructure for Young Scientists, project number CZ.02.1.01/0.0/0.0/16_017/0002334.
Data Availability Statement
The original contributions presented in this study are included in the article/Supplementary Material. Further inquiries can be directed to the corresponding author.
Conflicts of Interest
The authors declare no conflicts of interest.
References
- Boincean, B. From Green Revolution to Green Agriculture: Horizons to Rethinking and Transforming Agrifood Systems for People and the Planet. Available online: https://www.fao.org/platforms/green-agriculture/news/news-detail/from-green-revolution-to-green-agriculture--horizons-to-rethinking-and-transforming-agrifood-systems-for-people-and-the-planet/en (accessed on 15 August 2025).
- IFA. Fertilizer Consumption—Historical Trends by Country or Region. Available online: https://www.ifastat.org/databases/graph/1_1 (accessed on 17 August 2025).
- FAO. Land Statistics 2001–2022 Global, Regional and Country Trends. Available online: https://openknowledge.fao.org/server/api/core/bitstreams/b359009a-d35d-47af-aca2-fd6a5bc71980/content (accessed on 17 August 2025).
- FAO. Pesticides Use. Available online: https://www.fao.org/faostat/en/#data/RP/visualize (accessed on 17 August 2025).
- Silva, J.; Duarte, S.N.; Silva, D.D.; Miranda, N.O. Reclamation of salinized soils due to excess of fertilizers: Evaluation of leaching systems and equations. Dyna 2019, 86, 115–124. [Google Scholar] [CrossRef]
- Zhang, Y.; Ye, C.; Su, Y.; Peng, W.; Lu, R.; Liu, Y.; Huang, H.; He, X.; Yang, M.; Zhu, S. Soil Acidification caused by excessive application of nitrogen fertilizer aggravates soil-borne diseases: Evidence from literature review and field trials. Agric. Ecosyst. Environ. 2022, 340, 108176. [Google Scholar] [CrossRef]
- Bebber, D.P.; Richards, V. A meta-analysis of the effect of organic and mineral fertilizers on soil microbial diversity. Appl. Soil Ecol. 2022, 175, 104450. [Google Scholar] [CrossRef]
- Uddin, M.S.; Kurosawa, K. Effect of chemical nitrogen fertilizer application on the release of arsenic from sediment to groundwater in Bangladesh. Procedia Environ. Scis. 2011, 4, 294–302. [Google Scholar] [CrossRef]
- Zhou, W.; Lv, H.; Chen, F.; Wang, Q.; Li, J.; Chen, Q.; Liang, B. Optimizing nitrogen management reduces mineral nitrogen leaching loss mainly by decreasing water leakage in vegetable fields under plastic-shed greenhouse. Environ. Pollut. 2022, 308, 119616. [Google Scholar] [CrossRef]
- Lee, G.F.; Jones-Lee, A. Eutrophication (Excessive Fertilization). In Water Encyclopedia; Lehr, J.H., Keeley, J., Eds.; John Wiley & Sons: Hoboken, NJ, USA, 2005. [Google Scholar] [CrossRef]
- Menegat, S.; Ledo, A.; Tirado, R. Greenhouse gas emissions from global production and use of nitrogen synthetic fertilisers in agriculture. Sci. Rep. 2022, 12, 14490. [Google Scholar] [CrossRef]
- Jardin, P.D. Plant biostimulants: Definition, concept, main categories and regulation. Sci. Hortic. 2015, 196, 3–14. [Google Scholar] [CrossRef]
- European Parliament and Council (EU). Regulation (EU) 2019/1009 of the European Parliament and of the Council of 5 June 2019 Laying Down Rules on the Making Available on the Market of EU Fertilising Products. Available online: https://eur-lex.europa.eu/eli/reg/2019/1009/oj/eng (accessed on 2 September 2025).
- Rossini, A.; Ruggeri, R.; Rossini, F. Combining nitrogen fertilization and biostimulant application in durum wheat: Effects on morphophysiological traits, grain production, and quality. Ital. J. Agron. 2025, 20, 100027. [Google Scholar] [CrossRef]
- Fall, A.F.; Nakabonge, G.; Ssekandi, J.; Founoune-Mboup, H.; Badji, A.; Ndiaye, A.; Kyakuwa, P.; Anyoni, O.G.; Kabaseke, C.; Ronoh, A.K.; et al. Combined Effects of Indigenous Arbuscular Mycorrhizal Fungi (AMF) and NPK Fertilizer on Growth and Yields of Maize and Soil Nutrient Availability. Sustainability 2023, 15, 2243. [Google Scholar] [CrossRef]
- Spatafora, J.W.; Chang, Y.; Benny, G.L.; Lazarus, K.; Smith, M.E.; Berbee, M.L.; Bonito, G.; Corradi, N.; Grigoriev, I.; Gryganskyi, A.; et al. A phylum-level phylogenetic classification of zygomycete fungi based on genome-scale data. Mycologia 2016, 108, 1028–1046. [Google Scholar] [CrossRef]
- Schoch, C.L. Glomeromycetes. Available online: https://www.ncbi.nlm.nih.gov/Taxonomy/Browser/wwwtax.cgi?mode=Tree&id=214506&lvl=3&lin=f&keep=1&srchmode=1&unlock (accessed on 8 September 2025).
- Gryndler, M. Mycorrhizal Symbiosis; Academia: Praha, Czech Republic, 2004; ISBN 80-200-1240-0. (In Czech) [Google Scholar]
- Smith, S.E.; Read, D. Mycorrhizal Symbiosis, 3rd ed.; Academic Press: London, UK, 2008; pp. 59–63. [Google Scholar] [CrossRef]
- Rasouli, F.; Amini, T.; Asadi, M.; Hassanpouraghdam, M.B.; Aazami, M.A.; Ercisli, S.; Skrovankova, S.; Mlcek, J. Growth and Antioxidant Responses of Lettuce (Lactuca sativa L.) to Arbuscular Mycorrhiza Inoculation and Seaweed Extract Foliar Application. Agronomy 2022, 12, 401. [Google Scholar] [CrossRef]
- Keller-Pearson, M.; Liu, Y.; Peterson, A.; Pederson, K.; Willems, L.; Ané, J.-M.; Silva, E.M. Inoculation with arbuscular mycorrhizal fungi has a more significant positive impact on the growth of open-pollinated heirloom varieties of carrots than on hybrid cultivars under organic management conditions. Agric. Ecosyst. Environ. 2020, 289, 106712. [Google Scholar] [CrossRef]
- Nedorost, L.; Pokluda, R. Effect of arbuscular mycorrhizal fungi on tomato yield and nutrient uptake under different fertilization levels. Acta Univ. Agric. Silvic. Mendel. Brun. 2012, 60, 181–186. [Google Scholar] [CrossRef]
- Lee, Y.; Choi, H.J.; Shiga, T. Taxonomic identity of Landoltia punctata (Araceae, Lemnoideae) in Korea. J. Asia-Pac. Biodivers. 2020, 13, 494–498. [Google Scholar] [CrossRef]
- UF IFAS. Landoltia punctata, Dotted Duckweed. Available online: https://plant-directory.ifas.ufl.edu/plant-directory/landoltia-punctata/ (accessed on 14 September 2025).
- Xu, H.; Yu, C.; Xia, X.; Li, M.; Li, H.; Wang, Y.; Wang, S.; Wang, C.; Ma, Y.; Zhou, G. Comparative transcriptome analysis of duckweed (Landoltia punctata) in response to cadmium provides insights into molecular mechanisms underlying hyperaccumulation. Chemosphere 2018, 190, 154–165. [Google Scholar] [CrossRef] [PubMed]
- Neag, E.; Malschi, D.; Măicăneanu, A. Isotherm and kinetic modelling of Toluidine Blue (TB) removal from aqueous solution using Lemna minor. Int. J. Phytoremediation 2018, 20, 1049–1054. [Google Scholar] [CrossRef] [PubMed]
- Yue, L.; Zhao, J.; Yu, X.; Lv, K.; Wang, Z.; Xing, B. Interaction of CuO nanoparticles with duckweed (Lemna minor L.): Uptake, distribution and ROS production sites. Environ. Pollut. 2018, 243, 543–552. [Google Scholar] [CrossRef] [PubMed]
- Pop, C.-E.; Draga, S.; Măciucă, R.; Niță, R.; Crăciun, N.; Wolff, R. Bisphenol A Effects in Aqueous Environment on Lemna minor. Processes 2021, 9, 1512. [Google Scholar] [CrossRef]
- Sikorski, Ł.; Baciak, M.; Bęś, A.; Adomas, B. The effects of glyphosate-based herbicide formulations on Lemna minor, a non-target species. Aquat. Toxicol. 2019, 209, 70–80. [Google Scholar] [CrossRef]
- Drobniewska, A.; Giebułtowicz, J.; Wawryniuk, M.; Kierczak, P.; Nałęcz-Jawecki, G. Toxicity and bioaccumulation of selected antidepressants in Lemna minor (L.). Ecohydrol. Hydrobiol. 2024, 24, 262–270. [Google Scholar] [CrossRef]
- Ahmad, Z.; Hossain, N.; Hussain, S.; Khan, A.H. Effect of duckweed (Lemna minor) as complement to fertilizer nitrogen on the growth and yield of rice. Int. J. Trop. Agric. 1990, 8, 72–79. [Google Scholar]
- Hong, C.; Wang, Z.; Wang, Y.; Zong, X.; Qiang, X.; Li, Q.; Shaghaleh, H.; Hamoud, Y.A.; Guo, X. Response of duckweed to different irrigation modes under different fertilizer types and rice varieties: Unlocking the potential of duckweed (Lemna minor L.) in rice cultivation as “fertilizer capacitors”. Agric. Water Manag. 2024, 292, 108681. [Google Scholar] [CrossRef]
- Pulido, C.R.; Caballero, J.; Bruns, M.A.; Brennan, R.A. Recovery of waste nutrients by duckweed for reuse in sustainable agriculture: Second-year results of a field pilot study with sorghum. Ecol. Eng. 2021, 168, 106273. [Google Scholar] [CrossRef]
- Mahofa, R.; Kapenzi, A.; Masaka, J. The effects of different types of duckweed manure on height and yield of floridade tomatoes. Midlands State Univ. J. Sci. Agric. Technol. 2014, 5, 135–152. [Google Scholar]
- Baldi, A.; Verdi, L.; Piacenti, L.; Lenzi, A. From Waste to Resource: Use of Lemna minor L. as Unconventional Fertilizer for Lettuce (Lactuca sativa L.). Horticulturae 2025, 11, 20. [Google Scholar] [CrossRef]
- Pratiwi, A.; Aji, O.R.; Sumbudi, M. Growth Response and Biochemistry of Red Spinach (Amaranthus tricolor L.) with the Application of Liquid Organic Fertilizer Lemna sp. J.Biotechnol. Nat. Sci. 2022, 2, 61–69. [Google Scholar] [CrossRef]
- Chikuvire, T.J.; Muchaonyerwa, P.; Zengeni, R. Improvement of nitrogen uptake and dry matter content of Swiss chard by pre-incubation of duckweeds in soil. Int. J. Recycl. Org. Waste Agric. 2019, 8, 235–244. [Google Scholar] [CrossRef]
- Buono, D.D.; Bartucca, M.L.; Ballerini, E.; Senizza, B.; Lucini, L.; Trevisan, M. Physiological and Biochemical Effects of an Aqueous Extract of Lemna minor L. as a Potential Biostimulant for Maize. J. Plant Growth Regul. 2022, 41, 3009–3018. [Google Scholar] [CrossRef]
- Priolo, D.; Tolisano, C.; Ballerini, E.; Brienza, M.; Buono, D.D. Stimulatory Effect of an Extract of Lemna minor L. in Protecting Maize from Salinity: A Multifaceted Biostimulant for Modulating Physiology, Red. Balance, and Nutrient Uptake. Agriculture 2024, 14, 705. [Google Scholar] [CrossRef]
- Miras-Moreno, B.; Senizza, B.; Regni, L.; Tolisano, C.; Proietti, P.; Trevisan, M.; Lucini, L.; Rouphael, Y.; Buono, D.D. Biochemical Insights into the Ability of Lemna minor L. Extract to Counteract Copper Toxicity in Maize. Plants 2022, 11, 2613. [Google Scholar] [CrossRef] [PubMed]
- Regni, L.; Buono, D.D.; Miras-Moreno, B.; Senizza, B.; Lucini, L.; Trevisan, M.; Venturi, D.M.; Costantino, F.; Proietti, P. Biostimulant Effects of an Aqueous Extract of Duckweed (Lemna minor L.) on Physiological and Biochemical Traits in the Olive Tree. Agriculture 2021, 11, 1299. [Google Scholar] [CrossRef]
- Regni, L.; Tolisano, C.; Buono, D.D.; Priolo, D.; Proietti, P. Role of an Aqueous Extract of Duckweed (Lemna minor L.) in Increasing Salt Tolerance in Olea europaea L. Agriculture 2024, 14, 375. [Google Scholar] [CrossRef]
- Priolo, D.; Tolisano, C.; Brienza, M.; Buono, D.D. Insight into the Biostimulant Effect of an Aqueous Duckweed Extract on Tomato Plants. Agriculture 2024, 14, 808. [Google Scholar] [CrossRef]
- Zbíral, J. Analysis of Plant Material: Standardized Procedures; ÚKZÚZ: Brno, Czech Republic, 2005. (In Czech) [Google Scholar]
- Holm, G. Chlorophyll mutations in barley. Acta Agric. Scand. 1954, 4, 457–471. [Google Scholar] [CrossRef]
- Celakovský, J.; Aujezdská, A. Stanovení obsahu polyfenolů a celkové antioxidační kapacity v potravinách rostlinného původu. In Závěrečná zpráva o plnění výzkumného projektu podpořeného finančně Nadačním fondem Institutu Danone; Ústav hygieny Lékařské fakulty UK: Plzeň, Czech Republic, 2004. (In Czech) [Google Scholar]
- Vierheilig, H.; Schweiger, P.; Brundrett, M.C. An overview of methods for the detection and observation of arbuscular mycorrhizal fungi in roots. Physiol. Plant. 2005, 125, 393–404. [Google Scholar] [CrossRef]
- Alarcón, C.; Cuenca, G. Arbuscular mycorrhizas in coastal sand dunes of the Paraguaná Peninsula, Venezuela. Mycorrhiza 2005, 16, 1–9. [Google Scholar] [CrossRef]
- Carrenho, R.; Trufem, S.F.; Bononi, V.L.; Silva, E.S. The effect of different soil properties on arbuscular mycorrhizal colonization of peanuts, sorghum and maize. Acta Bot. Bras. 2007, 21, 723–730. [Google Scholar] [CrossRef]
- Asadi, M.; Rasouli, F.; Amini, T.; Hassanpouraghdam, M.B.; Souri, S.; Skrovankova, S.; Mlcek, J.; Ercisli, S. Improvement of Photosynthetic Pigment Characteristics, Mineral Content, and Antioxidant Activity of Lettuce (Lactuca sativa L.) by Arbuscular Mycorrhizal Fungus and Seaweed Extract Foliar Application. Agronomy 2022, 12, 1943. [Google Scholar] [CrossRef]
- Zrig, A.; Alsherif, E.A.; Aloufi, A.S.; Korany, S.M.; Selim, S.; Almuhayawi, M.S.; Tarabulsi, M.K.; Nhs, M.; Albasri, H.M.; Bouqellah, N.A. The biomass and health-enhancing qualities of lettuce are amplified through the inoculation of arbuscular mycorrhizal fungi. BMC Plant Biol. 2025, 25, 521. [Google Scholar] [CrossRef] [PubMed]
- Han, Z.; Zhang, Z.; Li, Y.; Wang, B.; Xiao, Q.; Li, Z.; Geng, X.; Lin, K.; Huang, T.; Li, X.; et al. Effect of Arbuscular mycorrhizal fungi (AMF) inoculation on endophytic bacteria of lettuce. Physiol. Mol. Plant Pathol. 2023, 126, 102036. [Google Scholar] [CrossRef]
- Cela, F.; Avio, L.; Giordani, T.; Vangelisti, A.; Cavallini, A.; Turrini, A.; Sbrana, C.; Pardossi, A.; Incrocci, L. Arbuscular Mycorrhizal Fungi Increase Nutritional Quality of Soilless Grown Lettuce while Overcoming Low Phosphorus Supply. Foods 2022, 11, 3612. [Google Scholar] [CrossRef] [PubMed]
- Aini, N.; Yamika, W.S.; Ulum, B. Effect of nutrient concentration, PGPR and AMF on plant growth, yield and nutrient uptake of hydroponic lettuce. Int. J. Agric. Biol. 2019, 21, 175–183. [Google Scholar] [CrossRef]
- Shah, S.; Nawaz, T.; Fahad, S. Arbuscular mycorrhizal fungi role in plant beneficial elements uptake and nutrient acquisition. Rhizosphere 2025, 35, 101141. [Google Scholar] [CrossRef]
- Chen, S.; Zhao, H.; Zou, C.; Li, Y.; Chen, Y.; Wang, Z.; Jiang, Y.; Liu, A.; Zhao, P.; Wang, M.; et al. Combined Inoculation with Multiple Arbuscular Mycorrhizal Fungi Improves Growth, Nutrient Uptake and Photosynthesis in Cucumber Seedlings. Front. Microbiol. 2017, 8, 2516. [Google Scholar] [CrossRef]
- Li, H.; Zhang, L.; Wu, B.; Li, Y.; Wang, H.; Teng, H.; Wei, D.; Yuan, Z.; Yuan, Z. Physiological and proteomic analyses reveal the important role of arbuscular mycorrhizal fungi on enhancing photosynthesis in wheat under cadmium stress. Ecotoxicol. Environ. Saf. 2023, 261, 115105. [Google Scholar] [CrossRef] [PubMed]
- Hu, Z.; Fang, Y.; Yi, Z.; Tian, X.; Li, J.; Jin, Y.; He, K.; Liu, P.; Du, A.; Huang, Y.; et al. Determining the nutritional value and antioxidant capacity of duckweed (Wolffia arrhiza) under artificial conditions. LWT 2022, 153, 112477. [Google Scholar] [CrossRef]
- Sembada, A.A.; Faizal, A. Protein and Lipid Composition of Duckweeds (Landoltia punctata and Wolffia arrhiza) Grown in a Controlled Cultivation System. Asian J. Plant Sci. 2022, 21, 637–642. [Google Scholar] [CrossRef]
- Tsouvaltzis, P.; Koukounaras, A.; Siomos, A. Application of Amino Acids Improves Lettuce Crop Uniformity and Inhibits Nitrate Accumulation Induced by the Supplemental Inorganic Nitrogen Fertilization. Int. J. Agric. Biol. 2014, 16, 951–955. [Google Scholar]
Disclaimer/Publisher’s Note: The statements, opinions and data contained in all publications are solely those of the individual author(s) and contributor(s) and not of MDPI and/or the editor(s). MDPI and/or the editor(s) disclaim responsibility for any injury to people or property resulting from any ideas, methods, instructions or products referred to in the content. |
© 2025 by the authors. Licensee MDPI, Basel, Switzerland. This article is an open access article distributed under the terms and conditions of the Creative Commons Attribution (CC BY) license (https://creativecommons.org/licenses/by/4.0/).