Abstract
With the rapid development of agriculture, tomatoes, as an important economic crop, require accurate ripeness recognition technology to enable selective harvesting. Therefore, intelligent tomato ripeness recognition plays a crucial role in agricultural production. However, factors such as lighting conditions and occlusion lead to issues such as low detection accuracy, false detections, and missed detections. Thus, a deep learning algorithm for tomato ripeness detection based on an improved YOLOv8n is proposed in this study. First, the improved YOLOv8 model is used for tomato target detection and ripeness classification. The RCA-CBAM (Region and Color Attention Convolutional Block Attention Module) module is introduced into the YOLOv8 backbone network to enhance the model’s focus on key features. By incorporating attention mechanisms across three dimensions—color, channel, and spatial attention—the model’s ability to recognize changes in tomato color and spatial positioning is improved. Additionally, the BiFPN (Bidirectional Feature Pyramid Network) module is introduced to replace the traditional PANet connection, which achieves efficient feature fusion across different scales of tomato skin color, size, and surrounding environment and optimizes the expression ability of the feature map. Finally, an Inner-FocalerIoU loss function is designed and integrated to address the difficulty of ripeness classification caused by class imbalance in the samples. The results show that the improved YOLOv8+ model is capable of accurately recognizing the ripeness level of tomatoes, achieving relatively high values of 95.8% precision value and 91.7% accuracy on the test dataset. It is concluded that the new model has strong detection performance and real-time detection.
1. Introduction
Tomato is one of the most important vegetable crops in the world and occupies an important position in the development of global agricultural production and trade [1]. Meanwhile, as a health food rich in lycopene, vitamin C, flavonoids, and other nutrients [2], tomato not only has special effects such as antioxidants and prevention of cardiovascular diseases but also is an indispensable vegetable in people’s daily diet at a low price. The global planting area of tomatoes is expanding year by year [3]. Tomato planting production areas are mainly concentrated in Xinjiang, Inner Mongolia, Hebei, Shandong, Henan, Jiangsu, Sichuan, Yunnan, and other provinces. However, traditional tomato harvesting mainly relies on manual work, which is inefficient and faces rising labor costs and shortages year by year [4]. Meanwhile, fruit damage, incorrect ripeness judgment, and other issues often arise during manual harvesting [5,6], further affecting fruit quality and economic benefits. Therefore, accurate and intelligent recognition of tomato ripeness is of great significance for improving the automation level of tomato picking, ensuring fruit quality, and reducing production costs.
However, in the actual production process, a transition period exists as tomatoes progress from unripe to fully ripe, during which the fruit exhibits complex color characteristics. The color change of the process is as follows: unripe: dark green; color break: greenish white, with a slight reddish tinge starting to appear at the tip; color change: yellowish green with pinkish red; ripening: 50–70% of the surface becomes red; full ripening: more than 90% of the surface shows deep red [7]. At the same time, there are many influences and interferences on ripening recognition: due to the color distortion caused by changing lighting conditions and shadows interfering with color judgment, subtle color differences between fruits of similar ripeness, occlusion leading to difficulty in feature extraction, and other issues, in addition to the transportation needs of tomatoes, In addition, considering the transportation needs of tomatoes and fresh date sales and other factors [8], it is necessary to accurately distinguish tomatoes at different ripening stages by color [9] and adopt different deployment and sales schemes for them. Therefore, this puts forward higher requirements for ripeness recognition.
At present, the main methods for fruit ripeness recognition include traditional methods, machine vision recognition, and deep learning [10]. Traditional methods achieve fruit color recognition through algorithms designed to extract features. In the field of machine vision, Behera et al. [11] proposed two methods for lossless classification of papaya ripeness based on machine learning and transfer learning. Experiments demonstrated that both new learning methods achieved 100% classification accuracy. However, machine learning methods are limited in data processing capacity, and they require segmented processing, which is cumbersome. Michael et al. [12] proposed a robotic vision system to enhance the performance of pepper ripeness estimation by incorporating a parallel layer into the Faster R-CNN framework. Experimental results showed that the F1 score was higher than the score of 72.5 when ripeness was treated as an additional category. However, the new framework exhibited lower accuracy when handling small targets, which may affect the estimation of ripeness details, particularly for small bell peppers. Longshen Fu et al. [13] used RGB-D sensors to detect and localize fruits, improving the localization accuracy of robotic picking. Among the many methods mentioned above, when lighting conditions, background environments, and other factors change, the accuracy of algorithm recognition can be significantly affected [14].
In fruit ripeness recognition, traditional methods extract information such as fruit color by hand, which makes it difficult to fully reflect the ripeness characteristics and is easy to overfit when dealing with small samples. In addition, machine vision methods rely on data annotation and have poor generalization ability to the model, while the system is more sensitive to environmental factors such as light and background changes, affecting recognition accuracy.
In recent years, deep learning has developed rapidly, and most fruit ripeness recognition methods are based on deep learning, which also makes convolutional neural networks a common method for fruit recognition. By pre-collecting images and constructing large datasets to meet the various characteristics of the target to be detected, important features of the fruit, including color, shape, etc., can be autonomously learned by the neural network, allowing for quick and efficient recognition of various types of fruit [15]. At this stage, deep learning target detection algorithms can be roughly divided into four categories: two-stage detection algorithms (two-stage), single-stage detection algorithms (one-stage), anchor-free detection algorithms [16], and transformer-based [17] detection algorithms. For two-stage detection algorithms, representative methods such as the R-CNN family [18] (Fast R-CNN [19], Mask R-CNN [20], etc.) are used. This type of algorithm has high accuracy but relatively slow speed, which makes it difficult to meet the real-time requirements in production. For example, the Faster R-CNN model was improved by Zhang et al. [21] by introducing jump connections to enhance feature extraction capabilities, achieving a high detection accuracy of 83.12% and a high processing speed. However, a bottleneck in real-time model detection still exists. Xiangyang Xu et al. [22] applied deep learning for intelligent road crack detection. The results show that the joint training strategy can effectively complete the detection task and outperform YOLOv3 when using more than 130 images, but it will make the bounding box detection of Mask R-CNN less effective. For single-stage detection algorithms, including the YOLO series [23], SSD (Single Shot Detector) [24], and PSP-Net [25], the reduction of candidate box generation and acceleration of the screening process improve real-time performance, but slightly lower accuracy than two-stage algorithms is often observed. Liu Guoxu et al. [26] proposed an improved tomato detection model based on YOLOv3 to address detection challenges in complex environments, such as lighting changes and occlusion. The new model performed the best among multiple state-of-the-art detection methods, but detection accuracy was slightly lower for heavily occluded targets. Yifan Bai et al. [27] proposed an improved YOLOv7 model for the real-time recognition of strawberry seedling flowers and fruits in greenhouses, combining the Swin Transformer prediction head and GS-ELAN network neck optimization module. The experimental results show that the new model exhibits high robustness and real-time detection capability, but challenges may still arise when handling low-contrast images. Dandan Wang et al. [28] proposed a YOLO V5s algorithm based on channel pruning for fast and accurate detection of young apple fruits. The experimental results showed the method performed well under various conditions, achieving an accuracy of 95.8%, which provides a reference for orchard management and portable fruit thinning equipment development. An improved algorithm based on DenseNet and feature fusion was proposed by Sheping Zhai [29] to improve SSD’s performance in small target detection. Experimental results indicated that DF-SSD detection accuracy improved by 3.1%, with fewer parameters, but it may not apply to small target detection in very complex backgrounds. Meanwhile, Ying Li et al. [30] proposed a real-time accurate surface defect detection method based on MobileNet-SSD.
Existing deep learning target detection algorithms still need to be balanced between real-time performance and accuracy, and their performance is often unstable under environmental factors such as changes in lighting and occlusion. In addition, the accuracy and stability of some algorithms in multi-target and small-target detection are still challenged, while the accuracy in detecting details and the adaptability to different environments need to be improved.
To address these issues, this study proposes an improved YOLOv8n model for rapid detection of tomato ripening to improve agricultural productivity, ensure product quality, and meet the challenges of large-scale cultivation. The model’s ability to extract tomato color and size features is enhanced by the introduction of the RCA-CBAM (Region and Color Attention Convolutional Block Attention Module) attention mechanism. Additionally, a BiFPN (Bidirectional Feature Pyramid Network) module is integrated into the new model to achieve more efficient feature fusion and contextual information integration across different hierarchical scales (color, environment, etc.), allowing the model to better handle tomato samples of varying sizes. Finally, the Inner-FocalerIoU loss function is designed to optimize the training process, improving the model’s performance in edge cases (e.g., small tomatoes, branch and leaf occlusion, strong and weak lighting, and other complex environments). The method reduces computational complexity while maintaining high recognition accuracy. Experimental results show that the improved model can accurately recognize the ripeness of tomatoes and meet real-time requirements.
In part 2 of this paper, the process of data acquisition and the specific design and construction of the improved YOLOv8n+ network are described as well. In Section 3, an experimental study of the new model is carried out, and the corresponding results and metrics are presented. In Section 4, the experimental results are discussed and analyzed in depth. Section 5 summarizes the conclusions of this study.
2. Materials and Methods
2.1. Image Collection and Dataset Construction
2.1.1. Image Collection
The data for this study were collected from Liangwangshan Modern Agricultural Park (102°54′35.694″ E, 24°50′3.61″ N), Chengong District, Kunming City, Yunnan Province, China. The park is the first seed industry town in Yunnan Province, covering an area of more than 1,000 acres, and has cultivated a variety of tomato varieties, including large-fruited (e.g., ‘Big Red’, ‘Golden Crown’), small- and medium-sized (e.g., ‘Roma Tomato’, ‘Cherry Tomato’). (e.g., ‘Big Red’, ‘Golden Crown’), small and medium-sized fruits (e.g., ‘Roma Tomato’, ‘Cherry Tomato’), pest-tolerant, high-yielding, and organic tomatoes. In this study, to improve the generalization ability of the dataset, a multi-species mixed dataset was selected, including ruby tomatoes (large-fruited type), some small-fruited types, and disease-resistant tomatoes. Meanwhile, tomatoes were planted with brackets and ropes to guide the vines with 45 cm row spacing and 28 cm plant spacing to reduce the shading of fruits from branches and leaves and to provide good ventilation and light conditions for fruit growth. The images in the dataset were taken from October to November 2023 and cover tomato fruits at different stages of ripening. The camera used was a Redmi K70 mobile phone, manufactured by Xiaomi Communication Technology Co. in Huizhou, China. Its main camera is 50 megapixels with an equivalent focal length of 24-26 mm and a sensor size of about 1/2.0 inch. To ensure a stable camera position, a tripod was used to hold the camera in place, and a mark was made on the ground, and the distance between the mark and the plant was measured to ensure that the distance between the mobile phone and the tomato was consistent.
The images in the dataset had a resolution of 8192 × 6144 and were taken at 0.2 m from the fruit. It was chosen to be taken at a time when the light was stable. To verify the robustness of the experiment in different environments, 727 tomato images were finally collected under the influence of various external conditions, such as different light, different shooting angles, and different coverage areas. Of these, 507 were used for the training set, 110 for the validation set, and 110 for the test set, as shown in Figure 1.
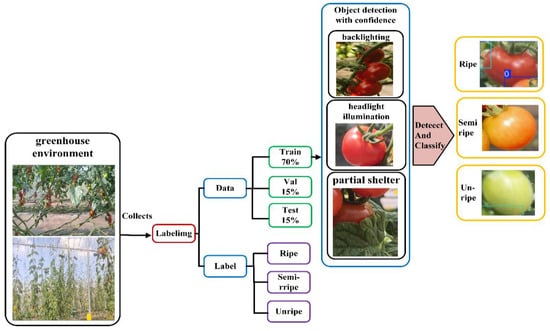
Figure 1.
Image processing process.
2.1.2. Image Annotation and Dataset Creation
For the annotation of the collected images, several tools, such as LabelImg and Labelme, were available. After a comparative analysis, LabelImg was finally selected for annotating 727 images for classification in this study, as shown in Figure 2, and used the annotation format of the Pascal VOC dataset to annotate the images, generating the .xml type of annotated files for storing information such as size, target category, and specific location of the image. Finally converted to txt format for training and testing.
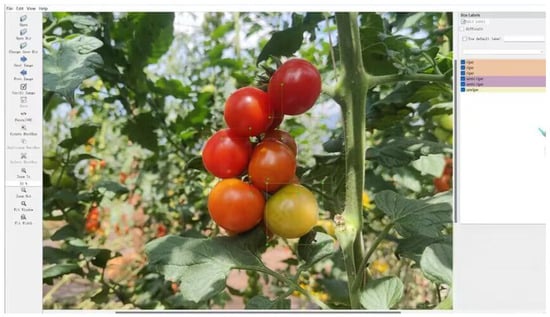
Figure 2.
LabelImg Annotation and Classification.
2.2. YOLOv8+ Model Building
2.2.1. RCA-CBAM Attention Mechanism Module
CBAM (Convolutional Block Attention Module) [31] is an attention mechanism specially designed for convolutional neural networks. It enhances the feature representation of the network through a dual attention mechanism: firstly, key features are identified using the channel attention mechanism, and then the spatial attention mechanism is applied to locate the important regions of these features. In this study, the traditional CBAM module is improved by incorporating the color attention mechanism to enhance the robustness and accuracy of the model for tomato ripening detection in complex environments, as shown in Figure 3.
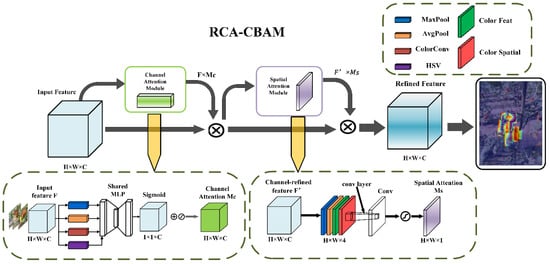
Figure 3.
RCA-CBAM Attention Module.
In Figure 3, the input image F size is H × W × C, containing spatial information (H × W) and channel information (C), after which it enters into the four parallel branches of the channel attention module for processing, i.e., Global Maximization (MaxPooling), Average Pooling (AvgPooling), Color Convolution (ColorConv), and Color Spatial Branching (HSV):
After processing, the output dimensions are all 1 × 1 × C into the shared MLP layer. The first layer is downscaling processing FC: C → C/r, the intermediate layer is activated by the ReLU function, and the second layer upscaling processing FC: C/r → C, where r is the downscaling ratio.
Finally, the channel attention weight Mc (F) is obtained through the sigmoid () function in the range [0, 1]. The larger value of the weight obtained indicates that the channel is more important. Namely:
After processing into the spatial attention module, the input is the channel attention processing-optimized feature map, across the channel for maximum pooling and average pooling. There is also the color space feature extraction process, i.e.,
After processing, the feature map optimized by the channel attention mechanism is passed into the spatial attention module. Maximum pooling, average pooling, and color space feature extraction are performed across channels, as follows:
The three results were subsequently spliced in the channel dimension and processed using a 7 × 7 convolutional layer. Finally, the spatial attention weights were again obtained via the sigmoid () function, i.e.:
Finally, the two attention modules are jointly optimized and processed, i.e.,
The final enhanced output feature image is obtained, and the final heat map clearly shows the key areas of concern for the model.
2.2.2. Loss Function Improvement
- 1.
- The overall architecture, as shown in Figure 4.
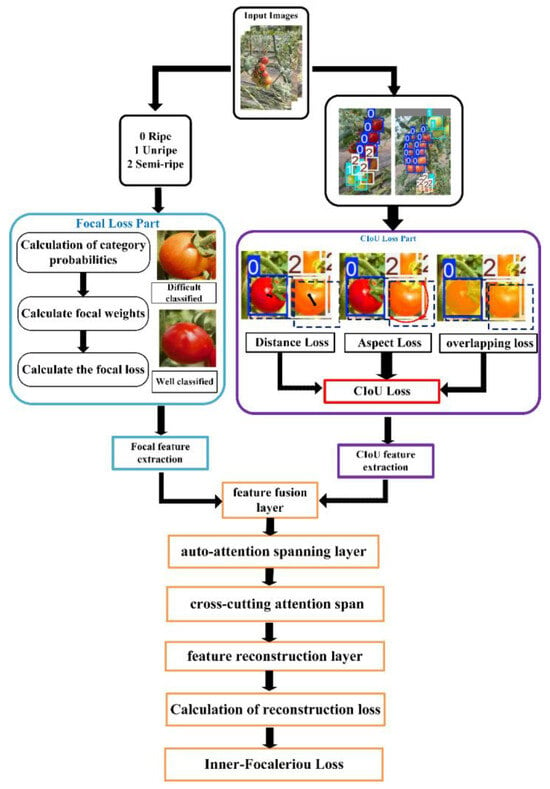 Figure 4. Structure of Inner-Focaleriou module.
 - (1)
- Focal Loss Part: for dealing with the classification problem.
- (2)
- CIoU Loss Part: to optimize the localization problem for target detection.
- (3)
- Feature Fusion and Reconstruction Part: to enhance the feature representation of the model.
- 2.
- Focal Loss Part
First, the input image is classified, and the probability for each category is computed:
where P0 ripe tomato (reddish), P1 unripe tomato (greenish), and P2 semi-ripe tomato (between red and green). The loss focus weights are solved based on the probability of getting the predicted categories, i.e.,
where Pt is the predicted probability of the target category, α is the equilibrium factor, and γ is the modulation factor. For easily distinguishable ripe samples, γ weights will decrease, and for difficult-to-classify tomato fruits, γ weights will increase. The obtained focal loss weights can be substituted to find the focal loss, i.e.,
- 3.
- CIoU Loss Part
The bounding box loss is mainly optimized, and the loss for the identified tomatoes is calculated from the following three aspects:
- (1)
- Solve for the distance loss: Calculate the Euclidean distance between the predicted box of tomatoes and the center point of the annotated real box, and standardize it as the ratio of the diagonal length of the closure region.
- (2)
- Solve the aspect ratio loss: The difference in aspect ratio between the predicted box and the labeled real box of the tomato in the results is calculated.
- (3)
- Solve the IoU loss: that is, the loss of the overlap degree between the predicted box of the tomato in the calculation results and the real box at the time of labeling.
In this case, the value of IoU is obtained by calculating the overlap area ratio of the predicted box and the real box, i.e.,
The result obtained from the weighted sum of the three losses constitutes the CIoU Loss Part. The value of the weighting factor is jointly determined by the aspect ratio consistency measure and IoU, allowing for dynamic adjustment of the aspect ratio and loss weights, i.e.,
- 4.
- Feature Fusion Part:
- (1)
- Feature Fusion: The features obtained through the Focal Loss part and the features obtained through the CIoU Loss part are subjected to feature-weighted summation, i.e.,
- (2)
- Auto-Attention Spanning Layer: A self-attention mechanism layer is applied to process the fused features, allowing the model to automatically focus on the key areas of the fruit with significant ripeness features.
- (3)
- Cross-Cutting Attention Span: The model computes the correlations between multiple feature spaces to establish links between different dimensions, such as color and shape.
- (4)
- Feature Reconstruction Layer: The attention-processed features are remapped to the original feature space, enabling the computation of reconstruction loss in the next step.
- (5)
- Calculation of Reconstruction Loss:
- (6)
- Inner-Focaleriou Loss: as the sum of Focal Loss, CIoU Loss, and reconstruction loss, i.e.,
2.2.3. BiFPN Feature Fusion Network
BiFPN (Bidirectional Feature Pyramid Network) is used as a multi-scale feature fusion network [32]. It is optimized based on the traditional Feature Pyramid Network (FPN).
- 1.
- Uniform number of channels
The three layers of the input feature map have different channel numbers; to achieve multi-scale fusion, their channel numbers are first adjusted to a uniform target channel number using convolution.
where denotes the feature layer of s input (i = 3,4,5), denotes the channel number of the corresponding layer.
- 2.
- Top-down feature fusion
Starting from the highest layer features , information is passed layer by layer to the lower layers. Fuse the semantic information of high-level ripeness categories with the spatial information of tomato shape and location in the lower layers. The feature map of the upper layer is interpolated to the size of the current layer, and the two layers are weighted and summed separately, followed by convolution to achieve multi-scale feature fusion, i.e.,
where the weights of weighted fusion are, which adaptively adjust the weights based on the characteristics of tomato ripeness (such as color or texture).
- 3.
- Bottom-up feature fusion
Information is passed upward from the lowest layer features, enhancing spatial details such as the shape and boundary of the tomato to complement the higher-level details. The current layer feature map and the next layer feature map are interpolated to get the same size after weighted fusion, and the spatial detail information is passed upward layer by layer through the add and sum operation to get the multi-scale fused feature map, i.e.,
where the value can be appropriately increased for small tomatoes to better preserve the spatial details of tomatoes in the high-level features.
Meanwhile, the SPPF module is integrated into the neck part of YOLOv8+ to achieve multi-scale feature sensing, which enlarges the receptive field. Finally, by complementing the RCA-CBAM attention mechanism, thus enhancing the key feature regions, the image of the model with different feature attention for tomatoes is obtained, as shown in Figure 5.
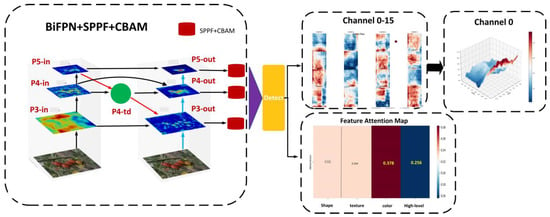
Figure 5.
Structure of BiFPN combined with RCA-CBAM detection.
2.2.4. YOLOv8+ Overall Structure
The choice of YOLOv8n as the base model was based on its lightweight, efficiency, and ability to adapt to complex environments. As the lightest version of the YOLOv8 series, YOLOv8n excels in detection speed, classification accuracy, and real-time requirements and is well suited for tomato ripening detection tasks while providing strong scalability for further improvements. In this study, the corresponding improvements are based on YOLOv8n, and the model includes several key components, as shown in Figure 6.
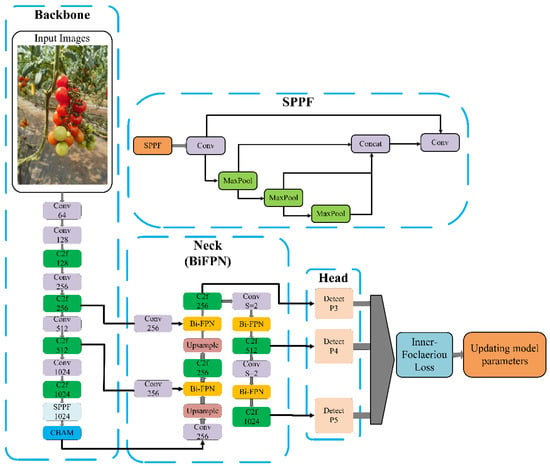
Figure 6.
The overall structure of the improved YOLOv8+.
- 1.
- Backbone: used to extract the basic features of the image.
- 2.
- Neck: contains the structure of BiFPN, which is used for multi-scale feature fusion to ensure that targets of different sizes are effectively represented in the feature map.
- 3.
- Head: outputs the prediction results, including the location (bounding box), category, and the confidence score of the target.
Firstly, the classified and processed tomato image is input into the Yolov8+ model and enters the Backbone backbone network, which adopts a tandem structure of depth-separable convolution and C2f module and enhances the multi-scale representation and extraction capability by extracting features step by step through four layers. The output then enters the SPPF module, which increases the receptive field. Multi-level pooling operations are applied to extract global contextual information, helping the model distinguish between features such as the color and texture of tomatoes and the complex background when detecting tomatoes at different ripeness stages. Finally, after the RCA-CBAM attention mechanism to improve the attention to the key feature regions of tomatoes and enter the neck layer.
Features output by Conv are passed into the up-sampling path (top-down) and fused with the convolutional features of P4, which are then input into the BiFPN module. The output features are sent to the C2f module to ensure that the model can correctly recognize the color and texture differences of tomatoes in high-resolution feature maps. The features are then upsampled again, fused with the P3 feature layer, and passed into the BiFPN for cross-layer feature fusion, enhancing the P3 layer features. The feature layer of P5 is downsampled again and sent to BiFPN for multi-scale fusion to obtain the output features from the C2f module, ensuring that small tomatoes and occlusions can be accurately detected in the actual picking scenario. The output feature layer obtained in the last three times enters the head layer for detection.
The head layer employs multi-scale detection outputs. The P3 feature layer is used for 80 × 80 small target detection, which is suitable for detecting small-sized tomatoes (unripe small tomato fruits). The P4 feature layer is used for 40 × 40 medium target detection, suitable for detecting medium-sized tomatoes. The P5 feature layer is used for 20 × 20 large target detection, suitable for detecting mature large tomatoes. By employing multi-scale detection in the head layer, the model ensures good detection accuracy across tomatoes of various sizes. The results are then input into the loss function for calculation and updating.
Finally, the custom Inner-FocalerIoU loss function is applied to improve the model’s accuracy in ripeness classification and bounding box localization, ensuring the model’s adaptability to complex scenarios. The parameters of the entire network are updated, ensuring that the model continues to optimize detection performance during subsequent training.
3. Results
3.1. Experimental Environment
For the experimental environment, the operating system is equipped with a computer with an Intel i5-136000 kF (14600 kF) processor, which is manufactured by Intel and is based in Santa Clara, CA, USA, 32 GB RAM, and a GeForce GTX 4080 Super GPU, which is manufactured by NVIDIA, which is headquartered in Santa Clara, CA, USA. The computer uses the CUDA 11.2 parallel computing architecture and the cuDNN 8.0.5 GPU acceleration library from NVIDIA, both of which have been developed by NVIDIA. Software simulations were performed using the Pytorch deep learning framework (Python version 3.11).
3.2. Indicators for Model Evaluation
To test the performance of the model, this experiment selects MAP50 (Mean Average Precision), Precision (Precision Rate), Recall (Recall Rate), FPS (Frames per Second), and D% (Detection Rate) as the indexes for evaluating the Yoloov8+ model, and the specific formulas are as follows:
where TP is the number of correctly detected tomato fruits, FP is the number of incorrectly detected tomato fruits, and FN is the number of missed tomato fruits. AP is the area bounded by the curves and coordinate axes drawn with P as the vertical coordinate and R as the horizontal coordinate. N is the total number of test set samples; D is the number of detected targets; tN is the average inference time (MS). Through these indicators, both detection accuracy and speed are covered, and the key performance of the new model in real-world applications is reflected.
3.3. Ablation Experiment
3.3.1. Visualization of Results and Indicators
To verify the effectiveness of each improved module and its contribution after the model has been run, four sets of ablation experiments were conducted on the YOLOv8n base model to assess the impact of each added module on the model’s performance. The results are shown in Figure 7.
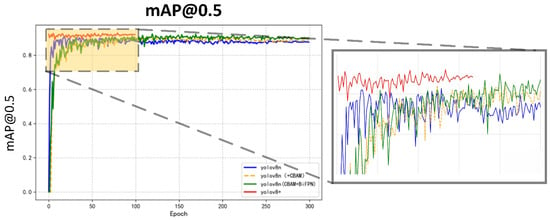
Figure 7.
Ablation experiments against the original model.
For the first group (YOLOv8n), the base model was used for training and testing, and indicators such as mAP50, precision, and recall were recorded. In the second group (YOLOv8n + RCA-CBAM), only the RCA-CBAM attention mechanism was added on top of YOLOv8n to improve the feature extraction ability of the model. For the third group (YOLOv8n + RCA-CBAM + BiFPN), the BiFPN module was introduced on top of the second group to enhance the fusion capability of the model’s multi-scale features. In the fourth group (YOLOv8+), all improvements were added, and the performance of the complete scheme was recorded, which allowed comparison and visual analysis with the first three groups to assess the final enhancement brought by the loss function. In the ablation experiments, the YOLOv8n base model (blue) improves quickly but is not stable enough and provides only benchmark performance. The addition of the RCA-CBAM module (orange) improves stability, and the mAP value is slightly higher than the base model, but the overall performance improvement is not significant. The further addition of BiFPN resulted in a significant initial mAP increase and thus improved detection performance but slightly lower stability in the later stages. The YOLOv8+ model has the best overall performance, and the mAP is always high and stable during the training process. The results show that the optimization strategy of the improved Yolov8+ significantly enhances the detection capability and accuracy and also improves the stability of the detection process. The indicators obtained after the ablation experiments are shown in Table 1.

Table 1.
Four groups of indicators obtained from ablation experiments.
3.3.2. Detection Results
The visualized detection results of the improved YOLO model for tomato ripeness recognition in different environments and their respective percentages are presented in Figure 8. The base YOLOv8n model suffers from unstable detection and repetitive detection issues for semi-ripe tomatoes. With the addition of RCA-CBAM, the feature extraction capability was improved, but the confidence level of semi-ripe tomato detection remained low (0.3–0.7) under strong light and occlusion, as shown in Figure 8a,b. With the further introduction of BiFPN, the robustness in complex environments was enhanced, and the detection of small-target tomatoes became more stable over long distances, as shown in Figure 8c. However, occasional category confusion still occurred. In the end, YOLOv8+ was able to detect the most accurate localization, effectively reducing the phenomenon of overlapping detection observed in the original model and significantly improving the detection rate for both immature and mature categories. The detection confidence was improved to 0.6–0.9 in multiple complex scenes, with especially outstanding performance in long-distance small targets and complex lighting conditions, as shown in Figure 8d.
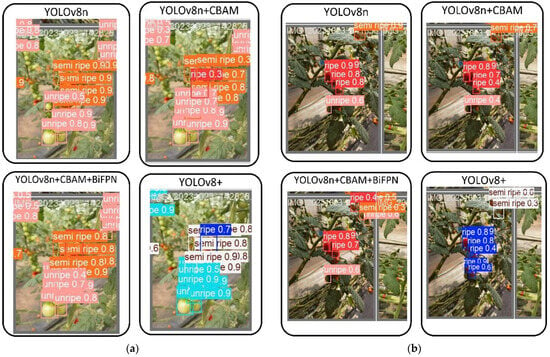
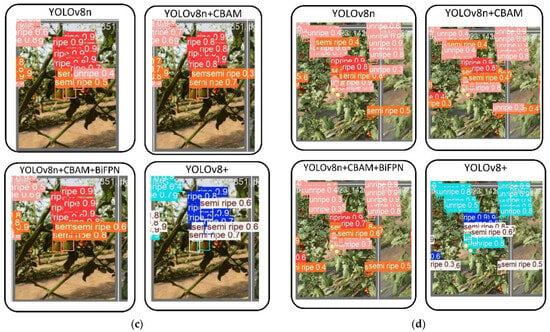
Figure 8.
YOLOv8+ test results in different environments: (a) Exposure environment; (b) Localized occlusion; (c) Backlit environment; (d) Small target at a distance.
3.4. Comparison Experiment
3.4.1. Visualization of Results and Indicators
To verify the validity of the conducted comparison tests, the overall performance of each model was evaluated by training the dataset with different versions of the YOLO model. Pre-trained weights were used for all models, ensuring that other training factors were consistent. Figure 9 illustrates the mAP@0.5 curve changes during training for YOLOv5, YOLOv7, YOLOv8s, and YOLOv8+.
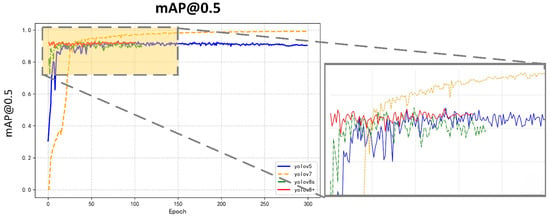
Figure 9.
Changes in mAP@0.5 after training with different models.
The experimental results show that YOLOv7 and YOLOv8+ quickly converge and reach a higher mAP@0.5 in the early stages of training, demonstrating strong learning ability and excellent detection performance. Meanwhile, YOLOv8+ shows less fluctuation in the mAP@0.5 curve, indicating higher stability. YOLOv5, although converging more slowly and showing some fluctuations during the training process, eventually reaches a higher mAP@0.5 with stable performance. YOLOv8s improves rapidly at the beginning but shows some fluctuations in the later stages, indicating average stability. Therefore, it can be concluded that YOLOv8+ exhibits the best performance and stability in the detection task. The detection indicators obtained after the comparison experiments are shown in Table 2.

Table 2.
Comparison of different model indicators (1).
Results show that YOLOv8+ outperforms other models in both detection performance and operational efficiency. The new model achieves the highest precision of 91.7%, recall of 87.3%, and accuracy of 95.8%, with an inference time of only 9.5 ms and a frame rate of 105.7 FPS. This far exceeds the processing efficiency of other models, enabling real-time detection while avoiding the duplicate detection issues observed in YOLOv7 (3581.90%) and YOLOv5 (843.97%), achieving a 100% accurate detection rate. Meanwhile, the other models exhibit high false detection rates and slow inference times, making them unsuitable for real-time detection scenarios. In practical planting and harvesting scenarios, environmental factors such as light, temperature, and weather can rapidly change, affecting the accuracy of maturity judgment. YOLOv8+’s millisecond-level processing capability allows it to quickly analyze images, ensuring timely and accurate maturity detection, thereby improving harvesting efficiency and fruit quality. Overall, YOLOv8+ achieves the best balance between accuracy and speed, demonstrating significant practical value, as shown in Table 3.

Table 3.
Comparison of indicators in different models (2).
3.4.2. Test Results
Figure 10 shows the visual detection effects and percentages of the four models in tomato ripeness recognition under different environments. The results show that the confidence of YOLOv5 in small target scenes is only 0.3–0.4, with weak category distinction ability and significant missed detection, as shown in Figure 10b. The detection accuracy of YOLOv7 has been improved, but the semi-mature classification is significantly confused under strong light and occlusion conditions, as shown in Figure 10c,d. The confidence of YOLOv8s fluctuates between 0.4 and 0.8 in strong light scenes, and its stability is insufficient. The improved YOLOv8+ exhibits excellent performance in all scenarios. In particular, the performance in small tomato target detection is the best in long-distance scenes, with confidence levels as high as 0.7–0.9 under backlight conditions, as shown in Figure 10a. Therefore, the adaptability and detection stability of YOLOv8+ in complex environments are significantly better than those of other models.
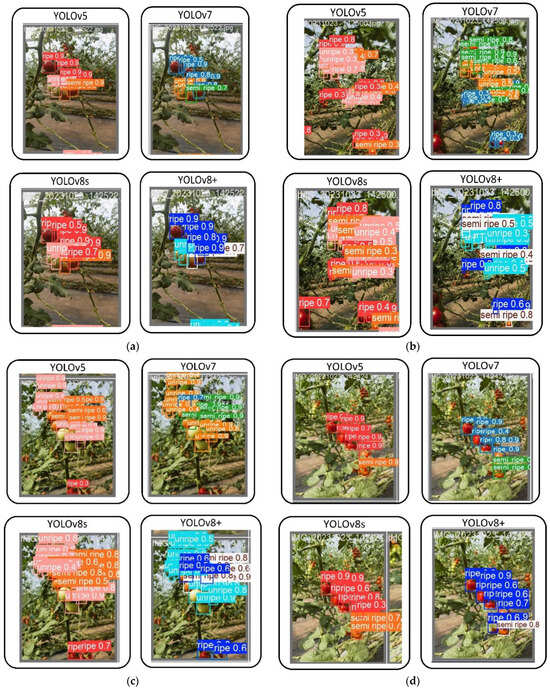
Figure 10.
Detection results of four models under different environments: (a) Backlit environment; (b) Small target at a distance; (c) Exposure environment; (d) Localized occlusion.
4. Discussion
In tomato ripeness recognition, the color and, thus, the ripeness cannot be accurately determined due to the occlusion of the surface by other tomatoes, as well as the occlusion caused by branches and leaves. This problem is addressed in this study by improving the YOLOv8n model in various aspects to enhance the model’s detection performance and classification accuracy in complex environments. The effectiveness of each improvement module is verified by comparing the experimental results, and the model’s performance in edge cases is analyzed. Finally, the performance of the improved model is compared with that of current mainstream target detection models.
4.1. Discussion of Ablation Experiment
Firstly, after RCA-CBAM was added to the backbone network of the baseline model YOLOv8n, the accuracy of tomato ripening recognition was significantly improved. The reason for the improvement in model performance due to the new attention mechanism is analyzed as follows: RCA-CBAM can focus on the importance of both the color feature channels and the spatial distribution of the features by connecting the channel attention, spatial attention, and color attention modules in series. For example, in an occluded environment, RCA-CBAM can focus on the edge features of the tomato that are partially occluded by foliage, which avoids missed detections. Meanwhile, in scenes with changing light, the model performs particularly well in capturing the gradient features of the tomato from cyan to deep red. Ding Yao et al. [33] also proposed a framework of selective sparse sampling networks (S3Ns), which capture subtle differences and contextual information in fine-grained recognition by learning sparse attention and extracting discriminative features. Experimental results showed that the method outperformed existing methods on benchmark datasets.
After the introduction of the BiFPN module, experimental results showed that the robustness of the model in complex environments and its ability to perform multi-scale detection were significantly improved. The reasons for the improved model performance with the BiFPN module are analyzed as follows: semantic and detailed information is efficiently fused in both directions, improving the detection accuracy of both small and large tomatoes. The simplified structural design ensures the model’s speed for real-time detection in the field by reducing redundant nodes. At the same time, the weighted fusion mechanism dynamically adjusts the importance of feature layers and improves the stability and robustness of small tomato detection through multiple stacking operations. For example, BiFPN reduces problems of target overlapping and boundary-blurring in environments with dense small targets at long distances. Jun Chen et al. [34] also proposed a bidirectional cross-scale feature fusion network for small target detection in remote sensing images. The results showed that the improved BiFPN enhanced small target detection accuracy while also ensuring inference speed and real-time performance.
The improved Inner-FocalerIoU loss function introduced in the final ablation experiments combines the advantages of classification loss and localization loss to address the challenges of tomato maturity identification. While traditional Focal Loss focuses only on adjusting the weights of misclassified samples to deal with class imbalance, Inner-FocalerIoU combines IoU information to prioritize both difficult-to-classify samples and samples with poor localization accuracy. This dual-focusing mechanism is particularly effective for semi-cooked (trans-colored) samples that are more difficult to classify due to feature ambiguity, which greatly reduces the miss-detection rate and improves the robustness of classification. In terms of localization, Inner-FocalerIoU introduces additional constraints of shape and scale consistency on top of CIoU. While CIoU optimizes the bounding box regression mainly by considering IoU, center distance, and aspect ratio, Inner-FocalerIoU further refines the process by integrating dynamic adjustments based on the difficulty of classification, resulting in a more accurate segmentation of individual tomatoes. This improvement reduces bounding box blurring, enhances the detection of neighboring target color features, which is particularly important in dense or occluded scenes, and also accelerates model convergence by prioritizing difficult-to-learn samples early in training. Boryu Jiang et al. [35] proposed a similar network, IoU-Net, which optimized the detection box by improving the IoU prediction and enhancing the NMS process, thereby improving the model’s ability to locate in complex scenes.
Although the improved YOLOv8+ performs better in complex environments, the introduction of RCA-CBAM and BiFPN increases the computational overhead of the model and leads to missing key feature information, blurred target boundaries, and an insufficient proportion of occluded samples in the training data under severe occlusion, which affects the model’s ability to perform classification and detection. In the future, this problem can be optimized by increasing the training data of occluded samples and introducing stronger background information modeling methods (e.g., semantic segmentation, etc.). Meanwhile, the focus of the research should be on optimizing the efficiency of feature fusion, especially to improve the detection accuracy of semi-cooked categories.
4.2. Comparison Experiment Discussion
In the results of the comparison experiments, YOLOv8+ was found to perform the best in terms of convergence speed, detection accuracy, and stability. The confidence level was stable under strong light and occlusion conditions, and the confidence was reasonably distributed in the long-distance small target scene. mAP@0.5 was achieved at 95.8%, with small fluctuations and high real-time performance. YOLOv7 ranked second, offering higher accuracy and stability, making it suitable for scenes with certain requirements for detection accuracy but lower real-time performance. However, boundary-blurring was observed in complex scenes. The performance of YOLOv8s was slightly lower than YOLOv7, but it was still able to meet general detection needs with limited resources. YOLOv5s, on the other hand, showed relatively low convergence speed and final accuracy and was deemed suitable only for scenarios with very limited computational resources. Overall, YOLOv8+ was identified as the optimal choice, effectively balancing detection speed and accuracy.
Although YOLOv8+ outperformed other models in terms of detection confidence (0.8–0.9 for ripe tomatoes), low detection confidence was still observed for semi-ripe tomatoes. When compared with the YOLOv7 model, which ranked second in various indicators, the new model occasionally experienced boundary blurring in dense target scenarios, which, in turn, affected inference speed during deployment. Therefore, further optimization of the model’s performance in semi-ripe tomato detection is still required in the future.
The new model enhances the ability to focus on color features through the RCA-CBAM mechanism, the BiFPN module improves the detection of small targets in complex backgrounds, and the Inner-Focaleriou loss function effectively mitigates the category imbalance problem, which makes it applicable to tomato varieties of other colors (e.g., light purple, yellow, pink). Finally, in order to further improve the generalization ability of the model, multi-colored tomato varieties will be introduced by enriching the dataset with color normalization, and different-colored tomatoes will be added to the validation set for testing and fine-tuning to optimize the model’s detection performance on non-red tomato varieties.
5. Conclusions
Based on the YOLOv8n network structure, an improved YOLOv8+ model for real-time detection of tomato ripeness is proposed in this paper, which can effectively address the challenges of complex backgrounds, occlusion, and small target detection. The RCA-CBAM attention mechanism is introduced in the model, BiFPN is combined to achieve multi-scale feature fusion, and the Inner-FocalerIoU loss function is integrated to optimize the sample imbalance and bounding box positioning problems, significantly improving the detection performance of the model. Experiments show that YOLOv8+ achieves the best detection accuracy and real-time performance when compared with three different models. A mAP@0.5 of 95.8% and an accuracy of 91.7% were achieved in the tomato ripeness detection task, with a single-frame inference time of only 9.5 ms. However, the detection accuracy was slightly reduced under severe occlusion conditions. Future research will focus on further improving the accuracy and robustness of the model while ensuring high detection speed, enabling it to handle more complex detection scenarios. This research can be applied in two ways, either by developing an application for farmers to use to help them assess tomato ripeness or by integrating the vision system into an automated robot for automated picking. Either way, it will improve the accuracy and efficiency of tomato ripeness recognition, optimize the automated picking system, reduce human intervention, improve productivity, reduce costs, and promote precision agriculture and agricultural automation.
Author Contributions
Conceptualization, Z.Y., Y.L. and Q.H.; methodology, Z.Y. and Y.L.; investigation, H.W. and C.L.; resources, C.L. and H.W.; writing—original draft preparation, Z.Y.; writing—review and editing, Q.H. and Z.W.; project administration, Z.W.; funding acquisition, Z.W. All authors have read and agreed to the published version of the manuscript.
Funding
This work was supported by the Guangdong Basic and Applied Basic Research Foundation (2022A1515140162).
Data Availability Statement
The data presented in this study are openly available at https://github.com/HLMagPro/YOLOv8n-Pro (accessed on 24 December 2024).
Conflicts of Interest
We declare that we do not have any commercial or associative interests that represent any conflicts of interest in connection with the work submitted.
References
- Food and Agriculture Organization (FAO). FAOSTAT Database; FAO: Rome, Italy, 2020. [Google Scholar]
- Tilesi, F.; Lombardi, A.; Mazzucato, A. Scientometric and Methodological Analysis of the Recent Literature on the Health-Related Effects of Tomato and Tomato Products. Foods 2021, 10, 1905. [Google Scholar] [CrossRef] [PubMed]
- Cheng, B.; Li, H. Improving Water Saving Measures Is the Necessary Way to Protect the Ecological Base Flow of Rivers in Water Shortage Areas of Northwest China. Ecol. Indic. 2021, 123, 107347. [Google Scholar] [CrossRef]
- Yang, G.; Wang, J.; Nie, Z.; Yang, H.; Yu, S. A Lightweight YOLOv8 Tomato Detection Algorithm Combining Feature Enhancement and Attention. Agronomy 2023, 13, 1824. [Google Scholar] [CrossRef]
- Ali, H.; Lali, M.I.; Nawaz, M.Z.; Sharif, M.; Saleem, B.A. Symptom-Based Automated Detection of Citrus Diseases Using Color Histogram and Textural Descriptors. Comput. Electron. Agric. 2017, 138, 92–104. [Google Scholar] [CrossRef]
- Abera, G.; Ibrahim, A.M.; Forsido, S.F.; Kuyu, C.G. Assessment on Post-Harvest Losses of Tomato (Lycopersicon esculentum Mill.) in Selected Districts of East Shewa Zone of Ethiopia Using a Commodity System Analysis Methodology. Heliyon 2020, 6, e03749. [Google Scholar] [CrossRef]
- Kaur, K.; Gupta, O.P. A Machine Learning Approach to Determine Maturity Stages of Tomatoes. Orient. J. Comput. Sci. Technol. 2017, in press. [Google Scholar] [CrossRef]
- Sugino, N.; Watanabe, T.; Kitazawa, H. Effect of Transportation Temperature on Tomato Fruit Quality: Chilling Injury and Relationship Between Mass Loss and a* Values. Food Meas. 2022, 16, 2884–2889. [Google Scholar] [CrossRef]
- Su, F.; Zhao, Y.; Wang, G.; Liu, P.; Yan, Y.; Zu, L. Tomato Ripeness Classification Based on SE-YOLOv3-MobileNetV1 Network under Nature Greenhouse Environment. Agronomy 2022, 12, 1638. [Google Scholar] [CrossRef]
- Wiesner-Hanks, T.; Wu, H.; Stewart, E.; DeChant, C.; Kaczmar, N.; Lipson, H.; Gore, M.A.; Nelson, R.J. Millimeter-Level Plant Disease Detection from Aerial Photographs via Deep Learning and Crowdsourced Data. Front. Plant Sci. 2019, 10, 1550. [Google Scholar] [CrossRef]
- Behera, S.K.; Rath, A.K.; Sethy, P.K. Maturity Status Classification of Papaya Fruits Based on Machine Learning and Transfer Learning Approach. Inf. Process. Agric. 2021, 8, 244–250. [Google Scholar] [CrossRef]
- Halstead, M.; McCool, C.; Denman, S.; Perez, T.; Fookes, C. Fruit Quantity and Ripeness Estimation Using a Robotic Vision System. IEEE Robot. Autom. Lett. 2018, 3, 2995–3002. [Google Scholar] [CrossRef]
- Fu, L.; Gao, F.; Wu, J.; Li, R.; Karkee, M.; Zhang, Q. Application of Consumer RGB-D Cameras for Fruit Detection and Localization in Field: A Critical Review. Comput. Electron. Agric. 2020, 177, 105687. [Google Scholar] [CrossRef]
- Lu, J.; Tan, L.; Jiang, H. Review on Convolutional Neural Network (CNN) Applied to Plant Leaf Disease Classification. Agriculture 2021, 11, 707. [Google Scholar] [CrossRef]
- Saleem, M.H.; Potgieter, J.; Arif, K.M. Automation in Agriculture by Machine and Deep Learning Techniques: A Review of Recent Developments. Precis. Agric. 2021, 22, 2053–2091. [Google Scholar] [CrossRef]
- Zhang, S.; Chi, C.; Yao, Y.; Lei, Z.; Li, S.Z. Bridging the Gap Between Anchor-Based and Anchor-Free Detection via Adaptive Training Sample Selection. In Proceedings of the IEEE/CVF Conference on Computer Vision and Pattern Recognition (CVPR), Virtual Event, 14–19 June 2020; pp. 9759–9768. [Google Scholar]
- Vaswani, A.; Shazeer, N.; Parmar, N.; Uszkoreit, J.; Jones, L.; Gomez, A.N.; Kaiser, Ł.; Polosukhin, I. Attention Is All You Need. In Advances in Neural Information Processing Systems; Curran Associates, Inc.: Newry, UK, 2017; pp. 5998–6008. [Google Scholar]
- Bharati, P.; Pramanik, A. Deep Learning Techniques—R-CNN to Mask R-CNN: A Survey. In Computational Intelligence in Pattern Recognition; Das, A., Nayak, J., Naik, B., Pati, S., Pelusi, D., Eds.; Advances in Intelligent Systems and Computing; Springer: Singapore, 2020; Volume 999, pp. 657–668. [Google Scholar]
- Girshick, R. Fast R-CNN. In Proceedings of the IEEE International Conference on Computer Vision (ICCV), Santiago, Chile, 13–16 December 2015; pp. 1440–1448. [Google Scholar]
- He, K.; Gkioxari, G.; Dollár, P.; Girshick, R. Mask R-CNN. In Proceedings of the IEEE International Conference on Computer Vision (ICCV), Venice, Italy, 22–29 October 2017; pp. 2961–2969. [Google Scholar]
- Zhang, K.; Wu, Q.; Chen, Y. Detecting Soybean Leaf Disease from Synthetic Image Using Multi-Feature Fusion Faster R-CNN. Comput. Electron. Agric. 2021, 183, 106064. [Google Scholar] [CrossRef]
- Xu, X.; Zhao, M.; Shi, P.; Ren, R.; He, X.; Wei, X.; Yang, H. Crack Detection and Comparison Study Based on Faster R-CNN and Mask R-CNN. Sensors 2022, 22, 1215. [Google Scholar] [CrossRef]
- Terven, J.; Córdova-Esparza, D.-M.; Romero-González, J.-A. A Comprehensive Review of YOLO Architectures in Computer Vision: From YOLOv1 to YOLOv8 and YOLO-NAS. Mach. Learn. Knowl. Extr. 2023, 5, 1680–1716. [Google Scholar] [CrossRef]
- Liu, W.; Anguelov, D.; Erhan, D.; Szegedy, C.; Reed, S.; Fu, C.Y.; Berg, A.C. SSD: Single Shot MultiBox Detector. In Proceedings of the European Conference on Computer Vision (ECCV), Amsterdam, The Netherlands, 11–14 October 2016; pp. 21–37. [Google Scholar]
- Zhao, H.; Shi, J.; Qi, X.; Wang, X.; Jia, J. Pyramid Scene Parsing Network. In Proceedings of the IEEE Conference on Computer Vision and Pattern Recognition (CVPR), Honolulu, HI, USA, 21–26 July 2017; pp. 2881–2890. [Google Scholar]
- Liu, G.; Nouaze, J.C.; Touko Mbouembe, P.L.; Kim, J.H. YOLO-Tomato: A Robust Algorithm for Tomato Detection Based on YOLOv3. Sensors 2020, 20, 2145. [Google Scholar] [CrossRef]
- Bai, Y.; Yu, J.; Yang, S.; Ning, J. An Improved YOLO Algorithm for Detecting Flowers and Fruits on Strawberry Seedlings. Biosyst. Eng. 2024, 237, 1–12. [Google Scholar] [CrossRef]
- Wang, C.; Han, Q.; Li, J.; Li, C.; Zou, X. YOLO-BLBE: A Novel Model for Identifying Blueberry Fruits with Different Maturities Using the I-MSRCR Method. Agronomy 2024, 14, 658. [Google Scholar] [CrossRef]
- Zhai, S.; Shang, D.; Wang, S.; Dong, S. DF-SSD: An Improved SSD Object Detection Algorithm Based on DenseNet and Feature Fusion. IEEE Access 2020, 8, 24344–24357. [Google Scholar] [CrossRef]
- Li, Y.; Huang, H.; Xie, Q.; Yao, L.; Chen, Q. Research on a Surface Defect Detection Algorithm Based on MobileNet-SSD. Appl. Sci. 2018, 8, 1678. [Google Scholar] [CrossRef]
- Woo, S.; Park, J.; Lee, J.Y.; Kweon, I.S. CBAM: Convolutional Block Attention Module. In Proceedings of the European Conference on Computer Vision (ECCV), Munich, Germany, 8–14 September 2018; pp. 3–19. [Google Scholar]
- Tan, M.; Pang, R.; Le, Q.V. EfficientDet: Scalable and Efficient Object Detection. In Proceedings of the IEEE/CVF Conference on Computer Vision and Pattern Recognition (CVPR), Seattle, WA, USA, 14–19 June 2020; pp. 10781–10790. [Google Scholar]
- Ding, Y.; Zhou, Y.; Zhu, Y.; Ye, Q.; Jiao, J. Selective Sparse Sampling for Fine-Grained Image Recognition. In Proceedings of the IEEE/CVF International Conference on Computer Vision (ICCV), Seoul, Republic of Korea, 27 October–2 November 2019; pp. 6598–6607. [Google Scholar]
- Chen, J.; Mai, H.; Luo, L.; Chen, X.; Wu, K. Effective Feature Fusion Network in BIFPN for Small Object Detection. In Proceedings of the 2021 IEEE International Conference on Image Processing (ICIP), Anchorage, AK, USA, 19–22 September 2021; pp. 699–703. [Google Scholar]
- Jiang, B.; Luo, R.; Mao, J.; Xiao, T.; Jiang, Y. Acquisition of Localization Confidence for Accurate Object Detection. In Proceedings of the European Conference on Computer Vision (ECCV), Munich, Germany, 8–14 September 2018; pp. 784–799. [Google Scholar]
Disclaimer/Publisher’s Note: The statements, opinions and data contained in all publications are solely those of the individual author(s) and contributor(s) and not of MDPI and/or the editor(s). MDPI and/or the editor(s) disclaim responsibility for any injury to people or property resulting from any ideas, methods, instructions or products referred to in the content. |
© 2024 by the authors. Licensee MDPI, Basel, Switzerland. This article is an open access article distributed under the terms and conditions of the Creative Commons Attribution (CC BY) license (https://creativecommons.org/licenses/by/4.0/).