Article

Small Alcohols as Surfactants and Hydrate Promotors

1
Hyzenenergy, 26701 Quail Creek, Laguna Hills, CA 92656, USA
2
Strategic Carbon LLC, 20 Ladd St., Suite 200, Portsmouth, NH 03801, USA
3
State Key Laboratory of Oil and Gas Reservoir Geology and Exploitation, Southwest Petroleum University, Xindu Road No.8, Chengdu 610500, China
Fluids 2021, 6(10), 345; https://doi.org/10.3390/fluids6100345
Submission received: 17 August 2021 / Revised: 19 September 2021 / Accepted: 24 September 2021 / Published: 30 September 2021
(This article belongs to the Special Issue Fluids and Surfaces)

Abstract

:
Many methods to produce hydrate reservoirs have been proposed in the last three decades. Thermal stimulation and injection of thermodynamic hydrate inhibitors are just two examples of methods which have seen reduced attention due to their high cost. However, different methods for producing hydrates are not evaluated thermodynamically prior to planning expensive experiments or pilot tests. This can be due to lack of a thermodynamic toolbox for the purpose. Another challenge is the lack of focus on the limitations of the hydrate phase transition itself. The interface between hydrate and liquid water is a kinetic bottle neck. Reducing pressure does not address this problem. An injection of CO2 will lead to the formation of a new CO2 hydrate. This hydrate formation is an efficient heat source for dissociating hydrate since heating breaks the hydrogen bonds, directly addressing the problem of nano scale kinetic limitation. Adding limited amounts of N2 increases the permeability of the injection gas. The addition of surfactant increases gas/water interface dynamics and promotes heterogeneous hydrate formation. In this work we demonstrate a residual thermodynamic scheme that allows thermodynamic analysis of different routes for hydrate formation and dissociation. We demonstrate that 20 moles per N2 added to the CO2 is thermodynamically feasible for generating a new hydrate into the pores. When N2 is added, the available hydrate formation enthalpy is reduced as compared to pure CO2, but is still considered sufficient. Up to 3 mole percent ethanol in the free pore water is also thermodynamically feasible. The addition of alcohol will not greatly disturb the ability to form new hydrate from the injection gas. Homogeneous hydrate formation from dissolved CH4 and/or CO2 is limited in amount and not important. However, the hydrate stability limits related to concentration of hydrate former in surrounding water are important. Mineral surfaces can act as hydrate promotors through direct adsorption, or adsorption in water that is structured by mineral surface charges. These aspects will be quantified in a follow-up paper, along with kinetic modelling based on thermodynamic modelling in this work.

Graphical Abstract

1. Introduction

Natural gas hydrates are classes of composite structures in which water organizes to create cavities that enclathrate small non-polar molecules such as CH4, C2H6, C3H8, and i-C4H10. Some small slightly polar components, such as H2S and CO2, also form hydrates. The molecules that enter cavities are called guest molecules. Hydrates in nature are created from two sources. Methane released through biogenic degradation of organic material in the upper crust is the most abundant source of known hydrates worldwide. These are almost pure methane hydrates and structure I hydrates. The smallest symmetrical unit of structure I hydrate is a cubic box containing 46 water molecules, 6 large cavities (24 water molecules), and 2 small cavities (20 water molecules) that can host molecules such as CH4. Molecules that enter these cavities of hydrogen-bounded water molecules are called guest molecules. The size of the cubic unit cell varies with temperature. For typical temperatures above the water freezing point, a constant unit box length of 12.01 Å is generally accurate enough.
Many biogenic hydrate resources are connected to deeper sources of thermogenic hydrocarbons. These hydrocarbons are the result of long-term thermal degradation of organic matter and have a large variation in hydrocarbon composition. These resources typically contain sour gases such as H2S, which is formed from the degradation of organic sulfur in the absence of oxygen. Utilization of the upper hydrates may lead to an inflow of thermogenic hydrate formers through the fracture systems below.
Structure II is different from structure I in two important ways. The largest cavity has 28 water molecules and can accommodate molecules such as C3H8 and i-C4H10. The small cavity in structure II is very similar to the small cavity of structure I. The second difference in structure II, as compared to structure I, is that the ratio of small cavities to large cavities in structure II is 2:1.
We will not discuss further details on the basic structures and properties of these two hydrate structures as this information is available in several books including Sloan and Koh [1] and Mokogon [2]. These books also contain more information on structure H, which can clathrate guest molecules up to heptane, but is exotic in terms of natural occurrence.
In this work we limit ourselves to structure I hydrates and pure CH4 hydrates as the energy sources. All the methods and considerations in this work also apply to hydrates from thermogenic hydrocarbons and mixed sources of biogenic and thermogenic hydrates. This work is part of a larger research project that investigates combined safe long-term storage and energy production of CO2. More specifically, we examine the addition of limited amounts of N2 (roughly 20 mole%) to increase the permeability of injections of CO2/N2 mixtures into CH4 hydrate-filled sediments. As a second additive to the CO2/N2 mixtures, a variety of different surfactants are evaluated experimentally and theoretically. Theoretical evaluations are mainly molecular dynamics (MD) simulations of model systems [3] used to investigate how surfactants affect the interface between liquid water and a separate phase containing hydrate forming components. This separate phase is denoted as gas later in the discussion, although it may be a liquid state hydrate in a former phase.
The primary purpose of the surfactant is to keep the liquid water/gas interface free of blocking hydrate films. Its secondary purpose is to increase the kinetics of mass transport into the liquid water of the interface. Finally, it is expected that the presence of a surfactant will increase the amount of hydrate formerly in the liquid water of the interface.
Small alcohols like methanol and ethanol have been used for many decades as thermodynamic inhibitors. Most experimental data for hydrate formation from water containing alcohols are in a concentration range in which the alcohols change the activity of water significantly. The low partial charge, relative to the size of the methyl group, results in a surfactant effect of methanol. Ethanol has greater surfactant properties due to its non-polar outer methyl group. These surfactant effects can be utilized in hydrate production using the CO2/CH4 hydrate exchange method for the simultaneous release of CH4 from the hydrate and for the safe, long-term storage of CO2 as a hydrate.
There is, however, a symbiosis between this project and some industrial hydrate problems caused by methanol. Methanol used to keep wells free of hydrate may result in various amounts of methanol remaining during multiphase transport and/or subsequent processing. This may result in situations in which remaining methanol promotes hydrate formation. A typical example was reported by STATOIL (now EQUINOR) several years ago [4].
The main objective of this work is to examine how limited amounts of ethanol affect water. Limited amounts here refer to amounts that are typically below the amounts needed for hydrate prevention. We facilitate the surfactant properties of ethanol without reducing hydrate formation ability substantially. The focus here is how the addition of small amounts of alcohols affects thermodynamic properties responsible for phase transitions (Gibbs free energy) and associated changes in enthalpies. From a technical point of view, we seek alcohols that can easily be mechanically mixed in with the injection gas (CO2 containing N2). This excludes the high viscosity glycols and the main focus here is on methanol and ethanol.
A secondary objective is to shed light on some important factors related to design of a combined scheme for safe long-term storage of carbon dioxide, and simultaneous release of natural gas for energy. This also includes aspects related to the non-equilibrium nature of hydrates in sediments and different routes to hydrate formation. There are many experimental papers on carbon dioxide hydrate/methane hydrate swapping. It is beyond the scope of this work to discuss any of them. This also excludes our own experiments over a period of almost two decades.
Hydrate phase transition kinetics are implicit functions of thermodynamic control (Gibbs free energy changes), associated mass transport, and associated heat transport. The kinetic models will be derived and discussed in a separate follow-up paper. However, it is important in the context of this work to describe how various thermodynamic properties can be calculated.
A third objective is to demonstrate how the thermodynamic properties related to hydrate phase transitions can be calculated in a consistent way. It is critical in multiphase systems to utilize a uniform reference system. This will facilitate direct comparison of phase stability in terms of Gibbs free energies of the different co-existing phases.
To our knowledge, we are the only group that utilize residual thermodynamics for all phases, including hydrates. For that reason, there are few references to publications from other groups. There are certainly many good publications from other groups. However, within the limited theoretical focus in this work they may not fit into the main objectives discussed above.
Many of the calculated data provided in this work, like for instance Gibbs free energies, are not directly available experimentally. However, model calculations can be verified indirectly towards experimental data, for instance hydrate stability limits in pressure and temperature. Enthalpies of hydrate formation are hard to measure accurately. Additionally, I have not found any experimental data for hydrate formation from dissolved hydrate formers in water [5]. To my knowledge, the method utilized in this work for calculating enthalpies [5,6,7,8] is the only general method that can be applied to any hydrate phase transition. Methods that utilize gradient along phase co-existence curves, like Clausius and Clausius–Clapeyron, are at best applicable to pure hydrate formers along pressure temperature stability limit projection. Empirical concepts that utilize a definition of hydrate fugacity are not thermodynamically consistent. Fugacity is defined on a component basis and related to a specific, component based, reference state. In residual thermodynamic formulation fugacity at reference state is pure components pressure. For symmetric excess thermodynamics the reference state is pure liquid component fugacity. Additionally, for asymmetric excess thermodynamics the reference state is infinite dilution fugacity for the component in a specific solvent.
The concept we present, and use, in this work is thermodynamically consistent. The reason for the consistency is that the equation for enthalpy is derived from Gibbs free energy using fundamental thermodynamic relationships. Practically this also implies that the corresponding entropy change for hydrate formation is consistent. It can therefore be expected that the final hydrate has the correct hydrate structure.
No similar studies on water containing ethanol have been found in the accessible literature.
The paper is organized as follows. The traditional use of alcohols for thermodynamic hydrate inhibitor is briefly discussed in Section 2. Since this is not an important focus in this work, there are no references to any publications from my research group or other international research groups. In Section 3, I give a brief overview of hydrate production philosophy. The main focus of this section is on and kinetic challenges related to the various hydrate production methods. The use of CO2 for exchange with in situ CH4 in hydrate is a priority in that section. Scientific methods utilized in this work are briefly described in Section 4. The non-equilibrium thermodynamic nature of hydrates in sediments is discussed in Section 5. In particular it is argued that hydrates in sediments cannot reach thermodynamic equilibrium because there are too many independent thermodynamic variables in the co-existing phases compared to constraints on these variables. These constraints are mass conservations and thermodynamic equilibrium equations. Hydrates in sediments are normally in a stationary state. The rest of the paper is devoted to thermodynamic analysis of the consequences of adding small amounts of ethanol to CO2 and mixtures of CO2 with N2. The purpose of the analysis is to investigate if the ability to form a new hydrate from CO2 or CO2/N2 is significantly reduced by adding up to 3 mole percent ethanol to the pore water. The effects of adding ethanol on heterogeneous gas/liquid formation are discussed in Section 6. The main focus in this section is on hydrate stability. A secondary focus in this section is the ability of injection gas (CO2 or CO2/N2 mixture) to form a new hydrate which releases enough heat to dissociate in situ CH4 hydrate. A similar analysis for homogenous hydrate formation from water and dissolved hydrate former is given in Section 7. The paper is concluded with a discussion in Section 8 and conclusions in Section 9.

2. The Use of Alcohols for Hydrate Prevention in Industrial Settings

Problems related to the formation of hydrate from hydrocarbon mixtures and water have been important motivations for industrial hydrate research during the latest seven decades. The interest for natural gas hydrates as energy source has increased substantially during the latest four decades. Research activities on hydrates in sediments, and hydrate production technologies, have increased substantially.
Historically, small alcohols like methanol and ethanol have been used to prevent hydrate formation. Addition of alcohols to liquid water results in a reduction (more negative) of liquid water chemical potential. A consequence of this reduced liquid water chemical potential is that a higher pressure is needed in order to form hydrate. This will be discussed in more detail later.
Methanol totally dominates the market among these two alcohols. Exceptions are countries, such as Brazil, which produce ethanol at reasonable prices from a waste product in sugar production.
Thermodynamic hydrate inhibition as discussed above is based on the effect of dissolved alcohols on “bulk” water [9,10]. Most efficient concentrations of alcohol are concentrations when alcohol is the solvent for water, rather than the opposite. The transition from water as solvent, over to methanol as solvent, is clearly visible as a transition in the liquid mixture dielectric constant as function of alcohol concentration [10].
There are many different ways that a hydrate can form in a multiphase system. Hydrate formation on the interface between liquid water, and a separate phase for guest molecules. Guest molecules are the hydrate forming molecules that enter the cavities created by hydrogen bonded water. Methane and natural gas are examples of phases containing guest molecules. Hydrate can only form if Gibbs free energy of the hydrate is lower than Gibbs free energy for the same amounts of water and guest molecules in the original phases. Technically a hydrate equilibrium calculation involves solving for the same water chemical potential in liquid water and hydrate water when also chemical potentials for guest molecules are the same in hydrate and in gas phase. Addition of significant amounts of alcohols to the water reduces the chemical potential of liquid water and higher pressure is needed in order to create hydrate.
However, hydrate can also form from dissolved hydrate formers in liquid water, from water dissolved in gas and towards mineral surfaces like for instance rust. As will be discussed here, all these hydrates are different in composition and stability (Gibbs free energy).
Hydrate inhibition is not a primary objective in this work. However, many of the thermodynamic calculations presented here can also provide valuable extensions in hydrate risk analysis. In particular, the multi-phase hydrate stability analysis should be incorporated. An analysis based on temperature and pressure alone is not sufficient. There are many different ways that hydrate can dissociate again even in temperature and pressure is inside hydrate formation region.
Since there are several routes to hydrate formation it is important to be able to analyze the relative stabilities of the different hydrates than are formed in presence of alcohols if the local inhibitor concentrations are insufficient for total thermodynamic inhibition of hydrate.

3. Small Alcohols as Surfactants in Hydrate Production

Countries such as China and Japan are very actively working towards full scale hydrate production schemes.
A kinetically critical element in hydrate dissociation is the transport of guest molecules across a thin (roughly 1.2 nm) interface between a hydrate and its surroundings [8,9,11,12,13]. During the hydrate dissociation process, there will be liquid water facing the dissociating hydrate. The interface between liquid water and the hydrate will reproduce itself continuously. This is determined by the molecular physics of water. Partial charges on the surface of a hydrate are fairly fixed except for small translational and rotational movements relative to a minimum energy situation. Liquid water molecules, on the other hand, are highly dynamic. However, liquid water molecules have to relate to the hydrate water molecules in order to optimize entropy.
Methanol has surfactant properties because of the large methyl group. The low partial charge on the methyl group results in a small charge per atomistic group surface. The concentration of methanol, on the surface of water that faces the gas, will therefore be higher than the average concentration of methanol in “bulk” water. Carbon dioxide has a significant quadrupole moment. Solubility of carbon dioxide in water is therefore higher than solubility of small hydrocarbons in water.
Efficient hydrate dissociation depends on a favorable Gibbs free energy change. Temperature and pressure are two of all the independent thermodynamic variables. Concentrations of all molecules in all the co-existing are the other independent thermodynamic variables. If temperature and pressure are outside hydrate formation limits then gas and liquid water is more stable than the hydrate and Gibbs free energy change is favorable for hydrate dissociation. This is, however, only one of the thermodynamic conditions that has to be fulfilled. The first law of thermodynamics also requires that enough the enthalpy of hydrate dissociation can be supplied.
Reducing pressure to a condition outside hydrate stability is considered as a low-cost method for producing natural gas from a hydrate. The challenge is that the natural supply of heat may not be sufficient. Pressure reduction results in a temperature gradient that can supply heat. Local geological depth involves a geothermal gradient. Both of these possible sources of heat are low temperature sources and may not be efficient for breaking hydrogen bonds. The duration of early stages pilot tests [14,15] were extremely short. The results from these pilot studies are far too short to provide significant learning about hydrate production. The first offshore test [16] ended after 6 days. Officially, the reasons were massive sand production and reservoir freezing. The second test [17] was supposed to last for 6 months but the sediments froze after 24 days [17,18,19].
The enthalpy needed to dissociate CH4 hydrate is roughly 58 kJ/mole CH4 at 273.15 K [5,6,7,8,9]. Heat is transported fast through water phases [20]. Injection of steam or hot water is expensive. Heat will also be lost to minerals. However, it still addresses the breaking of hydrogen bonds. Injection of alcohols or salts is also very efficient in breaking hydrogen bonds.
Natural gas hydrates in sediments are unable to touch mineral surfaces due to extremely low chemical potential of the structured adsorbed water [21,22,23,24,25,26]. Another way to look at this fact is to consider distribution of atomistic charges in mineral surfaces. Distribution of atomistic charges on mineral surfaces are noy compatible with average partial charges in liquid water. The result is rather extreme water densities in the first adsorbed water layers on mineral surfaces. Many theoretical studies are available in the literature. A more limited number of experimental studies are also available. Water densities in the order of 3 times liquid water density is quite common. The paper by Geissbühler et al. [27] is a representative experimental report. Geo-mechanical models based on hydrate “cementing” pores are therefore physically wrong. Practically there will be minimum distances between mineral surfaces and hydrate. This minimum distance is controlled by the mineral/water structures discussed above, and also hydrate/liquid water interfaces. Molecular diffusion and induced hydrodynamic flow increase the distance between mineral surfaces and hydrate.
Fracture systems lead to hydrodynamic flow in offshore hydrates. Fractures that connect the seafloor to hydrate filled sediments lead to hydrate dissociation. The reason for this dissociation is the seawater concentration of guest molecules, which are almost at infinite dilution in the seawater. Limits for hydrate stability, in terms of guest concentration in surrounding liquid water, are discussed in the section describing homogeneous hydrate formation. Fracture systems below the hydrate can lead to inflow of new hydrocarbons, and can lead to subsequent hydrate formation when the hydrocarbons enter hydrate forming conditions. Hydrates in sediments are not thermodynamically stable (see Section 5). The system of a hydrate, liquid water, and gas will establish a situation that can be close to stationary. The dynamics of this stationary situation varies from one hydrate reservoir to another. The stationary situation is not constant. A net hydrate dissociation, which is higher than the creation of new hydrate formation, will over time lead to reduced hydrate saturation. Even in the permafrost in Alaska the average hydrate saturation is around 75% and it is rare to find hydrate deposits that exceed 85% of hydrate pore filling volume.
Injection of carbon dioxide is efficient because there is available free pore water that can create carbon dioxide hydrate. Enthalpy of hydrate formation for CO2 hydrate is roughly −68 kJ/mole CO2 at 273.15 K5–9. Addition of up to 30 mole% N2 to the CO2 increases this value to around −66 kJ/mole guest. The net difference between what is needed to dissociate the in situ CH4 hydrate is still sufficient.
The first question is whether addition of limited amounts of alcohol will significantly disturb the hydrate formation ability (Gibbs free energy). The second question is whether the released enthalpy from formation of new hydrate from CO2 or CO2/N2 mixture is sufficient to dissociate the in situ CH4 hydrate.

4. Methodology

The primary scientific tool in this work is classical thermodynamics. There are elements of statistical mechanics in the historical development of the theory for chemical potential of water in hydrate, and interactions between water and guest in the hydrate lattice. As will be discussed in Section 6, our model for chemical potential of water in hydrate differs from older models. Using molecular dynamics simulations, we were able to incorporate effects of guest movements on water lattice destabilization. For example, carbon dioxide movements interfere with water movements in the hydrate lattice. The interference affects specific water movement frequencies and leads to water lattice destabilization. The result is a difference of roughly 1 kJ/mole between a rigid hydrate water lattice and a dynamic lattice. Ethane in a large cavity also disturbs water movements but less so than carbon dioxide. For methane as a guest, the difference between a dynamic water lattice and a rigid lattice is almost zero.

5. Non-Equilibrium Nature of Hydrates in Sediments

The early hydrate equilibrium experiments started around 1940. With CH4 gas, liquid water, and a hydrate phase the researchers knew from Gibbs phase rule that only one independent thermodynamic variable could be fixed. Despite this fact, these hydrate equilibrium curves are also used as equilibrium curves when both temperature and pressure are fixed. As will be discussed later, hydrate stability also depends on a minimum concentration of guest molecules in the surrounding liquid water. Hydrates can form from liquid water solutions of guest molecules. The concentration range for this hydrate formation is between liquid water solubility concentration and minimum concentration for hydrate stability. Hydrates formed along this route have different composition and density. They are therefore thermodynamic definition.
As discussed above, solid mineral surfaces are very active relative to hydrate in two ways. In simplified terms, mineral surfaces are hydrate inhibitors because hydrates cannot exist close to mineral surfaces due to low chemical potential of adsorbed water. However, mineral surfaces can adsorb hydrate formers directly (polar guest molecules) [28,29,30,31,32,33] or indirectly in structured water [26,28,29,30,31,32,33,34,35,36] slightly outside mineral surface.
Hydrates formed from different phases are different because composition, density, and Gibbs free energy are different. The reason for this is that there is a mathematical imbalance between the number of independent thermodynamic variables and the associated constraint (mass conservation and equilibrium equations). If the thermal (same temperatures in all phases) equilibrium and the mechanical equilibrium (same pressures in all phases) is fulfilled, we can return to the simple system of CH4, liquid water, and a hydrate. There are six remaining mole-fractions in the three phases. The constraints are the conservation of mole-fractions in each of the three phases. In addition, there are 4 independent equations of equal chemical potential for CH4 and water in the three phases. With 7 equations in 6 variables there is no unique mathematical solution. The first and second laws of thermodynamics reduce to the following form when temperatures and pressures are the same for all phases:
min G _ = min [ J = 1 p G j N j ] = min [ j = 1 p N j j = 1 n μ i j ( T , P , x ¯ j ) x i j ]
in which the line below G denotes extensive property (unit Joule), j is a phase index, and N is the number of moles in each phase, as indicated by counter j. Total number of co-existing phases is p. i is a component index and x is mole-fraction. The line above x in the chemical potential dependency denotes the vector of all mole-fractions in the specific phase. This also includes mineral surfaces since they serve as catalysts for hydrate nucleation while at the same time not being able to “host” the hydrate on the mineral surface. It also includes all different hydrate phases and in principle also adsorbed phases on hydrate surfaces. The abbreviation min denotes minimum.
Number of degrees of freedom is the number of thermodynamic independent variables that must be specified for a system to be able to reach equilibrium. I prefer to use discrete counting rather than the compact Gibbs phase rule formula. One reason for this is that mixtures of guest molecules in a gas phase increases the complexity. The result can be that the system is brought even more out of the possibility to read the thermodynamic equilibrium. Many of these aspects will not be captured by Gibbs phase rule. As an example, consider an equimolar mixture of carbon dioxide and methane. Carbon dioxide is closer to condensation on water than methane. Carbon dioxide has a stronger attraction to the liquid water surface. In more rigorous physics, one example of a two-dimensional adsorption theory is described by Kvamme [37]. If the system is closed, then the result of selective adsorption is that many different hydrates can form. Carbon dioxide will have a higher mole-fraction in the adsorbed layer on liquid water. This also implies a higher mole-fraction than methane of the liquid side of the interface. The first hydrates that form will be dominated by carbon dioxide. Gradually the carbon dioxide content of the gas decreases and the final hydrates that form will be pure methane hydrate. Similar physical differences apply to other ways that hydrate can form, such as hydrate formation towards solid surfaces.
In summary, there is no way to establish thermodynamic equilibrium for hydrate in sediments. A theoretical philosophy about phases that can be totally consumed and then disappear from the balance will generally not be realistic for real hydrate reservoirs. As mentioned above, offshore hydrates are normally in a stationary balance of hydrate dissociation and formation of new hydrates from upcoming gas. On top of this, there are active phases that are normally not counted for, including mineral adsorption and hydrate nucleation towards mineral surfaces
In view of the above, the thermodynamic equilibrium is not generally possible for hydrates in sediments. A similar line of arguments can be established for hydrates in industrial processing units and in pipeline transport of gas containing dissolved water. Multiphase transport of gas and water is another example.
Due to general non-equilibrium situation, I will use the term stability limits rather than equilibrium curves. For heterogeneous hydrate formation on gas/liquid water interface the set natural set of independent thermodynamic variables are temperature and pressure. For homogeneous hydrate formation from liquid water and dissolved gas components, the independent variables are mole-fractions of the guest molecules in water.

6. Heterogeneous Hydrate Formation in Systems Containing Alcohols

20 mole% N2 seems feasible based on earlier studies in open literature. In order to limit the number of figures, I investigate hydrate free energy for pure CH4, pure CO2, and an injection mixture with 20 mole% N2 in CO2. Most natural gas hydrates are formed from biogenic sources and almost pure CH4 hydrates. There are, however, no limits in the analysis here. The same calculations can be applied to thermogenic gas and mixed structure I and structure II hydrates.
From an environmental point of view, and also in terms of surfactant properties, ethanol is more interesting than methanol. I will therefore mainly focus on ethanol. In Section 6.1, I focus on the free energy changes needed to form hydrates and in Section 6.2 I examine changes in released enthalpy during hydrate formation.
The main goal is to establish knowledge on the stability of CH4 and CO2 hydrates in real thermodynamic variables (Gibbs free energy) and the ability of hydrate formation from injection gas (CO2 and CO2/N2 mixtures) to deliver enough heat to dissociate in situ CH4 hydrate.
The thermodynamic models are described in Section 6.1 after some examples for model verification purposes. The model for water activity coefficients used in Equation (2) is given in Table 1. Note that this is a simplified model. For NaCl it only applies to calculations of water activity. For situations in which salinity in the water is important for interactions with mineral reactions then a totally different model is needed.
γ H 2 O ( T , x H 2 O ) = a 0 + a 1 x H 2 O + a 2 x H 2 O 2 + a 3 x H 2 O 3 ,   a k = c 0 , k + c 1 , k T R + c 2 , k T R 2 ,   T R = T 273.15

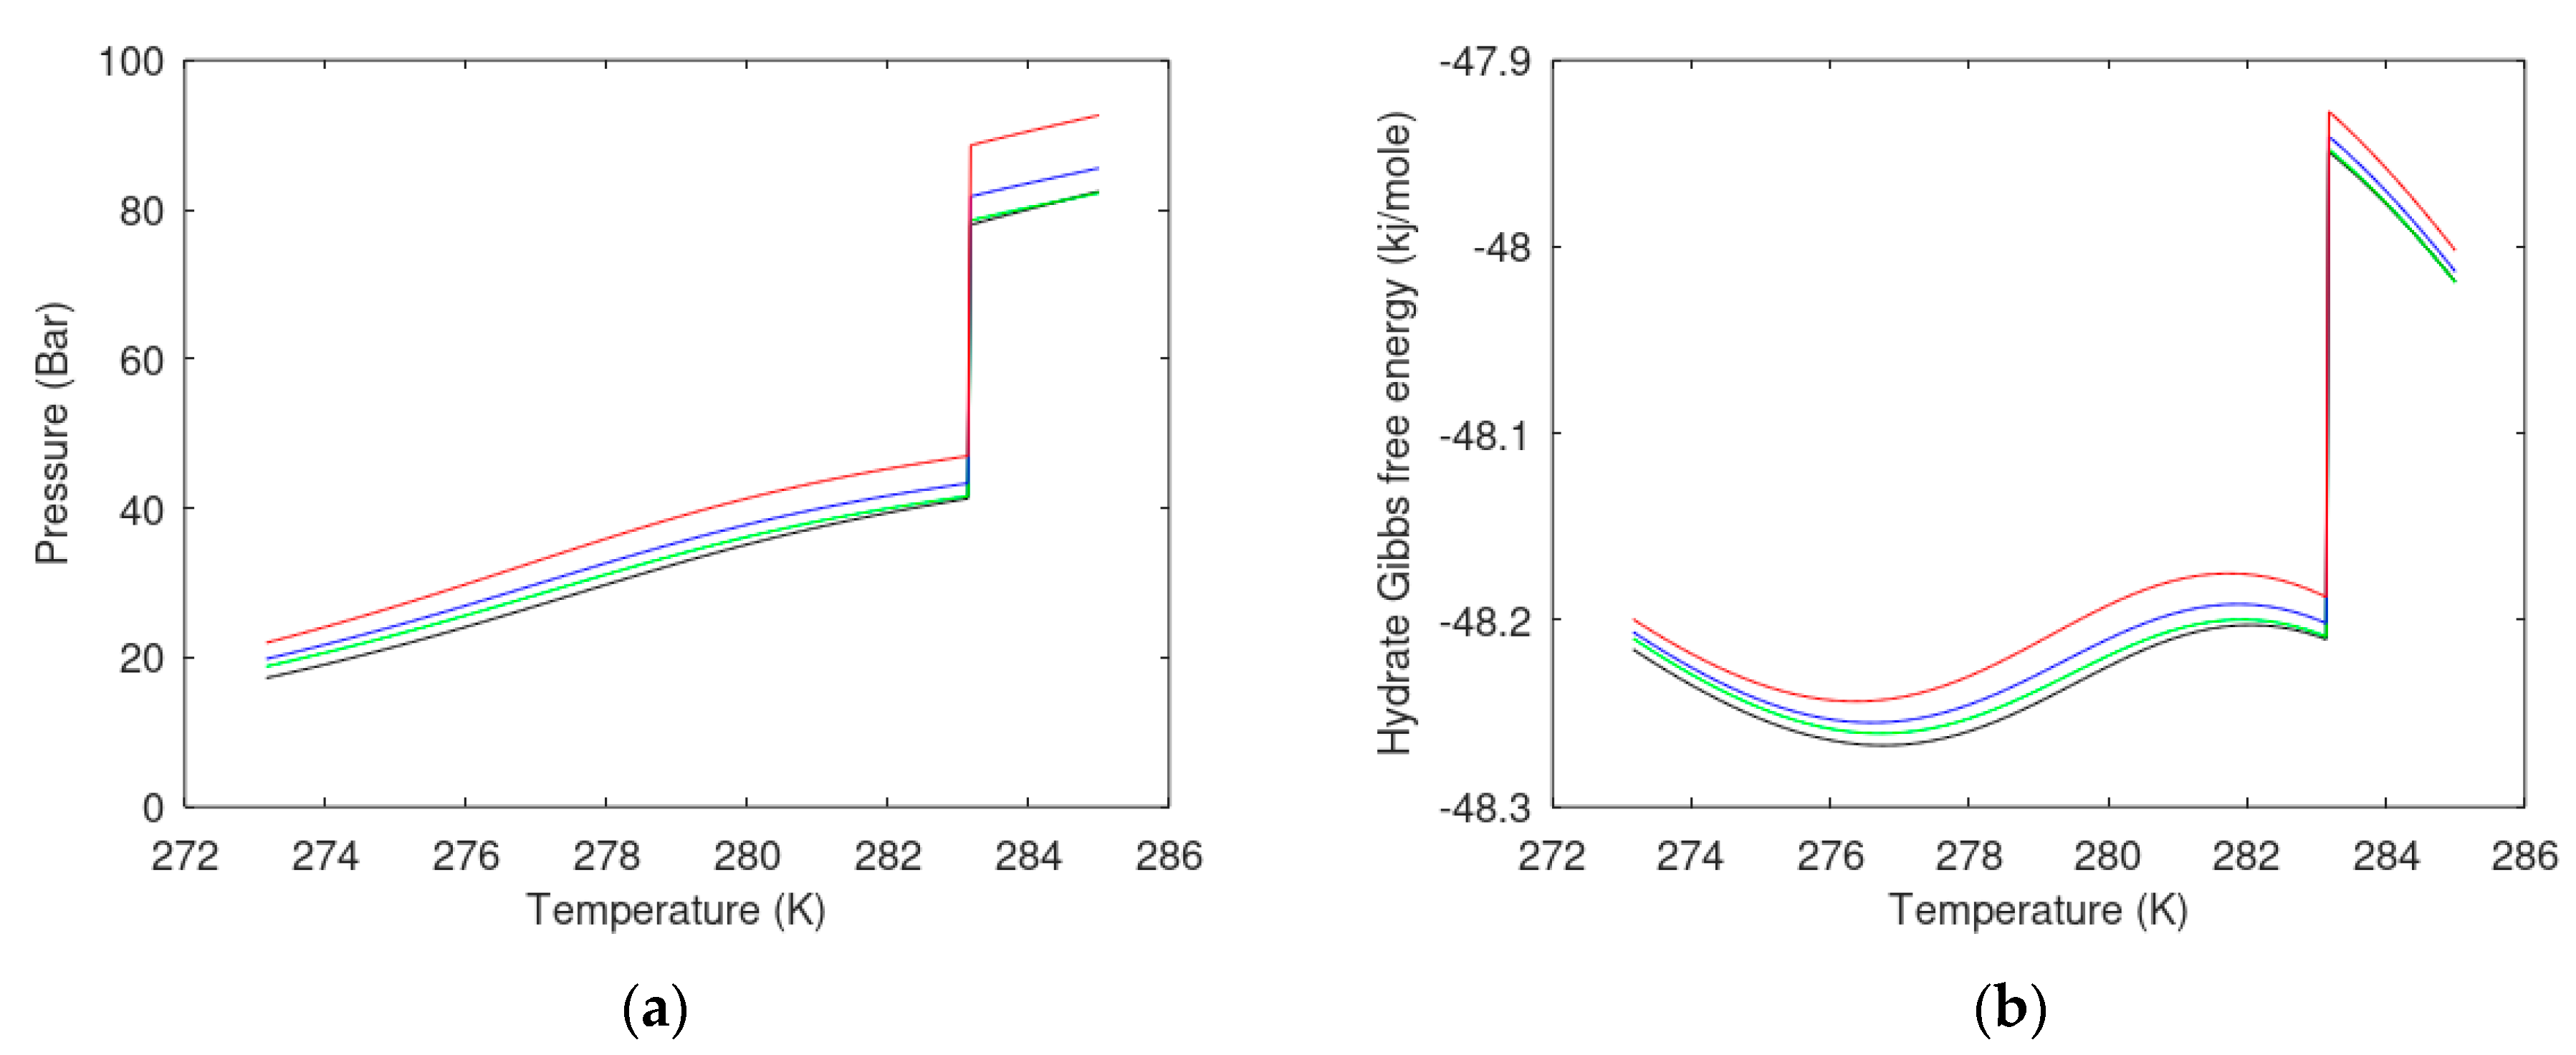
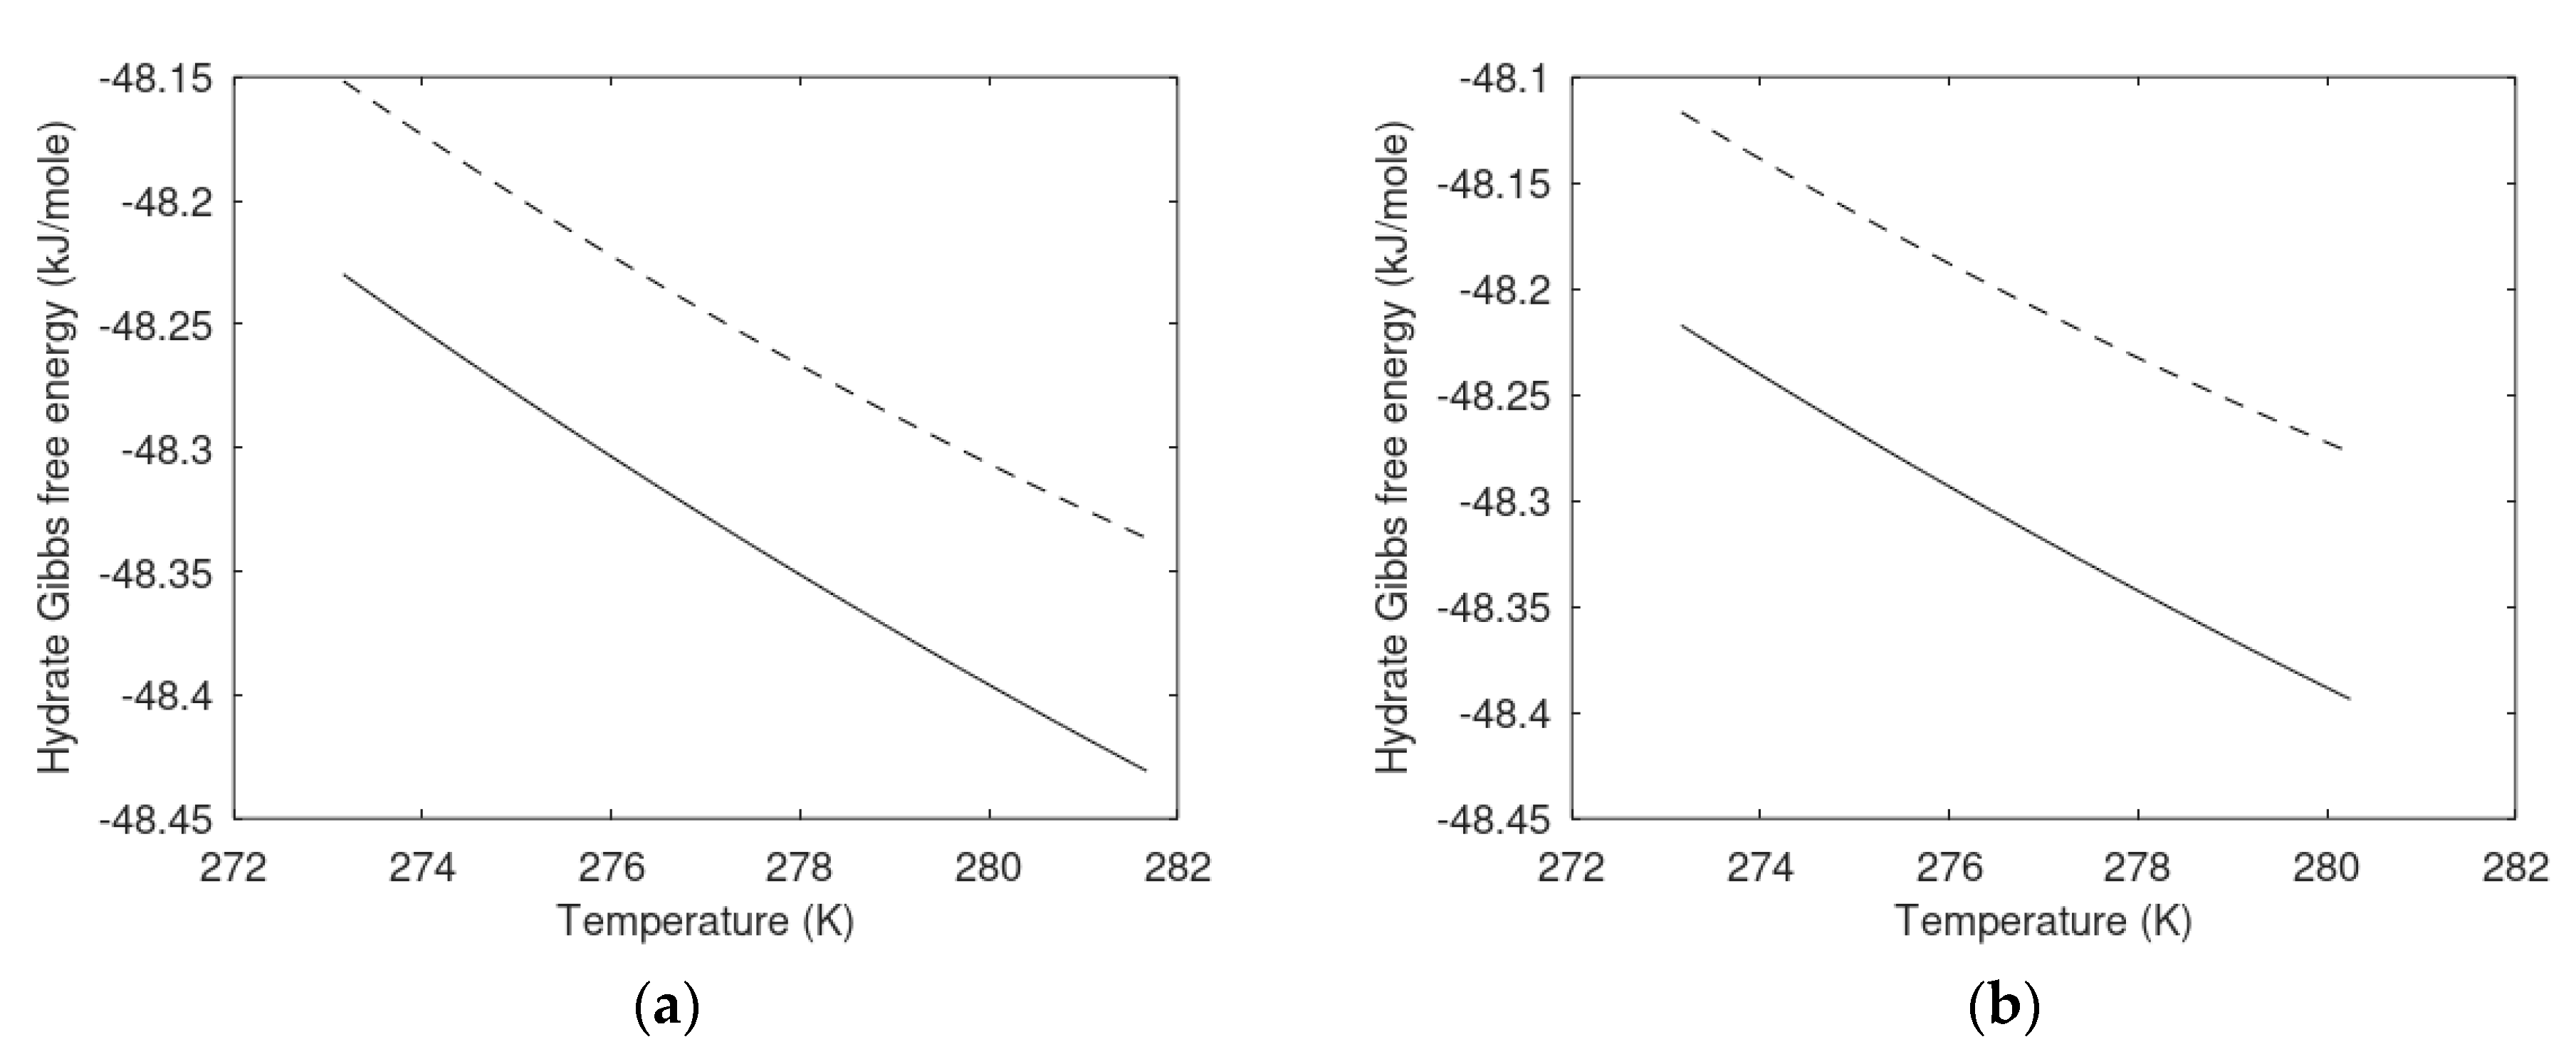
6.1. Hydrate Phase Transition and Free Energy Changes

Ethanol and methanol only have one hydroxyl group. It can be of interest to compare hydrates formed from liquid water containing glycols and CH4 with hydrates formed from water containing ethanol or methanol. MEG is mono-ethylene glycol and TEG is tri-ethylene glycol. In Figure 1a, I plot hydrate stability pressure limits as function of temperature and concentration of MEG or TEG in the water. Gibbs free energies for the formed hydrates are plotted in Figure 1b.
Similar plots for water containing ethanol and methanol are plotted in Figure 2a,b.
Stability of hydrates formed from water containing glycols, and hydrates formed from water containing ethanol and methanol are very similar.
Fugacity formulations dominate hydrate stability limit calculations in open literature on hydrates. Academic and commercial hydrate software is also based on the so-called reference scheme from around 1970. It might be useful to provide the residual thermodynamic model behind the curves in Figure 1 and Figure 2. Liquid water chemical potential is formulated by symmetric excess thermodynamics as:
μ i ( p , m i x ) ( T ( p ) , P ( p ) , x ( p ) ) = μ i ( p , p u r e ) ( T ( p ) , P ( p ) ) + R T ln x i + R T ln γ i ( p ) ( T ( p ) , P ( p ) , x ( p ) )
in which p is an indicator of liquid phase and p is water in this case. Subscript i denotes component index and i is water in this case. Superscript mix denote mixture and superscript pure denotes pure component. x is liquid mole-fraction and the arrow on x denote vector of all mole-fractions in the liquid mixture. γ i ( p ) is the activity coefficient for component i. Asymptotic limit is unity when mole-fraction of component i approaches unity. Activity correction is in excess thermodynamics. The whole quantity is, however, in residual thermodynamics since the pure water term (first term on right hand side) is derived from Molecular Dynamics (MD) simulations for ice. Consistent chemical potential for pure liquid water is derived from enthalpy of ice dissociation at 0 °C and extended in the liquid region using experimental heat capacities. The second term on the right-hand side is the ideal mixing term due to entropy of mixing. The final term corrects for the deviations from ideal mixing. A simple model for water activity coefficients in mixtures with some alcohols is given in Table 1. These are based on 1 bar pressure. Correction from 1 bar to actual pressure is included through a Poynting correction for pure liquid water in Equation (2). A Poynting correction for water in empty hydrate is also included in Equation (3) below.
Chemical potential for water in hydrate is given by:
μ H 2 O H = μ H 2 O O , H k = 1 , 2 R T v k ln ( 1 + i h k i )
μ H 2 O O , H is the chemical potential for water in an empty clathrate. Number of cavities is ν, with subscripts k for large and small cavities, respectively. For structure I, which is the main focus in this overview on thermodynamics, νlarge = 3/24 and νsmall = 1/24. Within the scope of this work, I will assume that only one guest molecule can enter a cavity. The harmonic oscillator approach model can then be expressed as:
h k i = e β [ μ k i Δ g k i ]
Chemical potential for molecule type i in cavity type k. I will assume that small and large cavities are at equilibrium so that:
μ l a r g e i = μ s m a l l i
For a system at equilibrium the chemical potential for a guest molecule in a cavity is equal to the chemical potential for the same molecule in the equilibrium phase. Δgki is the free energy change for inclusion for guest molecule i in a cavity of type k.
The most classical example is a hydrate former phase (gas, liquid, or supercritical) in contact with liquid (or ice) water which forms a hydrate at the interface. For these three phases there are 12 independent thermodynamic variables, 3 mass conservation equations, and 8 conditions of equilibrium. The difference between the number of independent variables minus mass conservations and equilibrium conditions leaves only one independent thermodynamic variable that can be fixed for equilibrium to be achieved. For this particular case of equilibrium Equation (4) can be written as:
h k i = e β [ μ i g a s ( T , P , x ) Δ g k i ]
For the heterogeneous hydrate formation, the phase index p in Equation (7) is gas. ϕ i ( p ) is the fugacity coefficient for CH4. In this work I utilize the Soave–Redlich–Kwong (SRK) equation of state [14]. The first term on the right-hand side is the ideal gas chemical potential as function of temperature and density. Ideal gas chemical potential is trivial to calculate using the momentum space of the canonical partition function. The methane model is a sphere and the methane ideal gas chemical potential is easy to calculate. The analytical expression can be found in any textbook on physical chemistry. Guest molecules with rotational degrees of freedom also require the moments of inertia for the rotational degrees of freedom ideal gas chemical potential. In this work, all models are rigid and there are no ideal gas contributions from intramolecular degrees of freedom. The second term is the ideal gas mixing terms that comes from the entropy of mixing ideal gas components at constant pressure.
μ i ( p , m i x ) ( T ( p ) , P ( p ) , x ( p ) ) = μ i ( p , p u r e , i d e a l   g a s ) ( T ( p ) , P ( p ) ) + R T ln x i + R T ln ϕ i ( p ) ( T ( p ) , P ( p ) , x ( p ) )
Since methane is pure in the first systems illustrated in Figure 1 and Figure 2 mole-fraction is unity. Equation (7) enters into Equation (6). The free energy change of inclusion for methane in small and large cavity is given elsewhere [9,13,26,44,45,46]. With Equation (5) in Equation (2) and solving Equation (2) equal to Equation (3) for the same chemical potential of water in liquid water as in the hydrate. Chemical potential for water in empty clathrate is also given by Kvamme and Tanaka [46]. I have solved the equations iteratively for pressures, with temperature as the chosen fixed variable. The chemical potential for the gas changes significantly with pressure. I therefore also plot the composition of the formed hydrate as well as chemical potential of CH4.
The filling fractions are trivially available from the semi grand canonical ensemble used for derivation of (3). This part is the same for the van der Waal and Platteeuw [47] model and our model [46]:
θ k i = h k i 1 + j h k i
θ k i is the filling fraction of component i in cavity type k. Also:
x i , l a r g e H = θ l a r g e , i ν l a r g e 1 + θ l a r g e , i ν l a r g e + θ s m a l l , i ν s m a l l
x i , s m a l l H = θ s m a l l , i ν s m a l l 1 + θ l a r g e , i ν l a r g e + θ s m a l l , i ν s m a l l
where ν is the fraction of cavity per water for the actual cavity type, as indicated by subscripts. The corresponding mole-fraction water is then given by:
x H 2 O H = 1 i x i , l a r g e H i x i , s m a l l H
and the associated hydrate free energy is then:
G ( H ) = x H 2 O H μ H 2 O H + i x i H μ i H
Additionally, note that the results in Figure 1a and Figure 2a are verification of the model system since these figures are solutions to:
Δ G ( H ) = x H 2 O H [ μ H 2 O H μ H 2 O l i q u i d ] + i x i H [ μ i H μ i g a s ] = 0
The molecular weight of ethanol and methanol is very different. The weight% alcohol used in industry is not convenient for comparison of thermodynamic effects since these are on a molar basis.
The changes in chemical potential for CH4 as guest varies substantially along the stability limits of temperature and pressure, and also as function of increasing ethanol content. The composition of the hydrates also varies substantially with amount of ethanol added to the water.
Addition of ethanol as a surfactant to CO2/N2 system should rarely exceed 2 mole% but I also include 3 mole% as a possible upper limit and 1.5 mole% as minimum addition of ethanol. CO2 hydrate is generally a more stable hydrate than CH4 hydrate. This is illustrated in Figure 3b below. The density of CO2 is also higher than CH4 for the same range of conditions. There is a CO2 phase transition to a higher density that results in a (relative) steep change in hydrate formation pressure as function of temperature. The stability limits of the hydrate are not substantially shifted for ethanol concentrations up to 3 mole% in water. In Figure 4a, we plot mole-fractions CO2 in the formed hydrates as function of ethanol mole-fractions up to 3 mole%.
Based on Figure 3, it is considered feasible to add up to 3 mole% ethanol to the water phase. Thermodynamic stability of the formed hydrate is not affected substantially for ethanol concentrations below this limit. The changes in hydrate composition and chemical potential of CO2 in hydrate are also small, as is illustrated in Figure 5. Changes in temperature and pressure hydrate formation conditions are also limited. Technically the best way is to add the ethanol to the injection gas. This will likely keep the surfactant effect for longer times before ethanol distributes and dissolve into groundwater.
The same calculations presented in Figure 3 and Figure 4 are also conducted for 20 mole% N2 in CO2/N2 mixture. Results are presented in Figure 5 and Figure 6.
There is no experimental evidence that CO2 enters the small cavity of structure I at liquid water conditions. Hydrate formation mechanisms in the ice range is different and can likely lead to trapping of CO2 in small cavity. There are some references to work conducted in the group of Werner Kuhs [48,49,50] that provides evidence of small cavity filling of CO2 for temperatures far below zero and atmospheric pressures. We have conducted theoretical studies on different levels. These range from quantum mechanics to molecular dynamics simulations in the classical regime. All conclusions are the same. There is no free energy contribution to hydrate stability from CO2 filling in small cavities at liquid water temperatures. At some conditions of full filling of large cavities with CO2, a limited portion of CO2 in small cavities is not enough to result in destabilization of the hydrate as a whole. However, that does not mean that CO2 “willingly” enters a small cavity. According to Equation (5), the canonical partition function for CO2 in small cavity is zero at liquid water conditions.
Another challenge in the experiments that are conducted at atmospheric pressure and 1 bar [48,49,50,51] is that the conversion between CH4 hydrate and CO2 hydrate is totally different since there is no liquid side interface. Specifically, a solid-state mechanism has been proposed [51]. A solid-state mechanism is not in accordance with kinetic rates we have observed during 2 decades of CH4/CO2 exchange experiments in liquid water regime. As mentioned in the introduction, this is a theoretical paper and we are therefore not reporting from our experiment or any other experiments on this specific issue.
For CO2/N2 mixtures at liquid water state conditions the hydrate formation from injection gas will facilitate from N2 filling of the small cavities. This can be seen from a different stability limit window in Figure 5a. However, the free energies of the formed hydrates are less stable than hydrates created from pure CO2, as can be seen by comparing Figure 3b and Figure 5b. This is due to the change in CO2 chemical potential though dilution with N2. The reduction in stability is, however, limited and stability of the mixed hydrates formed from up to 3 mole% ethanol in water is significantly more stable than the CH4 hydrate.
Composition of the hydrate is plotted in Figure 6a. Chemical potentials of the guests in the hydrate are plotted in Figure 6b. The values are reasonable in view of the influence of CO2 on chemical potential for N2 through the density of the mixture and the fugacity coefficient.
Thermodynamically it is feasible to use ethanol in CO2/N2 with 20 mole% N2, and an amount of ethanol that would result in maximum 3 mole% ethanol in the pore water. Higher mole-fractions of ethanol in water have not been investigated since 3 mole% ethanol in water is equivalent to 7.33 weight%.

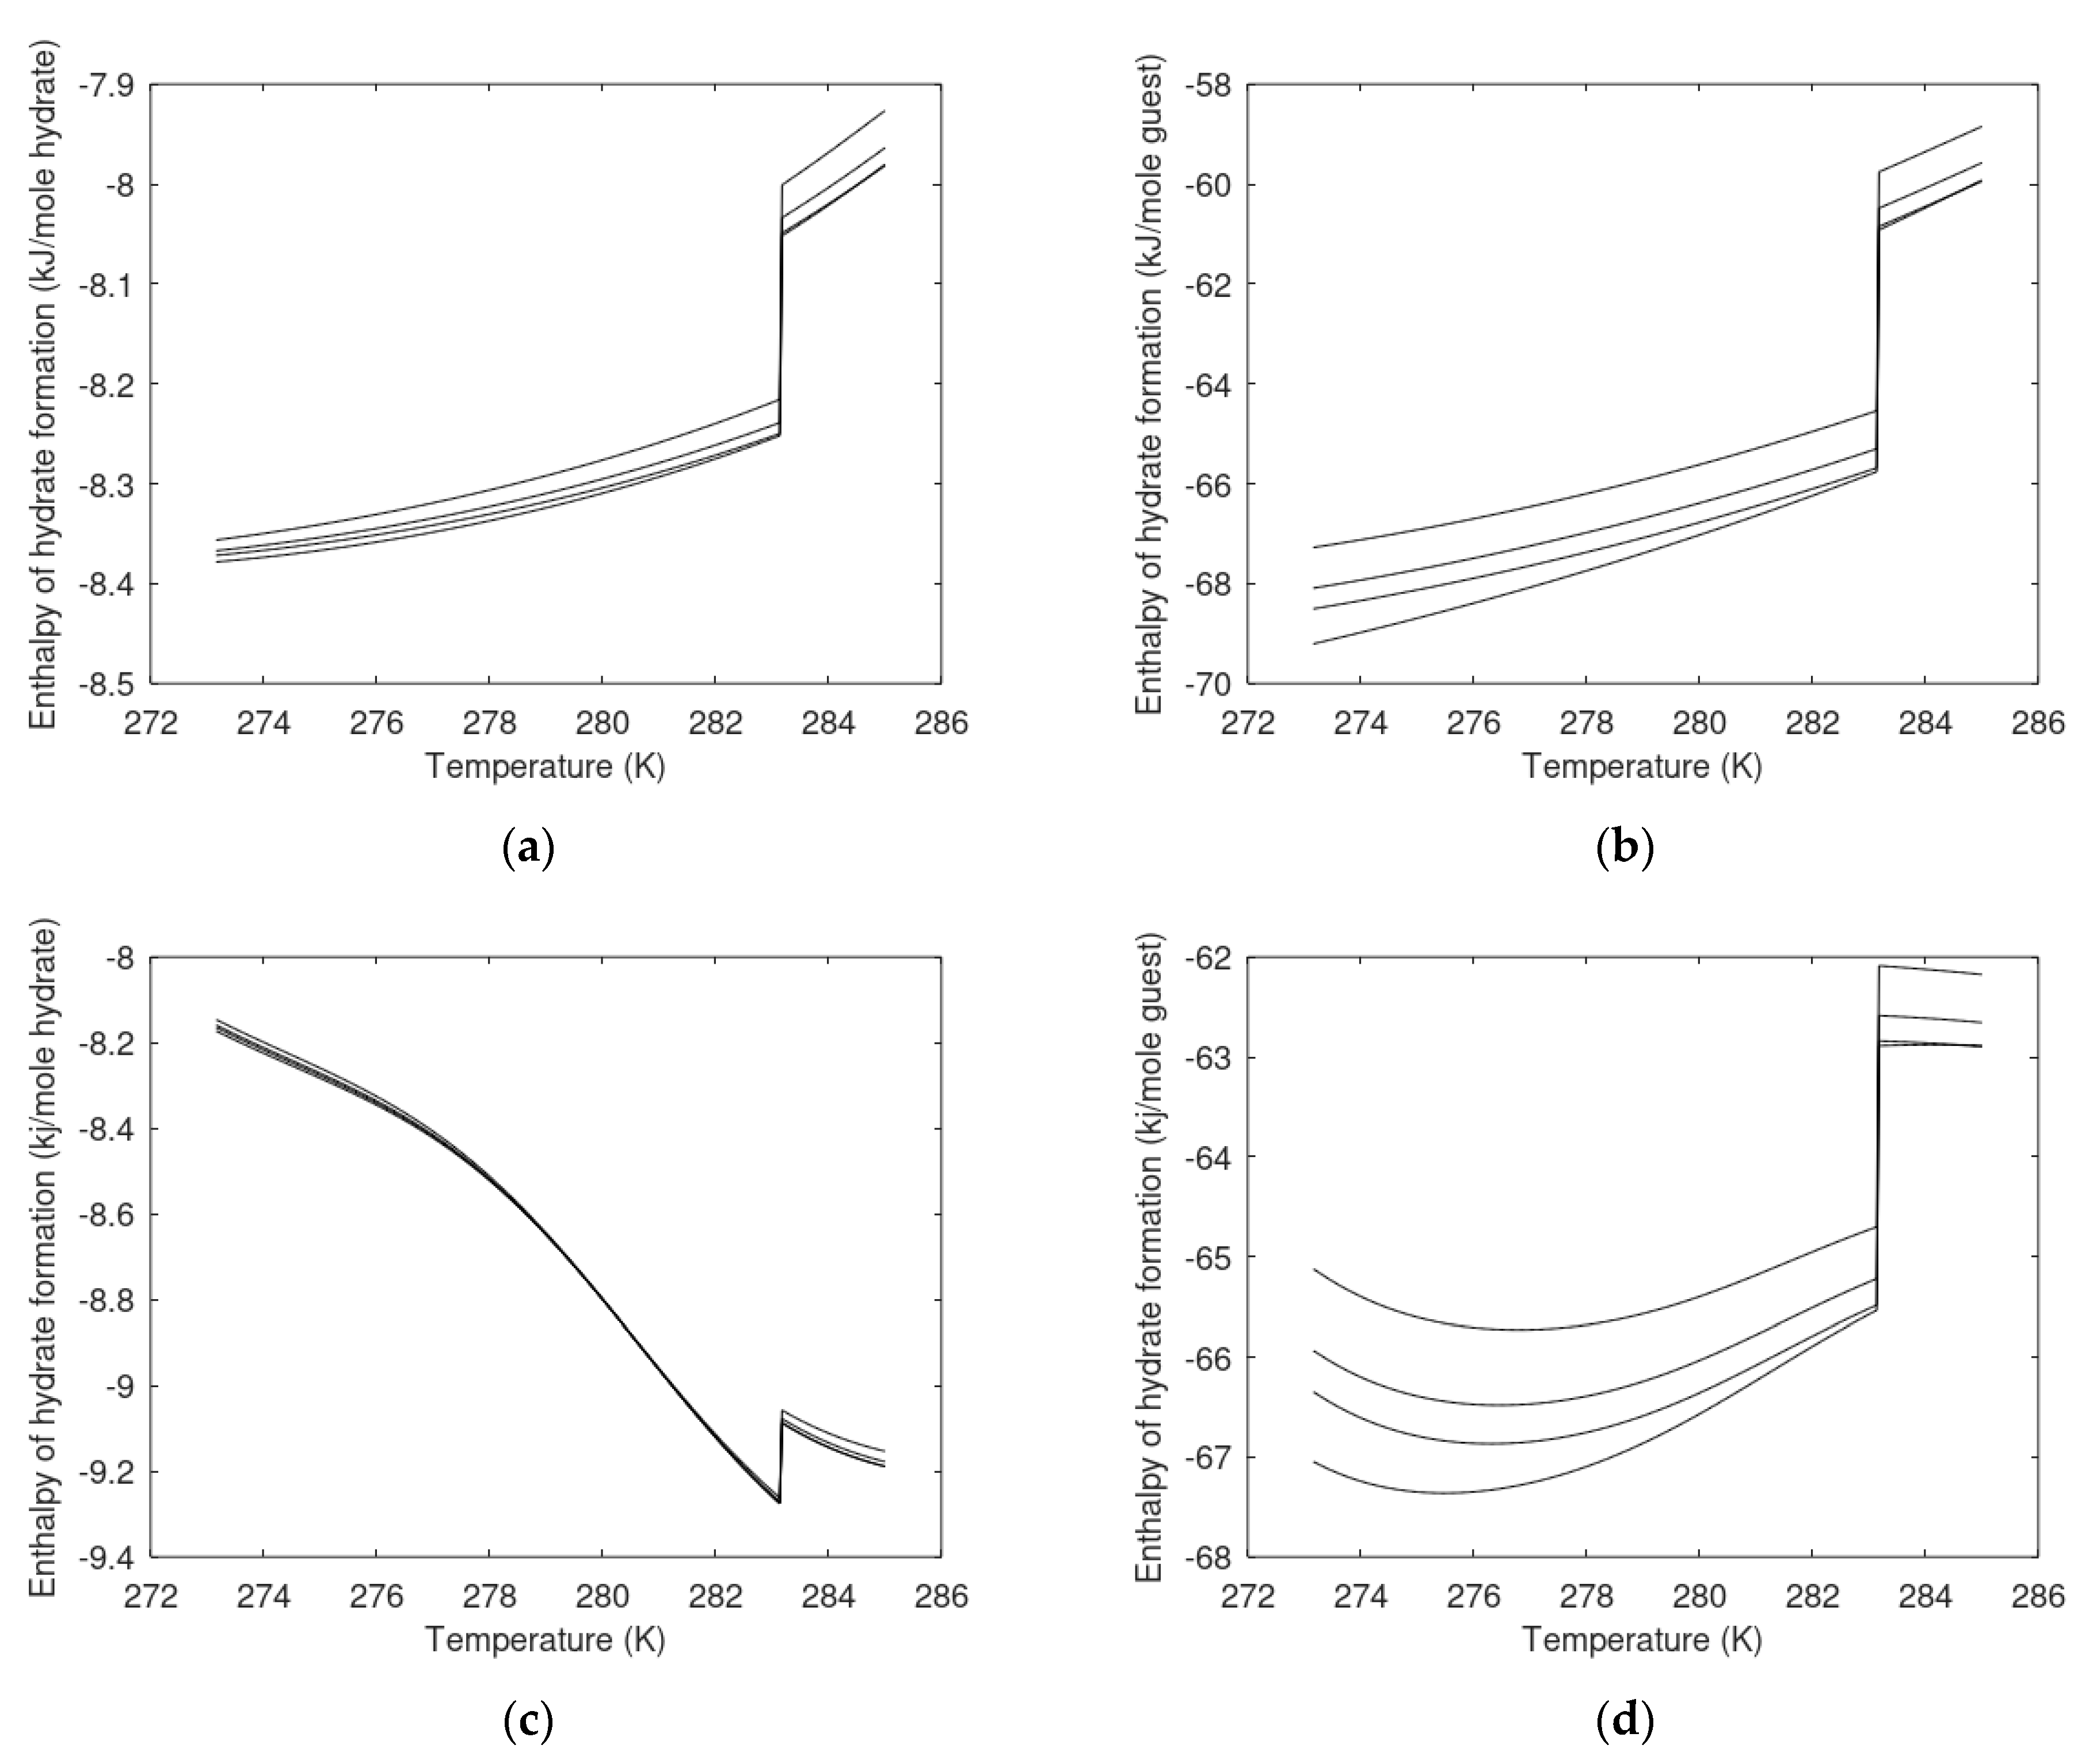
6.2. Enthalpies of Hydrate Formation

A consistent way to calculate Δ H T o t a l is given by the general thermodynamic relationship:
[ Δ G P h a s e t r a n s i t i o n R T ] P , N T = [ Δ H P h a s e t r a n s i t i o n R T 2 ]
The route to enthalpy changes, from the residual thermodynamic scheme described in this work, is fairly straightforward utilizing Equation (3) for hydrate water. Liquid water chemical potential from Equation (2) as basis for corresponding enthalpy of liquid water is trivial and available in thermodynamic textbooks.
I now use H1 to denote heterogeneous hydrate formation from liquid water (or ice) and methane gas. The same proportionality as in Equation (14) applies to relationship between chemical potential and partial molar enthalpy:
[ Δ μ H 2 O ( H 1 ) , P h a s e t r a n s i t i o n R T ] P , N T = [ Δ H ¯ H 2 O ( H 1 ) , P h a s e t r a n s i t i o n R T 2 ]
in which Δ H ¯ H 2 O ( H 1 ) , P h a s e t r a n s i t i o n is the partial molar enthalpy change for water during the phase transition.
Differentiation of Equation (3) gives the following results for partial molar enthalpy of water in hydrate [6,12,13,14,15]:
H ¯ H 2 O H = R T 2 [ μ H 2 O 0 , H R T ] P , N T + [ k = 1 , 2 v k i h k i [ ( μ k i Δ g k i ) T ( μ k i T Δ g k i T ) ] ( 1 + i h k i ) ]
and from Equation (2) for liquid water:
H ¯ H 2 O w a t e r = R T 2 [ μ H 2 O p u r e , H 2 O R T ] P , N T R T 2 x H 2 O w a t e r ln γ H 2 O w a t e r T | P , N
and the enthalpy of hydrate formation is then:
Δ H ¯ H 2 O ( H 1 ) , P h a s e t r a n s i t i o n = x H 2 O ( H 1 ) [ H ¯ H 2 O H 1 H ¯ H 2 O w a t e r ] + i = 1 n x i ( H 1 ) [ H ¯ i H 1 H ¯ i g a s ]
The last term is the partial molar enthalpy of the guest molecules in the gas (or liquid) hydrate former phase. This is trivially given by the Equation of state using the same type of relationship as Equation (15) with chemical potential for methane from Equation (7). The analytical expression for the SRK [52] version of this term is available from engineering handbooks and does not need space here. The partial molar enthalpy of each guest molecule in the hydrate, H ¯ i H 1 needs some more attention.
The ideal gas enthalpy depends only on temperature and will be the same for the guest molecule inside the cavities and in the gas mixture. As such we only need the residual contributions for these two terms. Entropy related properties like chemical potentials and free energies are sensitive to possible interactions between water movements and guest movements. Average interaction energy is less sensitive to these effects. I have therefore used a Monte Carlo approach [53,54] with fixed water lattice to evaluate average interaction energies between guest and water for the various cavity types in structure I. I also sample the efficient volume for the guest in the cavity in order to calculate a compressibility factor for the guest molecule inside the two types of cavities.
z k i = P V k i R T
where Vki is the sampled molar volume of guest molecule i in cavity type k.
H k i R = U k i R + ( z k i 1 ) R T
x i H 1 H ¯ i H 1 x i H 1 H ¯ i g a s = x i H 1 H ¯ i H 1 , R x i H 1 H ¯ i g a s , R = x l a r g e , i H 1 H ¯ l a r g e , i H 1 , R + x l s m a l l , i H 1 H ¯ s m a l l , i H 1 , R x i H 1 R T 2 ln ϕ i g a s ( T , P , x g a s ) T |
In Figure 7 below, I plot enthalpies of hydrate formation for pure CO2 and water containing various concentrations of ethanol up to mole-fraction 0.03. These are plotted as per mole hydrate in (a) as well as per guest in (b) in order to illustrate that the temperature dependency of the coordination number (moles water per mole guest in the formed hydrate) changes significantly when adding N2. As an example: for the pure CO2 hydrate formed form water containing 3 mole% ethanol the coordination number changes from around 7.0 for the lowest temperature range and down to 6.5 after the CO2 phase transition temperature. The coordination number is actually the numbers in Figure 8b divided by corresponding numbers in Figure 7a. Similar comparison for CO2 with 20 mole% N2 is illustrated is Figure 7c,d. As can be seen from Figure 6a, there is a significant change in the nitrogen filling of the hydrate with temperature. The coordination number changes substantially with temperature as compared to the pure CO2 case. However, as can be seen by comparing Figure 7b,d, the available enthalpy that can be used to dissociate in situ CH4 hydrate is significantly decreased by the addition of N2.
How much ethanol that will dissolve into “bulk” pore water during the average residence time of the injection gas in the pore is unknown. As such, it makes sense to also compare enthalpies per guest for methane as function of mole% ethanol in water as well. This will enable us to illustrate the range between maximum and minimum available formation enthalpy that can be used for dissociation of the in situ CH4 hydrate.
In Figure 8, I plot the same curves as in Figure 7 but now also with CH4 hydrate formation enthalpy included. In the worst case scenario, the available net enthalpy of hydrate formation from the CO2/N2 mixture is roughly 6 kJ/mole more than what is needed for dissociation of the in situ CH4 hydrate. These are all values at pressure temperature phase stability boundaries.
Heat transport is at least 2–3 times faster than mass transport through water systems [20]. The hydrate formation enthalpy for hydrates formed from CO2/N2 mixtures containing up to 20 mole% N2 is therefore sufficient to dissociate in situ CH4 hydrate for up to 3 mole% ethanol in the pore water. As illustrated in the previous section, the free energy of the hydrates formed from CO2/N2 mixture is thermodynamically more stable than CH4 hydrates. This is illustrated by comparing Figure 2b and Figure 5b. The difference is in the order of 2 kJ/mole hydrate. Formation of a new hydrate from the injection gas (CO2/N2/surfactant) will result in higher salinity of the remaining liquid pore water. Eventually, the resulting changes in liquid water chemical potential will lead to dissociation of hydrate in the pore. Additionally, since the stability of CH4 hydrate is lower than stability of CO2 hydrate then the CH4 hydrate will dissociate first.

7. Homogeneous Hydrate Formation in Systems Containing Alcohols

CH4 from dissociating hydrates is expected to distribute as gas bubbles escaping upwards in the reservoir due to buoyancy. Some methane will dissolve rapidly in water and can generate hydrate cores for further growth elsewhere. However, it is also important to investigate hydrate stability limits towards concentration of CH4 in surrounding water. This is also a route to hydrate dissociation even for other production schemes. Pumping out water during pressure reduction in a hydrate reservoir that has no free gas leads to change in water surrounding the hydrate. If the surrounding water contains less CH4 than hydrate stability limit concentration then the hydrate will dissociate.
Of course, we need to know the enthalpy of homogeneous hydrate formation since the released enthalpy of hydrate formation will generate local temperature gradients.
Homogeneous CH4 hydrate formation is discussed in Section 7.1 and homogeneous CO2 hydrate formation is discussed in Section 7.2.

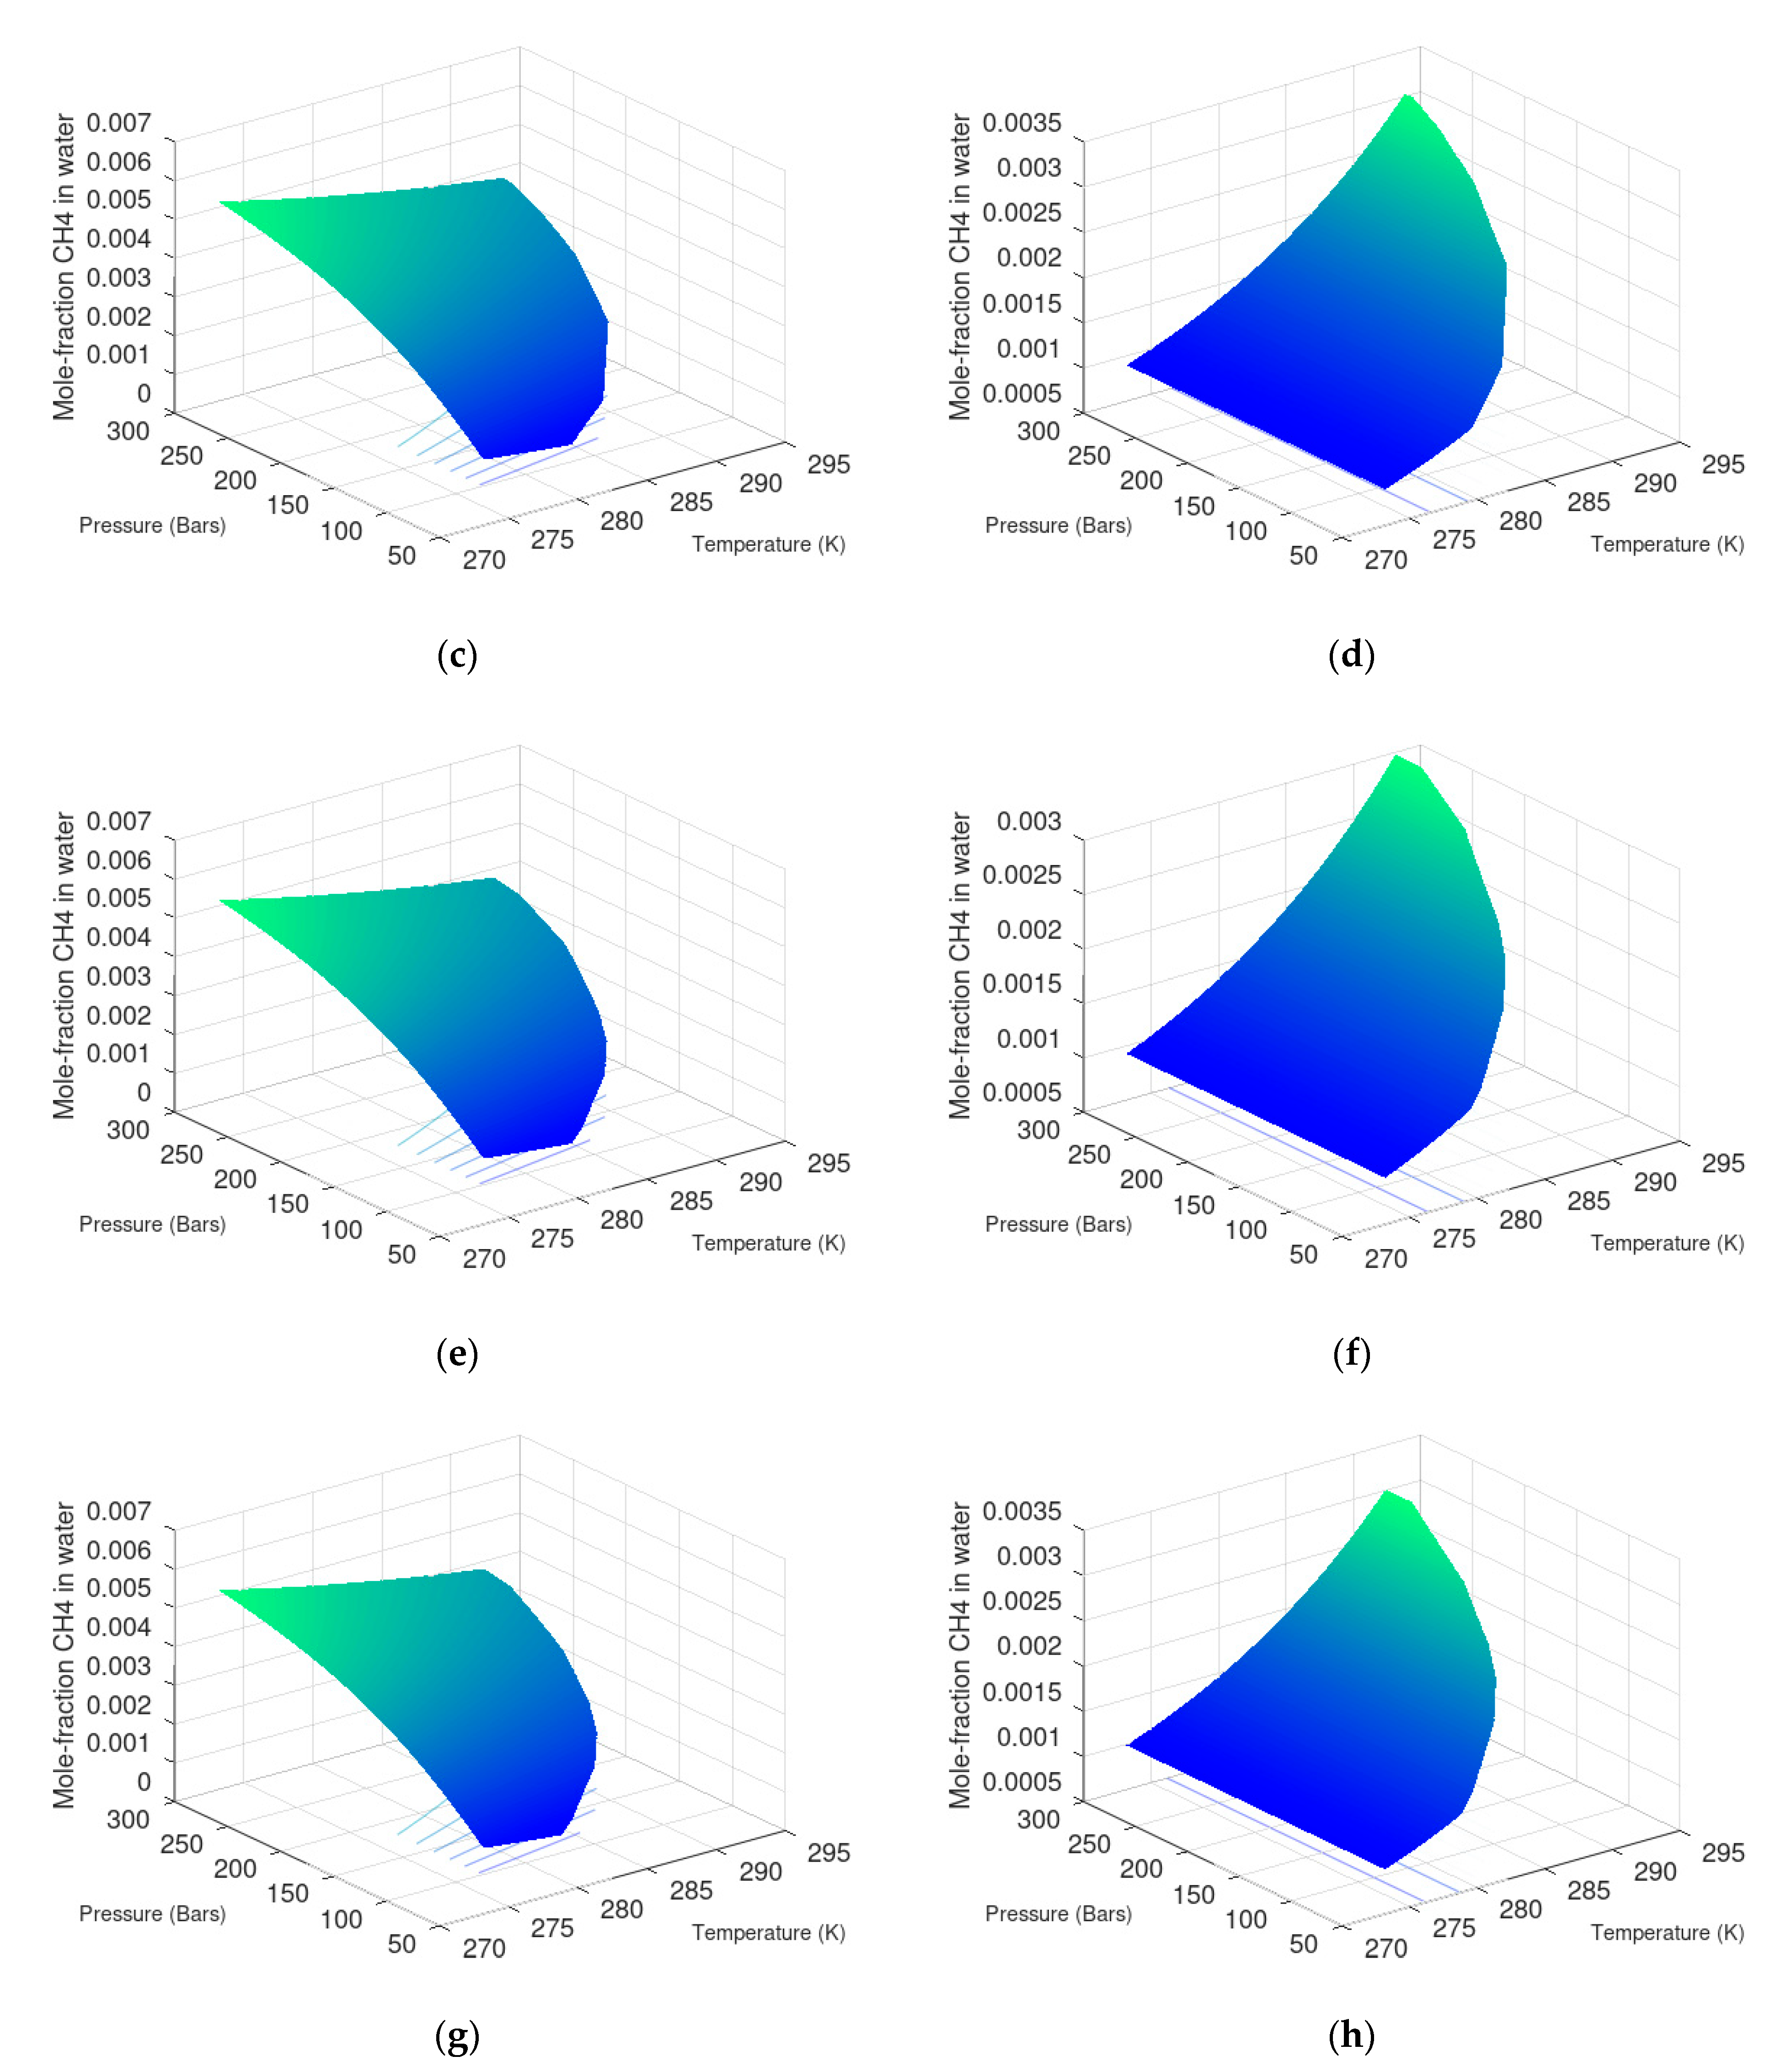
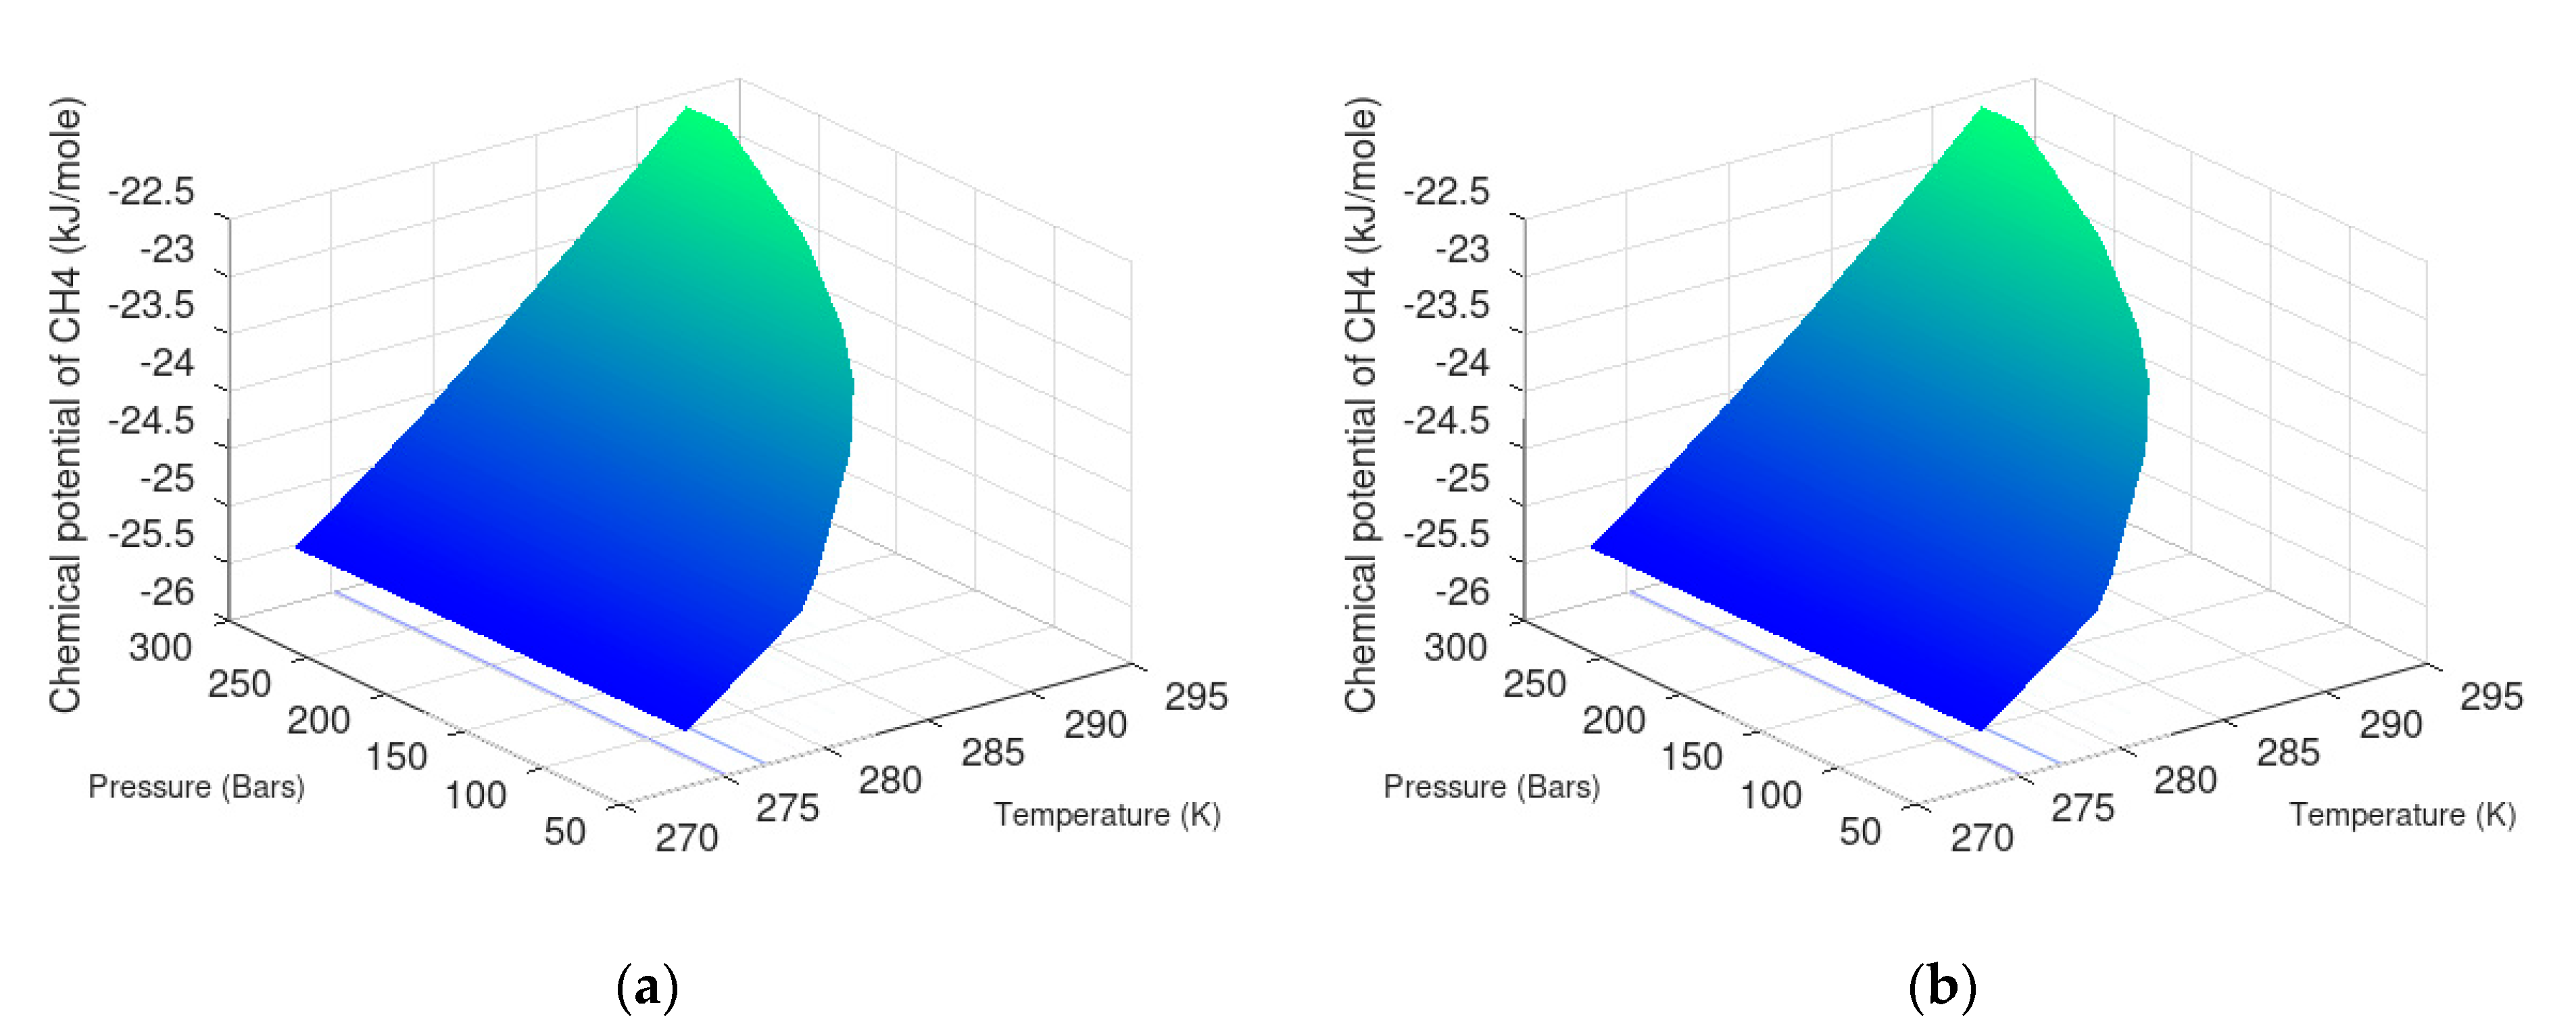
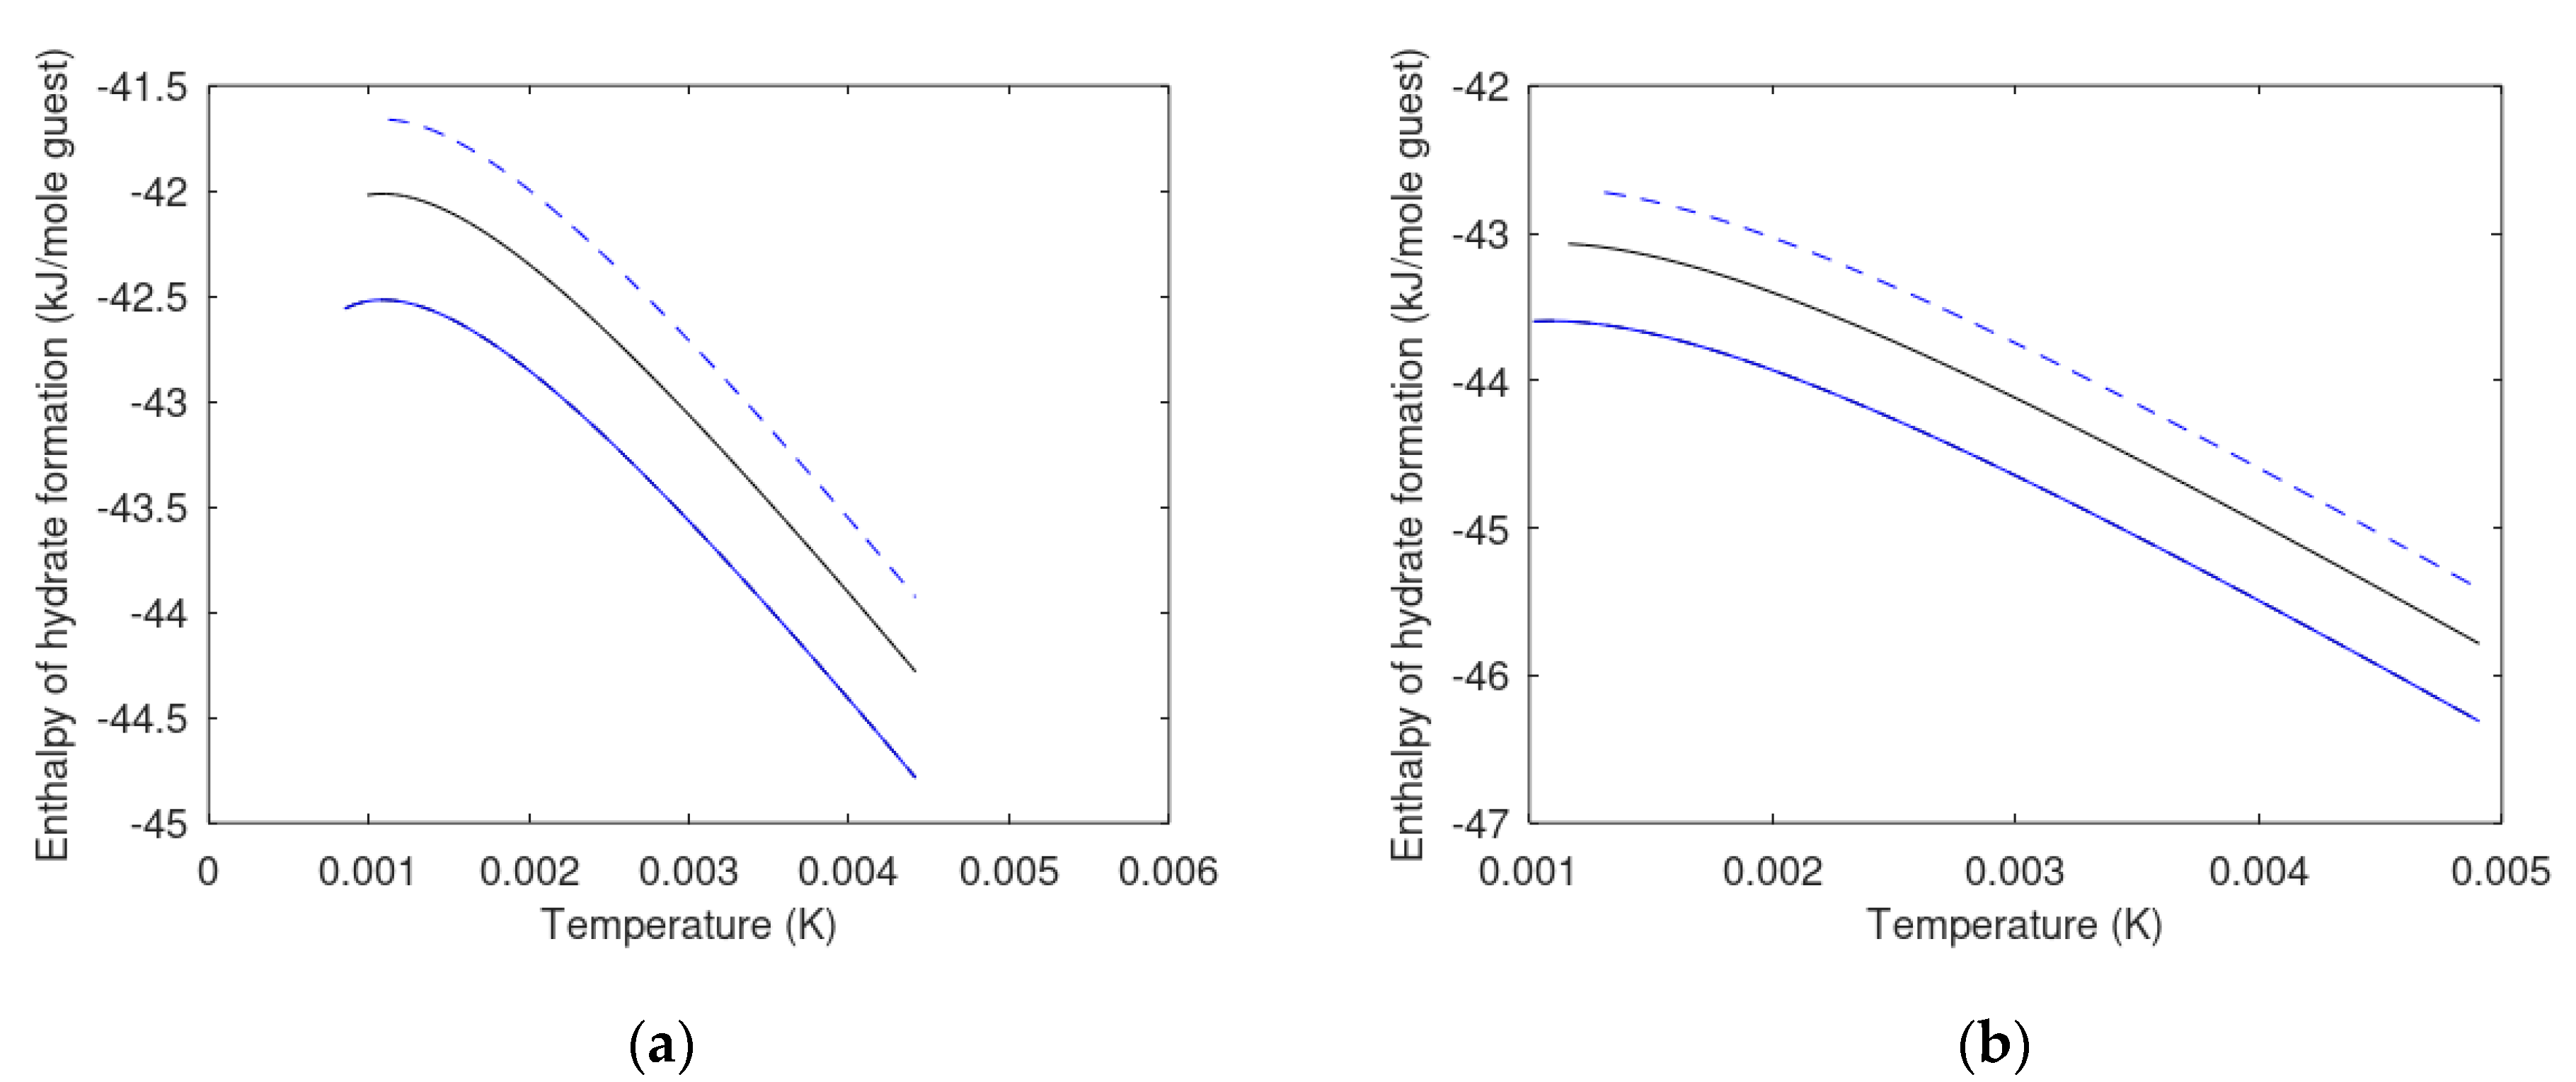
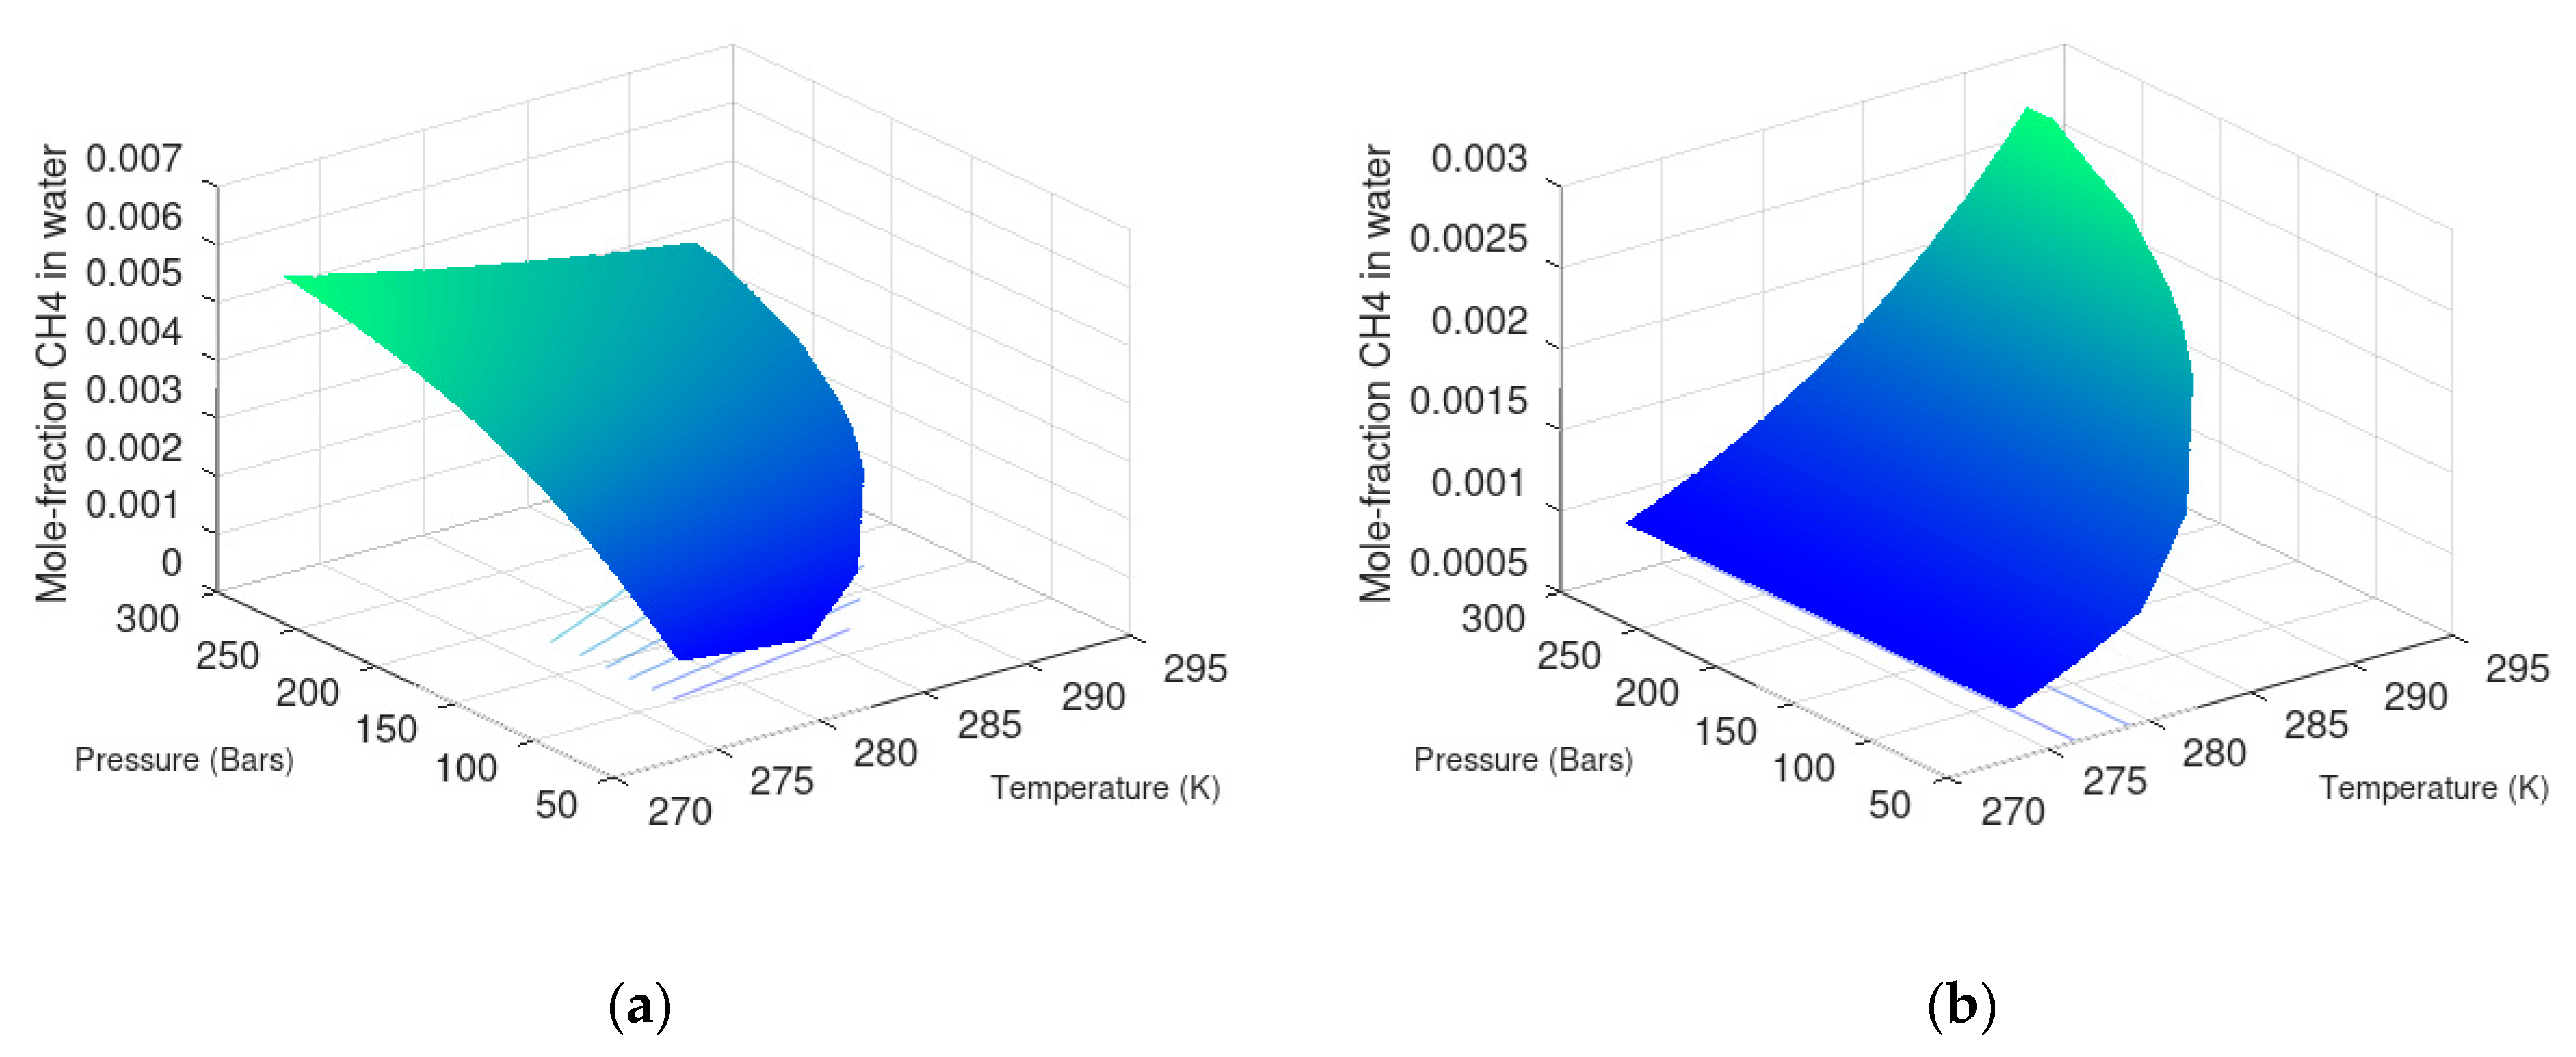
7.1. Methane Hydrate Formation from Water Solution

Solubility of CO2 in water is significantly larger than solubility of CH4 in water. Both of these hydrate formers can form hydrate homogeneously in water. They can also form hydrate heterogeneously since dissolved hydrate formers in water can adsorb on a hydrate film separating liquid water from the guest phase. Density of CH4 hydrate is lower that water density and will reside on top of liquid water. A hydrate film which has been formed heterogeneously, as discussed in Section 6, might already exist.
Generally, enthalpies of hydrate formation from guest molecules dissolved in water are smaller in absolute value than enthalpies of hydrate formation from gas and liquid water. The reason is that contributions to enthalpy changes for guest molecules are smaller. Partial molar volumes of these guest molecules in water are significantly smaller than the molar volumes for the same molecules in gas phase. The guest interactions with surrounding water are also closer to that of interactions between guest and water in a closed hydrate cavity [5,53,54].
A residual thermodynamic formulation for methane dissolved in water was developed by Kvamme [5] and briefly the resulting equation is:
μ C H 4 aqueous ( T , P , x ) = μ C H 4 , Residual ( T , P , x ) + μ C H 4 i d e a l   g a s ( T , P , x ) + R T ln [ x C H 4 γ C H 4 ( T , P , x ) ]
μ C H 4 , Residual = 3.665 + 40.667 T R 48.860 T R 2
where TR is temperature divided by critical temperature for methane. The maximum usable temperature for Equation (23) is 325 K, which is of course far above most hydrate forming condition. The ideal gas term on right hand side is calculated using infinite dilution partial molar volume for CH4 as function of temperature. Pressure dependency is negligible since water is almost incompressible. The ideal gas term is therefore calculated using the analytical solution for translational movement of CH4 in momentum space since CH4 is approximated as a sphere.
The activity coefficient for methane in water is based on the asymmetric excess convention. In this convention, the activity coefficient for CH4 in water approaches unity when mole-fraction CH4 goes to zero. A fitted equation, and corresponding parameters, is given in Table 2.
ln γ C H 4 ( T , P , x ) = i = 1 , 2 39 [ a 0 ( i ) + a 1 ( i + 1 ) T R ] ( x C H 4 ) [ 0.05 + i 1 40 ]
T R = T T C , C H 4 . The critical temperature for CH4 is 190.6 K.
The lower summation 1,2 indicates starting from 1 and counting in steps of 2.
Parameters for Equation (24).
The density of CH4 at ideal gas reference state is almost constant. With constant density the ideal gas chemical potential can be approximated by the following fit:
μ C H 4 i d e a l   g a s = 73.901 + 129.925 T R + 70.024 T R 2
The homogeneous hydrate formation region is limited by solubility of methane in water, and minimum mole-fraction of CH4 in water needed to keep hydrate stable. Solubility in liquid water is calculated by solving gas chemical potential, Equation (7), being equal to dissolved CH4 chemical potential for CH4 according to Equation (22).
Minimum mole-fraction for keeping the hydrate stable is calculated by inserting Equation (22) into Equation (4) and then assuming equilibrium (or rather, the stability limit) between hydrate CH4 and CH4 in solution. For defined temperature and pressure, we can then solve for equal water chemical potentials in liquid, Equation (2), and hydrate, Equation (3). In Figure 9, I plot CH4 solubility and CH4 hydrate stability limit as function of mole-fraction CH4 in surrounding water. These are plotted for various mole-fractions ethanol in water. Solubility plots are shown for the same range of conditions of homogeneous hydrate formation.
These 3D plots are not easy to read even with grids on. However, in the context of this work they are mainly intended as illustrations of the concentration window for possible hydrate grow from dissolved CH4 in water. As mentioned earlier, the hydrates formed from solution of CH4 are different from the heterogeneous hydrate discussed in Section 6. This can be seen by comparing Figure 10 below and gas CH4 chemical potentials from Figure 3b. This will result in different cavity partition functions, e.g., Equation (4). Compositions of hydrate will therefore be different and then also Gibbs free energies are different.
The differences between heterogeneous and homogenous hydrate can be seen by comparing Figure 10 and gas CH4 chemical potentials from Figure 3b. Since the gas chemical potential and the liquid water chemical potential of CH4 are different in a non-equilibrium system then cavity partition functions, such as in Equation (3), are also different. As a consequence, Gibbs free energies for heterogeneous and homogeneous hydrates are different. By thermodynamic definition hydrates with different composition and different Gibbs free energy are a different phase. In Figure 11, I plot free energy for the homogeneously formed hydrates for 0 ethanol and 3 mole percent ethanol in water. Hydrate can form in the whole concentration range between solubility and hydrate stability limits. Each mole-fraction guest in water will result in a unique hydrate composition. Additionally, note from the plots in Figure 9, Figure 10 and Figure 11 that pressure dependency in the hydrate plots is very small since these are phase transitions that only involve condensed phases.
A very important practical implication of the hydrate stability limits towards outside water methane concentration is the role it plays in destabilizing offshore hydrate. Most offshore hydrate reservoirs worldwide are in a stationary balance between formation of new hydrate from upcoming gas, and dissociation towards incoming seawater. Fracture systems in offshore hydrate frequently connect hydrate filled sections to the seafloor. The CH4 concentration in this seawater is close to infinite dilution. The chemical potential for CH4 at infinite dilution in water is lower than chemical potential for CH4 in hydrate. As a result, the hydrate will dissociate due to a more beneficial situation for CH4 in the outside water. The result of this mechanism for hydrate dissociation is observed worldwide as fluxes of methane from natural gas hydrate deposits. The flux rates can range from invisible bubbles to massive gas fluxes that bubble through the water column. Another example is all the hydrate mounds that sit on top of fractures that connect from seafloor and downwards towards conventional hydrocarbon reservoirs. Hydrate forms from upcoming gas and seawater, due to the temperature and pressure. The formed hydrate dissociates from the top due to chemical potential gradients of CH4 between hydrate and seawater. The hydrate formation/dissociation couplings are kinetically limited by the hydrate dissociation and these mounds can seem stationary. Dissociation fluxes can be monitored by measuring local CH4 concentrations in surrounding water. Since the CH4 is an attractive source for several biological ecosystems the biological activity on these mounds is normally high. A complete dynamic modelling of CH4 fluxes from these mounds will therefore include dynamics related the thermodynamics of hydrate dissociation towards seawater, as well as dynamics of biological consumption of CH4.
Homogeneous hydrate formation will happen from injection gas when CO2/N2/surfactants are used for hydrate production. This can be significant but is likely not very important. This route to hydrate formation is likely more important for CH4. Release of CH4 from a mole-fraction of roughly 0.14 in a hydrate will result in CH4 bubbles. However, it is also likely that the water surrounding the dissociating hydrate will be super-saturated with CH4. Possible CH4 reformation nucleation can therefore potentially happen heterogeneously as well as homogeneously. Examples for enthalpies of hydrate formation for two conditions of temperature and pressure are plotted in Figure 12 below.

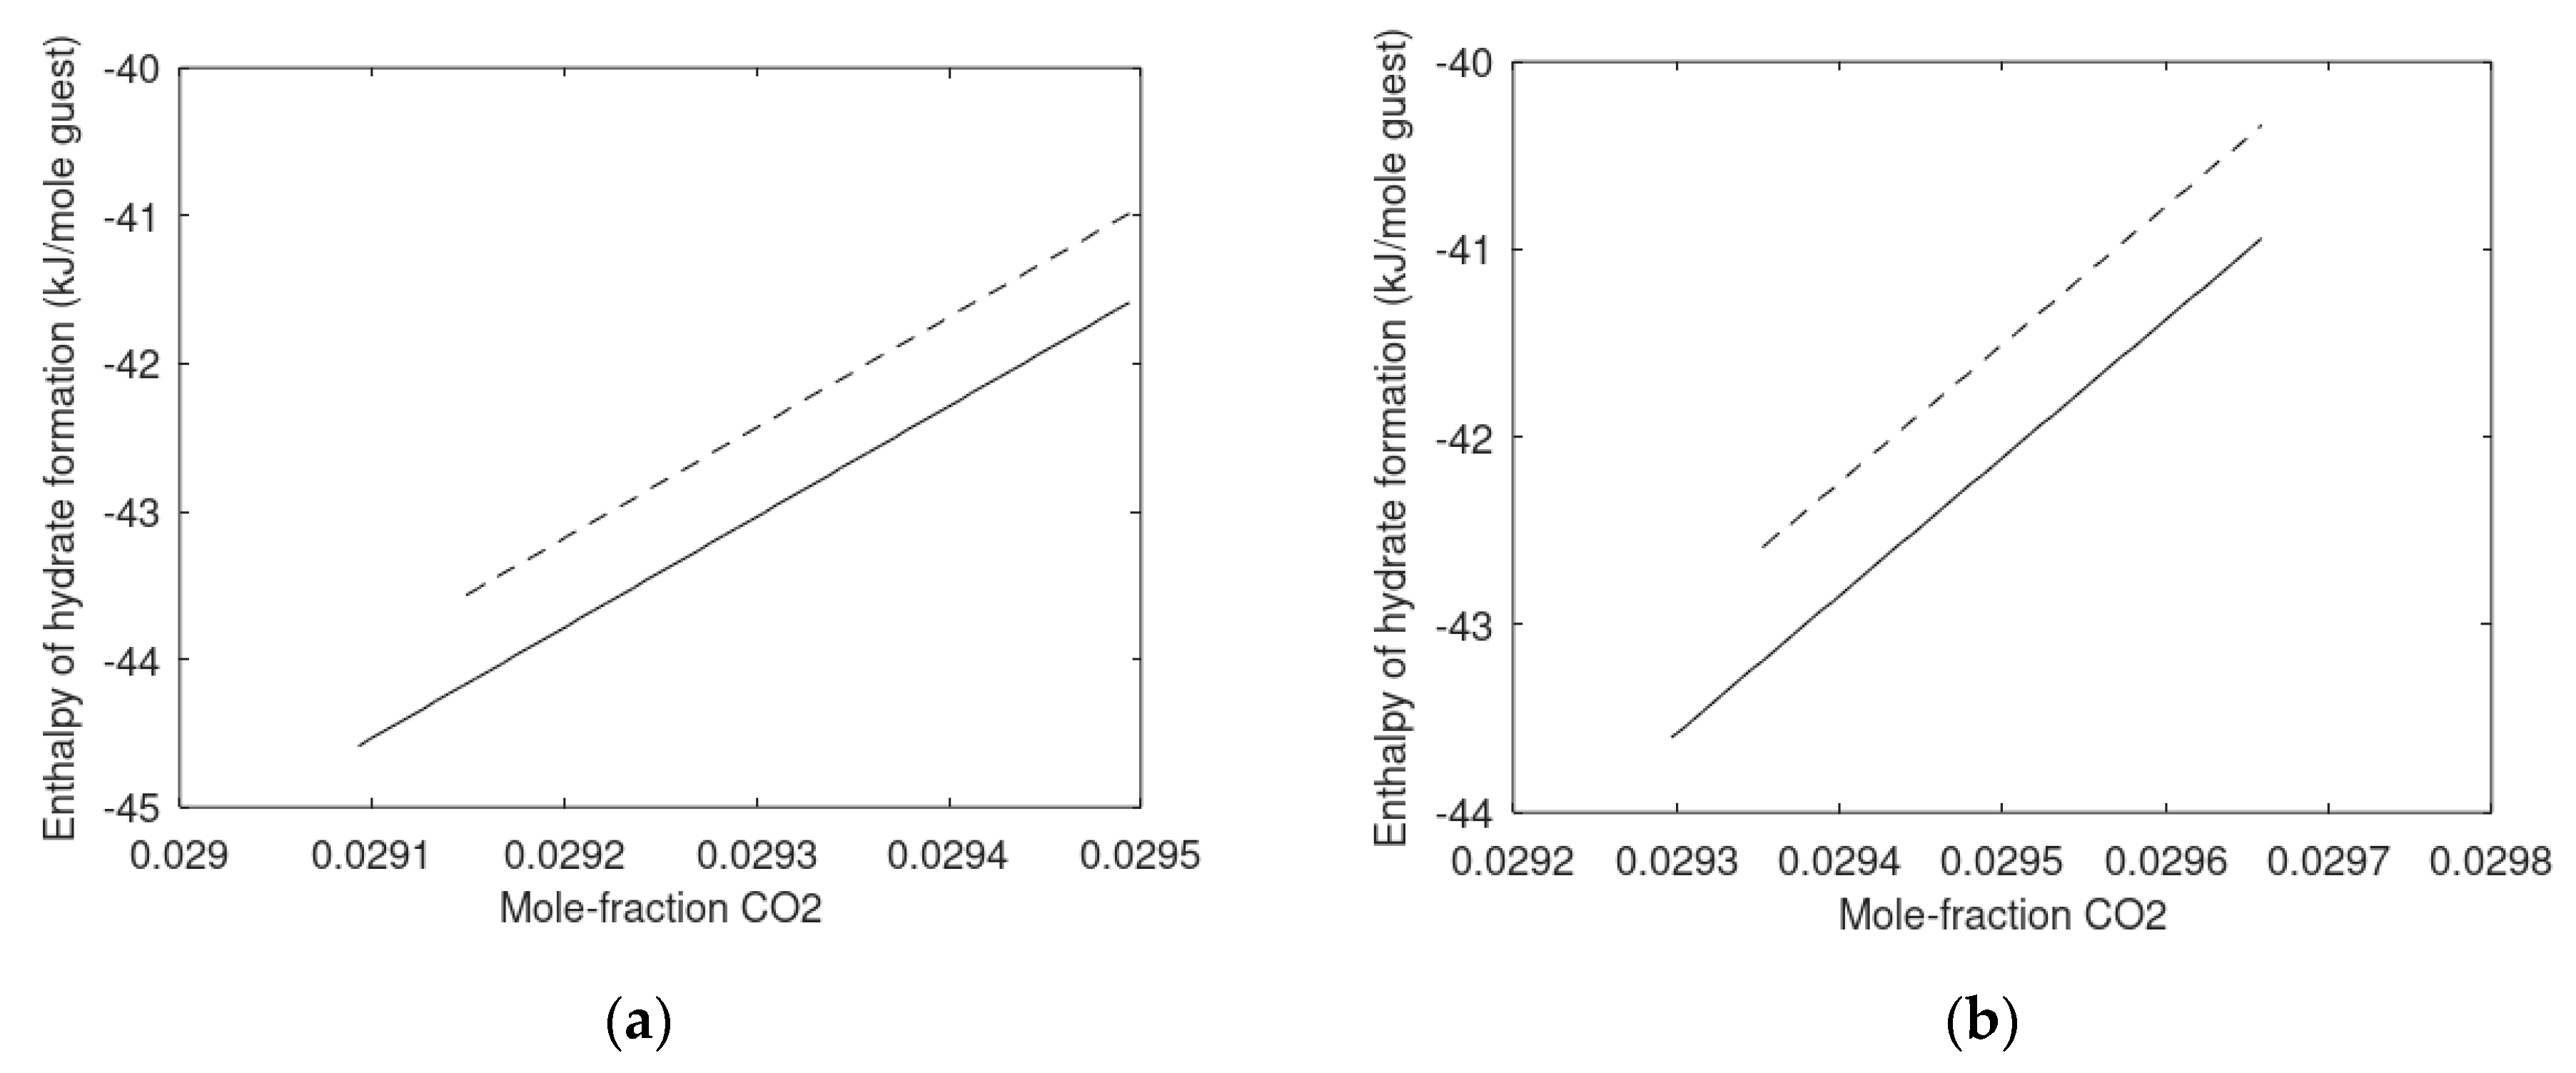
7.2. Carbon Dioxide Hydrate Formation from Water Solution

As discussed in the previous section, hydrate mounds on the seafloor can be connected to hydrate deposits. These mounds can, however, also be connected to conventional hydrocarbons sources that leak towards seafloor through fractures. When these hydrocarbons enter the seafloor at hydrate forming conditions, they create a dynamically unstable situation. These hydrate mounds are dynamically controlled by biological activity and also by chemical potential for CH4 in surrounding seawater. As a result of the biological activity also CO2 will be generated. CO2 hydrate formation from released CO2 will often be slow enough to dissolve in water. Seawater enriched with CO2 is heavier than regular seawater and will sink. In either case, CO2 hydrate can form locally from the dissolved CO2 in water. Although the main focus herein is on hydrate production using CO2/N2 mixtures modelling here, and the follow-up paper on kinetic modelling will also be useful for other groups involved in studies of hydrocarbon fluxes and the resulting changes in the ocean carbon cycle.
The solubility of N2 in water is extremely low and of no practical importance within the scope of this work. With 20 mole% N2 in the CO2/N2 mixture the chemical potential for CO2 “bulk” gas can be calculated using SRK [14]. On the other hand, the properties of CO2 and N2 are extremely different in terms of selective adsorption on liquid water surface [32]. It might therefore be a fair approximation to calculate solubility based on almost pure CO2 in the adsorbed water layer.
The density of CO2 as dissolved in water will correspond to the partial molar volume of CO2 at infinite dilution. The density of CO2 at infinite dilution is simply the inverse of the partial molar volume. Chemical potential for ideal gas is a trivial analytical function of the center of mass and molecular weight and the moments of inertia for rotation. It is the Boltzmann factor integrals of the momentum space in the canonical partition function. The integrals end up as analytical simple expressions that can be found in any textbook on physical chemistry or statistical mechanics. The infinite dilution ideal gas chemical potential is not very sensitive to pressure. The following fitted approximation to only temperature dependency is considered as adequate:
μ C O 2 , i d e a l   g a s = 130.006 + 163.818 T 0 , R 64.898 T 0 , R 2
where T0,R is 273.15 K divided by the actual temperature. Equation (26) does not apply to temperatures above 303 K due to the limited range of temperatures for which infinite partial molar volumes are used and for temperatures above 273.15 K.
Many methods for production of hydrate reservoirs have been proposed during the latest three decades. Thermal stimulation, or injection of thermodynamic hydrate inhibitors are just two examples of methods that have more or less lost attention due to the high cost. One problem is, however, that different methods for producing hydrates are not evaluated thermodynamically prior to planning expensive experiments or even more expensive pilot tests. This can be due to lack of a thermodynamic toolbox for the purpose. Another challenge is the lack of focus on the limitations of the hydrate phase transition itself. The interface between hydrate and liquid water is a kinetic bottle neck. Reducing pressure does not address this problem. Injection of CO2 will lead to formation of a new CO2 hydrate. This hydrate formation is an efficient heat source for dissociating hydrate since heating will break the water hydrogen bonds and directly address the important nano scale kinetic limitation. Adding limited amounts of N2 increases permeability for the injection gas. The addition of surfactant increases gas/water interface dynamics and promote heterogeneous hydrate formation. In this work, we demonstrate a residual thermodynamic scheme that opens up for thermodynamic analysis of different routes to hydrate formation and dissociation. It is demonstrated that 20 mole% N2 added to the CO2 is thermodynamically feasible for generating a new hydrate in the pores. The available hydrate formation enthalpy from CO2/N2 hydrate formation is also feasible for dissociating in situ CH4 hydrate. Up to 3 mole% ethanol in the free pore water is also thermodynamically feasible. The addition of alcohol will not significantly disturb the ability to form new hydrate from the injection gas. Homogeneous hydrate formation from dissolved CH4 and/or CO2 is limited in amount and not important. However, the hydrate stability limits related to concentration of hydrate former in surrounding water is important. Mineral surfaces can act as hydrate promotors through direct adsorption, or adsorption in water which is structured by the mineral surface charges. These aspects will be quantified in a follow-up paper, along with kinetic modelling based on thermodynamic modelling in this work.
For CO2 in water, I utilize the following function:
ln ϕ C O 2 w a t e r ( T , P , x ) = i = 1 , 2 39 [ a 0 ( i ) + a 1 ( i + 1 ) T R ] ( x C O 2 ) [ 0.05 + i 1 40 ]
where TR is reduced temperature and defined as actual T in Kelvin divided by critical temperature for CO2 (304.35 K). The lower summation 1, 2 indicates starting from 1 and counting in steps of 2. Parameters are given in Table 3 below. The arrow on top of x denotes the vector of all mole-fractions in the actual phase.
The chemical potential for CO2 that applies to Equation (23) for an equilibrium case is then given as:
μ C O 2 a q u e o u s ( T , P , y ) = μ C O 2 , i d e a l   g a s ( T , P , y ) + R T ln [ x C O 2 ϕ C O 2 ( T , P , x ) ]
In Figure 13a, I plot solubility of CO2 in pure water. Hydrate stability limits for CO2 as function of mole-fractions CO2 in surrounding water is plotted in Figure 13b. Similar results for water containing 3 mole% ethanol are plotted in Figure 14.
In order to get a picture of the mole-fraction range for homogeneous hydrate growth from CO2 dissolved in water, I plot solubility in water minus hydrate stability limit in water as a function of mole-fraction CO2 in water from solubility mole-fraction and down to hydrate stability limit mole-fraction. These are plotted in Figure 15 as function of solubility and temperature. Solubility axis reflects a pressure range from 90 bar to 300 bar.
The stability of hydrate formed homogeneously from dissolved CO2 in water is lower than heterogeneously formed CO2 hydrate, as illustrated in Figure 16.
The change in the enthalpy model for CO2 is the same that was done for CH4 (but not shown here). It simply involves replacing the partial molar enthalpy from a gas phase as in the heterogeneous case to partial molar enthalpy for guest molecules dissolved in water. Specifically for CO2:
H C O 2 R = R T 2 [ ln ϕ C O 2 w a t e r T ] P , y j C O 2
and
H C O 2 w a t e r = R T 2 [ ( μ C O 2 , i d e a l   g a s R T ) P , y j C O 2 T + [ ln ϕ C O 2 w a t e r T ] P , y j C O 2 ]
Examples for two conditions of temperatures and pressures are plotted in Figure 17.
The enthalpies of hydrate formation are small due to smaller changes for guest molecules as compared to changes for a gas molecule that gets trapped into a higher density. Practically this homogeneous hydrate formation may not be critically important for the hydrate production planning. The hydrate stability limits towards CO2 in surrounding water may, however, be more important in terms of long terms stability of the stored CO2. Nevertheless- storing CO2 as solid hydrate in a reservoir with proven sealing is a safe option. The in situ CH4 hydrate may have been trapped for millions of years due to sealing formations (clay and shale).

8. Discussion

Interest for using CO2 in a concept for combined safe long-term storage of CO2, and simultaneous release of CH4 is increasing worldwide. Associated thermodynamic properties and knowledge of conversion mechanisms are critical. I have many years of experience on the water/gas interface dynamics and how it affects conditions for hydrate nucleation on liquid water side of the interface. All the papers in the PhD theses [49,50,51,52] and other references here [5,7,53] support the physical picture that heterogeneous hydrate nucleation is facilitated by water structures on the liquid water side of the interface. Recent studies on surfactant stimulated water/carbon dioxide interfaces underscore the importance of surfactants for hydrate nucleation [3,10,55,56]. There is a fundamental difference between heterogeneous hydrate nucleation in liquid water region, and at conditions far into the ice region. CH4 hydrates made from powdered ice and CH4, and then exposed to CO2 at ice conditions do not have a liquid phase. There will for sure be some sort of interface between ice and hydrate, but conversion from CH4 hydrate to CO2 hydrate does not have much flexibility. It is understandable that experimental cells in atomistic imaging equipment cannot handle high pressures. It is therefore no surprise that hydrate exchange experiments at atmospheric conditions and very low temperatures [51] reveal a solid-state exchange mechanism. There is no liquid water and a totally different ice/hydrate interface as compared to the dynamic and broad (relative) hydrate/liquid water interface, and also a dynamic interface between liquid water and gas. I have been quite purposeful in not referring to experimental data, including our own data. Kvamme et al. [11] and Tegze et al. [12] are referred to in this work for interface details and modelling aspects. However, these references also contain information from experiments. A solid-state mechanism is a totally impossible explanation of our experiments over 15 years. These experiments were all conducted at liquid water conditions. An important element of Baig’s study [57] was to shed light on conversion mechanisms. The results revealed a fast conversion mechanism based on creation of new CO2 hydrate as long as free water was available. After the stage when all free water was consumed over to CO2 hydrate then a very slow solid state conversion mechanism was applied to the rest of the simulation period.
I have deliberately not examined any higher content of N2 than 20 mole% in a CO2/N2 mixture. Based on earlier studies [37] it is known that hydrate formation for CO2/N2 mixtures containing more than 25 mole% N2. However, it may not be thermodynamically feasible. I have demonstrated that the addition of both N2 (20 mole% in gas mixture) and ethanol up to 3 mole% (in local liquid water) reduces the available released heat from formation of a new hydrate from the injection gas. The reduction is, however, limited and will not affect the ability to dissociate in situ CH4 hydrate substantially.

9. Conclusions

Ethanol is an interesting surfactant for addition to CO2 and CO2/N2 mixtures. In this work I have examined the effect of ethanol on thermodynamic properties, and the ability for CO2/N2 mixtures to form a new hydrate with free pore water when injected in CH4 hydrate filled sediments. It is found that ethanol injection as part of CO2/N2 mixture is thermodynamically feasible for pure CO2 as well as CO2 with up to 20 mole% N2. The stability of the formed hydrate from the mixture with N2 (20 mole%) is significantly higher than stability of the CH4 hydrate. For injection of pure CO2, the released enthalpy of hydrate formation is between 8 and 10 kJ/mole guest higher than what is needed to dissociate CH4 hydrate. This potential is decreased by roughly 2 kJ/mole guest for the most unfavorable situation of 20 mole% N2 and 3 mole% ethanol in water. Homogeneous hydrate formation from CH4 and CO2 dissolved in water is thermodynamically feasible. The amount of hydrate that can be formed through this route is very limited. Released enthalpy is less than from heterogeneous hydrate formation from gas and liquid water. The hydrate stability limit towards surrounding water concentration of guest molecules, however, needs to be taken into consideration.

Funding

This research received no external funding.

Conflicts of Interest

The author declares no conflict of interest.

References

  1. Sloan, E.D.; Koh, C.A. Clathrate Hydrates of Natural Gases, 3rd ed.; CRC Press: Boca Raton, FL, USA, 2007. [Google Scholar]
  2. Mokogan, Y.F. Hydrates of Hydrocarbons, 1st ed.; PennWell Books: Tulsa, OK, USA, 1997; ISBN 978-0878147182. [Google Scholar]
  3. Kvamme, B.; Selvåg, J.; Aromada, S.A.; Saeidi, N.; Kuznetsova, T. Methanol as hydrate inhibitor and hydrate activator. Phys. Chem. Chem. Phys. 2018, 20, 21968–21987. [Google Scholar] [CrossRef]
  4. Austvik, T.; Hustvedt, E.; Gjertsen, L.H. Formation and Removal of Hydrate Plugs—Field Trial at Tommeliten. In Proceedings of the 76 Annual Meeting of the Gas Processors Association (GPA), San Antonio, TX, USA, 10–12 March 1997; p. 249. [Google Scholar]
  5. Kvamme, B. Enthalpies of Hydrate Formation from Hydrate Formers Dissolved in Water. Energies 2019, 12, 1039. [Google Scholar] [CrossRef] [Green Version]
  6. Kvamme, B.; Aromada, S.A.; Gjerstad, P.B. Consistent Enthalpies of the Hydrate Formation and Dissociation Using Residual Thermodynamics. J. Chem. Eng. Data 2019, 64, 3493–3504. [Google Scholar] [CrossRef]
  7. Aromada, S.A.; Kvamme, B.; Wei, N.; Saeidi, N. Enthalpies of Hydrate Formation and Dissociation from Residual Thermodynamics. Energies 2019, 12, 4726. [Google Scholar] [CrossRef] [Green Version]
  8. Kvamme, B. Consistent Thermodynamic Calculations for Hydrate Properties and Hydrate Phase Transitions. J. Chem. Eng. Data 2020, 65, 2872–2893. [Google Scholar] [CrossRef]
  9. Kvamme, B.; Zhao, J.; Wei, N.; Sun, W.; Zarifi, M.; Saeidi, N.; Zhou, S.; Kuznetsova, T.; Li, Q. Why Should We Use Residual Thermodynamics for Calculation of Hydrate Phase Transitions? Energies 2020, 13, 4135. [Google Scholar] [CrossRef]
  10. Kvamme, B. Thermodynamic properties and dielectric constants in water/methanol mixtures by integral equation theory and molecular dynamics simulations. Phys. Chem. Chem. Phys. 2002, 4, 942–948. [Google Scholar] [CrossRef]
  11. Kvamme, B.; Graue, A.; Buanes, T.; Kuznetsova, T.; Ersland, G. Storage of CO2 in natural gas hydrate reservoirs and the effect of hydrate as an extra sealing in cold aquifers. Int. J. Greenh. Gas Control 2007, 1, 236–246. [Google Scholar] [CrossRef]
  12. Tegze, G.; Pusztai, T.; Tóth, G.; Gránásy, L.; Svandal, A.; Buanes, T.; Kuznetsova, T.; Kvamme, B. Multiscale approach to CO2 hydrate formation in aqueous solution: Phase field theory and molecular dynamics. Nucleation and growth. J. Chem. Phys. 2006, 124, 234710. [Google Scholar] [CrossRef]
  13. Kvamme, B.; Coffin, R.B.; Zhao, J.; Wei, N.; Zhou, S.; Li, Q.; Saeidi, N.; Chien, Y.-C.; Dunn-Rankin, D.; Sun, W.; et al. Stages in the Dynamics of Hydrate Formation and Consequences for Design of Experiments for Hydrate Formation in Sediments. Energies 2019, 12, 3399. [Google Scholar] [CrossRef] [Green Version]
  14. Bybee, K. Natural Gas Technology/Monetization: Overview of the Mallik Gas-Hydrate Production Research Well. J. Pet. Technol. 2004, 56, 53–54. [Google Scholar] [CrossRef]
  15. Moridis, G.J.; Collett, T.S.; Dallimore, S.R.; Satoh, T.; Hancock, S.; Weatherill, B. Numerical studies of gas production from several CH4 hydrate zones at the Mallik site, Mackenzie Delta, Canada. J. Pet. Sci. Eng. 2004, 43, 219–238. [Google Scholar] [CrossRef] [Green Version]
  16. Konno, Y.; Fujii, T.; Sato, A.; Akamine, K.; Naiki, M.; Masuda, Y.; Yamamoto, K.; Nagao, J. Key Findings of the World’s First Offshore Methane Hydrate Production Test off the Coast of Japan: Toward Future Commercial Production. Energy Fuels 2017, 31, 2607–2616. [Google Scholar] [CrossRef]
  17. Yamamoto, K.; Wang, X.-X.; Tamaki, M.; Suzuki, K. The second offshore production of methane hydrate in the Nankai Trough and gas production behavior from a heterogeneous methane hydrate reservoir. RSC Adv. 2019, 9, 25987–26013. [Google Scholar] [CrossRef] [Green Version]
  18. Oyama, A.; Masutani, S.M. A Review of the Methane Hydrate Program in Japan. Energies 2017, 10, 1447. [Google Scholar] [CrossRef] [Green Version]
  19. Tenma, N. Recent Status of Methane Hydrate R&D Program in Japan. Presented at the 11th IMHRD, Corpus Christie, TX, USA, 7 December 2017. [Google Scholar]
  20. Svandal, A.; Kvamme, B.; Granasy, L.; Pusztai, T. The influence of diffusion on hydrate growth. In Proceedings of the 1st International Conference on Diffusion in Solids and Liquids DSL-2005, Aveiro, Portugal, 6–8 July 2005. [Google Scholar]
  21. Kvamme, B.; Kivelæ, P.-H.; Kuznetsova, T. Adsorption of water and carbon dioxide on hematite and consequences for possible hydrate formation. Phys. Chem. Chem. Phys. 2012, 14, 4410–4424. [Google Scholar] [CrossRef]
  22. Olsen, R.; Leirvik, K.; Kvamme, B.; Kuznetsova, T. A molecular dynamics study of triethylene glycol on a hydrated calcite surface. Langmuir 2015, 31, 8606–8617. [Google Scholar] [CrossRef] [PubMed]
  23. Olsen, R.; Kvamme, B. Effects of glycol on adsorption dynamics of idealized water droplets on LTA-3A zeolite surfaces. AIChE J. 2019, 65, e16567. [Google Scholar] [CrossRef]
  24. Olsen, R.; Leirvik, K.N.; Kvamme, B.; Kuznetsova, T. Effects of Sodium Chloride on Acidic Nanoscale Pores Between Steel and Cement. J. Phys. Chem. C 2016, 120, 29264–29271. [Google Scholar] [CrossRef]
  25. Olsen, R.; Leirvik, K.N.; Kvamme, B. Adsorption characteristics of glycols on calcite and hematite. AIChE J. 2019, 65, e16728. [Google Scholar] [CrossRef]
  26. Kvamme, B.; Zhao, J.; Wei, N.; Sun, W.; Saeidi, N.; Pei, J.; Kuznetsova, T. Hydrate Production Philosophy and Thermodynamic Calculations. Energies 2020, 13, 672. [Google Scholar] [CrossRef] [Green Version]
  27. Geissbühler, P.; Fenter, P.; DiMasi, E.; Srajer, G.; Sorensen, L.; Sturchio, N. Three-dimensional structure of the calcite–water interface by surface X-ray scattering. Surf. Sci. 2004, 573, 191–203. [Google Scholar] [CrossRef]
  28. Phan Van, C. Transport and Adsorption of CO2 and H2O on Calcite and Clathrate Hydrate. Ph.D. Thesis, University of Bergen, Bergen, Norway, 2012. [Google Scholar]
  29. Van Cuong, P.; Kvamme, B.; Kuznetsova, T.; Jensen, B. Adsorption of water and CO2 on calcite and clathrate hydrate: The effect of short-range forces and temperature. Int. J. Energy Env. 2012, 6, 301. [Google Scholar]
  30. Van Cuong, P.; Kvamme, B.; Kuznetsova, T.; Jensen, B. Molecular dynamics study of calcite, hydrate and the temperature effect on CO2 transport and adsorption stability in geological formations. Mol. Phys. 2012, 110, 1097–1106. [Google Scholar] [CrossRef]
  31. Van Cuong, P.; Kvamme, B.; Kuznetsova, T.; Jensen, B. Adsorption energy and stability of H2O and CO2 on calcite effect by short-range force field parameters and temperature. In Recent Researches in Applied Mathematics and Economics; WSEAS Press: Athens, Greece, 2012; pp. 66–72. ISBN 978-1-61804-076-3. [Google Scholar]
  32. Kuznetsova, T.; Jensen, B.; Kvamme, B.; Sjøblom, S. Water-wetting surfaces as hydrate promoters during transport of carbon dioxide with impurities. Phys. Chem. Chem. Phys. 2015, 17, 12683–12697. [Google Scholar] [CrossRef] [PubMed]
  33. Jensen, B. Investigations into the Impact of Solid Surfaces in Aqueous Systems. Ph.D. Thesis, University of Bergen, Bergen, Norway, 2016. [Google Scholar]
  34. Mohammad, N. Heterogeneous Hydrate Nucleation on Calcite {1014} and Kaolinite {001} Surfaces: A Molecular Dynamics Simulation Study. Master’s Thesis, University of Bergen, Bergen, Norway, 2016. [Google Scholar]
  35. Nesse Knarvik, A.B. Examination of Water and Methane Structuring at a Hematite Surface in the Presence of MEG. Master’s Thesis, Department of Physics and Technology, University of Bergen, Bergen, Norway, 2017. [Google Scholar]
  36. Austrheim, M.H. Evaluation of Methane and Water Structure at a Hematite Surface—A Hydrate Prevention Perspective. Master’s Thesis, Department of Physics and Technology, University of Bergen, Bergen, Norway, 2017. [Google Scholar]
  37. Kvamme, B. Thermodynamic Limitations of the CO2/N2 Mixture Injected into CH4 Hydrate in the Ignik Sikumi Field Trial. J. Chem. Eng. Data 2016, 61, 1280–1295. [Google Scholar] [CrossRef]
  38. Robinson, D.B.; Ng, H.-J. Hydrate Formation and Inhibition in Gas or Gas Condensate Streams. J. Can. Pet. Tech. 1986, 25, 26–30. [Google Scholar] [CrossRef]
  39. Ross, M.J.; Toczylkin, L.S. Hydrate Dissociation Pressures for Methane or Ethane in the Presence of Aqueous Solutions of Triethylene Glycol. J. Chem. Eng. Data 1992, 37, 488–491. [Google Scholar] [CrossRef]
  40. Kobayashi, R.; Withrow, H.J.; Williams, G.B.; Katz, D.L. Gas hydrate formation with brine and ethanol solutions. Proc. NGAA 1951, 27, 57–66. [Google Scholar]
  41. Ng, H.-J.; Robinson, D.B. Hydrate formation in systems containing methane, ethane, propane, carbon dioxide or hydrogen sulfide in the presence of methanol. Fluid Phase Equilibria 1985, 21, 145. [Google Scholar] [CrossRef]
  42. Sabil, K.M.; Nashed, O.; Lal, B.; Ismail, L.; Japper-Jaafar, A. Experimental investigation on the dissociation conditions of methane hydrate in the presence of imidazolium-based ionic liquids. Thermodyn. J. Chem. 2015, 84, 7–13. [Google Scholar]
  43. Tumba, K.; Tumba, P.; Reddy, P.; Naidoo, D.; Ramjugernath, A.; Eslamimanesh, A.; Mohammadi, H.; Richon, D. Phase equilibria of methane and carbon dioxide clathrate hydrates in the presence of aqueous solutions of tributylmethyl-phosphonium methylsulfate ionic liquid. J. Chem. Eng. Data 2011, 56, 3620–3629. [Google Scholar] [CrossRef]
  44. Kvamme, B.; Zhao, J.; Wei, N.; Saeidi, N. Hydrate—A Mysterious Phase or Just Misunderstood? Energies 2020, 13, 880. [Google Scholar] [CrossRef] [Green Version]
  45. Kvamme, B.; Zhao, J.; Wei, N.; Sun, W.; Zarifi, M.; Saeidi, N.; Zhou, S.; Kuznetsova, T.; Li, Q. Thermodynamics of hydrate systems using a uniform reference state. Asia-Pac. J. Chem. Eng. 2021, e2706. [Google Scholar] [CrossRef]
  46. Kvamme, B.; Tanaka, H. Thermodynamic Stability of Hydrates for Ethane, Ethylene, and Carbon Dioxide. J. Phys. Chem. 1995, 99, 7114–7119. [Google Scholar] [CrossRef]
  47. Van der Waals, J.H.; Platteeuw, J.C. Clathrate solutions. In Advances in Chemical Physics, 1st ed.; Prigogine, I., Ed.; John Wiley & Sons, Inc.: Hoboken, NJ, USA, 1958; pp. 1–57. [Google Scholar]
  48. Falenty, A.; Salamatin, A.N.; Kuhs, W.F. Kinetics of CO2-Hydrate Formation from Ice Powders: Data Summary and Modeling Extended to Low Temperatures. J. Phys. Chem. C 2013, 117, 8443–8457. [Google Scholar] [CrossRef]
  49. Salamatin, A.N.; Falenty, A.; Hansen, T.C.; Kuhs, W.F. Guest Migration Revealed in CO2 Clathrate Hydrates. Energy Fuels 2015, 29, 5681–5691. [Google Scholar] [CrossRef]
  50. Falenty, A.; Genov, G.; Hansen, T.C.; Kuhs, W.F.; Salamatin, A.N. Kinetics of CO2 Hydrate Formation from Water Frost at Low Temperatures: Experimental Results and Theoretical Model. J. Phys. Chem. C 2011, 115, 4022–4032. [Google Scholar] [CrossRef]
  51. Lee, H.; Seo, Y.; Seo, Y.-T.; Moudrakovski, I.L.; Ripmeester, J.A. Recovering Methane from Solid Methane Hydrate with Carbon Dioxide. Angew. Chem. 2003, 115, 5202–5205. [Google Scholar] [CrossRef]
  52. Soave, G. Equilibrium constants from a modified Redlich-Kwong equation of state. Chem. Eng. Sci. 1972, 27, 1197–1203. [Google Scholar] [CrossRef]
  53. Kvamme, B.; Lund, A.; Hertzberg, T. The influence of gas-gas interactions on the Langmuir constants for some natural gas hydrates. Fluid Phase Equilibria 1993, 90, 15–44. [Google Scholar] [CrossRef]
  54. Kvamme, B.; Førrisdahl, O.K. Polar guest-molecules in natural gas hydrates. Fluid Phase Equilibria 1993, 83, 427–435. [Google Scholar] [CrossRef]
  55. Selvåg, J.; Kuznetsova, T.; Kvamme, B. Molecular dynamics study of surfactant-modified water–carbon dioxide systems. Mol. Simul. 2017, 44, 128–136. [Google Scholar] [CrossRef]
  56. Selvåg, J. Molecular simulations for surfactants at aqueous-nonpolar liquid interfaces. Ph.D. Thesis, University of Bergen, Bergen, Norway, May 2021. [Google Scholar]
  57. Baig, K. Nano to Micro Scale Modeling of Hydrate Phase Transition Kinetics. Ph.D. Thesis, University of Bergen, Bergen, Norway, 2017. [Google Scholar]
Figure 1. (a) Temperature pressure stability limits for CH4 hydrate formed from CH4 and water containing MEG (circles are experimental data [38] and solid curves are calculated) or TEG (squares are experimental data [39] and dashed curves are calculated). Blue curves and circles are for 10 wt% MEG in water. Red circles and curve are for 30 wt% MEG. Green squares and dashed curve are for 10 wt% TEG. Red squares and dashed curve are for 20 wt% TEG and blue squares and dashed curve are for 40 wt% TEG. (b) Gibbs free energy for hydrates formed along the stability curves in Figure 1a. Same line notations as in Figure 1a.
Fluids 06 00345 g001
Figure 2. (a) Temperature pressure stability limits for CH4 hydrate formed from CH4 and water containing ethanol (circles are experimental data [40] and solid curves are calculated) and methanol (squares are experimental data [41] and dashed curves are calculated). Blue circles and solid blue curves are for 15 wt% ethanol. Green squares and dashed curve are for 10 wt% methanol. Dashed blue is for 15 wt% methanol. Red squares and dashed are for 20 wt% methanol. Solid black curve is calculated data for pure water. Crosses are experimental data from Sabil et al. [42] and plusses are experimental data from Tumba et al. [43]. (b) Gibbs free energy for hydrates formed from CH4 and water containing various concentrations of ethanol and methanol. Same notations as in Figure 2a.
Fluids 06 00345 g002
Figure 3. (a) Temperature pressure stability limits for CO2 hydrate formed from CO2 and water containing ethanol. Black curve is for 0 mole-fraction ethanol, green is for 0.015 mole-fraction ethanol, blue is for 0.02 mole-fraction ethanol, and red is for 0.03 mole-fraction ethanol. (b) Gibbs free energy for hydrates formed from CO2 and water containing various concentrations of ethanol. The color codes are the same as in Figure 3a.
Fluids 06 00345 g003
Figure 4. (a) Mole-fraction CO2 in CO2 hydrate formed from CO2 and water containing ethanol. Black curve is for 0 mole-fraction ethanol, green curve is for 0.015 mole-fraction ethanol, blue curve is for 0.02 mole-fraction ethanol, and red curve is for 0.03 mole-fraction ethanol. (b) Chemical potential for CO2 in CO2 hydrate formed from CO2 and water containing various concentrations of ethanol. Color codes are the same as in Figure 4a.
Fluids 06 00345 g004
Figure 5. (a) Temperature pressure stability limits for mixed CO2/N2 hydrate formed from a CO2/N2 mixture with 20 mole percent N2 and water containing ethanol. Black curve is for 0 mole-fraction ethanol, green curve is for 0.015 mole-fraction ethanol, blue curve is for 0.02 mole-fraction ethanol, and red curve is for 0.03 mole-fraction ethanol. (b) Gibbs free energy for hydrates formed from a CO2/N2 mixture with 20 mole percent N2 and water containing various concentrations of ethanol. The color notation is the same as in Figure 5a.
Fluids 06 00345 g005
Figure 6. (a) Hydrate composition in mixed CO2/N2 hydrate formed from a CO2/N2 mixture containing 20 mole percent N2 and water containing ethanol. Dashed curves are N2 and solid curves are CO2. Black curves are for 0 mole-fraction ethanol, green curves are for 0.015 mole-fraction ethanol, blue curves are for 0.02 mole-fraction ethanol, and red curves are for 0.03 mole-fraction ethanol. (b) Chemical potentials for CO2 (solid) and N2 (dashed curves) in hydrates formed from a CO2/N2 mixture with 20 mole percent N2 and water containing various concentrations of ethanol. Color codes are the same as in Figure 6a.
Fluids 06 00345 g006
Figure 7. (a) Enthalpy of hydrate formation per mole hydrate as function of temperature and mole-fraction ethanol in water for pure CO2 hydrate. The lowest curve is for no ethanol in water, then 0.015 mole-fraction ethanol in water, then 0.02 mole-fraction ethanol in water, and upper curve 0.03 mole-fraction ethanol in water. (b) Enthalpy of hydrate formation per mole guest in hydrate as function of temperature and mole-fraction ethanol in water for pure CO2 hydrate. The lowest curve is for no ethanol in water, then 0.015 mole-fraction ethanol in water, then 0.02 mole-fraction ethanol in water, and upper curve 0.03 mole-fraction ethanol in water. (c) Enthalpy of hydrate formation per mole hydrate as function of temperature and mole-fraction ethanol in water for hydrate formed from 20 mole percent N2 in CO2. The lowest curve is for no ethanol in water, then 0.015 mole-fraction ethanol in water, then 0.02 mole-fraction ethanol in water, and upper curve 0.03 mole-fraction ethanol in water. (d) Enthalpy of hydrate formation per mole guest in hydrate as function of temperature and mole-fraction ethanol in water for hydrate formed from 20 mole percent N2 in CO2. The lowest curve is for no ethanol in water, then 0.015 mole-fraction ethanol in water, then 0.02 mole-fraction ethanol in water, and upper curve 0.03 mole-fraction ethanol in water.
Fluids 06 00345 g007
Figure 8. (a) Enthalpy of hydrate formation per mole hydrate and (b) enthalpy of hydrate formation per mole guest. Both figures are plotted as function of ethanol concentration in water. Dashed curves are for CH4 hydrates formed from water with various mole-fractions ethanol in water. Solid curves are for hydrates formed from CO2 with 20 mole% N2. Lowest curves are for no ethanol, then 0.015 mole-fraction ethanol in water, then 0.02 mole-fraction ethanol in water, and upper curves for 0.03 mole-fraction ethanol in water.
Fluids 06 00345 g008
Figure 9. Liquid water solubility and hydrate stability limit mole-fractions of hydrate for various mole-fractions of ethanol. (a) Solubility for 0 ethanol, (b) hydrate stability limit for 0 ethanol, (c) solubility for 0.015 mole-fraction ethanol in water, (d) hydrate stability limit for 0.015 mole-fraction ethanol in water, (e) solubility for 0.02 mole-fraction ethanol in water, (f) hydrate stability limit for 0.02 mole-fraction ethanol in water, (g) solubility for 0.03 mole-fraction ethanol in water, and (h) hydrate stability limit for 0.03 mole-fraction ethanol in water.
Fluids 06 00345 g009aFluids 06 00345 g009b
Figure 10. Chemical potential of CH4 entering hydrate as function of temperature pressure and mole-fractions CH4 (see Figure 10) for: (a) 0 ethanol and (b) 3 mole percent ethanol in water.
Fluids 06 00345 g010
Figure 11. Gibbs free energy for homogeneously formed CH4 hydrate as function of temperature pressure and mole-fractions CH4 (see Figure 10) for: (a) 0 ethanol and (b) 3 mole percent ethanol in water.
Fluids 06 00345 g011
Figure 12. Enthalpies for hydrate formation (vertical axis) from dissolved methane at two conditions. (a) Temperature 273.16 K and pressure 200 bar. Black solid curve is for pure water and CH4. CH4 solubility mole-fraction in water is 4.42 × 10⁻³ and hydrate stability limit is 8.40 × 10⁻⁴. Solid blue curve is for 3 mole percent ethanol. CH4 solubility mole-fraction in water is 4.42 × 10⁻³ and hydrate stability limit is 9.90 × 10⁻⁴. Dashed curve is for 3 mole percent methanol. CH4 solubility mole-fraction in water is 4.42 × 10⁻³ and hydrate stability limit is 1.12 × 10⁻³. (b) Temperature 276 K and pressure 300 bar. Black solid curve is for pure water and CH4. CH4 solubility mole-fraction in water is 4.42 × 10⁻³ and hydrate stability limit is 1.02 × 10⁻³. Solid blue curve is for 3 mole percent ethanol. CH4 solubility mole-fraction in water is 4.92 × 10⁻³ and hydrate stability limit is 1.16 × 10⁻³. Dashed curve is for 3 mole percent methanol. CH4 solubility mole-fraction in water is 4.92 × 10⁻³ and hydrate stability limit is 1.31 × 10⁻³.
Fluids 06 00345 g012
Figure 13. Pure water solubility for CO2 and hydrate stability limits for CO2. (a) Solubility of CO2 in water for the range of hydrate forming conditions. (b) Hydrate stability limit concentrations for CO2.
Fluids 06 00345 g013
Figure 14. Solubility of CO2 in water containing 3 mole percent ethanol and hydrate stability limits for CO2. (a) Solubility of CO2 in water for the range of hydrate forming conditions. (b) Hydrate stability limit concentrations for CO2.
Fluids 06 00345 g014
Figure 15. Hydrate growth potential in terms of mole-fraction, from solubility down to hydrate stability limit (z-axis), as function of solubility mole-fraction (x-axis) and temperature (y-axis) and pressure. For each temperature on the temperature axis, solubilities and growth potentials are calculated for pressures from 90 bar to 300 bar This is reflected in the increased solubility along the x-axis. (a) Pure water and (b) 3 mole% ethanol in water.
Fluids 06 00345 g015
Figure 16. Hydrate Gibbs free energy for hydrate formed heterogeneously from CO2 and liquid water (solid) and homogeneously formed hydrate from dissolved CO2 in water (dashed). (a) Pure water. (b) Water containing 3 mole percent ethanol.
Fluids 06 00345 g016
Figure 17. Enthalpy of hydrate formation from dissolved CO2 in water. (a) Temperature 274 K and pressure 100 bar. Solid curve is for pure water and dashed curve is for water containing 3 mole percent ethanol. (b) Temperature 280 K and pressure 180 bar. Solid curve is for pure water and dashed curve is for water containing 3 mole percent ethanol.
Fluids 06 00345 g017
Table 1. Model and parameters for water activity coefficients for Equation (1).
akMethanolEthanol
c0c1c2c0c1c2
a00.748210.52077−0.599360.737430.51369−0.58176
a10.54174−0.473880.547210.53390−0.459960.53981
a2−0.538590.56767−0.52552−0.522770.55995−0.51009
a30.35068−0.531170.373240.34566−0.515580.36817
akEthylene Glycol (MEG)Triethylene Glycol (TEG)
c0c1c2c0c1c2
a00.590060.44750−0.498970.104730.19307−0.12389
a10.47286−0.394990.477830.154960.17274−0.15457
a2−0.448920.49855−0.438040.087700.087310.11456
a30.37487−0.448590.368000.379470.80576−0.82038
akGlycerolNaCl
c0c1c2c0c1c2
a00.104530.080030.350940.144860.150790.26256
a1−0.001510.322000.212190.09071−0. 09709−0.63019
a20.049880.049650.005150.13827−0.281710.57169
a30.441520.56533−1.254190.130531.11504−0.55605
Table 2. Activity model for CH4 dissolved in water.
ia0a1
11.3606083.796962
30.033630−0.703216
50.656974−12.441339
71.763890−21.119318
95.337858−33.298760
11−0.02475012.387276
1348.35380817.261174
15−11.58019216.384626
17−0.08729513.171333
19−0.55879313.556732
21−23.75302016.573197
23−10.12867513.591099
25−41.2121785.060082
27−31.27986831.289978
29−23.85541831.720767
31−35.12590737.064849
33−33.67511041.544360
35−27.02728557.609882
37−19.02678654.961702
39−37.87225257.204781
Table 3. Parameters for Equation (26).
ia0a1
1−139.137483−138.899061
3−76.549658−72.397006
5−20.868725−14.715982
718.03098724.548835
944.21043352.904238
1163.35303771.596515
1374.71327882.605791
1580.41117588.536302
1782.71057590.262518
1982.01733289.094887
2179.37313785.956670
2375.42991081.519167
2570.68093276.270320
2765.49078570.551406
2960.12669864.683147
3154.78242158.865478
3349.59299853.235844
3544.50000147.728622
3739.86999042.730831
3935.59748838.125674
Publisher’s Note: MDPI stays neutral with regard to jurisdictional claims in published maps and institutional affiliations.

