Abstract
Working fluids possess several applications in manufacturing processes, for instance lubricants in metals machining. Typical metal working fluids are formulated as oil-in-water emulsions. The maintenance of the physical stability of the working fluid during operation is a key factor for the sustainability of the relevant process. Therefore, continuous control of the working fluids stability and performance during machine operation is an essential tool for maintenance of the process performance. Turbidity measurement (TM) is a process technique for emulsion stability and quality assessment, where light transmission and absorption of an emulsion system is analyzed. However, for in-process measurement and fluid quality detection during the machine operation by TM, it is necessary to implement a transmission inline sensor into the working fluid flow line. The continuous flow measurement may cause problems for long-term sensor operation regarding, e.g., biofouling of the sensor optical glasses or erroneous measurements due to emulsion droplets segregation effects. In the present investigation, computational fluid dynamic (CFD) simulations have been adapted to obtain the emulsion flow conditions within a typical TM sensor probe, thereby allowing an assessment of the adhesion probability of microorganisms as well as droplet segregation effects. The simulation results indicate some temporal changes of the dispersed phase concentration in the detected emulsion flow. Due to droplet segregation in the emulsion, the flow velocity needs to exceed a certain value for reliable operation. It is shown here that in this flow regime microbiological attachments on the probe surfaces may be sufficiently avoided. A minimum critical flow velocity is derived to avoid biomolecule adhesion and thus durable operation of the sensor.
1. Introduction
Emulsions as dispersed multiphase systems are used as metal working fluids (MWFs) in material processing operations for lubrication and heat removal purposes [1]. For a typical oil-in-water formulation of an MWF emulsion, the dispersed oil concentration amounts to 2–10 v/v% where the droplets have mean sizes of 0.1–2.0 µm [2]. MWF typically consist of different (mineral) oil mixtures and chemical additives to stabilize the emulsion, inhibit corrosion, kill bacteria via biocides, and avoid foam formation. These ingredients increase the performance of the MWF. The use of MWF in machining operation decreases mechanical stresses caused by shearing and friction in the contact zone between the tool and work piece. MWF further washes away chips and fines from the nascent metal surface. This way, rewelding of the newly formed surface is a preventative measure and the wetted surface is protected [3]. MWF operation cycles within machining processes may last over several weeks and months. Due to metal working machining operation stresses, the MWF composition and morphology may change with time, resulting, e.g., in increased mean droplet size and broader droplet size distributions (DSDs), which may impact the MWF performance and, therefore, the machine operation efficiency and sustainability ([1,4]).
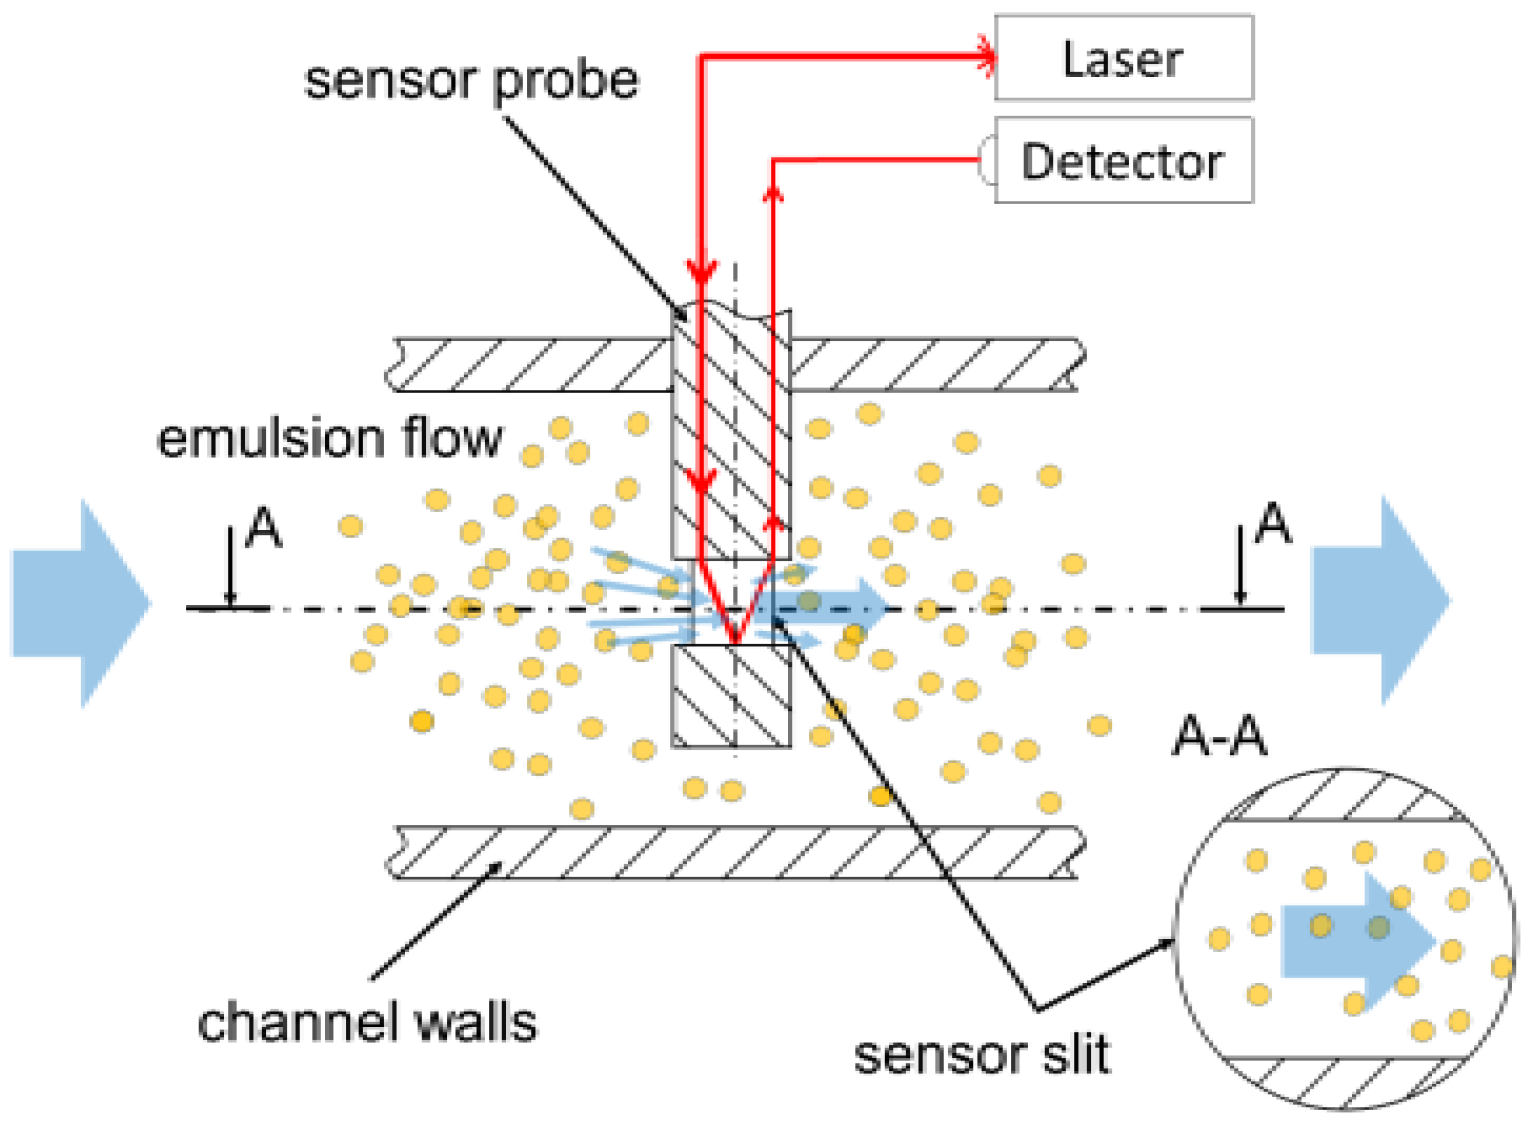
In-situ and in-process emulsion quality measurements are to be applied for monitoring the change of the physical stability of the working fluid, where turbidimetry measurements (TM) has recently been successfully applied in different emulsion systems ([5,6,7]). The turbidity spectrum of a MWF emulsion is influenced by the chemical composition, droplet size (distribution), internal structure, and concentration of the dispersed phase ([5,8]). Measurement of the turbidity of an emulsion system requires contacting the fluid flow and optical access to the fluid. Therefore, during machine operation, sensor probes need to be dipped into the stream of the flowing MWF emulsion. The optical path through the liquid necessary for the measurement principle may be realized by an internal reflection arrangement. Thereby, the emulsion flows through a small channel within the sensor probe where a focused light beam passes the stream twice, forward and backward (see Figure 1).

Figure 1.
Measurement arrangement of inline light transmission sensor probe with cylindrical shaft in a flow channel of machining process.
Typical flow velocities of an MWF inside pumping lines of metal working machines are in the range [9]. Segregation effects for the different emulsion droplet sizes for flow around the sensor probe may impact the measurement performance and hence need to be evaluated. Additionally, due to microorganisms in the water-based emulsion, biological films inside the probe that will interfere with the measurement may form. To avoid adhesion of microorganisms to sensor surfaces, it has been shown that minimum wall shear stresses τwall > 3–10 Pa are necessary ([10,11]), where wall shear stress levels τwall > 20–100 Pa are found to even completely remove existing bio-films from surfaces ([12]). Thus, in the present investigation, the multiphase emulsion flow of a working fluid around a TM sensor probe will be analyzed for the derivation of flow regimes of sustainable process conditions.
2. Multiphase Flow Analysis
Multiphase computational fluid dynamic (M-CFD) simulations are utilized to evaluate the flow patterns within and around typical sensor probes used in turbidity measurements with a rectangular slit channel as shown in Figure 1 [7]. Multiphase flow around cylindrical objects has already been intensively investigated ([13,14]). Liquid droplets tend to segregate in regions with low fluid velocities, leading to an increased local droplet concentration which may cause a decrease of the physical stability of the droplets [15].
For low Reynolds numbers (Re = 5–40), recirculating vortices may arise downstream of a cylinder. As the Reynolds number increases (Re > 40–350), these eddies periodically detach from the rear surface of the cylinder, carrying the droplets away from the probe [16]. The authors of [17] have shown that, for low Stokes numbers
the droplets will recirculate behind the cylinder and then entrain to the wall. At higher Stokes numbers, this effect vanishes. In this paper, simulations were carried out assuming various mean-sized monodispersed droplets (no distribution). Typical droplet sizes of metalworking fluid emulsions for machine operation are in the order of 100 nm for fresh mixed emulsions up to several microns for aged fluids [18]. This leads to Stokes numbers in the order of for minimal droplet size and inlet velocity to in the case of maximal droplet size and velocity, thus at minimum three orders of magnitude less than unity.
2.1. Measurement Facilities
The numerical flow simulation results are evaluated by experiments in a test flow channel and a typical metal working machine. The fluid velocity in the flow channel varied between 0.04 m/s and 2.5 m/s and in the metal working machine between ; therefore, the range of Reynolds numbers investigated is 260–22,750. The emulsion concentration was varied in the range of 1–10 v/v% in the flow channel, whereas the concentration in the machine was constant at . The MWF under investigation is a commercial emulsion system with a narrow mono-modal droplet size distribution and a mean droplet diameter of .
2.2. Numerical Model of Multiphase Flow
The Eulerian–Eulerian approach has been utilized for the numerical investigation of the multiphase flow around the turbidity sensor, where continuous and dispersed phases are both treated by solving separate momentum, mass, and continuity equations. The governing conservation equations are numerically closed with the Reynolds averaged Navier–Stokes method (RANS). The non-conservative form of the momentum equation in an incompressible two-component multiphase flow [19] is used as
where is the phase fraction, is the velocity, p is the pressure, is the gravity constant, is the combined Reynolds and viscous stress, and includes all momentum source terms ([20,21]). The combined turbulent stress and viscous stress equal the effective viscosity . As shown by [22], the viscosity of emulsions can change significantly, especially for nanodroplets smaller than ca. 200 nm and high volumetric fractions. In the present case, however, since the simulations were carried out for droplets with mean sizes of 0.1–10.0 μm, and a volumetric fraction of 0.05, which results in a relatively small interaction area between dispersed and continuous phases, the emulsion viscosity was assumed to be constant. This assumption is consistent with the observed experimental values, and predictions by emulsion viscosity models [22]. Furthermore, the Eulerian–Eulerian model approach is a two-fluid model and is based on the individual properties of each fluid. Therefore, the viscosity of the emulsion is not pertinent to the model. The ratio of viscosities is not pertinent, either. As the turbulent viscosity also depends on the phase fraction, the equation can be solved using an empirical correlation, e.g., by using a turbulent dispersion response coefficient . This approach for a turbulent flow description is governed by the fact that the discrete phase turbulent momentum fluxes are directly linked to their continuous phase counterparts [20]. This leads to an equation for the dispersed phase:
where the indices p and c correspond to the particulate dispersed and continuous phase, respectively. The value for the response coefficient is usually set to a constant value of 1, which is adequate for phase fractions above approximately 5% according to [23]. Note that this way particle turbulent dispersion is modeled while turbophoresis is neglected. The continuity equation
is applied to fulfill the assumption of an incompressible flow. Three main forces act on the dispersed droplets and define the source term for the momentum transfer
where V is the cell volume. The drag , lift and virtual mass force are derived from empirical correlations and theoretical models [24]. The drag force depends on the relative velocity and the shape of the particle, given by its area towards the flow A and its drag coefficient . Multiple correlations identify the value of the coefficient as a function of the Reynolds number.
The standard model for rigid spherical particles
is an expanded version of the derivation by [25] to ensure the correct limiting behavior in the inertial regime and valid for small emulsion particles with dp < 10 μm in liquid/liquid flows as Rep < 30, Eo < O(10−3) and μp/μc >> 1 [26]. In addition, the emulsifier builds a layer around the droplets, thus preventing internal circulation and, therefore, changes in CD. The swarm influence may be neglected for volume concentrations below 10 v/v%.
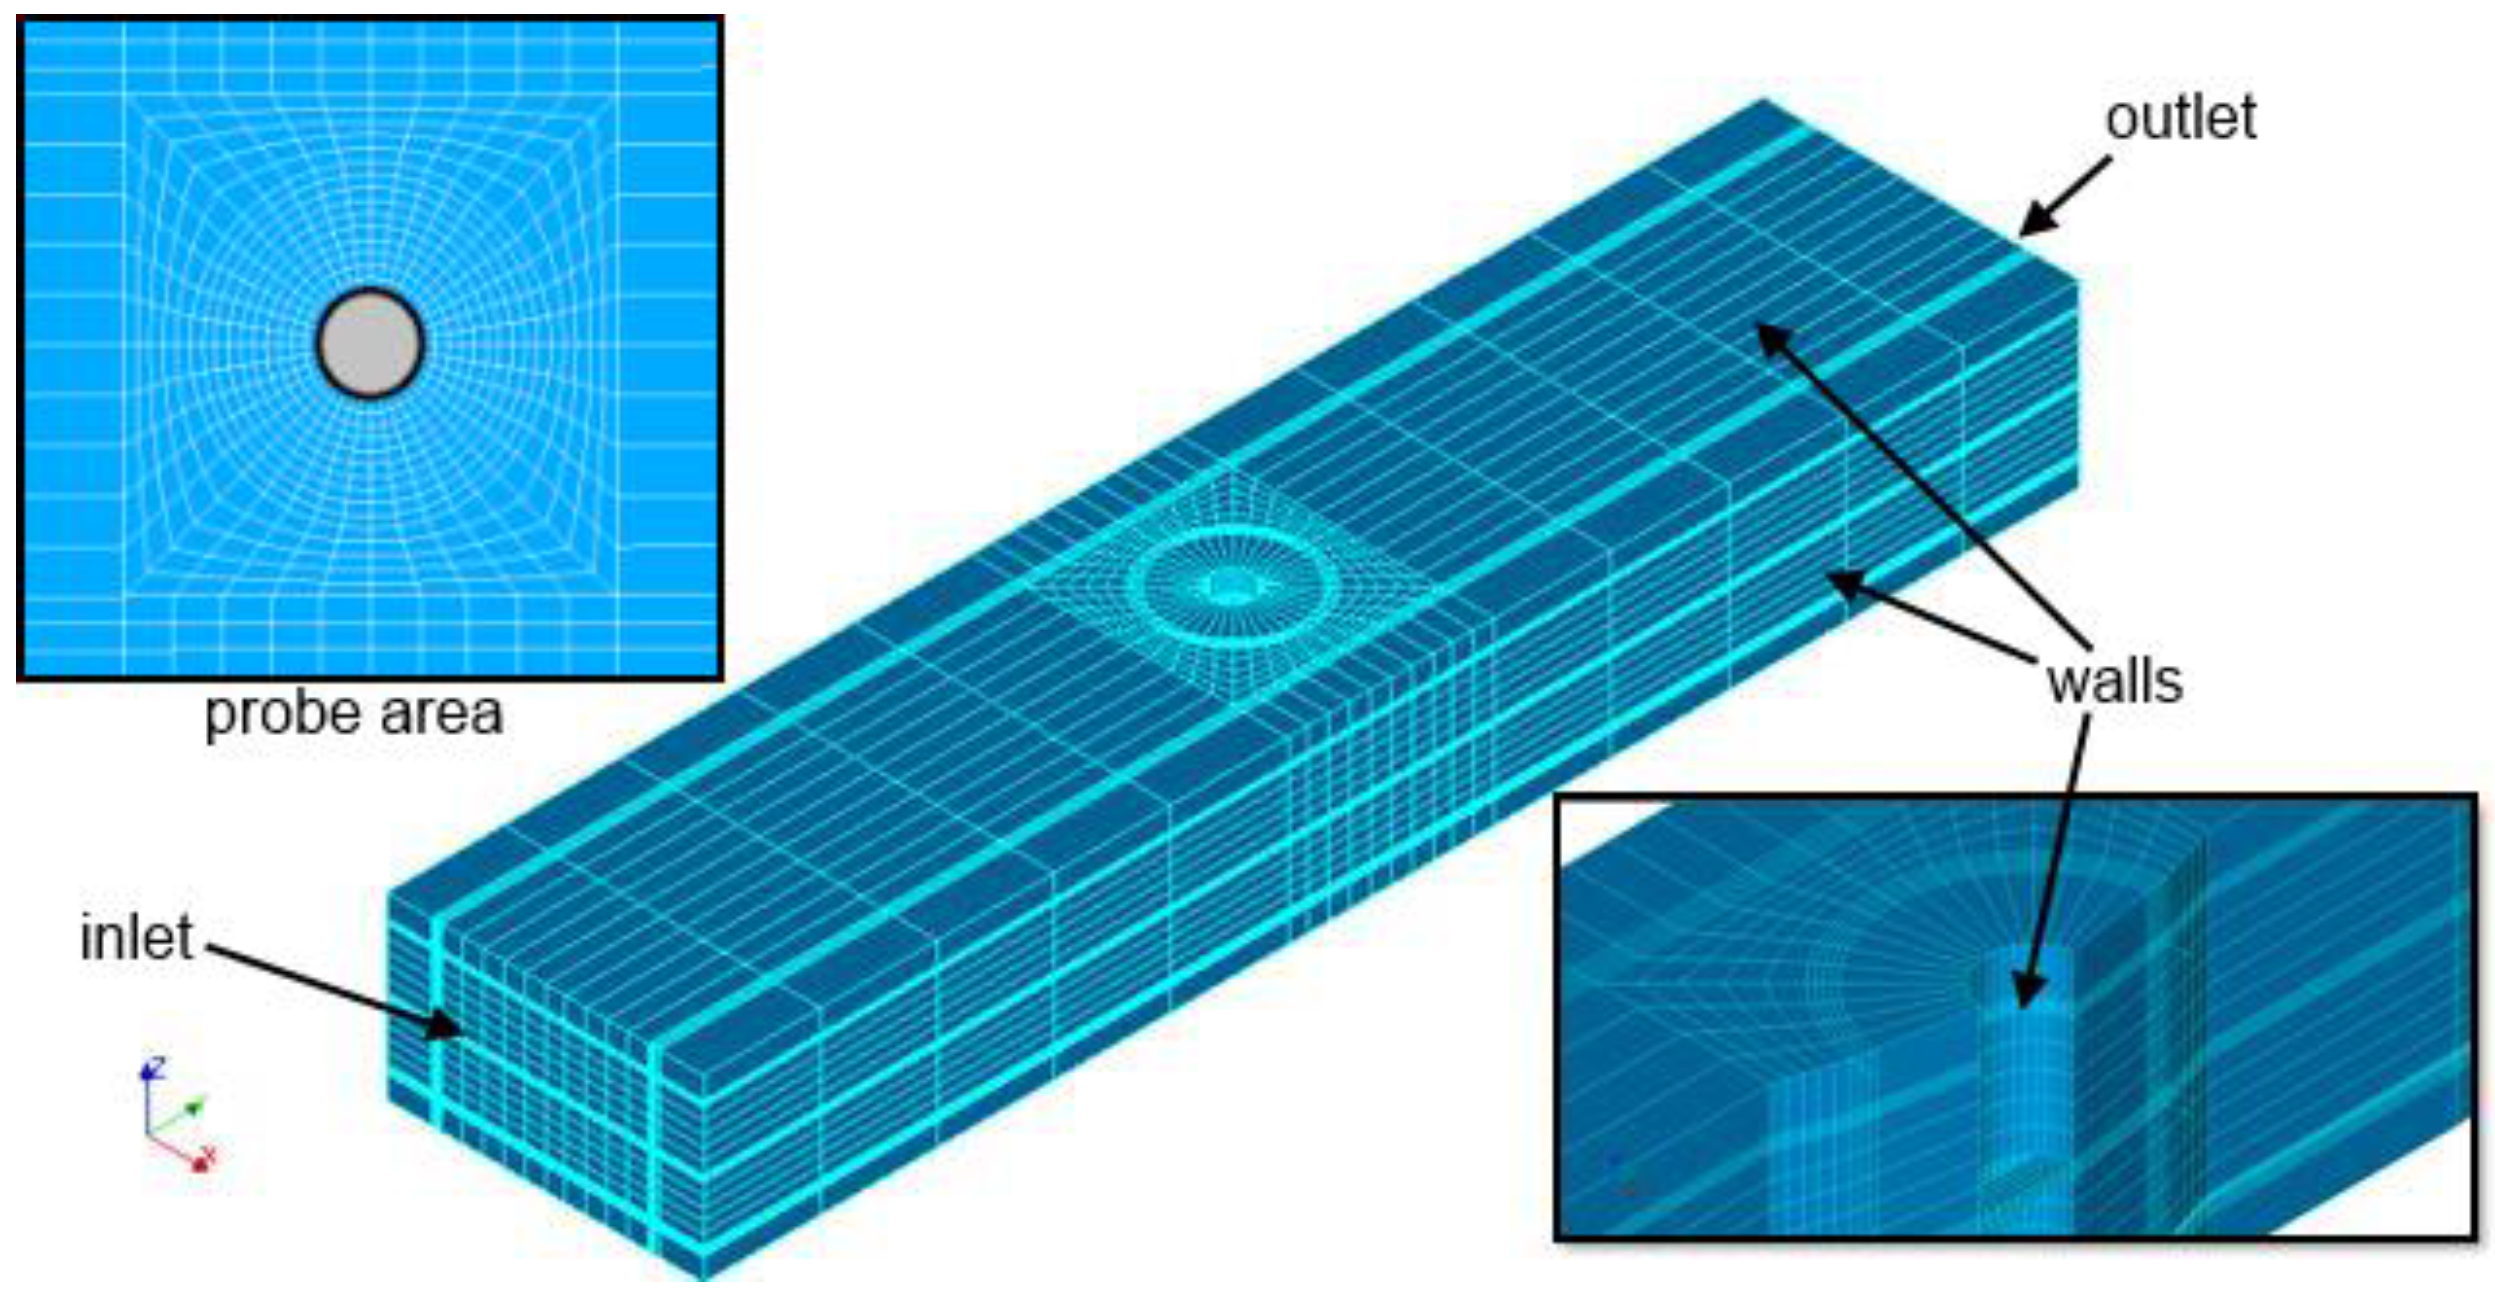
M-CFD simulations were carried out with the OpenFOAM [27] 2.1.0 solver “twoPhaseEulerFoam” using a hexahedron structured mesh as shown in Figure 2. The region around the cylindrical probe is refined by generating an o-grid type mesh structure that allows perpendicular cell adjustment towards the probe walls (compare Figure 2, left, top). Hence, numerical diffusion can be minimized, and convergence and mesh performance are improved. The first grid point wall distance is a critical factor due to the small dimension of the measurement slit in the probe and varied depending on the flow speed. Low distance correlation [28] was utilized, where the y+ wall distance is kept between 1 and 4 for the k-ω-model. The grid structure has been checked for proper resolution and grid size dependency. The mesh is validated regarding to the dispersed mass flow through the slit and the pressure drop. A mesh with about 850 thousand hexahedron cells finally is used that offers reasonable computational times while deviating less than 10% from the results obtained when using 1.8 million cells.

Figure 2.
Setup of the sensor probe arrangement and display of the main features of the mesh.
The physical properties of the dispersed phase (oil) were taken from [29] (a) and (b) and the continuous phase was water. The flow inlet into the channel is characterized by a plug flow with a uniform velocity, a constant particle concentration, and a zero pressure gradient, whereas velocity and concentration at the outlet are represented by zero gradient boundary conditions.
3. Results and Discussion
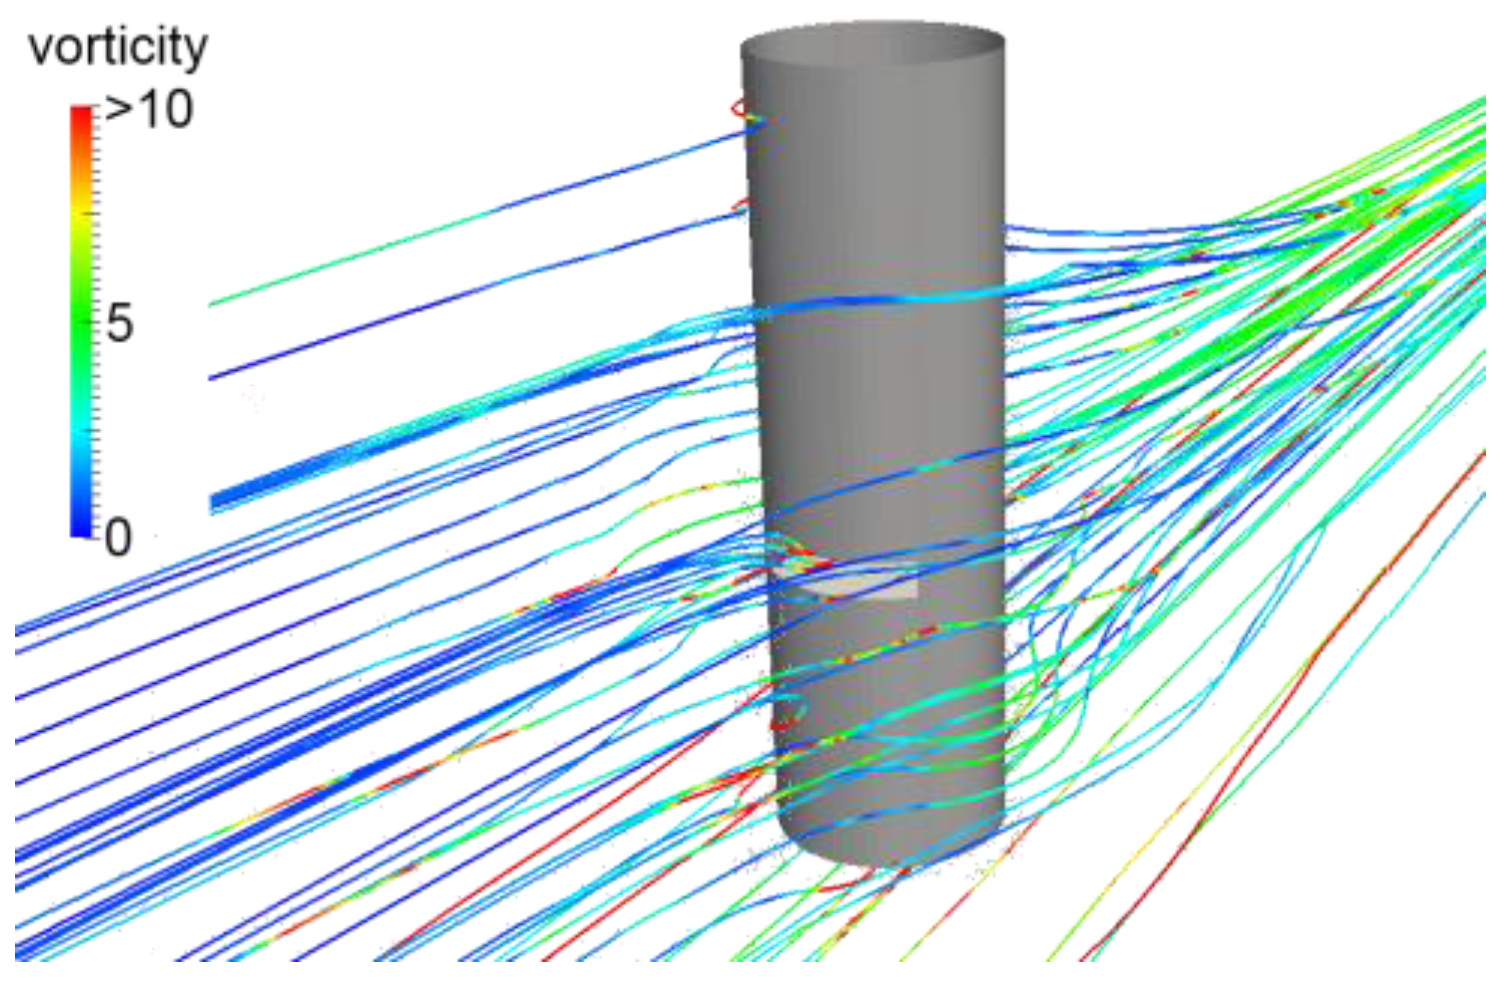
Figure 3 illustrates the time averaged mean flow field approaching the probe and through the slit channel in the probe by streamlines. The splitting behavior of the flow is obvious. The flow around the cylinder dominates the flow structure and subsequently that behind the small slit. The emulsion is partly sucked into the slit and around the probe.
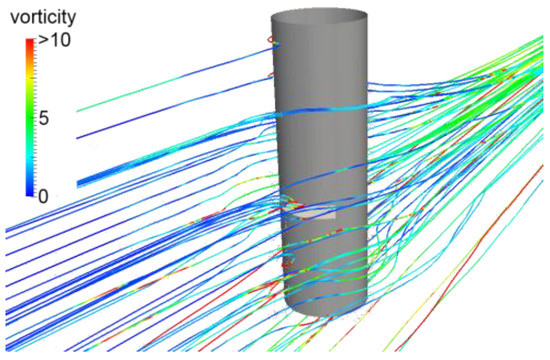
Figure 3.
Streamlines around the sensor probe.
Thus, high gradients occur at the slit inlet and the velocity pattern is close to a block profile. This pattern cannot develop over the probe slit length of 4.5 mm, resulting in a high velocity gradient throughout the entire slit. Due to vortex shedding in the flow field behind the cylinder, the mean droplet volume fraction inside the sensor slit obtains a time-dependent behavior with a variation of about .
Figure 4 illustrates a certain droplet concentration fluctuation in the probe channel for a free stream velocity of 0.03 m/s (). The droplet concentration in the initial phase converges and develops into a time-dependent state for to be described by a sinusoidal function. The cylinder of the probe defines the droplet movement because of the detaching eddies. This temporal effect correlates with the Strouhal number
where the frequency f of drop concentration fluctuations is derived from the simulation with the characteristic length L as the diameter of the cylinder. The calculated Strouhal number for the concentration fluctuation is related to the Strouhal number of a cylinder for the onset of the vortex shedding process at a Reynolds number 140–260 [17].
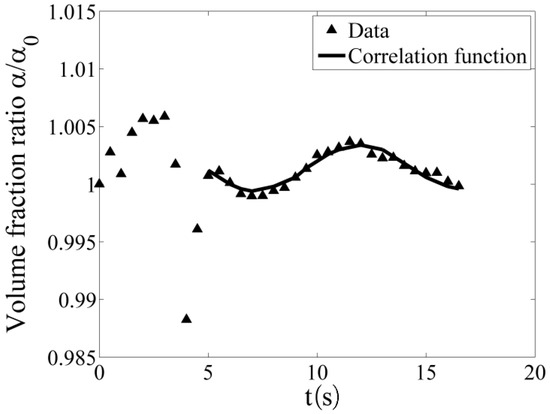
Figure 4.
Time-dependent droplet concentration inside the sensor probe slit for a droplet size of 150 nm.
The normalized time and volume averaged droplet concentration in the probe slit for various mean droplet sizes in the range 0.1–10 µm are illustrated in Figure 5. For each mean droplet size, a separate simulation run has been performed. An increase of the mean droplet concentration with increasing droplet size is found with a maximum of the concentration variations for .
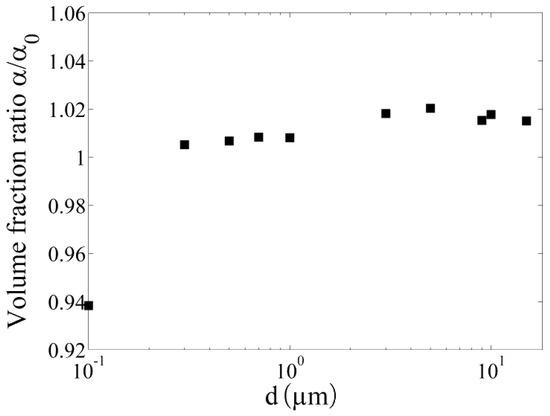
Figure 5.
Dependency of the droplet concentration in the sensor probe slit on the droplet size.
During continuous MWF operation not only bacteria, but also fungi and yeast may appear that affects the machine operation and performance as well as the measurement reliability and accuracy [30]. Even though in MWF operation the settling of monocultures of microorganisms is reported [12], their influence on each other is scarcely evaluated. Hence, microbes can act differently under certain circumstances while travelling through the sensor probe slit. Various types of microbes yield critical shear stress values to overcome adhesion ([10,11,31]). Thus, the criteria of minimum wall shear stress can predict contamination of surfaces.
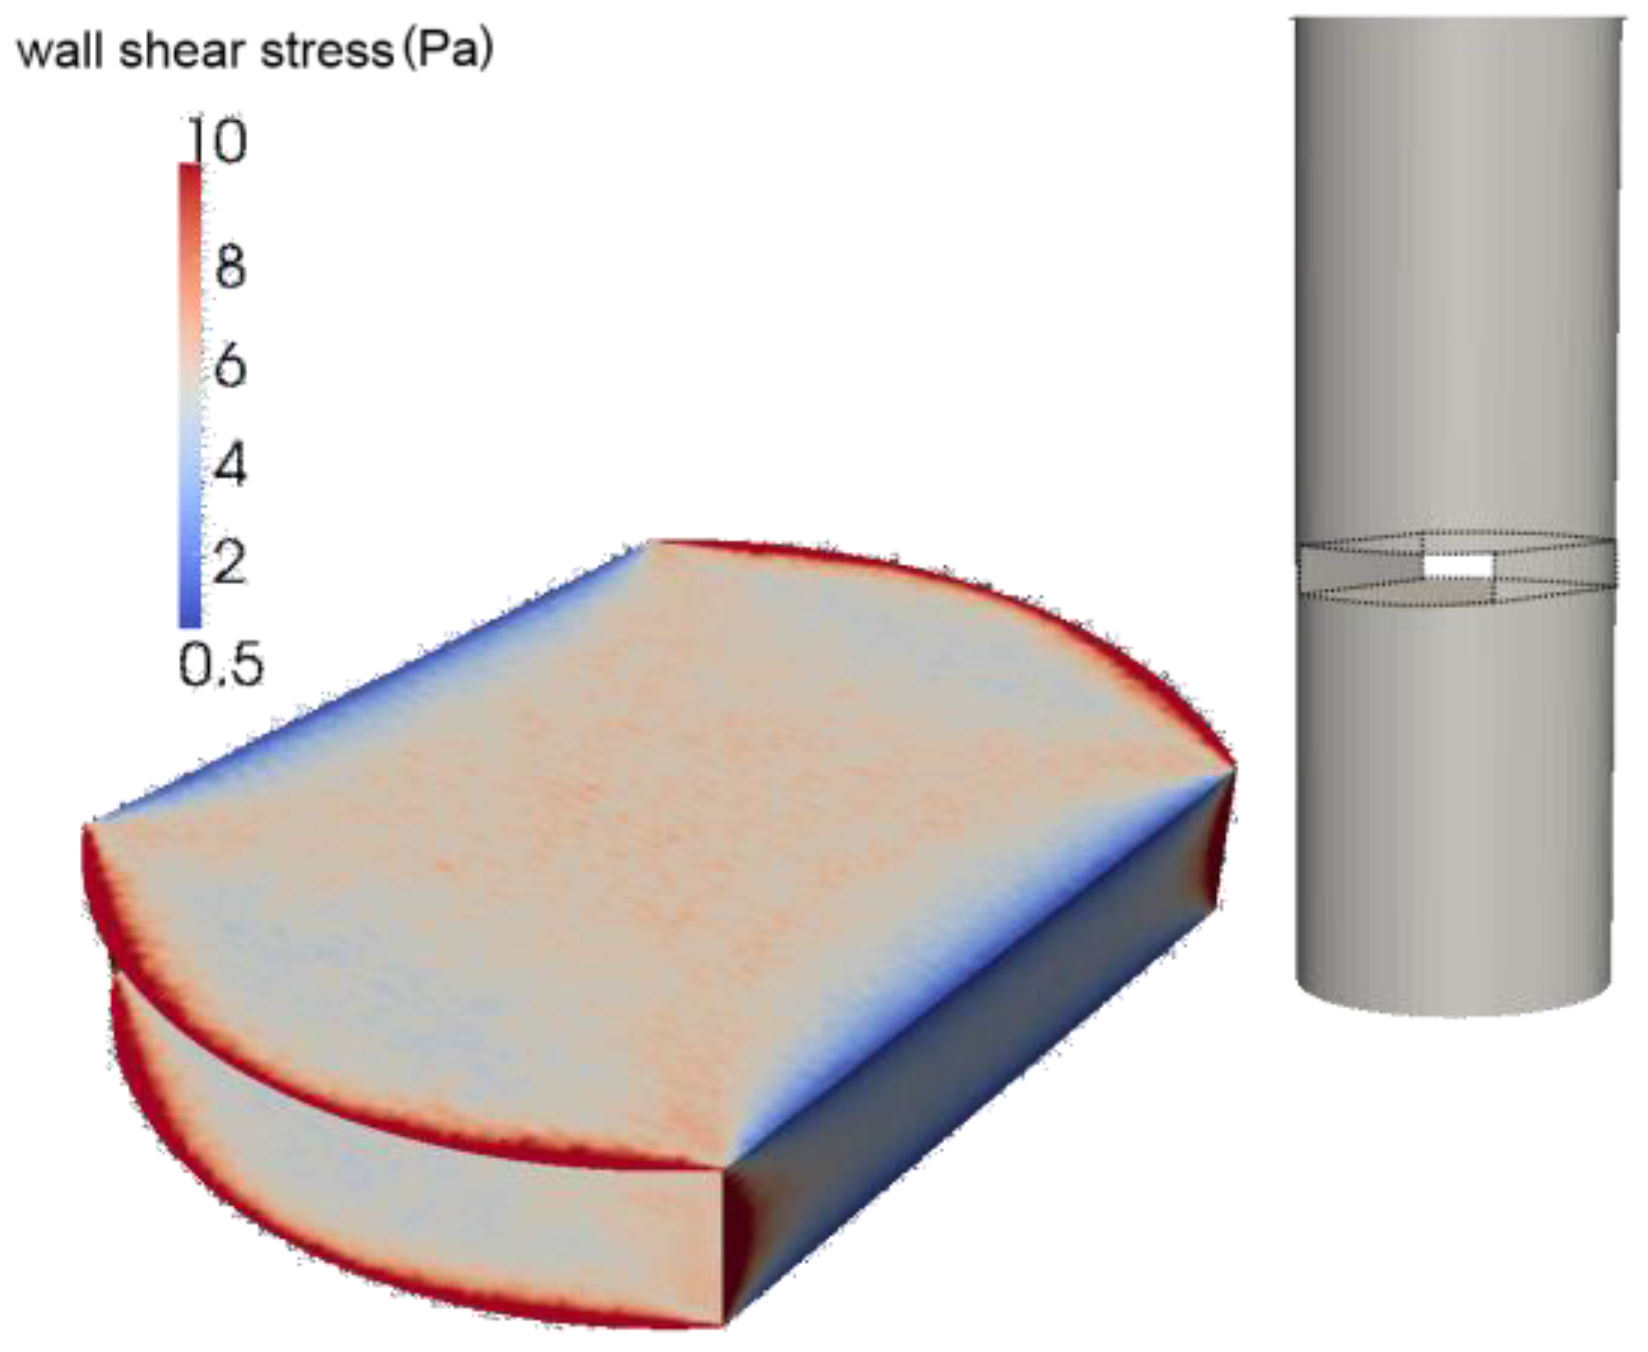
The calculated wall shear stress distribution in the probe slit channel of the sensor at a fluid velocity of 0.03 m/s is illustrated in Figure 6 as color plot on the slit surfaces. The cylindrical probe configuration can be seen from these results. The flow is separated to a flow around and through the slit. The fluid velocity can be kept high at the inner slit walls, where at the edges of the sensor the velocity gradients are very low. Even at high inlet velocities, the wall shear stress only increases slightly in these areas. Round edges might improve this part of the sensor probe to avoid bacterial contamination and strong differences in the maximum and minimum stresses.

Figure 6.
Mean wall shear stress distribution inside the probe slit for an inlet velocity of and a drop size of 150 nm.
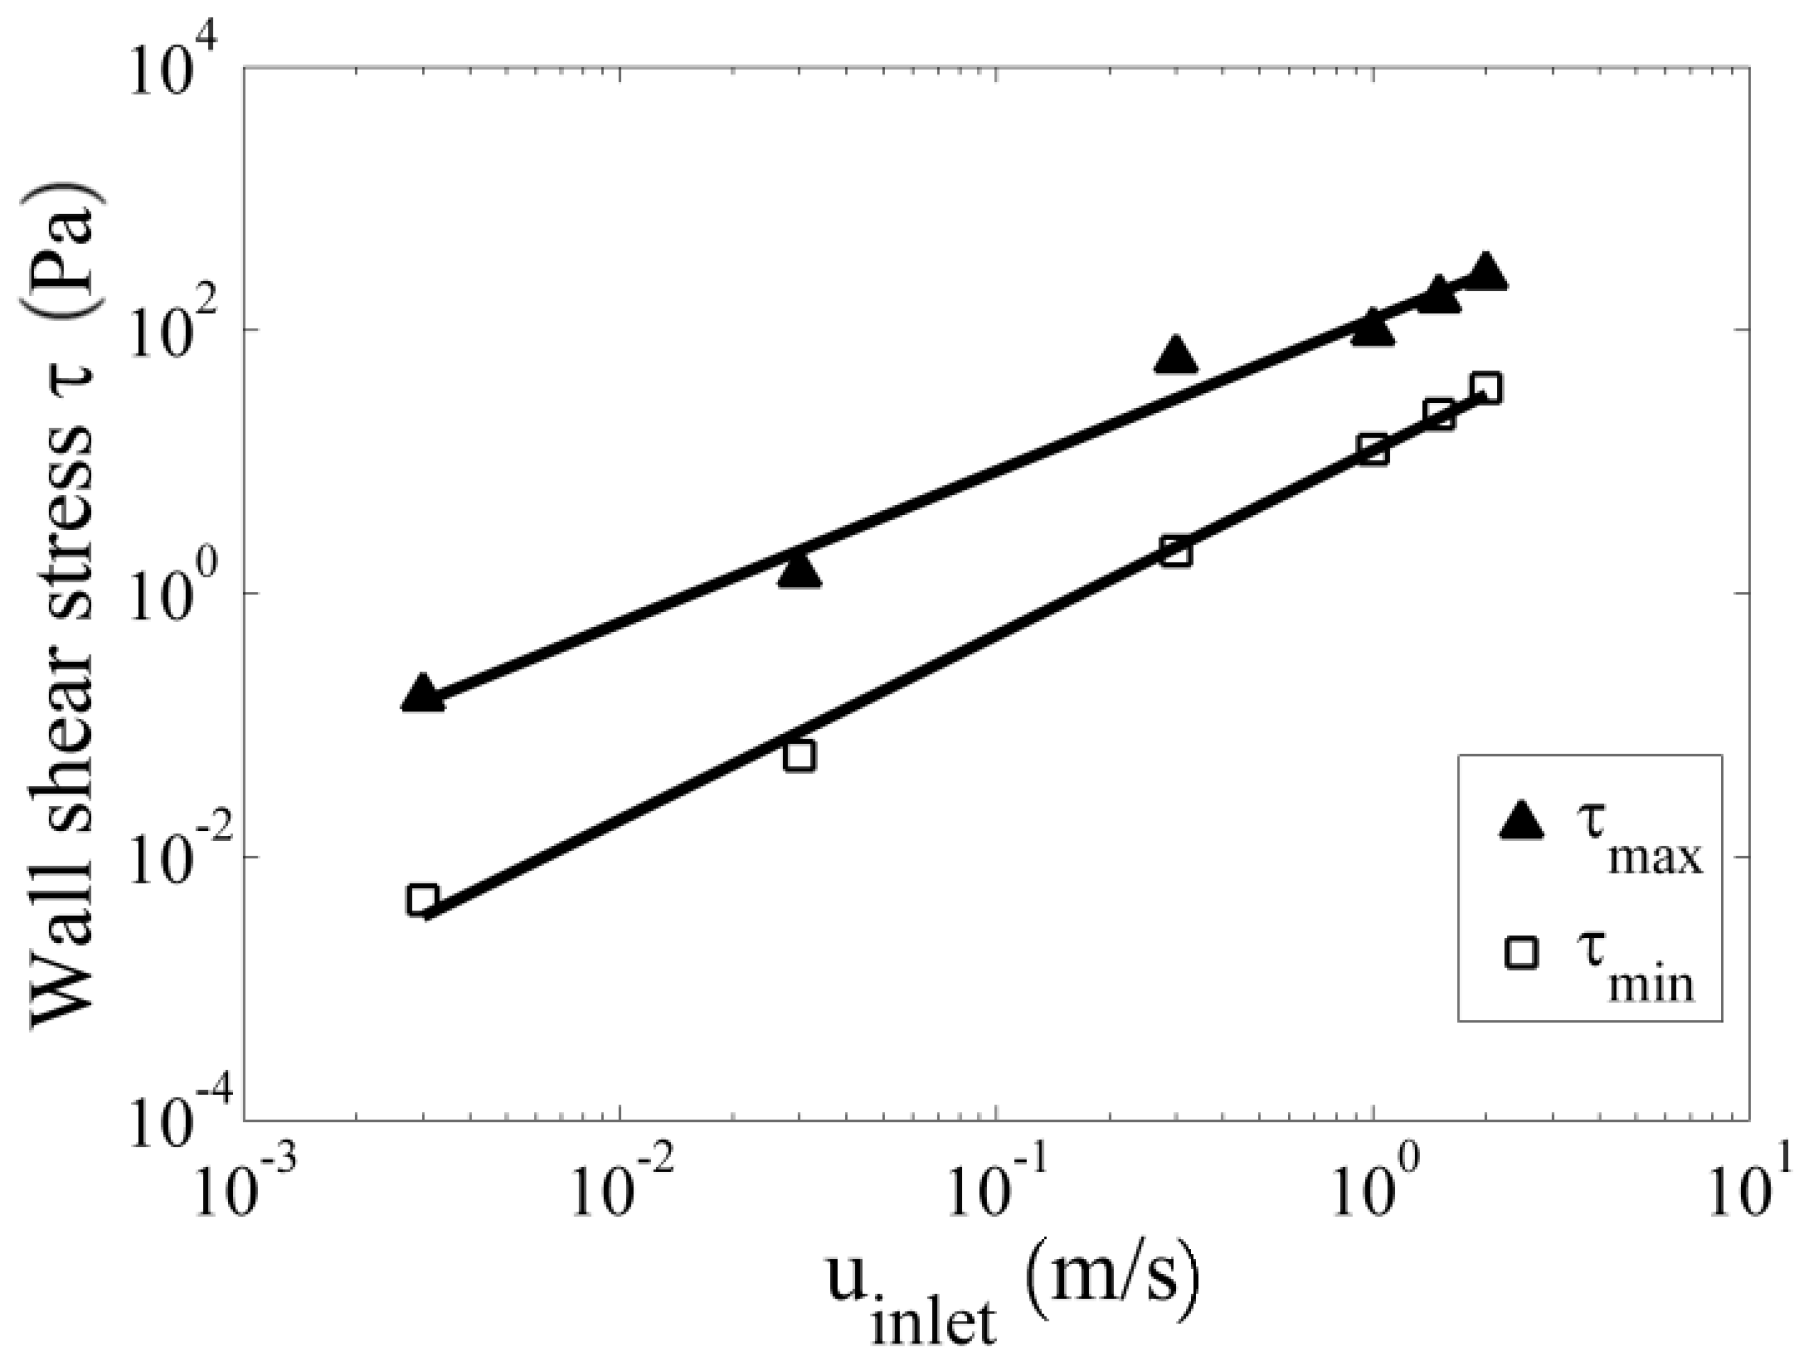
Figure 7 illustrates the calculated occurring minimum and maximum wall shear stress inside the slit of the sensor, which increases exponentially with increasing inlet velocities . The minimal wall shear stress is typically located next to the edges of the slit, and the maximal wall shear stress is located at the verge of the slit. Thus, microbiological adhesion to the walls will more likely take place at the middle and edges of the slit channel. Even at high inlet velocities, the wall shear stress stays low in these areas. Therefore, short slits are superior to longer ones. Flow velocities in the range of of MWF emulsions in metal working machines will lead to wall shear stress of 10–200 Pa (see Figure 7). For the examined sensor geometry, a correlation for the minimum and maximum wall shear stress dependent on the inlet velocity is
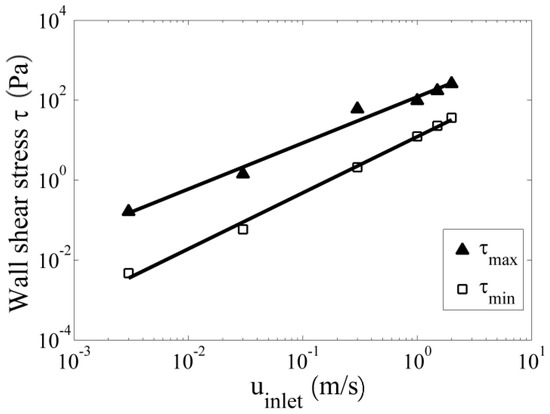
Figure 7.
Maximal and minimal wall shear stress within the sensor probe in dependence of the inlet velocity and a drop size of 150 nm.
An increase of the fluid velocity directly leads to higher velocity gradients and therefore wall shear stresses. The calculated minimum wall shear stress extending the literature values of 3 Pa for avoiding, respectively, the resolution of biomolecules from surfaces is achieved at mean inlet velocities . This threshold should be exceeded to avoid the biological impact on the turbidity measurements.
In order to study the impact of the MWF multiphase flow conditions around the sensor on the measurements, MWF turbidity spectra were detected in a test channel as well as in a machine during operation. The influence of the flow velocity and the droplet concentration on the detected spectra were investigated. Figure 8 illustrates the standard deviation σ between the turbidity spectra measured at a MWF test channel and the in-machine operation turbidity spectra measured for a concentration range of 1–10 :
where m is the number of turbidity measurements in the spectra The standard deviation σ for all concentrations and velocities is about 10−1 for the test channel and less than for the measurement in the machine. The lower standard deviation for the machine is caused by the somewhat aged MWF compared to the fresh MWF used in the flow channel. Figure 8 illustrates the spectra for MWF emulsion with . The spectra do not change with flow velocity, indicating that there is no significant change of the concentration inside the slit for velocities up to 3.5 m/s in the metal working machine. The experimental data validate the CFD simulations, as no segregation effects have been detected in the velocity range typically occurring in metal working machines.
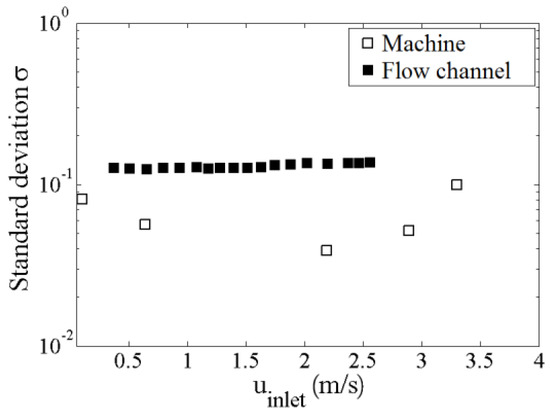
Figure 8.
Standard deviation between measured spectra in the test flow channel and the spectra measured in a working machine at various inlet velocities.
4. Conclusions
The flow through a typical sensor dip probe for metal working fluid quality measurements is investigated by multiphase flow simulation. Experimental and numerical results of flow distribution and transmission intensities inside the sensor slit indicate that no droplet segregation will take place in a velocity range below 3.5 m/s and a concentration range of 1–10 .
The wall shear stress distribution in the slit channel is derived from the flow simulation. A correlation between the wall shear stress and the velocity in the flow channel is derived. The data are compared to wall shear stresses thresholds given in the literature for avoiding microbiological adhesion at surfaces. Flow velocities above avoid the adhesion of bacteria, fungi, and yeasts in the sensor and therefore biofouling. Thus, typical in-process flow structures in machine operation are sufficient to avoid microbiological effects on the long-term sensor operation.
Acknowledgments
The authors acknowledge the support of this project by the Deutsche Forschungsgemeinschaft (DFG) and the Brazilian Coordenação de Aperfeiçoamento de Pessoal de Nível Superior (CAPES), Conselho Nacional de Desenvolvimento Científico e Tecnológico (CNPq), Fundação de Amparo à Pesquisa do Estado de São Paulo (FAPESP), and Financiadora de Estudos e Projetos (FINEP) within the Brazilian German Collaborative Research Initiative in Manufacturing Technology (BRAGECRIM).
Author Contributions
The numerical parts were performed by Sören Sander and Lucas Grosche. Experimental data was provided by Benjamin Glasse. The manuscript has been written through the contributions of all authors. All authors read and approved the paper.
Conflicts of Interest
The authors declare no conflict of interest.
Nomenclature
| C | coefficient |
| D | diameter (m) |
| d | droplet size diameter (nm) |
| f | frequency (s−1) |
| F | force (N) |
| g | gravitational constant (m·s−1) |
| I | intensity |
| k | turbulent kinetic energy (m2·s−2) |
| L | length (cm) |
| m | number of τ(λ = i) in one spectrum |
| n | refractive index |
| P | pressure (N·m−2) |
| R | Reynolds stress |
| S | source (N) |
| t | time (s) |
| u | velocity (m·s−1) |
| V | volume (m3) |
| x | coordinate length (m) |
Greek letters
| α | volume fraction |
| α* | closure coefficient |
| β | closure coefficient |
| β* | closure coefficient |
| ε | turbulent dissipation rate (m2·s−2) |
| λ | wavelength (nm) |
| μ | dynamic viscosity (Pa·s) |
| ν | kinematic viscosity (m2·s−1) |
| ρ | density (kg·m−3) |
| σ | standard deviation |
| σ* | closure coefficient |
| τ | shear stress (Pa) |
| τ(λ) | turbidity (A.U.) |
| ω | specific dissipation rate (s−1) |
Subscripts
| 0 | initial |
| c | continuous |
| cyl | cylinder |
| d | drag |
| eff | effective |
| i | direction 1 |
| inlet | inlet |
| j | direction 2 |
| l | lift |
| max | maximal |
| mean | mean |
| min | minimal |
| p | particulate |
| t | turbulent |
| vm | virtual mass |
| wall | wall |
References
- Brinksmeier, E.; Garbrecht, M.; Heinzel, C.; Koch, T.; Eckebrecht, J. Current approaches in design and supply of metalworking fluids. Tribol. Trans. 2009, 52, 591–601. [Google Scholar] [CrossRef]
- Dubey, S.; Sharma, G.; Shishodia, K.; Sekhon, G. Study on the performance of oil-in-water emulsions during cold rolling of steel strip. Tribol. Trans. 2005, 48, 499–504. [Google Scholar] [CrossRef]
- Byers, J.P. Metalworking Fluids, 2nd ed.; CRC Press: Boca Raton, FL, USA, 2006. [Google Scholar]
- De Paula Dias, A.M. Ressourcenschonender Einsatz von Kühlschmierstoffen; University of Bremen: Bremen, Germany, 2005. [Google Scholar]
- Celis, M.T.; Garcia-Rubio, L.H. Stability of emulsions from multiwavelength transmission measurements. Ind. Eng. Chem. Res. 2004, 43, 2067–2072. [Google Scholar] [CrossRef]
- Deluhery, J.; Rajagopalan, N. A turbidimetric method for the rapid evaluation of MWF emulsion stability. Colloids Surf. A Physicochem. Eng. Asp. 2005, 256, 145–149. [Google Scholar] [CrossRef]
- Glasse, B.; Assenhaimer, C.; Guardani, R.; Fritsching, U. Turbidimetry for the stability evaluation of emulsions used in machining industry. Can. J. Chem. Eng. 2013, 92, 324–329. [Google Scholar] [CrossRef]
- Alupoaei, C.E.; Olivares, J.A.; Garcı́a-Rubio, L.H. Quantitative spectroscopy analysis of prokaryotic cells: Vegetative cells and spores. Biosens. Bioelectron. 2004, 19, 893–903. [Google Scholar] [CrossRef] [PubMed]
- VDI3397. Maintenance of Metalworking Fluids—Measures for Maintaining Quality, and for Reducing Solid and Liquid Waste; Beuth-Verlag: Berlin, Germany, 2007. [Google Scholar]
- Jensen, B.B.B.; Friis, A. Critical wall shear stress for the ehedg test method. Chem. Eng. Process. Process Intensif. 2004, 43, 831–840. [Google Scholar] [CrossRef]
- Busscher, H.J.; van der Mei, H.C. Microbial adhesion in flow displacement systems. Clin. Microbiol. Rev. 2006, 19, 127–141. [Google Scholar] [CrossRef] [PubMed]
- Guillemot, G.; Vaca-Medina, G.; Martin-Yken, H.; Vernhet, A.; Schmitz, P.; Mercier-Bonin, M. Shear-flow induced detachment of saccharomyces cerevisiae from stainless steel: Influence of yeast and solid surface properties. Colloids Surf. B Biointerfaces 2006, 49, 126–135. [Google Scholar] [CrossRef] [PubMed]
- Ozgoren, M.; Pinar, E.; Sahin, B.; Akilli, H. Comparison of flow structures in the downstream region of a cylinder and sphere. Int. J. Heat Fluid Flow 2011, 32, 1138–1146. [Google Scholar] [CrossRef]
- Omori, T.; Jakirlić, S.; Tropea, C.; Obi, S. Shearless and sheared flow past a circular cylinder: Comparative analysis by means of les. Int. J. Heat Fluid Flow 2008, 29, 703–720. [Google Scholar] [CrossRef]
- Schubert, H. Emulgiertechnik—Grundlagen, Verfahren und Anwendungen; Behr’s Verlag: Hamburg, Germany, 2005. [Google Scholar]
- Williamson, C.H.K. Vortex dynamics in the cylinder wake. Annu. Rev. Fluid Mech. 1996, 28, 477–539. [Google Scholar] [CrossRef]
- Luo, K.; Fan, J.; Li, W.; Cen, K. Transient, three-dimensional simulation of particle dispersion in flows around a circular cylinder Re = 140–260. Fuel 2009, 88, 1294–1301. [Google Scholar] [CrossRef]
- Assenhaimer, C.; Machado, L.J.; Glasse, B.; Fritsching, U.; Guardani, R. Use of a spectroscopic sensor to monitor droplet size distribution in emulsions using neural networks. Can. J. Chem. Eng. 2014, 92, 318–323. [Google Scholar] [CrossRef]
- Rusche, H. Computational Fluid Dynamics of Dispersed Two-Phase Flows at High Phase Fractions; University of London: London, UK, 2002. [Google Scholar]
- Gosman, A.D.; Lekakou, C.; Politis, S.; Issa, R.I.; Looney, M.K. Multidimensional modeling of turbulent two-phase flows in stirred vessels. Am. Inst. Chem. Eng. J. 1992, 38, 1946–1956. [Google Scholar] [CrossRef]
- Hill, D. The Computer Simulation of Dispersed Two-Phase Flows; University of London: London, UK, 1998. [Google Scholar]
- Pal, R. Modeling the viscosity of concentrated nanoemulsions and nanosuspensions. Fluids 2016, 1, 11. [Google Scholar] [CrossRef]
- Politis, S. Prediction of Two-Phase Solid-Liquid Turbulent Flow in Stirred Vessels; University of London: London, UK, 1989. [Google Scholar]
- Auton, T.R.; Hunt, J.C.R.; Prud’Homme, M. The force exerted on a body in inviscid unsteady non-uniform rotational flow. J. Fluid Mech. 1988, 197, 241–257. [Google Scholar] [CrossRef]
- Schiller, L.; Naumann, A. A drag coefficient correlation. Zeitschrift des Vereins Deutscher Ingenieure 1935, 77, 318–320. [Google Scholar]
- Clift, R.; Grace, J.R.; Weber, M.E. Bubbles, Drops, and Particles; Academic Press: New York, NY, USA, 1978. [Google Scholar]
- Weller, H.G.; Tabor, G.; Jasak, H.; Fureby, C. A tensorial approach to computational continuum mechanics using object-oriented techniques. Comput. Phys. 1998, 12, 620–631. [Google Scholar] [CrossRef]
- Kalitzin, G.; Medic, G.; Iaccarino, G.; Durbin, P. Near-wall behavior of rans turbulence models and implications for wall functions. J. Comput. Phys. 2005, 204, 265–291. [Google Scholar] [CrossRef]
- Noureddini, H.; Teoh, B.C.; Clements, L.D. Densities of vegetable oils and fatty acids. J. Am. Oil Chem. Soc. 1992, 69, 1189–1191. [Google Scholar] [CrossRef]
- Rabenstein, A.; Koch, T.; Remesch, M.; Brinksmeier, E.; Kuever, J. Microbial degradation of water miscible metal working fluids. Int. Biodeterior. Biodegrad. 2009, 63, 1023–1029. [Google Scholar] [CrossRef]
- Lecuyer, S.; Rusconi, R.; Shen, Y.; Forsyth, A.; Vlamakis, H.; Kolter, R.; Stone, H. Shear stress increases the residence time of adhesion of pseudomonas aeruginosa. Biophys. J. 2011, 100, 341–350. [Google Scholar] [CrossRef] [PubMed]


© 2017 by the authors. Licensee MDPI, Basel, Switzerland. This article is an open access article distributed under the terms and conditions of the Creative Commons Attribution (CC BY) license ( http://creativecommons.org/licenses/by/4.0/).