Abstract
The purpose of the Social Accounting Matrix (SAM) is to improve the quality of the database for modelling, including, but not limited to, policy analysis, multiplier analysis, price analysis, and Computable General Equilibrium. This article contributes to constructing the 2017 national SAM for South Africa, incorporating regional accounts. Only in Limpopo Province of South Africa are agricultural industries, labour, and households captured at the district level, while agricultural industry, labour, and household accounts in other provinces remain unchanged. The main data sources for constructing a SAM are found from different sources, such as Supply and Use Tables, National Accounts, Census of Commercial Agriculture, Quarterly Labour Force Survey, South Africa Revenue Service, Global Insight (regional explorer), and South Africa Reserve Bank. The dataset recorded that land returns for irrigation agriculture were highest (18.2%) in the Northern Cape Province of South Africa compared to other provinces, whereas the Free State Province of South Africa rainfed agriculture had the largest shares (22%) for payment to land. Regarding intermediate inputs, rainfed agriculture in the Western Cape, Free State, and Kwazulu-Natal Provinces paid approximately 0.4% for using intermediate inputs. In terms of the districts, land returns for irrigation were highest in the Vhembe district of Limpopo Province of South Africa with 0.3%. Despite Mopani district of Limpopo Province of South Africa having the lowest land returns for irrigation agriculture, it has the highest share (1.6%) of payment to land from rainfed agriculture. The manufacturing and community service sectors had a trade deficit, whereas other sectors experienced a trade surplus. The main challenges found in developing a SAM are scarcity of data to attain the information needed for disaggregation for the sub-matrices and insufficient information from different data sources for estimating missing information to ensure the row and column totals of the SAM are consistent and complete.
Dataset: https://doi.org/10.38140/ufs.24032457.v1.
Dataset License: CC-BY 4.0
1. Introduction
This paper contributes to constructing the national SAM for South Africa using 2017 prices. Punt [1], Round [2], and PROVIDE [3] define SAMs as transactions that transpire in the economy for a period of one year. This particular transaction shows receipts and payments in the economy.
The primary data sources for constructing the SAM are found from different sources, such as Supply and Use Tables (SUT), National Accounts, Census of Commercial Agriculture, Quarterly Labour Force Survey (QLFS), Living Condition Survey (LCS), General Households Survey (GHS), South Africa Revenue Services (SARS), Global Insight (regional explorer), and South Africa Reserve Bank (SARB). The significance of a SAM, as mentioned by Punt [1], is that it displays a full circular flow of all details in the SUT and other missing information in the SUT. Therefore, a SAM is an expansion of the SUT. The row and column totals in a SAM must equate and square. Different models are developed from a SAM; these models incorporate Computable General Equilibrium (CGE) models and multiplier models. Of the above-mentioned models, CGE is known for its dominance due to the inclusion of a set of simultaneous equations.
Several SAMs had been reported in previous years for policy analyses in South Africa and internationally:
- ❖
- Taljaard [4] used a 2000 SAM developed by PROVIDE [5], which included district accounts for agricultural industries in the Northern Cape. Punt [1] further reconstructed this SAM to 2007 prices, which included provincial agricultural industries in South Africa.
- ❖
- Davies and Thurlow [6] developed a 2009 SAM for South Africa with a single agricultural sector. Van Seventer et al. [7,8,9] updated a SAM to 2012, 2015, and 2016, respectively.
- ❖
- Phoofolo [10] provided a 2014 SAM with a disaggregated agricultural sector and a single account for agricultural land in South Africa. StsaSA [11,12,13,14] constructed SAMs for 1998, 2002, 2005, and 2011.
- ❖
- Conningarth Economist 1 developed different SAMs that are utilized for consultancy work. Conningarth Economist [15,16] recorded a 2006 and 2018 SAM for provincial (Limpopo and Kwazulu-Natal) commissioned by the Development Bank of Southern Africa (DBSA).
- ❖
- Aragie and Thurlow [17] constructed a 2018 SAM for Ethiopia, which included disaggregated agricultural activities and land accounts for single cultivated crops. IFPRI uses this SAM for policy analysis. Additionally, a 2018 Nigerian SAM was developed by Thurlow [18]. Aragie and Thurlow [19] developed a 2015 SAM for Ghana with the purpose of estimating home production for home consumption and including large shares of subsistence agriculture. Household accounts were defined according to regions, and each region had a specific agricultural industry producing subsistence commodities. Pradesha [20] produced a 2018 SAM for the Philippines with disaggregated agricultural activities and further split capital accounts according to crop and livestock. The SAM also includes land accounts based on cultivated cropland.
Most of the SAMs mentioned above were designed for policy analysis, as they provide detailed information for factors and household accounts. However, the South African SAMs developed by Phofoolo [10], Van seventer et al. [7,8,9], and Davies and Thurlow [6] do not contain detailed agricultural activities at the regional level. The SAMs developed by StatsSA [11,12,13,14] are not ideal for policy analyses due to their limitation of redistribution of income, as they do not provide sufficient information for factors and household accounts and only record single industry and product accounts for agriculture, forestry, and fisheries. This study adds to the agricultural industry accounts captured in a 2007 SAM adjusted by Punt [1], where the researcher disaggregated agricultural activities according to South African provinces but never assessed agricultural activities from the district’s perspective. On the other hand, Taljaard [4] evaluated irrigation agriculture from the Northern Cape district perspective by disaggregating agricultural activities according to regions using a 2000 SAM developed by PROVIDE [3].
This study followed a similar composition to that conducted by Taljaard [4], incorporating provincial and district accounts for agricultural industries in the national SAM for South Africa. Regional districts within the Limpopo Province will disaggregate agricultural activity accounts. This means that agricultural industries are defined according to the agricultural land they use to produce a combination of agricultural commodities. Agricultural activities will further be divided into two categories in the regional districts: irrigation and non-irrigation agricultural activities. Factors of production consist of labour, capital, and land accounts. Labour and household accounts will be disaggregated according to province and district classifications. Land accounts comprise rainfed (dry land) and irrigated land. According to the knowledge of the researcher/authors, no study has been conducted in Limpopo Province using a national SAM with a disaggregated agricultural industry account according to district level.
This dataset plays a vital role in evaluating the economic impact of irrigation and non-irrigation sectors in various regions/districts of the Limpopo Province and other regional sectors in other provinces of South Africa. In addition, a SAM is designed to address the issues of distribution of institutional incomes and labour remunerations by regions in the Limpopo Province and the farming return by each production activity in the provinces. Hence, it is significant to develop this type of dataset to assess the significance of irrigation agriculture in the Limpopo Province.
2. Data Description
A 2017 national SAM for South Africa, which incorporates details about regional accounts for agricultural activities, labour, and households, comprises two hundred thirty accounts: one hundred six commodities (of which six are agrarian commodities), eighty-seven industries (of which agricultural sectors are divided into irrigation and non-irrigation), one transaction account, one account for capital, two accounts for land, thirteen accounts for labour, thirteen accounts for households, one enterprise, four tax accounts, one account for government, one account for investment/savings, change inventories, and one international trade (rest of the world) account.
Table 1 reported the South Africa macro-SAM for 2017 derived from the aggregated balanced SAM (million ZAR 2 (Rand), national currency of South Africa, USD 1 = ZAR 13.3055). As part of the intermediate input, the commodity demand recorded 45% (ZAR 4,791,222) of the total demand for commodities (ZAR 10,763,912). The domestic final demand was reported at 43% (ZAR 4,593,943), and exports accounted for 13% (ZAR 1,378,747). Imported commodities recorded 12% (ZAR 1,319,114) of the total ZAR 10,763,912 supply. At the basic prices, the total domestic production was ZAR 4,791,222, which includes payment to primary inputs of 46% (ZAR 4,090,904) and producer taxes of 1% (ZAR 82,421). South Africa was reported to be a net exporter of goods and services to the rest of the world in 2017 (ZAR 59,633), causing the country to have a net surplus on the current account.

Table 1.
A 2017 macro-SAM for South Africa (ZAR million).
In the case of household income (ZAR 3,697,568), as captured from the developed SAM, most of the income came from labour services, with a reported 60% (ZAR 2,223,661). Other incomes came as payment from enterprise at 15% (ZAR 546,186), from returns to capital at 14% (ZAR 533,956), and distribution from the government at 10% (ZAR 372,053). Most of the expenditure was reported as consumption of commodities at 75% (ZAR 2,756,540). Other expenditures came from payment to direct taxes at 13% (ZAR 465,800), payment to enterprises at 11% (ZAR 403,395), and savings at 2% (ZAR 62,222).
As recorded in the row account in the SAM, the government income received 63.1% (ZAR 1,241,379) of the income from producers, products, and income taxes. Other income came as payment from institutions at 26.7% (ZAR 526,255), payment from capital at 10.1% (ZAR 199,534), and transfer from the rest of the world at 0.1% (ZAR 1285). The total government expenditure was reported as ZAR 1,968,453. Of this total expenditure, 42.9% were consumptions of commodities, followed by transfers to institutions at 48.1%, transfers to savings at 0.1% (ZAR 2019), and transfers to the rest of the world at 2.6% (ZAR 51,690). The total investment, as recorded in the column account of a SAM, was ZAR 869,505. Of this total value, the domestic investment was reported to be at ZAR 873,223, with decreased inventory (ZAR 3717). Most of the domestic savings were reported as transfers from enterprises at 76.1% (ZAR 661,505), savings from households’ income at 0.7% (ZAR 62,222), and savings from the government at 0.2% (ZAR 2019).
Table 2 reveals the share of the total value output of payments for intermediate inputs, labour, gross operating surplus (GOS), land, and net activity taxes. The land returns for irrigation agriculture were highest in the Northern Cape Province of South Africa with about 18.2% compared to other provinces of South Africa, followed by the Eastern Cape Province of South Africa with 5.5%, Western Cape Province of South Africa with 4%, and the North West and Free State Provinces of South Africa with 2.2%. The payment to capital (GOS) for rainfed agriculture in the Northern Cape was 0.8%. Free State rainfed agriculture had the largest shares for payment to land (22%), followed by North West with 13.2% and Northern Cape (7.6%). Regarding intermediate inputs, rainfed agriculture in the Western Cape, Free State, and Kwazulu-Natal paid approximately 0.4% for using intermediate inputs. These industries paid around 0.1% each for labour remuneration and 0.3%, 0.4%, and 0.2% for utilizing capital (gross operating surplus).
Table 2.
Components of total output by industries.
In terms of the districts, land returns for irrigation agriculture were highest in the Vhembe district of Limpopo Province of South Africa with only 0.3%, followed by Capricorn of Limpopo Province of South Africa (0.2%), Waterberg of Limpopo Province of South Africa (0.2%), Sekhukhune of Limpopo Province of South Africa (0.2%), and Mopani of Limpopo Province of South Africa with 0.1%. Despite Mopani having the lowest land returns for irrigation agriculture, it has a high share (1.6%) of payment to land from rainfed agriculture, followed by Waterberg (0.7%), Vhembe (0.6%), Capricorn (0.5%), and Sekhukhune (0.1%).
Table 3 records the shares of the total value of demand of intermediate use, household consumption, government consumption, investment, and exports for the commodities incorporated in the SAM. Agriculture, live animals, forestry, and fishing are primarily utilized as intermediate demand (about 3.1%). Whereas only 4.5% of these commodities are consumed by households, approximately 2.8% of the same commodities are exported to the rest of the world. The total demand for agricultural commodities is estimated at ZAR 232 million, whereas live animal consumption is about ZAR 70 million, forestry ZAR 23 million, and fishing ZAR 11 million. Food processing accounted for about 2.5% of exported commodities, with about 20% of the processed food consumed by households. The overall demand consumption for food processing commodities is approximately ZAR 831 million.
Table 3.
Components of total demand by commodities.
In the case of mining commodities, about 18.8% of the demand for mining was exported, of which 12.9% came from metal ores, with a demand of 1.2% for intermediate inputs. Coal and lignite recorded only 1.8% of the export demand, with household consumption of 0.1%. The total demand for mining commodities is reported at ZAR 814 million.
Figure 1 presents the share of the commodities exported or imported. The trade service sector had the largest share (42%) of commodities exported to the rest of the world, followed by the manufacturing sector with about 20%, mining (19%), transport services (9%), and food processing (3%). Agriculture exported only 2% of their commodities to other countries. In the case of imported commodities, about 68% of commodities were imported by manufacturing sectors, followed by mining with approximately 11%, financial and community services (11%), food processing (3%), and agriculture (1%).
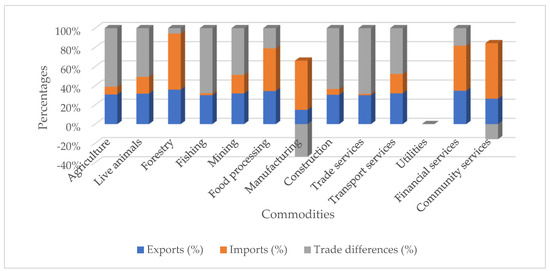
Figure 1.
Commodities exported/imported. Source: Authors’ estimation from SAM of 2017.
The manufacturing and community service sectors had a trade deficit of ZAR 440 million and ZAR 11 million, respectively (Figure 2). In contrast, other sectors (such as agriculture, mining, food processing, construction, trade services, transport services, and financial services) within the economy experienced a trade surplus.
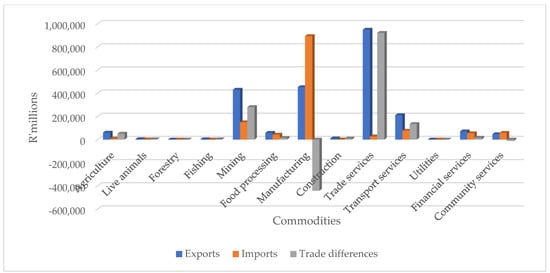
Figure 2.
Commodities exported/imported. Source: Authors’ estimation from SAM of 2017.
Table 4 indicates different sources of income based on province and district classification groups. Over 50% of the households in Gauteng Province received their incomes through labour remuneration (26.1%) and gross operating surplus (27.1%), followed by Kwazulu-Natal with about 18.9% and 17.4%, respectively. About 37% of the households in the Northern Cape generate their income from using land, compared to only 16% of Free State households. More than 17% of households in the Eastern Cape received shares of income from the government through grants or subsidies, whereas only 18% of income comes from abroad.
Table 4.
Shares of household incomes.
In the districts, approximately 4.8% of the household income in the Capricorn district of Limpopo Province of South Africa comes from abroad, while only 4.3% is from the government. About 2.3% of the labour remuneration is distributed to the households of Vhembe district of Limpopo Province of South Africa, followed by Capricorn of Limpopo Province of South Africa with 2.2%, Sekhukhune of Limpopo Province of South Africa (1.9%), Mopani of Limpopo Province of South Africa (1.8%), and Waterberg of Limpopo Province of South Africa with 1.3%. Only 3% of incomes from enterprises are shared with Mopani of Limpopo Province of South Africa households, while 3.4% goes to the Capricorn district. About 1% of the household incomes in the Capricorn and Mopani districts are generated using land, whereas land returns for Vhembe and Waterberg households are estimated at 0.7% each.
Table 5 shows expenditure shares by households of South African Provinces and districts of Limpopo Province. Regarding provinces, Gauteng households spent a large proportion of their disposable income on commodities (27.4%), whereas about 23% of their income is saved domestically or abroad. Free State households spent a large proportion (24.7%) of their incomes on paying taxes. Approximately 22.9% of the households in the Western Cape distributed their incomes in savings either domestically or abroad. In comparison, about 11% of the households used some of their income to purchase commodities and pay taxes. In terms of districts, most of the households in the districts of Limpopo spent their disposable income on paying taxes. Households in Mopani spent about 2.1% of their expenditure on commodities, followed by Vhembe and Capricorn with 1.7%, Sekhukhune (1.6%), and Waterberg (1.4%). Only 1.3% of the households in Capricorn saved their incomes either domestically or abroad, followed by Vhembe (0.9%), Mopani (0.7%), Waterberg (0.6%), and Sekhukhune (0.5%).
Table 5.
Shares of the household expenditures.
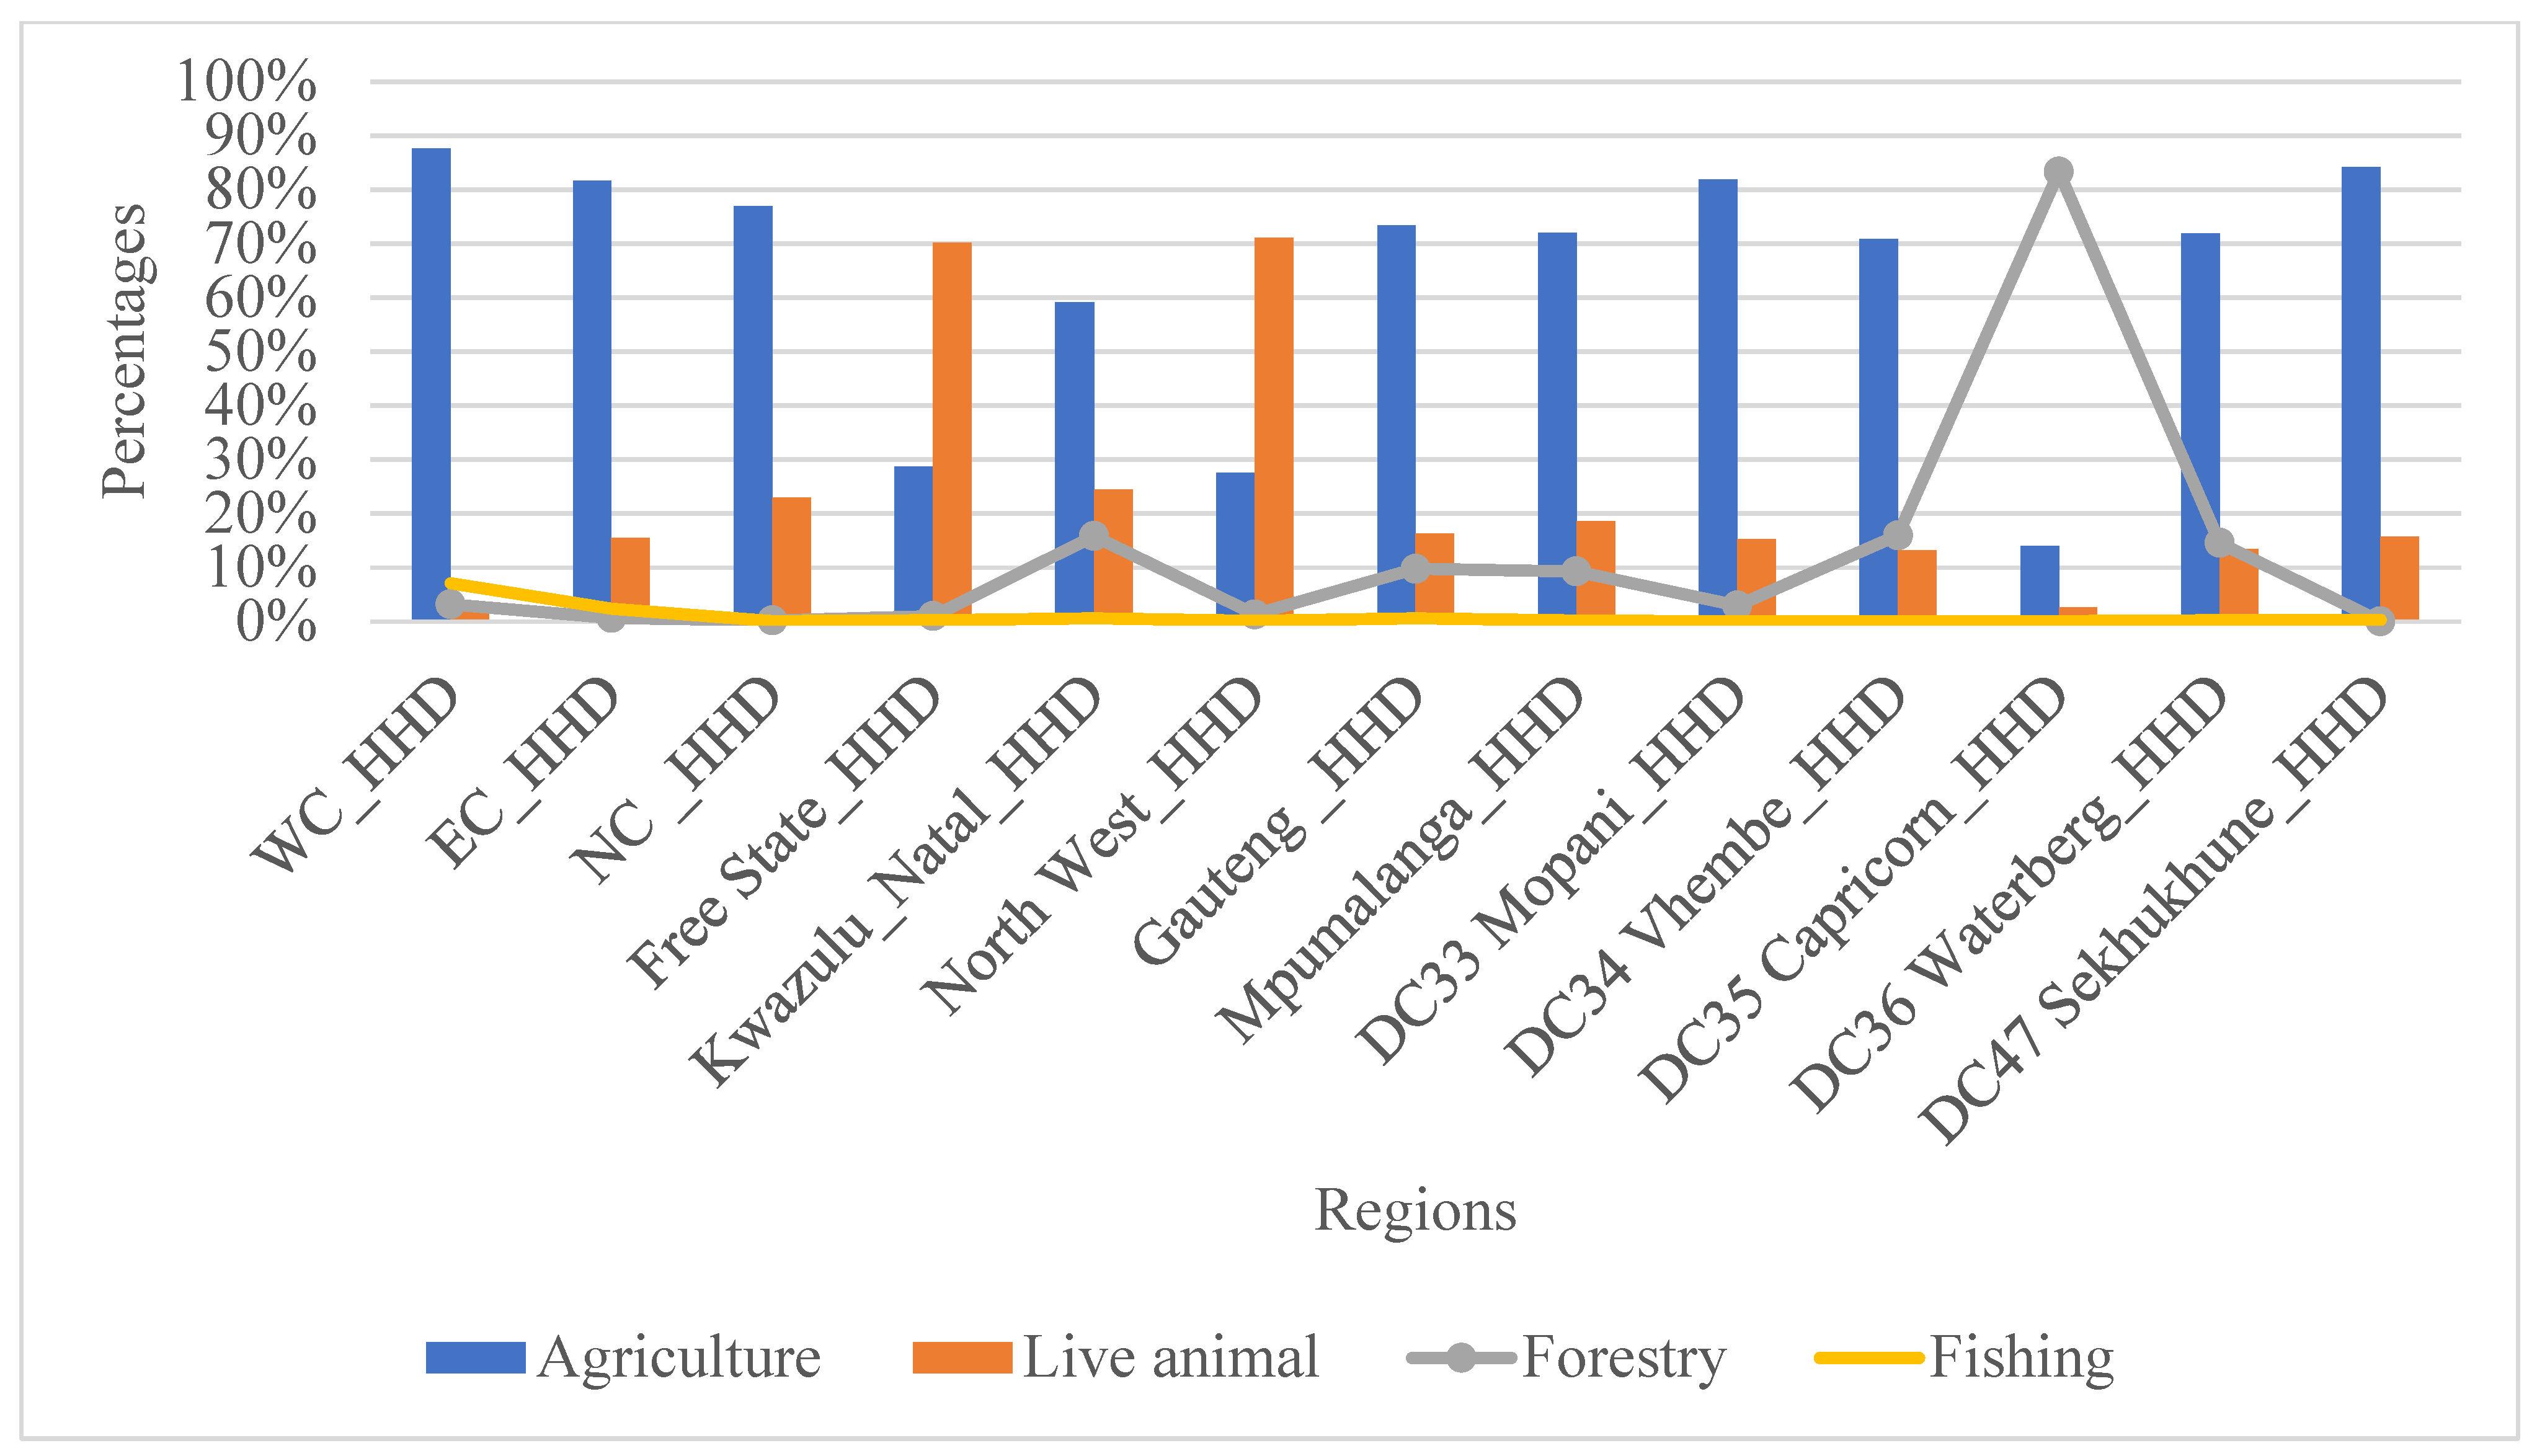
Figure 3 presents the shares of household consumption by region. Over 70% of the agricultural commodities are consumed by five provinces (Western Cape (88%), Eastern Cape (82%), Northern Cape (77%), Gauteng (73%), and Mpumalanga (72%)). Regarding household consumption by live animals, North West and Free State households consumed about 71% and 70%, respectively. The least of the household consumption comes from forestry and fishing. Looking at the district level, Mopani and Sekhukhune consumed over 80% of the agriculture commodities, whereas Vhembe and Waterberg consumed about 70%. Capricorn households consumed approximately 83% of forestry, while the remainder comes from agriculture with 14% and live animals with about 3%.

Figure 3.
Shares of the household consumption by region. Source: Authors’ estimation from SAM of 2017.
Table 6 indicates the income and expenditure of the South African government in 2017. The table below indicates that most government income is accumulated through tax receipts. Net product, direct income, and corporate taxes are 27.1%, 15.1%, and 12%, respectively. Consumption spending dominated South African government expenditure, with a high proportion of about 54.7%, followed by transfers to enterprises with a share of 22.5% and transfers to households with only 9.8%. Transfers to the rest of the world and savings form the smallest components, with shares of 2.9% and 0.1%, respectively.
Table 6.
Income and expenditure for the South African government.
3. Methods and Materials
The primary data sources for each type of account used to develop a 2017 SAM are presented in Table 7. The range of data sources used to build the SAM showed that it may be possible for the SAM not to balance (column totals and row totals are unequal). Therefore, different steps will be discussed in detail regarding the unbalanced SAM, and the evaluation of missing information will be provided to have a full and steady SAM for South Africa.
- ❖
- First step: Adjusting the information in the SUTThe 14 accounts in the National Accounts [21] were used as a base to derive more information from [22], with 62 industries and 104 commodities (contains a single account for the agricultural industry and commodity). The SUT does not provide sufficient and complete information for a SAM. Therefore, more detailed information was further included in single agriculture, labour, household, and government accounts through disaggregation of these accounts, as discussed in the following sections.
- ❖
- Second step: Disaggregating accounts in the final demandThe SUT for 2017 comprises only a single household account [22]. To divide the account into a complete matrix recording expenditures by various household racial classification categories, the Living Condition Survey [23] and Global Insight (regional explorer) [24], which incorporate consumption expenditure data, were used. The share of expenditure for various household groups was estimated according to each commodity in the 2017 SUT so that the matrix can provide rich information for final consumptions on households [21]. The remaining categories for final demand, such as government expenditure, investment, change in inventory, and exports, are attained from the Use Table [21].
- ❖
- Third step: Disaggregating accounts for compensation of employeesThe 2017 Use Table recorded wages and salaries for each industry [21]. The single account of labour is reported for employees’ compensation. These salaries and wages are disseminated from each industry to various 13 labour group classifications using the information attained in [22].
- ❖
- Fourth step: Labour income payments to households and abroadThe wage and salary payments to households are estimated from the information in [23,24]. The labour income received from abroad was disseminated to various identified labour group classifications based on the estimated shares in the total domestic employment income.
- ❖
- Fifth step: Source of household incomeIn addition, from labour income, the household accounts received various incomes from the gross operating surplus and land. Other incomes to households are distributed from enterprises, the government, and abroad. The shares for household income were estimated from [23,25], because these contained data on labour, capital, enterprise, and government.
- ❖
- Sixth step: Disaggregating the account in the agricultural industriesDetailed information on the output value for agricultural industries was found from [26]. The output shares were estimated for all agricultural industries included in the South African SAM. The payments from agricultural industries to labour were estimated from the data attained in [26,27]. Few adjustments were made manually due to the disaggregation of labour incomes and agricultural industries. The payments of farm industries were distributed to gross operating surplus as part of the income received. The estimation was conducted using the data found in [26]. In addition, the gross operating surplus control total was split into land and capital using the land and capital value ratios derived from [26]. Land rental values were added as a production factor to the agricultural industry, forestry, and fishery accounts. The control total for land was further split into irrigated land and dry land using share estimation from [26]. The categories of these land values were disseminated to the agricultural, forestry, and fishery industries according to their production hectares.The information on the Producer (production) taxes was derived from the data attained in [28]. The agricultural production taxes are disseminated across all agricultural activities according to output shares. The detailed information on the net domestic commodity taxes was also derived from [28]. The control total for net domestic commodities is disseminated across all agricultural commodities, paying for taxes based on the commodities’ output values shares.The exports and imports for agricultural commodities were estimated according to the information attained from [26,29].
- ❖
- Seventh step: Deriving the intermediate consumptionThe disaggregation was conducted following the 2017 Use Table for South Africa [22] in order to explicitly give information on the products (single agricultural commodities) that were utilized as inputs by the agricultural industry. The expenditure for agricultural industries is used according to individual commodities. The information on the expenditure by industries is found in [26].
Table 7.
Data sources for each type of account in SAM.
Table 7.
Data sources for each type of account in SAM.
| Type of Accounts | Data Sources |
|---|---|
| Commodities and industries/activities | 2017 Supply and Use Tables [22]. South Africa Reserve Bank Quarterly Bulletin [21]. Census Commercial Agriculture for 2017 [26]. Regional Global Insight [24]. |
| Factors of production | 2017 Supply and Use Tables [22]. Living Condition Surveys 2014/15 [23]. Regional Global Insight [24]. Quarterly Labour Force Surveys (QLFS) 2017 [27]. South Africa Reserve Bank Quarterly Bulletin [21]. |
| Households | Living Condition Surveys 2014/2015 [23]. General Household Survey (2017) [25]. Quarterly Labour Force Surveys (QLFS) 2017 [27]. Regional Global Insight [24]. South Africa Reserve Bank Quarterly Bulletin [21] Supply and Uses Tables for 2017 [22]. |
| Enterprises | Living Condition Surveys 2014/15 [23]. General Households Surveys 2017 [25]. South Africa Reserve Bank Quarterly Bulletin [21]. |
| Government | South Africa Reserve Bank Quarterly Bulletin [21]. General Household Survey (2017) [25]. Supply and Use Tables for 2017 [22]. Data for product and income taxes for 2017 [28]. |
| Capital | Supply and Use Tables for 2017 [22]. South Africa Reserve Bank Quarterly Bulletin [21]. |
| International trade | Supply and Use Tables (SUT) for 2017 [22]. Data for exports and imports for 2017 [29]. South Africa Reserve Bank Quarterly Bulletin [21]. |
Source: Authors’ compilation.
4. User Notes
This dataset is of paramount importance to policymakers, stakeholders, and academia. In addition, the data can be modified through disaggregation of the sectors to suit the purpose of the research. The dataset could be transformed into models such as Computable General Equilibrium (CGE) and multiplier models.
The SAM plays a vital role in terms of the potential impact of water prices/taxes and electricity tariffs on agricultural sectors in the economy of Limpopo Province. Limpopo Province is an exciting province for evaluating the relationship between irrigation and non-irrigation in various districts and the distribution of incomes because the South African government has designated their role to inject money into irrigation infrastructure in various districts that are facing challenges of water.
5. Conclusions
The purpose of the SAM is to improve the quality of the database for modelling, including, but not limited to, policy analysis, multiplier analysis, price analysis, and Computable General Equilibrium (CGE). This article contributes to constructing the 2017 national SAM for South Africa, incorporating regional accounts. Only in Limpopo Province are agricultural industries, labour, and households captured at the district level, while agricultural industry, labour, and household accounts in other provinces remain unchanged. The primary data sources for constructing a SAM are found in different sources such as the Supply and Use Tables (SUT), National Accounts, Census of Commercial Agriculture, Quarterly Labour Force Survey (QLFS), South Africa Revenue Service (SARS), Global Insight (regional explorer), and South Africa Reserve Bank (SARB). The significance of a SAM is that it displays a full circular flow of all details and other missing information in the SUT.
The dataset recorded that land returns for irrigation agriculture were highest in the Northern Cape, with about 18.2%, compared to other provinces. In contrast, the Free State rainfed agriculture had the largest shares (22%) for payment to land. Regarding intermediate inputs, rainfed agriculture in the Western Cape, Free State, and KwaZulu-Natal paid approximately 0.4% for using intermediate inputs. In terms of the districts, land returns for irrigation were highest in the Vhembe district at 0.3%. Despite Mopani having the lowest land returns for irrigation agriculture, it has the highest share (1.6%) of payment to land from rainfed agriculture.
The trade sector had the highest share (42%) of commodities exported to the rest of the world, whereas agriculture exported only 20% of its commodities to other countries. The manufacturing and community service sectors had a trade deficit of ZAR 440 million and ZAR 11 million, respectively. In contrast, other sectors (such as agriculture, mining, food processing, construction, trade services, transport services, and financial services) within the economy experienced a trade surplus.
The main challenges found in developing a SAM are scarcity of data to attain the information needed for disaggregation for the sub-matrices and insufficient information from different data sources for estimating missing information to ensure the row and column totals of the SAM are consistent and complete. Specific challenges are as follows:
- ❖
- The 2017 QLFS does not provide detailed information for disaggregated sectors; it only records information in the aggregated format. In addition, the QLFS does not incorporate information for labour remuneration from the district level.
- ❖
- Detailed data on the agricultural sector at a regional level in South Africa are difficult to find and often released based on the period of agricultural surveys and the detailed information mentioned in the surveys. It is challenging to obtain all the required information to construct a SAM.
Author Contributions
Conceptualization, methodology, validation, formal analysis, investigation, resources, data curation, writing—original draft preparation, visualization, and final version of the manuscript, R.P., Y.T.B. and H.J. All authors have read and agreed to the published version of the manuscript.
Funding
This research received no external funding.
Institutional Review Board Statement
Not applicable.
Informed Consent Statement
Not applicable.
Data Availability Statement
The original data presented in the study are openly available at: https://doi.org/10.38140/ufs.24032457.v1 (accessed on 2 August 2024) and in https://doi.org/10.3390/agriculture14071086 (accessed on 2 August 2024).
Conflicts of Interest
The authors declare no conflicts of interest.
Abbreviations
The following abbreviations are used in this manuscript:
| CGE | Computable General Equilibrium |
| DBSA | Development Bank of Southern Africa |
| EC | Eastern Cape |
| FS | Free State |
| GHS | General Households Survey |
| GOS | Gross Operating Surplus |
| GP | Gauteng |
| HHD | Household |
| IFPRI | International Food Policy International Research |
| KZN | KwaZulu-Natal |
| LCS | Living Condition Survey |
| MP | Mpumalanga |
| NC | Northern Cape |
| PROVIDE | Provincial Decision-Making Enabling |
| QLFS | Quarterly Labour Force Survey |
| SAM | Social Accounting Matrix |
| SARB | South Africa Reserve Bank |
| SARS | South Africa Revenue Service |
| StsaSA | Statistics South Africa |
| SUT | Supply and Use Tables |
| WC | Western Cape |
| ZAR | R is the South African Rand, the national currency of South Africa |
Notes
| 1 | Conningarth Economists is a consulting firm that specializes in quantitative economic analysis in several fields, including, but not limited to, models based on standard input and output analysis, Social Accounting Matrix (SAM), macro-economic impact analysis, Computable General Equilibrium, and cost–benefit analysis. |
| 2 | R is the national currency of South Africa—Rand (ZAR). |
References
- Punt, C. Modeling Multi-Product Industries in Computable General Equilibrium (CGE) Models. Ph.D. Thesis, Department of Agriculture Economics, University of Stellenbosch, Stellenbosch, South Africa, 2013. [Google Scholar]
- Round, J. Social Accounting Matrix and Social Accounting Matrix-based multiplier analysis. In The Impact of Economic Policies on Poverty and Income Distribution: Evaluation Technique and Tools; World Bank: Wahington, DC, USA, 2003. [Google Scholar]
- PROVIDE. Social Accounting Matrices and Economic Modelling; Background Paper 2003:4; Provincial Decision-Making Enabling (PROVIDE) Project: Elsenburg, South Africa, 2003. [Google Scholar]
- Taljaard, P.R. The Macro Economy and Irrigation Agriculture in the Northern Cape Province of South Africa. Ph.D. Thesis, University of the Free State, Bloemfontein, South Africa, 2007. [Google Scholar]
- PROVIDE. Compiling National, Multiregional, and Regional Social Accounting Matrices for South Africa; Background Paper 2006:1; Provincial Decision-Making Enabling (PROVIDE) Project: Elsenburg, South Africa, 2006. [Google Scholar]
- Davies, R.; Thurlow, J. 2009 Social Accounting Matrix (SAM) for South Africa; International Food Policy Research Institute (IFPRI): Washington, DC, USA, 2013. [Google Scholar]
- Van Seventer, D.; Hartley, F.; Gabriel, S.; Davies, R. A 2012 Social Accounting Matrix (SAM) for South Africa; United Nations University World Institute for Development Economics Research (UNU-WIDER): Helsinki, Finland, 2016. [Google Scholar]
- Van Seventer, D.; Bold, S.; Gabriel, S.; Davies, R. A 2015 Social Accounting Matrix (SAM) for South Africa; United Nations University World Institute for Development Economics Research (UNU-WIDER): Helsinki, Finland, 2019. [Google Scholar]
- Van Seventer, D.; Davies, R. A 2016 Social Accounting Matrix (SAM) for South Africa with an Occupationally Disaggregated Labour Market Representation; United Nations University World Institute for Development Economics Research (UNU-WIDER): Helsinki, Finland, 2019. [Google Scholar]
- Phoofolo, M.L. Analysis of the Economic Impact of a Disaggregated Agricultural Sector in South Africa: A Social Accounting Matrix (SAM) Multiplier Approach. Master’s Thesis, Department of Agriculture Economics, University of Stellenbosch, Stellenbosch, South Africa, 2018. [Google Scholar]
- StatsSA. Final Social Accounting Matrix for South Africa 2002; Report No. 04-03-02 (2002); Statistics South Africa (StatsSA): Pretoria, South Africa, 2006. [Google Scholar]
- StatsSA. Linking the Social Accounting Matrix to Existing Government Strategies for South Africa; Statistics South Africa (StatsSA): Pretoria, South Africa, 2008. [Google Scholar]
- StatsSA. Final Social Accounting Matrix for South Africa 2005; Report NO. 04-030-02 (2005); Statistics South Africa (StatsSA): Pretoria, South Africa, 2010. [Google Scholar]
- StatsSA. Final Social Accounting Matrix 2011 for South Africa; Report NO. 04-03-02 (2011); Statistics South Africa (StatsSA): Pretoria, South Africa, 2016. [Google Scholar]
- Conningarth Economist. Social Accounting Matrix (SAM) for Limpopo 2006; Connigarth Economist: Pretoria, South Africa, 2015. [Google Scholar]
- Conningarth Economist. Social Accounting Matrix (SAM) for Kwazulu-Natal 2018; Connigarth Economist: Pretoria, South Africa, 2022. [Google Scholar]
- Aragie, E.; Thurlow, J. 2018 Social Accounting Matrix for Ethiopia: A Nexus Project SAM; International Food Policy Research Institute (IFPRI): Washington, DC, USA, 2021. [Google Scholar]
- Thurlow, J. 2018 Social Accounting Matrix (SAM) for Nigeria; International Food Policy Research Institute (IFPRI): Washington, DC, USA, 2021. [Google Scholar]
- Aragie, E.; Thurlow, J. 2015 Social Accounting Matrix for Ghana: A Nexus Project SAM; International Food Policy Research Institute (IFPRI): Washington, DC, USA, 2021. [Google Scholar]
- Pradesh, A. 2018 Social Accounting Matrix (SAM) for the Philippines; International Food Policy Research Institute (IFPRI): Washington, DC, USA, 2021. [Google Scholar]
- SARB. National Income and Production Account South Africa—Quarterly Bulletin of Statistics; South Africa Reserve Bank (SARB): Pretoria, South Africa, 2018. [Google Scholar]
- StatsSA. Supply and Use Tables (SUT) for 2017; Statistics South Africa (StatsSA): Pretoria, South Africa, 2018. [Google Scholar]
- StatsSA. Living Conditions Survey 2014/15 Data Set; Statistics South Africa (StatsSA): Pretoria, South Africa, 2017. [Google Scholar]
- Global Insight. South Africa Regional Explorer (Rex); Global Insight: Pretoria, South Africa, 2022. [Google Scholar]
- StatsSA. Data for General Household Survey (GHS) for 2017; Statistics South Africa (StatsSA): Pretoria, South Africa, 2018. [Google Scholar]
- StatsSA. Census of Commercial Agriculture 2017; Statistics South Africa (StatsSA): Pretoria, South Africa, 2020. [Google Scholar]
- StatsSA. Quarterly Labour Force Survey (QLFS) 2017; Statistics South Africa (StatsSA) (Producer): Pretoria, South Africa, 2018. [Google Scholar]
- SARS. Data for Product and Income Taxes for 2017; South Africa Revenue Services (SARS): Pretoria, South Africa, 2018. [Google Scholar]
- StatsSA. P0441-Gross Domestic Product (GDP): Fourth Quarter 2017; Statistics South Africa (StatsSA): Pretoria, South Africa, 2018. [Google Scholar]
Disclaimer/Publisher’s Note: The statements, opinions and data contained in all publications are solely those of the individual author(s) and contributor(s) and not of MDPI and/or the editor(s). MDPI and/or the editor(s) disclaim responsibility for any injury to people or property resulting from any ideas, methods, instructions or products referred to in the content. |
© 2024 by the authors. Licensee MDPI, Basel, Switzerland. This article is an open access article distributed under the terms and conditions of the Creative Commons Attribution (CC BY) license (https://creativecommons.org/licenses/by/4.0/).