Abstract
The continuous developments in information technologies have resulted in a significant rise in security concerns, including cybercrimes, unauthorized access, and cyberattacks. Recently, researchers have increasingly turned to social media platforms like X to investigate cyberattacks. Analyzing and collecting news about cyberattacks from tweets can efficiently provide crucial insights into the attacks themselves, including their impacts, occurrence regions, and potential mitigation strategies. However, there is a shortage of labeled datasets related to cyberattacks. This paper describes CybAttT, a dataset of 36,071 English cyberattack-related tweets. These tweets are manually labeled into three classes: high-risk news, normal news, and not news. Our final overall Inner Annotation agreement was 0.99 (Fleiss kappa), which represents high agreement. To ensure dataset reliability and accuracy, we conducted rigorous experiments using different supervised machine learning algorithms and various fine-tuned language models to assess its quality and suitability for its intended purpose. A high F1-score of 87.6% achieved using the CybAttT dataset not only demonstrates the potential of our approach but also validates the high quality and thoroughness of its annotations. We have made our CybAttT dataset accessible to the public for research purposes.
Keywords:
cyberattacks; dataset; labeling; tweets; classification; machine learning; large language models 1. Introduction
Generally, cyberattacks are deliberate attempts to gain unauthorized access to networks, devices, or systems, often to steal sensitive data, target customers, or compromise payment networks [1,2,3,4]. This results in direct financial losses, damage to brands, and loss of customer’s trust [5,6]. Themost common types of cyberattacks are malware, Trojans, Phishing, Denial of Service (DoS), adware, and Structured Query Language (SQL) injection [7,8]. The continuously increasing numbers of cyberattacks motivated researchers to continuously collect data about new types of attacks or news about current attacks to analyze their effects, occurrence regions and how to deal with them. This has been performed recently using social media platforms, such as Facebook and X1, due to their broad usage by people from all around the world to communicate, send messages, share information, and interact with each other [9,10]. According to statistics reported in 2021, around 4.48 billion people from all around the world use social media platforms, which means that social media users form about 57% of the world’s population.
Most users post about events before or during their occurrence, and hence researchers tend to collect up-to-date news about cyberattacks using social media platforms. Among those platforms, X platform is the fastest, easiest, and most brief way to connect with other users using short words. It is also the most valued, popular, and better platform for business purposes when compared to other social networks. In contrast to the visually-driven nature of Instagram and the personal/familial focus of Facebook, X emerges as a platform for real-time information consumption and discourse exploration. X explores breaking news, uncovers insightful threads, empowers the written word and lets you dive into real-time updates on any topic, showcasing curated timelines overflowing with diverse thoughts and ideas [7]. Moreover, X is deployed by almost all experts and famous personalities, as well as all registered users have verified accounts to prove they are trustworthy [11].
The proliferation of social media platforms has led to a surge in cyberattack news being shared daily. For instance, X platform users generate around 500 million tweets every day [11]. Despite this abundance of data, there is a dearth of datasets specifically designed for classifying cyberattack-related tweets as news or non-news. To address this gap, this paper introduces CybAttT, a curated dataset of cyberattack-related tweets collected using the X platform API and rigorously labeled as high-risk news, normal news, and non-news. This dataset serves as a valuable resource for evaluating the performance of various classification models trained on supervised learning algorithms.
To ensure the robustness and reliability of the CybAttT dataset, we employed supervised learning techniques to conduct thorough validation. This process involved training a series of classification models using the labeled data and subsequently evaluating their performance on a separate set of unlabeled tweets. The high accuracy achieved by these models demonstrated the effectiveness of the labeling process and the overall quality of the dataset. This validation step provided valuable confirmation that the CybAttT dataset accurately reflects the real-world distribution of cyberattack-related tweets and can be confidently utilized for further research and development in the field of cyberattack detection and classification.
This paper presents two significant contributions to the field of cyberattack detection and classification:
- Creation of CybAttT2: CybAttT is a novel dataset comprising the most recent cyberattack-related tweets painstakingly labeled as high-risk news, normal news, and non-news. This dataset alleviates the scarcity of resources for classifying cyberattack-related tweets and serves as a valuable foundation for future research.
- Evaluation of Machine Learning and transformers-based Models: By employing supervised learning techniques, we constructed and evaluated a diverse range of classification models utilizing machine learning and transformers-based models [12]. The performance of these models on the CybAttT dataset provides valuable insights into the effectiveness of various classification approaches for identifying cyberattack-related tweets.
The rest of this paper is organized as follows: Section 2 provides a comprehensive review of the state-of-the-art literature relevant to the proposed research. Section 3 details the data collection methodology employed in the construction of the CybAttT dataset. Section 4 delves into a thorough exploration of various classification models and stages. Section 5 encompassing an in-depth analysis of the experimental setup and results. This section presents the implementation of both supervised learning algorithms and fine-tuned transformer-based models, followed by a critical discussion of the overall findings and their implications. Finally, Section 6 concludes the paper by summarizing the research’s contributions and suggesting potential avenues for future research, aimed at further advancing the field.
2. Related Works
Analyzing disruptive events published on social media platforms, particularly X platform, offers a unique opportunity to capture and understand real-time events as they unfold [13,14]. This approach enables researchers to readily identify the names, locations, and timestamps of these events. Consequently, researchers have focused on collecting and classifying X-based cyberattack-related tweets using various machine learning and deep learning algorithms. Machine learning is a branch of Artificial Intelligence (AI) that focuses on using algorithms and computational methods to imitate the human learning process and learn directly from input data with no need for predetermined equations [15,16,17,18,19].
In [20], Le et al., proposed an automated model to classify tweets as relevant or irrelevant to cyberattacks using a novel one-class Support Vector Machine (SVM) classifier. They initially collected tweets from 50 cybersecurity-related accounts over one year. Subsequently, they preprocessed the collected tweets to remove unnecessary terms such as numbers, stop words, hyperlinks, mentions, and hashtags. Next, they extracted features from the preprocessed data using the Term Frequency-Inverse Document Frequency (TF-IDF) technique. The results demonstrated that the F1-score of the one-class Support Vector Machine (SVM) classifier was 0.643.
In 2019, Ghankutkar et al. [21] proposed the classification of real-time cyber-attack data published in the internet news. Researchers deployed three machine learning based classification models, including: Support Vector Machine (SVM), Multinomial Naïve Bayes (MNB), and Random Forest (RF). The data were classified into crime and non-crime. The highest recorded accuracy was for the Random Forest (RF) model with 85.83%. Arora et al. [22] proposed the use of Random Forest (RF) based classification model to detect and classify cyber threats automatically from public data posted on Twitter. Results revealed that the proposed model achieved an accuracy of 80%.
Another recent work by Mahaini et al. [23] produced several machine learning-based classification models to detect cybersecurity-related accounts on X. The X platform Sampling Application Programming Interface (API) was used to collect tweets that include cybersecurity related discussions. Tweets collected are manually labeled into related and non-related accounts. The labeled dataset was then fed into a baseline classifier to classify general cybersecurity related accounts. Next, three other sub-classifiers are considered to classify related accounts into three types; individuals, hackers, and academia. Due to the construction of several classifiers, a rich set of features was defined, where each type of features measures one useful aspect of a X platform account to train and test four machine learning models; Decision Tree (DT), Random Forest (RF), Support Vctor Machine (SVM), and Logistic regression (LR). The best revealed performance was for the RF model with 93% accuracy for the baseline classifier and 88–91% accuracy for the three sub-classifiers.
In [24], researchers proposed the Darkintellect approach to detect cyberattacks from tweets using machine learning algorithms. Around 21,000 tweets relative to cyberattacks are initially collected using a python package Tweepy3. Tweets are then preprocessed to remove descriptions and special characters using a stop word remover and Natural Language Processing (NLP) toolkit. The TF-IDF approach was then used to extract feature values suitable for classification. Five machine learning algorithms are applied; SVM, RF, DT, eXtreme Gradient Boosting (XGBoost) and Adaptive Boosting (AdaBoost). The performance comparison among the five algorithms revealed that the DT algorithm outperformed other algorithms with 87.54% classification accuracy.
Other researchers tend to apply deep learning algorithms to classify cyberattack-related tweets [25,26]. Those algorithms can process unstructured data, as texts and images with automated feature extraction process and without dependency on human experts. Researchers in [25] presented a framework to detect and classify cyberattacks related events from X using a cascaded Convolutional Neural Network (CNN) architecture. The model comprises two Convolutional Neural Network (CNN) models: a binary classifier for detecting cyber-related tweets and a multi-class classifier for categorizing them into specific cyber threat types. Approximately 21,000 cyber-related tweets are collected, preprocessed, and annotated as either relevant or irrelevant tweets. All annotated tweets are initially evaluated by the binary Convolutional Neural Network (CNN) classifier. Relevant tweets are then fed into the multi-class Convolutional Neural Network (CNN) classifier for categorization into various types, including Distributed Denial-of-Service (DDoS), 0-day, vulnerability, ransomware, data leak, and marketing/general. An average F1-score of 0.82 was achieved by the model.
In [26], researchers used a deep neural network to process cyberattack-related tweets. Tweets are collected using the X platform streaming Application Programming Interface (API) and then filtered using a set of user-defined keywords that describe cyber threats to drop irrelevant tweets. Subsequently, all filtered tweets underwent preprocessing, which involved converting characters to lowercase and removing hyperlinks and special characters. The CNN classifier effectively identifies tweets containing security-related information. By analyzing the semantic and contextual patterns of the tweets, the CNN classifier accurately discerns those that convey security-related topics. The proposed model revealed an average of 94% true positive rate and 91% true negative rate for the classification of tweets.
Coyac-Torres et al. [27] presented an approach that based on both NLP and a CNN architecture to detect and classify four types of cyberattacks from social network messages; malware, phishing, spam, and bot attack that aims to bot attack messages to other users. The main feature of this work is the analysis of textual content without depending on the characteristics of social networks. This in turn makes the analysis independent on specific data sources. The proposed model was tested using real data, and conducted in two stages. In the first stage, the presence of any of the four types of cyberattacks in the message is detected. Next, it classified by the model as one of the four types of cyberattack. Results revealed an accuracy of 82%.
In a summary, the collection of cyber-attacks tweets is helpful to collect up-to-date cyber-attacks news and detect new attacks with recognizing their region and time of occurrence. Moreover, the use of machine and deep learning algorithms revealed promising results for classifying relative cyber-attacks news from irrelative ones.
Table 1 shows a comparison between the reviewed state-of-the-art models in terms of the content of data collected, used dataset, the classification techniques used, and the recorded F1-score. It can be noticed that some of the reviewed machine learning and deep learning based models have been applied to datasets including small numbers of collected tweets, such as the models proposed by Deshmukh et al. [24] and Behzadan et al. [25]. Moreover, the reviewed research studies have focused on applying either machine learning algorithms, as the models proposed by Le et al. [20], Ghankutkar et al. [21], Arora et al. [22], Mahaini [23], and Deshmukh et al. [24], or deep learning algorithms, as the models proposed by Behzadan et al., Behzadan, Dionísio et al. [26], and Coyac-Torres et al. [27]. There are no comparisons conducted between both learning types to discover the most adequate learning algorithm for the proposed cybersecurity data classification models.

Table 1.
Comparison of four key aspects of the reviewed related works: data collection contents, datasets, classification techniques, and results.
Hence, those limitations gaps are covered in this paper by building a larger dataset that includes latest tweets posted about cyber-attacks. As well, different classification models were created using machine learning and deep learning algorithms to classify the dataset, where those models are compared to find out the classification algorithm that reveals the best classification performance.
Gathering cyberattack-related tweets proves invaluable for collecting real-time cyberattack news and identifying emerging threats by pinpointing their location and timestamps. Furthermore, employing machine and deep learning algorithms has demonstrated promising results in accurately distinguishing relevant cyberattack-related news from irrelevant content.
3. Data Collection and Preparation
This section deeply explains the process used to create the CybAttT dataset, a crucial resource for evaluating the performance of automated classification models trained on supervised learning algorithms. The dataset development process encompasses data collection, preprocessing, and labeling, ensuring the quality and reliability of the data utilized for experimentation [28,29,30].
3.1. Data Collection
The data collection stage is the foundation upon which the CybAttT dataset is built. It encompasses two critical steps: data source and keyword selection, and data cleaning and filtering. These steps ensure the quality and relevance of the data gathered for the dataset.
3.1.1. Data Source and Keyword Selection
The data collection process commences with an extensive keyword search, curated based on thorough research and experimentation. The input string incorporates a general keyword representing the attack type, which is dynamically handled as a variable within the system. This flexibility allows for seamless modification or addition of attack types in the future. In practice, the keyword encompasses three fundamental attack categories: data breach, cyber breach, and cyberattack:
- Data breach: A security incident in which personal data are illegally accessed.
- Cyber breach: It is a breach causing accidental or unlawful destruction, unauthorized access or disclosure to personal data, or loss or alteration of personal data that are transmitted, saved, or processed, such as misdelivered messages and unencrypted email transmissions.
- Cyberattack: It is broader than a data breach. As well it is deliberate and considered more disruptive to business. The most common types of cyberattacks are malware, Denial of Service (DoS), Distributed DoS (DDoS), Phishing, Ransomware, password attacks, poor security, spam, and SQL injection.
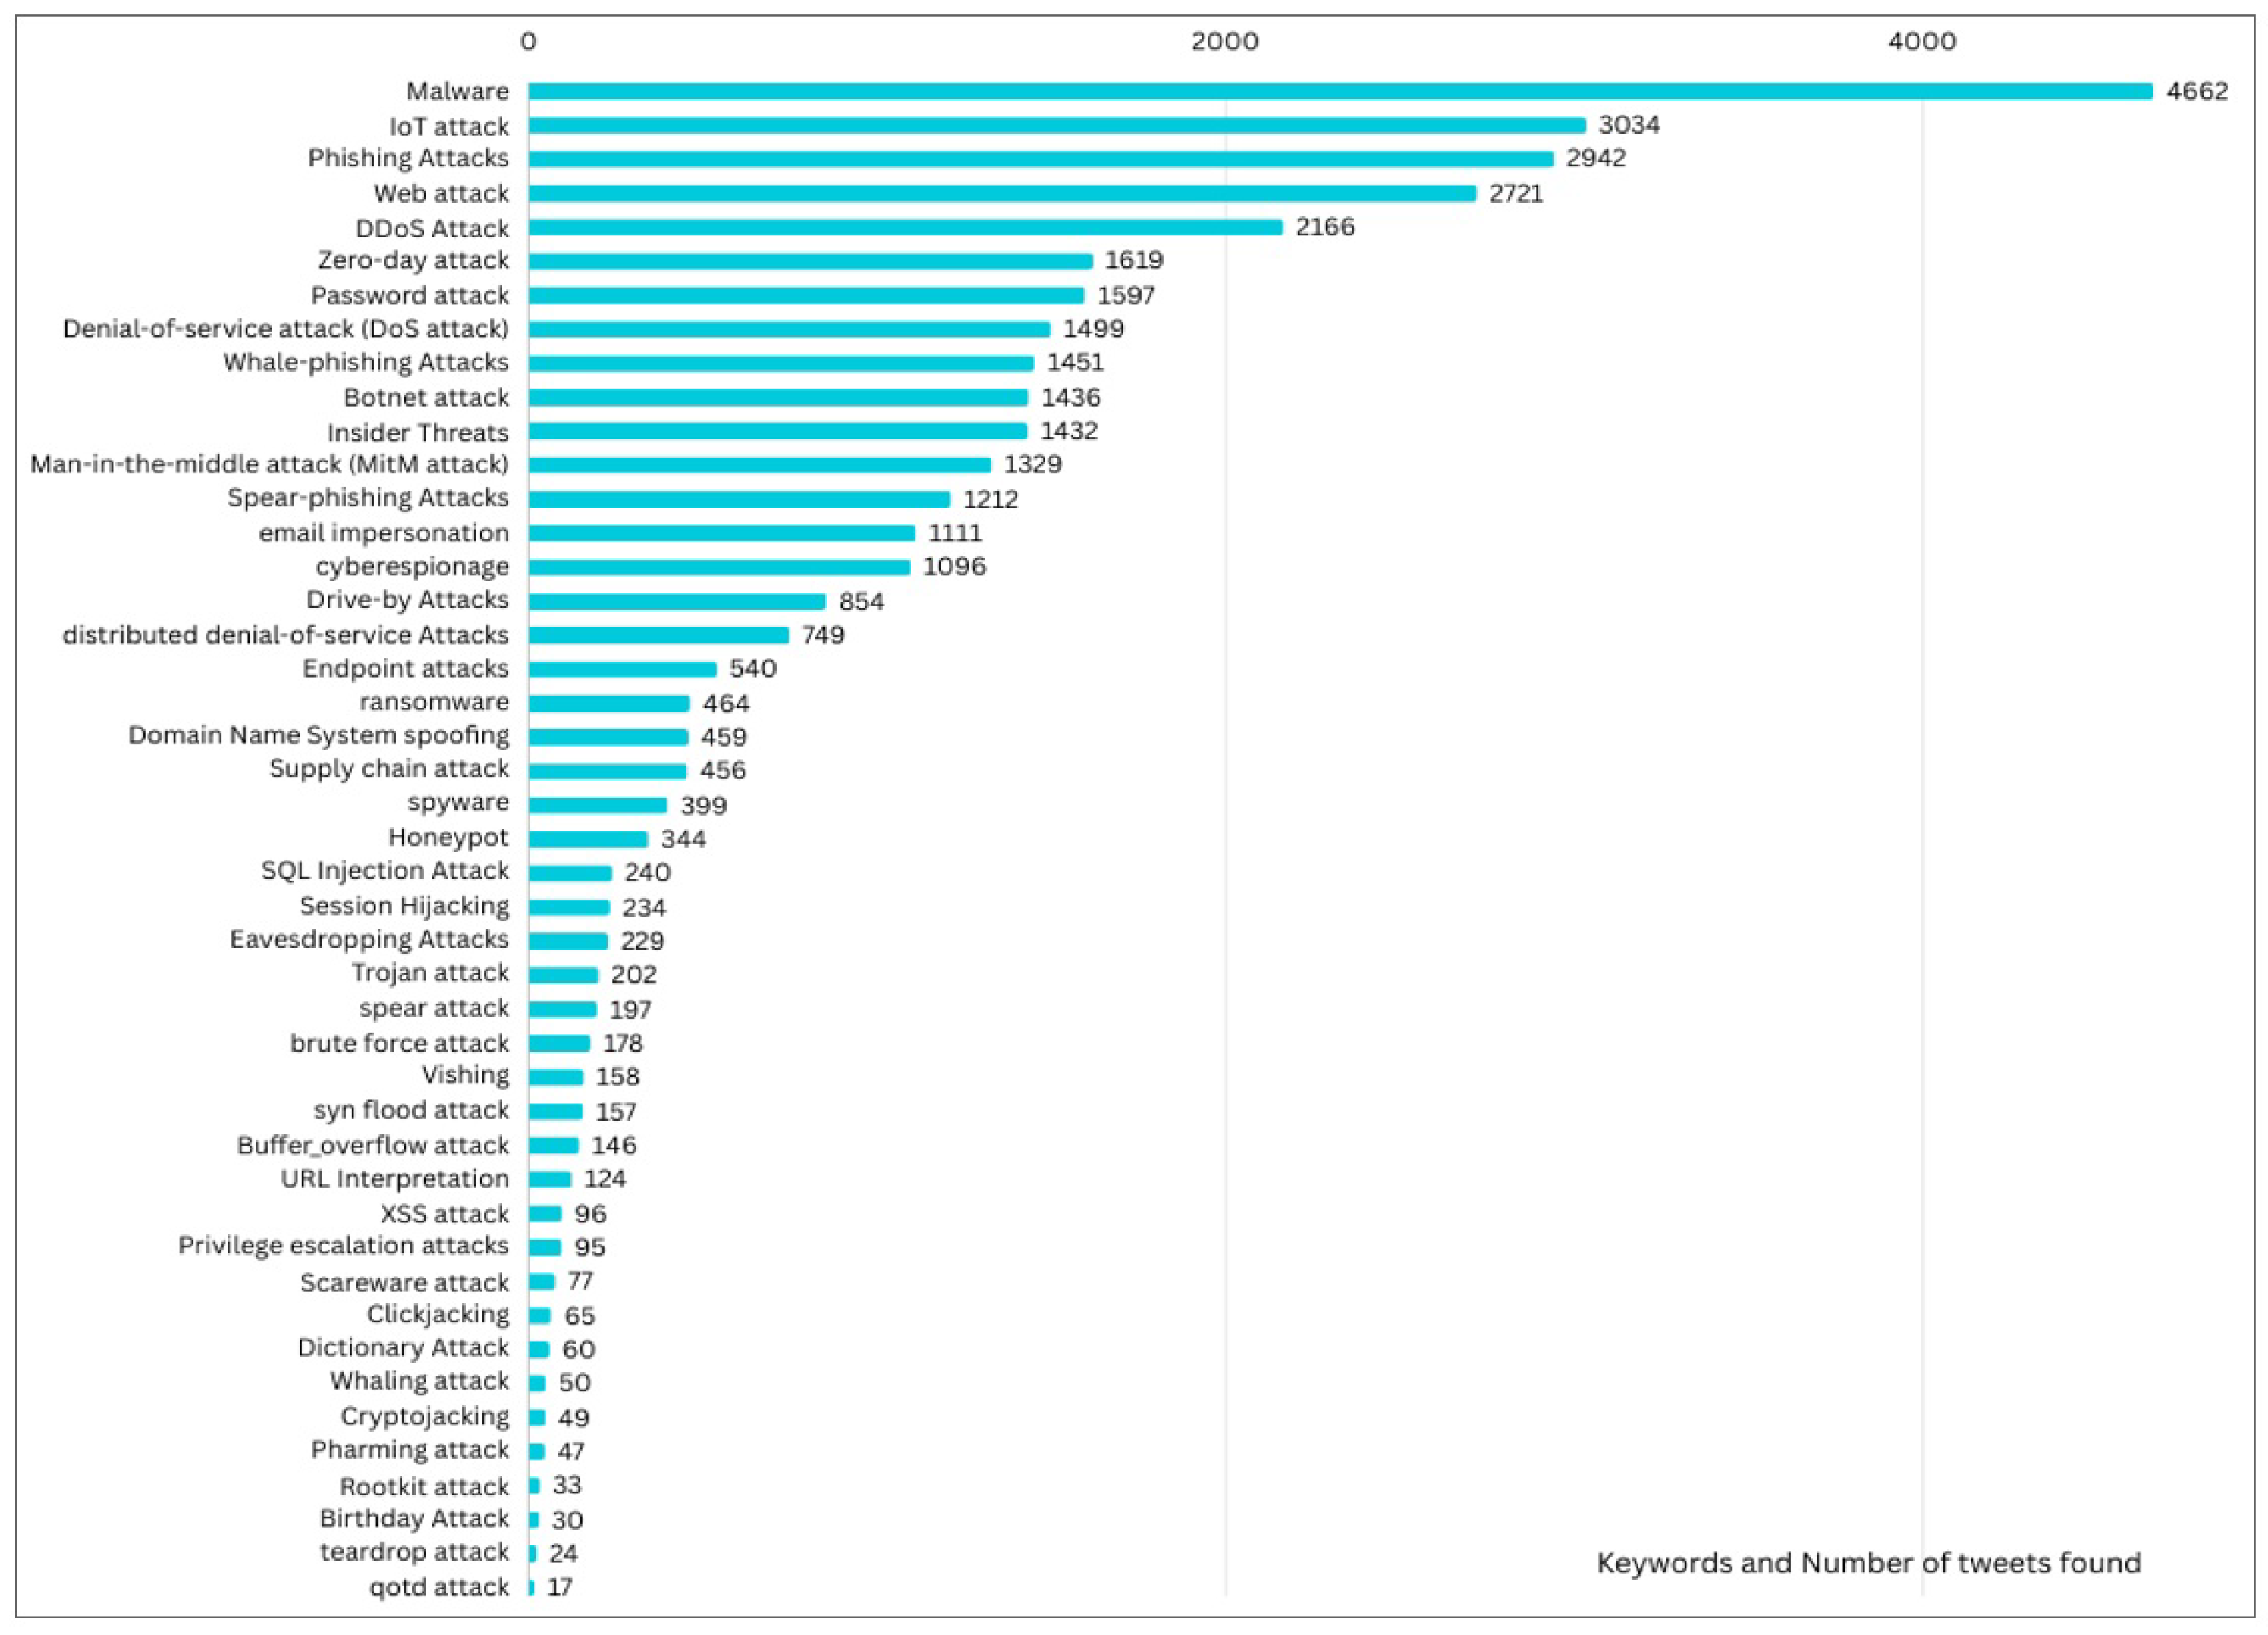
Hence, the CyAttT dataset was collected by searching for any posted tweet on X platform using 45 keywords (Figure 1) related cyberattacks, data breach, and cyber breach. This results in a total of 40,000 tweets related to cyberattack that returned using the X platform Application Programming Interface (API).

Figure 1.
Bar chart of keyword frequency in cyberattack-related tweets: This figure shows the the number of tweets containing for each used keyword.
3.1.2. Data Cleaning and Filtering
To guarantee the accuracy and precision of the CybAttT dataset, all collected tweets undergo a cleaning and filtering phase involving the indentification and removal of both exact tweet duplicates and retweets. This process mitigates potential biases arising from the overrepresentation of specific opinions or content.
Through this cleaning and filtering process, the initial dataset of 40,000 tweets is refined to a curated collection of 36,080 filtered tweets. This refined dataset exclusively comprises cyberattack-related information, laying the foundation for accurate and reliable analysis.
3.2. Data Labelling
The data labeling phase involved a process of assigning relevant labels to the 36,080 pre-processed tweets. Three volunteer annotators, all CS graduate students, labeled the dataset manually. To enhance labeling efficiency and consistency, the Label Studio from Microsoft Azure was employed as an assistive tool. The data labeling process encompassed three core steps: annotation guidance, annotation agreement, and label distribution, as detailed in the following subsections.
3.2.1. Annotation Guidance
The annotation task is a critical step in the development of the CybAttT dataset, as it involves classifying each tweet into one of three distinct categories: not-news, normal-news, or high-risk-news. This categorization is essential for training and evaluating machine learning models for cyberattack detection:
- Not-News class: It is an event that is not related to any cybersecurity news.
- Normal News class: the tweets mentioned a cybersecurity event, where the tweet contains a specific attack type that was happened or is happening recently.
- High-risk-news class: It is an alert announced by an official agency about an expected occurrence of attacks or a wide spread of current attacks. It is also a cybersecurity event that is described by an official agency as a highly dangerous or harmful one.
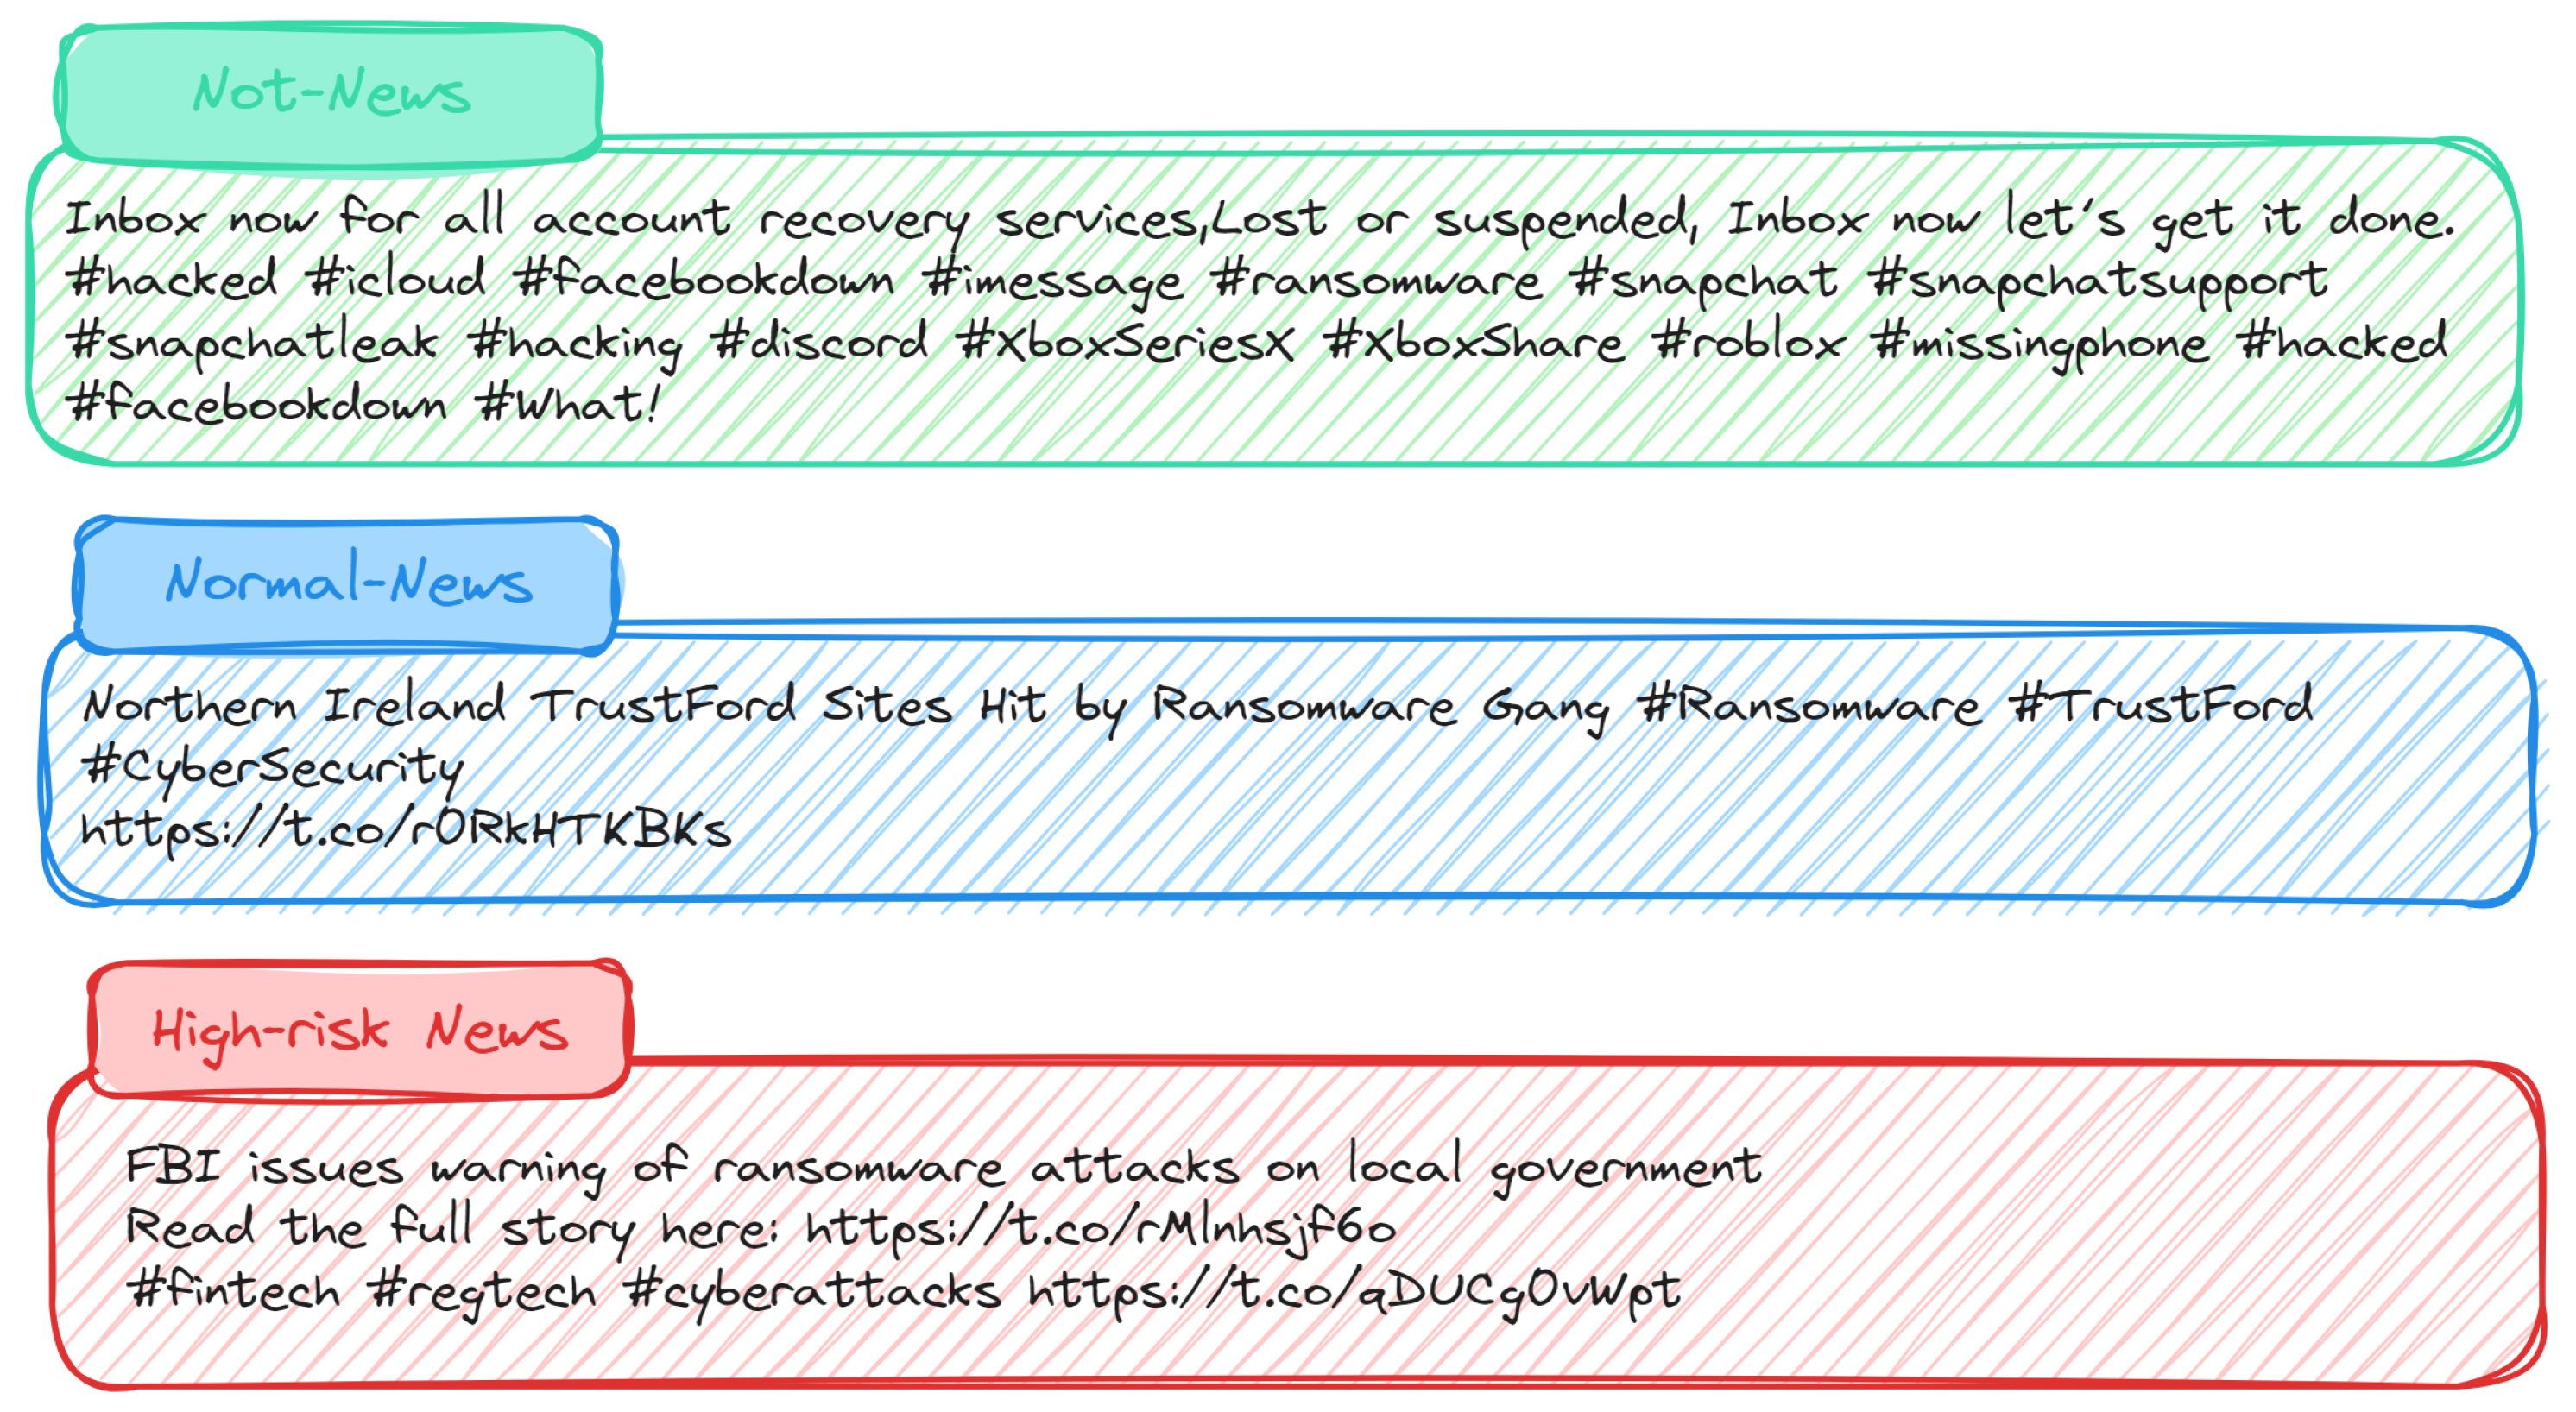
The following Figure 2 represents tweet samples across the three different categories.
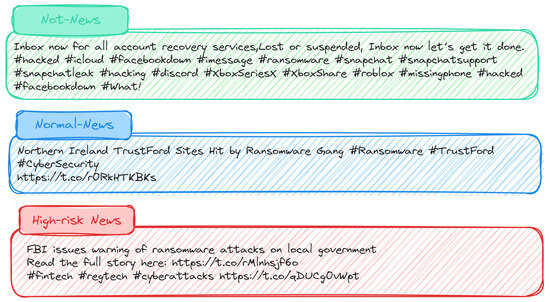
Figure 2.
Representative tweet samples across categories: This figure showcases three tweet examples, each illustrating a distinct category within our dataset.
3.2.2. Annotation Agreement
The annotators were provided with the guidance and examples explaining different classes at the beginning of the annotation task. The 36,080 tweets were extracted into a CSV file, and uploaded into the Microsoft Azure data labelling tool. For each tweet, two types of data are provided; ID and text. Each tweet is labelled into one of the three labels discussed above; not-news, normal-news, or high-risk-news. The three annotators labelled the text of each tweet. To mitigate potential conflicts and ensure consistency, a majority voting approach was employed. In cases where annotators assigned two different labels to a tweet, the label with the highest votes (chosen by at least two annotators) was selected as the final label. This process resulted in a refined dataset of 36,071 pre-processed and labeled tweets.
To evaluate the reliability of the annotation process, the inter-annotator agreement was assessed using Fleiss’ kappa [31], It is measure of inter-rater agreement deployed to find the agreement level among two or more raters when the assessment method, called the response variable, is measured on a categorical scale. The Fleiss’ kappa interpretation can be summarized as follows [32]: Slight agreement (<0.20), Fair agreement (0.21–0.40), Moderate agreement (0.41–0.60), Substantial agreement (0.61–0.80), and Perfect agreement (0.81–1).
The obtained results from the three annotators demonstrated a remarkable level of agreement, with only nine tweets requiring exclusion due to conflicting labels among the annotators. Table 2 below presents a detailed breakdown of the resulting label distribution. After excluding nine tweets due to conflicting annotations, the final CybAttT dataset comprises 36,071 tweets.
Table 2.
Statistics of labels; high risk news, normal news and not news in terms of the number of tweets and kappa result.
4. Cyberattacks-Related News Classification Models
In the classification stage, machine learning algorithms and transformer-based models are used to classify the collected cyberattack-related tweets. The proposed classification model has four primary stages: data pre-processing, feature representation, classification, and performance evaluation.
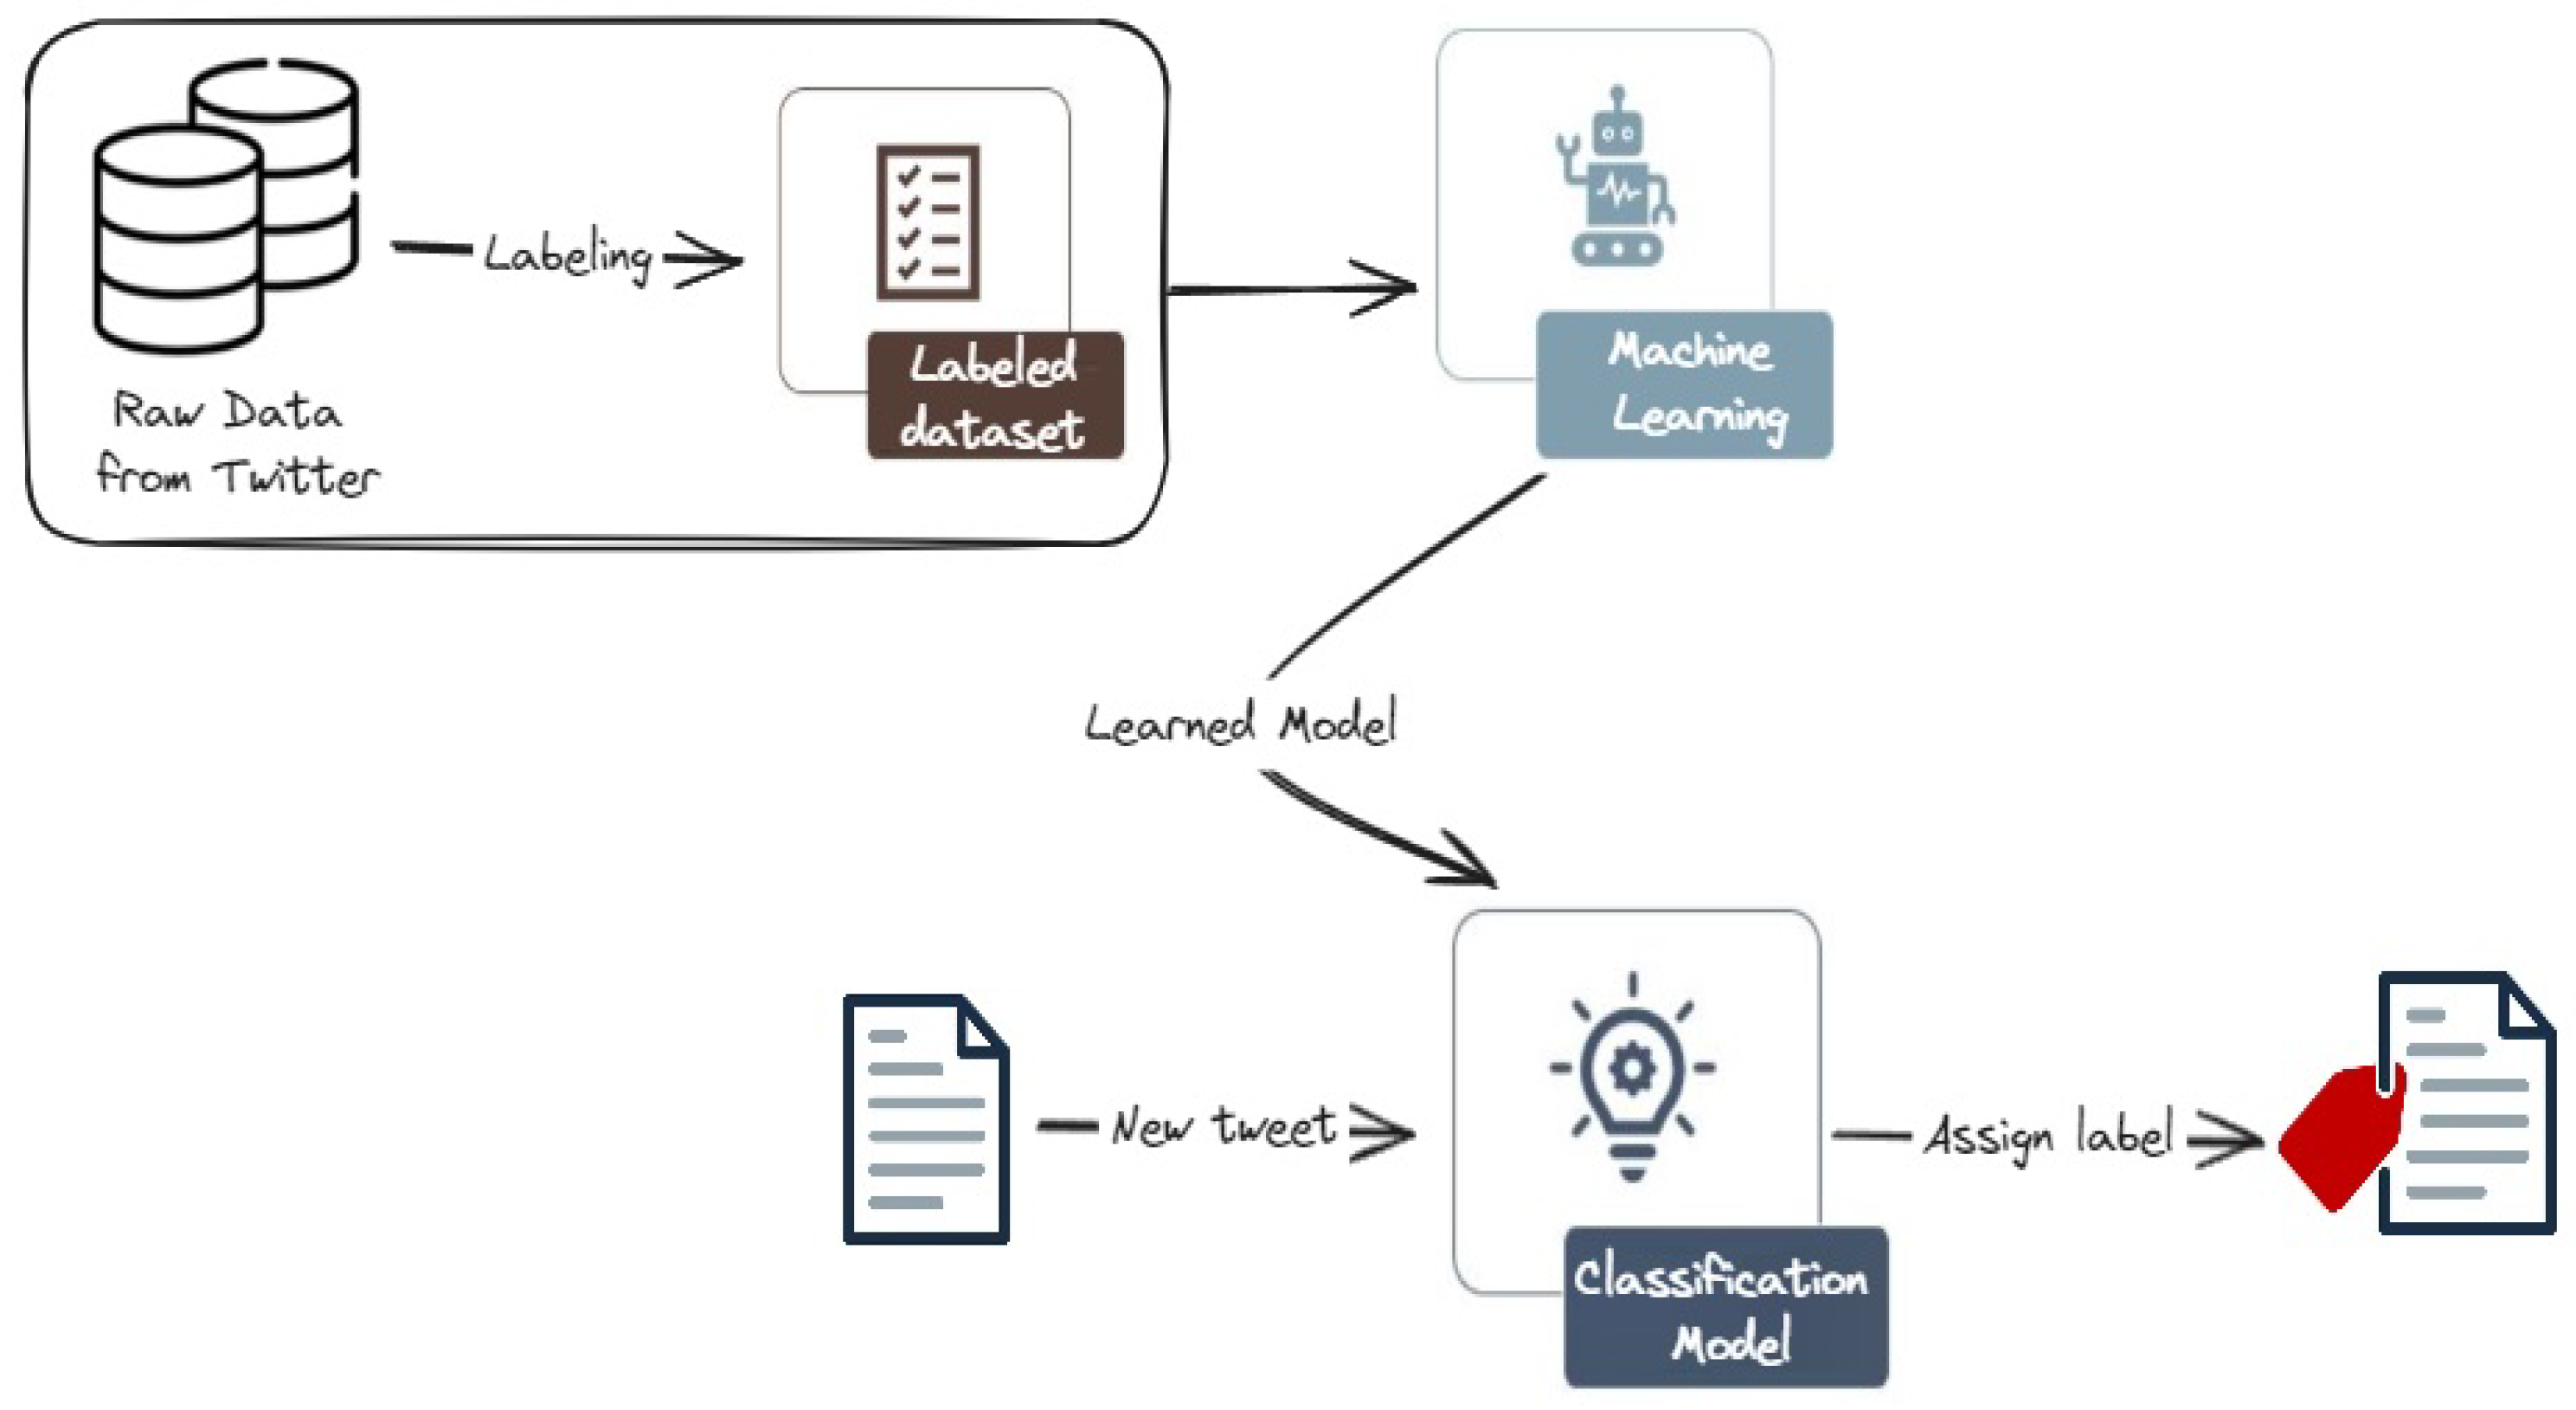
Figure 3 depicts the architecture of the machine learning-based models. After collecting and labeling the dataset, the pre-processed data is fed into a feature extraction module, which generates numerical representations for each tweet. These features are then used to train a chosen machine learning classifier, such as Support Vector Machines (SVM) or Random Forest. These models are then used to classify new tweets.
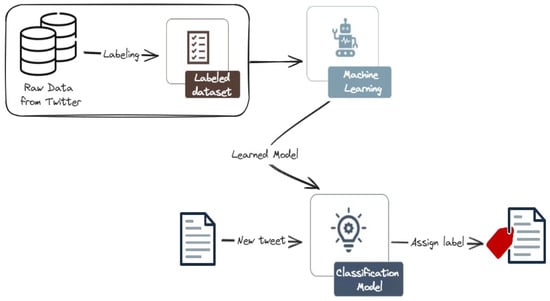
Figure 3.
Machine learning (ML) approach for cyberattack-related tweets classification. We first collect and annotate a rich dataset, then train and evaluate various ML models. The classification model is then used to classify new tweets into one of the three classes.
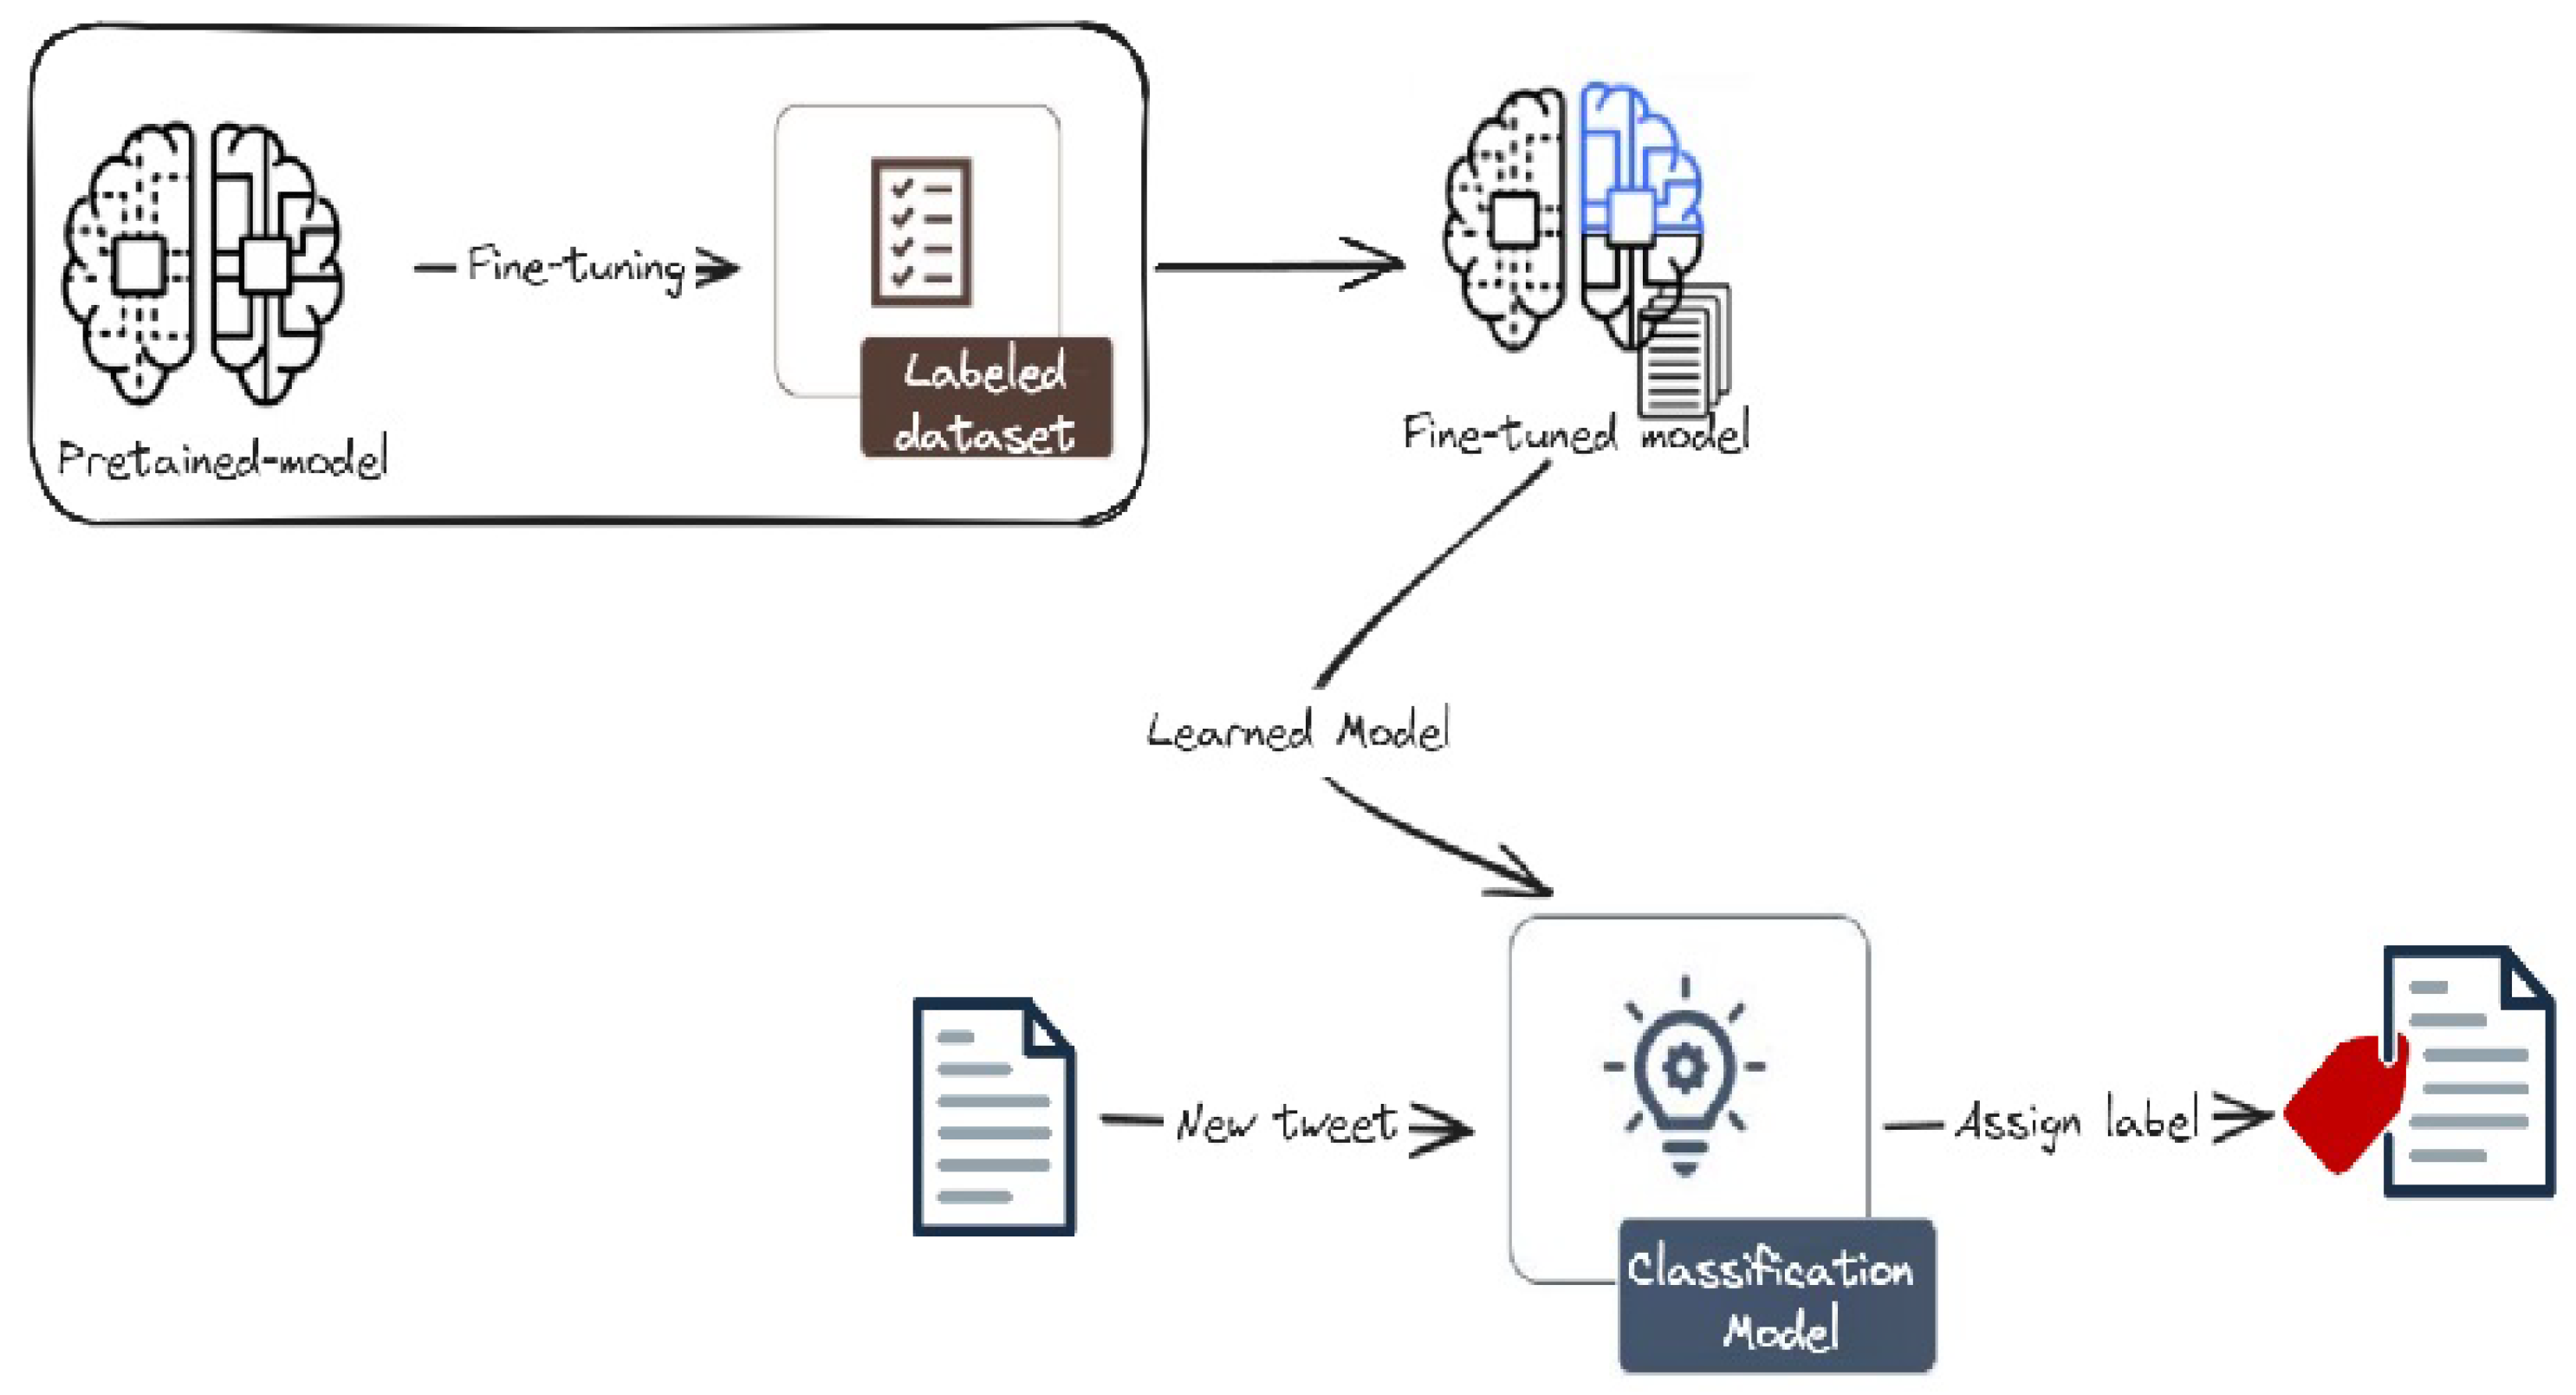
Figure 4 presents the architecture of the transformer-based models. These models utilize pre-trained LLMs like BERT, RoBERTa, or DistilBERT, which have been trained on massive datasets of text and code. This pre-trained knowledge allows the models to extract rich semantic information from the tweets. Subsequently, a fine-tuning process is applied, where the pre-trained LLM is further trained on the specific domain of cyberattacks, enabling it to effectively classify the tweets.

Figure 4.
Finetuning approach for cyberattack-related tweets classification. We first collect and annotate a rich dataset, then finetune and evaluate various LLM models. The classification model is then used to classify new tweets into one of the three classes.
The collected data is utilized in distinct experiments. In all experiments, the dataset is splited into 80% training set and 20% testing set. Then, the four stages of the proposed classification models are explored.
4.1. Pre-Processing Stage
Data pre-processing involves transforming raw data into a structured format suitable for analysis. The following pre-processing steps are applied to the collected data:
- Cleaning all pronouns and emojis using the emoji python package4.
- Removing stop words that have no values added to the proposed system. These words are defined on Natural Language Toolkit (NLTK)5.
- Punctuation removal: Punctuations, such as (∼¦+|!–, ; ) are removed
- Repeating characters removal: characters, such as (“…”, “//” ), hyphens, brackets, symbols are removed.
- Mentions and links removal: all mentions and links that starts with @|https are removed.
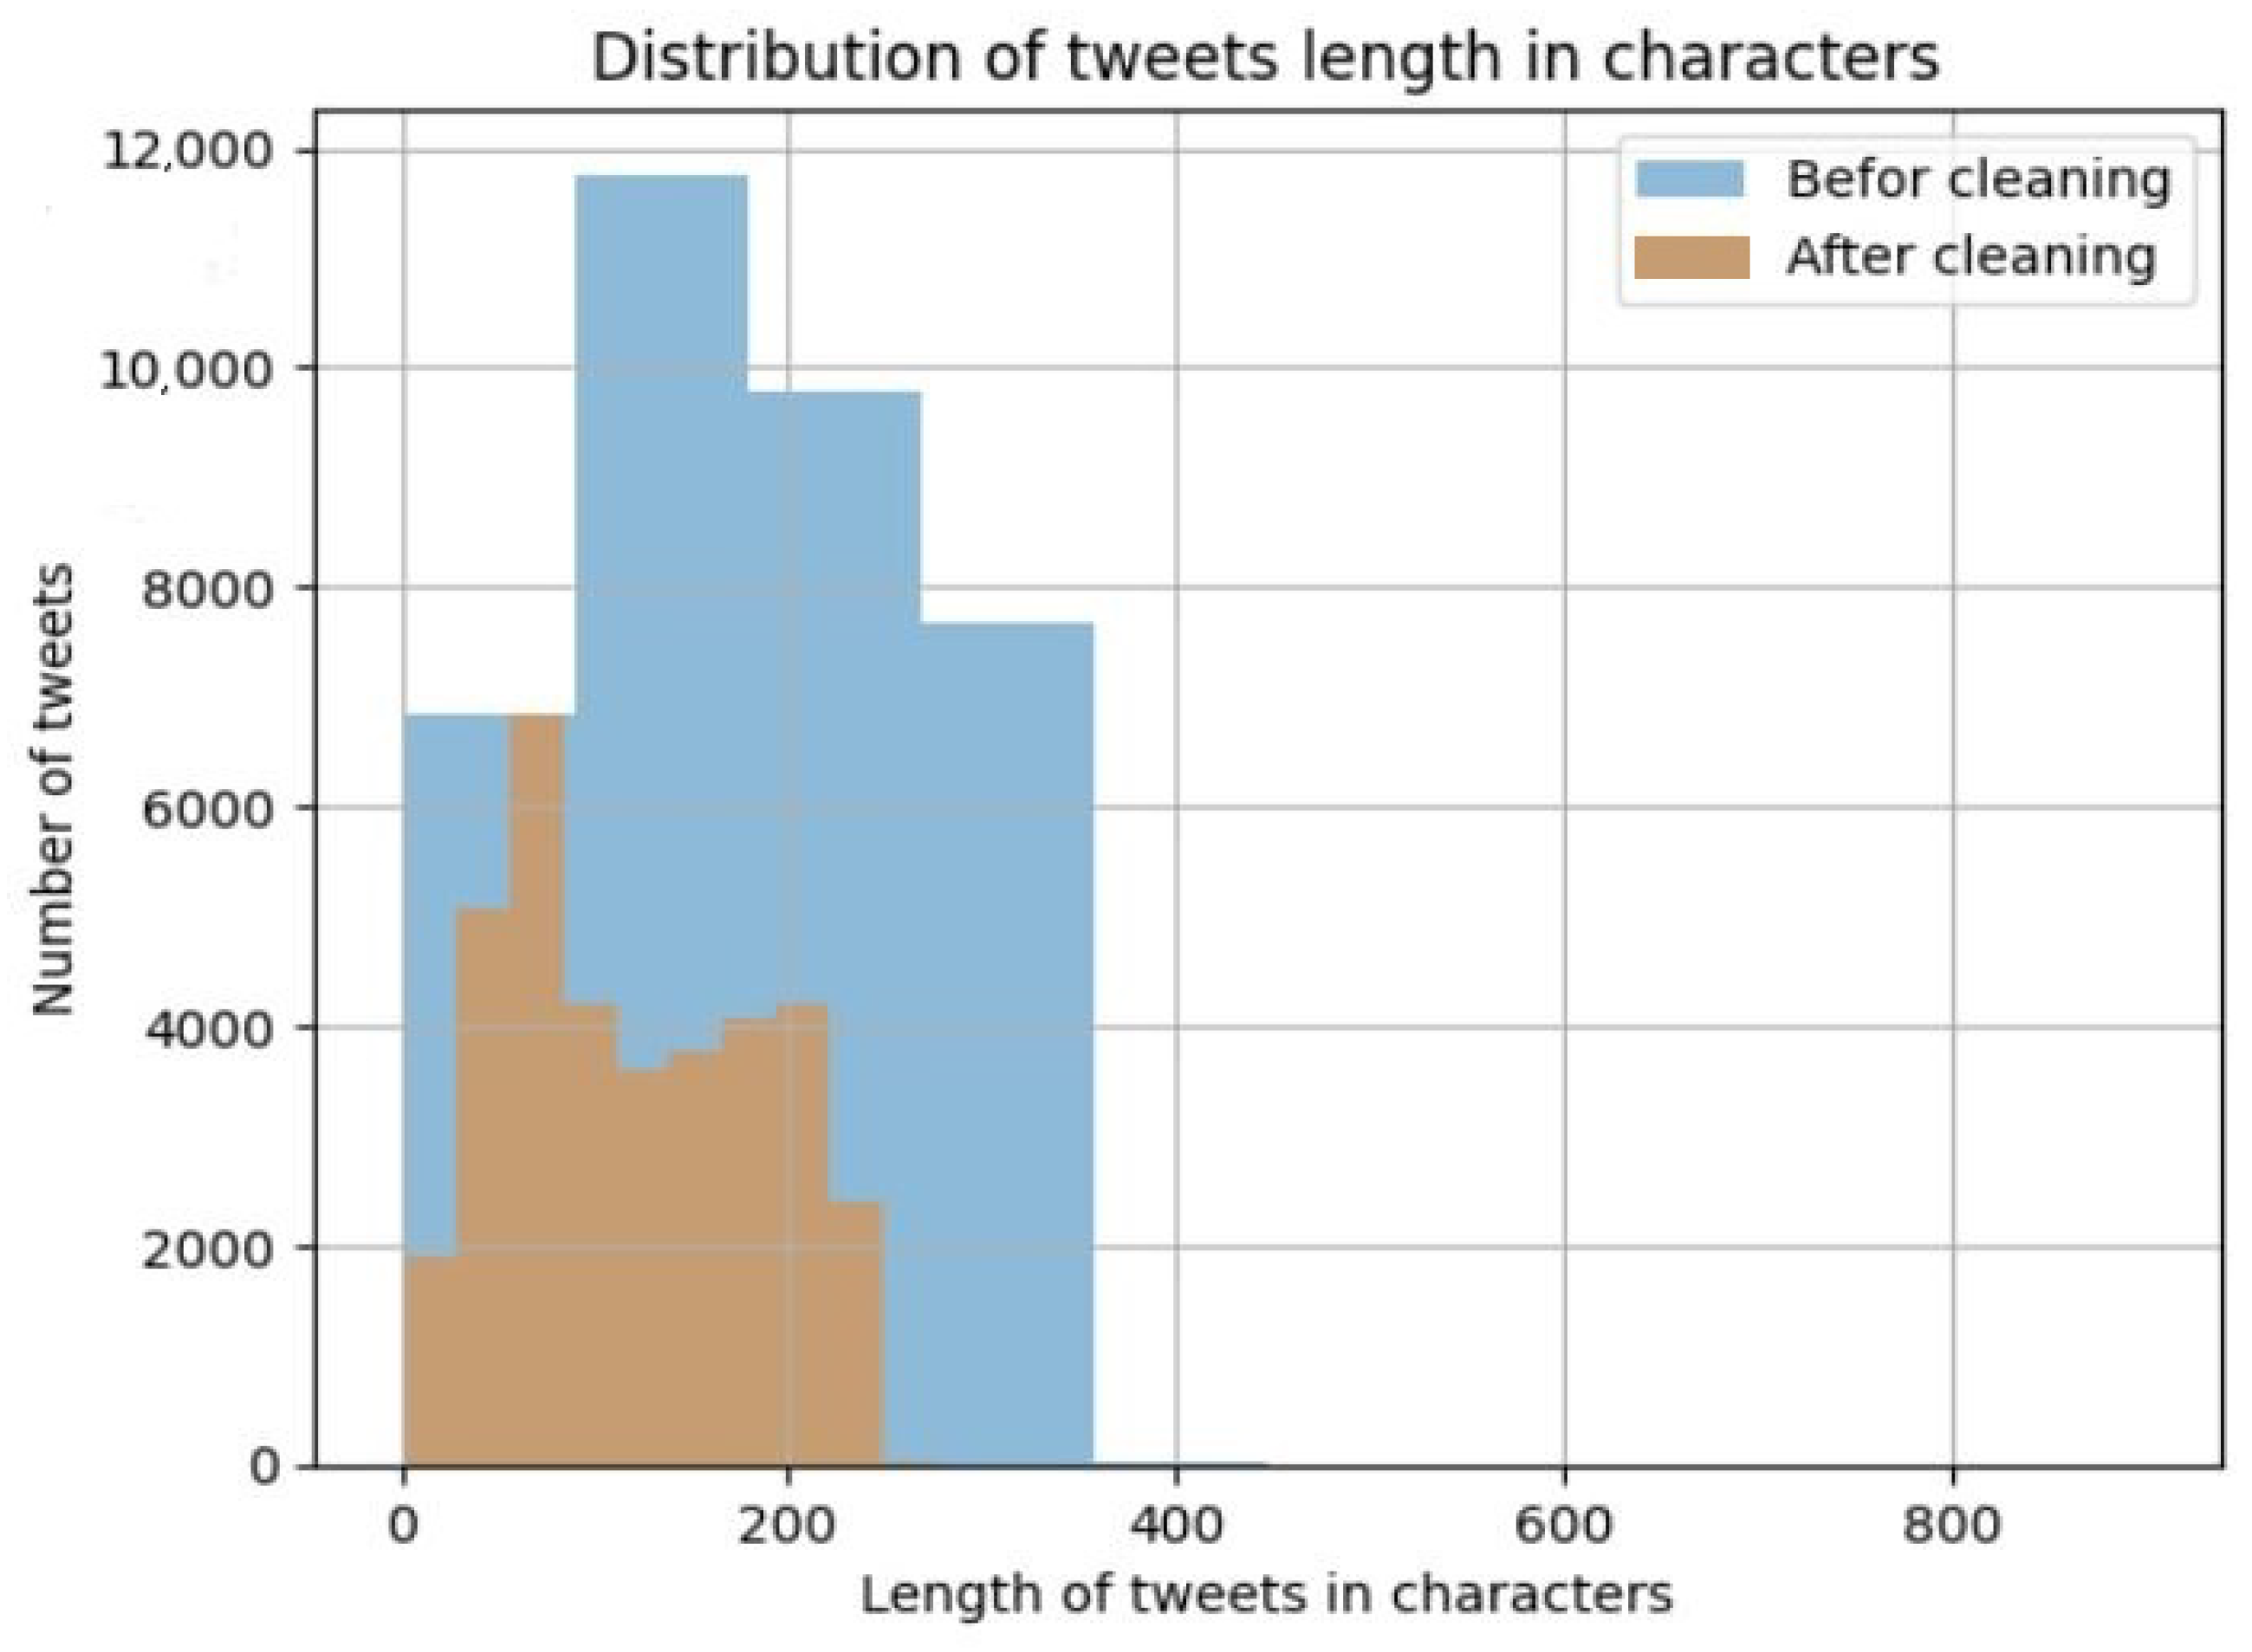
Figure 5 illustrates the stark contrast in the distribution of tweet lengths (in characters) before and after the pre-processing stage for the entire dataset. It is evident that there is a significant reduction in the length of the majority of tweets, with tweets shifting from 500 characters or less before pre-processing to 300 characters or less after pre-processing.

Figure 5.
Comparison of the distribution of tweet lengths before and after text cleaning applied to CybAttT dataset. The blue color is represents tweet length in characters befor cleaning, and the red color represents tweet length in characters after cleaning.
4.2. Feature Representation Stage
The feature representation technique involves converting words into numerical representations that can be used to train various classifiers. To accomplish this, words are translated into vector representations. Feature representation can be visualized as a process where each word is mapped to a corresponding vector in a high-dimensional space. This allows the classifier to understand the semantic relationships between words and ultimately make more informed classification decisions.
Thus, two feature representation methods are applied: term frequency-inverse document frequency (TF-IDF) and count vectorizer. Both methods offer complementary information; the vectorization method permits to represent the meaning of words, whereas the TF-IDF method allows to consider the meaning of words in our proposed dataset [33]. Moreover, both methods have an n-gram range parameter The n-gram is a collection of n successive items in a text. Such decides the range of n-grams needed in the final matrix. It is represented as a new feature and then used to define the length based on passing a tuple to the ngram_range argument.
4.3. Classification Stage
In the classification stage, machine learning algorithms and transformer-based models (e.g., LR, MNB, DT, KNN, SVM, BERT, DistilBERT, DeBERTa, RoBERTa) are used to classify the collected cyberattack-related tweets.
- Logistic regression (LR): It is a statistical algorithm with a probabilistic model that measures the relation among two or more independent variables by estimating probabilities by means of logistic functions [34]. For a test example x, the conditional probability of assigning x to a class label y using the LR algorithm can be expressed as follows:where: y ∈ {+1, −1} and denotes the model parameter [34].
- Naive Bayes (NB): It uses the Bayes Theorem of probability in the prediction of classes for unknown data. This is based on determining the probability of an event happening for the probability of another event that has already happened. Hence, the probability that a document (d) belongs to a class (c) can be computed as expressed below:
- Decision Tree (DT): It builds classification models in a tree structure with decision nodes and leaf nodes based on degrading the dataset into smaller and smaller subsets and then constructing a decision tree steadily upon these subsets. In the resultant tree, the highest decision node is related to the best predictor and it is known as the root node [32].
- K-Nearest Neighbors (KNN): It is based on using a non-parametric method to classify data. It finds the k neighbors of a data point and the producing the prediction.
- Support Vector Machine (SVM): It is a two-class binary classification algorithm, which depends on finding the hyperplane that distinguishes among two classes, where the distance among that hyperplane and the nearest support vector is known as the margin. The typical hyperplane is the one that has a high margin with maximum distances between two decision boundaries/support vectors. For SVM, the kernel function is responsible for learning the hyperplane via transforming the problem. The expression below defines the hyperplane formula:where: x is the feature vector, and b is the bias [35]. The distance between feature vector x and hyperplane for each class is measured by the equation:where: d+ is the distance in the positive class, d− is the distance in the negative class, and ||w|| is Euclidean norm.
4.4. Evaluation Stage
This stage aims to evaluate the ability of the proposed model to detect news classes. This is based on measuring the accuracy, recall, precision, and F1-score metric for each model. The accuracy presents how often a machine learning model is correct overall. The precision in turn presents how often a machine learning model is correct when predicting the target class. The recall presents a machine learning model can find all objects of the target class or no. The F1-score is a measure of both the precision and recall. It is commonly deployed as an evaluation metric in multi-class classification. This metric integrates both the precision and recall into a single metric to get a better understanding of model performance. The measurement of these metrics relies on four key parameters: True Positive (TP): the number of news data that is correctly classified; True Negative (TN): the number of non-news data that is correctly classified; False Positive (FP): the number of non-news data that is incorrectly classified as news data; and False Negative (FN): the number of news data that is incorrectly classified as non-news data.
5. Experiments, Results, and Discussions
This section presents two comprehensive experiments conducted on the CybAttT dataset, utilizing both machine learning algorithms and fine-tuned transformer-based models. The experimental setup and the insightful outcomes are explained in the subsequent subsections.
5.1. Experimental Setups
5.1.1. Experiment One: Using Supervised Machine Learning Algorithms
We have conducted a comprehensive experiment on the CybAttT dataset and evaluated the effectiveness of five machine learning algorithms (e.g., LR, MNB, DT, KNN, SVM) in classifying cyberattack-related tweets to validate the CybAttT dataset. While shuffling data is a valuable initial step in mitigating overfitting, we acknowledge that it’s not a standalone solution. To further address this challenge, we strategically combined data shuffling with other effective techniques including:
- Data splitting: We divided the dataset into a robust 80% training set for model learning and a dedicated 20% testing set for rigorous evaluation and generalization assessment. This separation ensures the model’s ability to perform well on data it hasn’t encountered during training.
- Regularization: We incorporated regularization techniques to penalize model complexity and discourage excessive reliance on specific training data patterns. This helps the model learn more generalizable features.
- Early stopping: We monitored model performance throughout training. If performance began to decline, indicating potential overfitting, we halted the training process to prevent the model from memorizing the training data at the expense of generalization.
In addition to shuffling, the stratified argument is employed within the training set. This technique ensures that the data is divided in a stratified manner, preserving the proportions of different classes in both the training and testing sets. This is particularly crucial for imbalanced datasets, where one class is significantly more prevalent than others. By maintaining the class distribution, the model is exposed to a balanced representation of each class, leading to more accurate and reliable classification results. The careful consideration of data splitting, shuffling, and imbalanced data handling ensures the validity and generalizability of the findings.
5.1.2. Experiment Two: Using Transformers-Based Models
The second experiment is the classification of the collected cyberattack-related tweets using fine-tuned transformer models. Therefore, two experiments are conducted to classify the preprocessed dataset using fine-tuned models. Next, a comparison between the results of both experiments and those of the previous experiment is conducted.
In this experiment, transformers-based models are fine-tuned and used to classify the preprocessed dataset, including 36,071 tweets, using the Hugging Face platform6. Hugging Face is a powerful platform for building and sharing machine learning models, specifically focused on natural language processing (NLP). It provides a variety of tools and resources that make it easy for developers and researchers to build and train models. In other words, Huggingface provides users with APIs to access and use the available large language models on the platform [12]. The service chosen within the platform is the auto-train7, which allows users to automatically train, assess, and use up-to-date and pre-trained machine learning models freely for a limited time by simply uploading data. Two experiments are conducted after creating a project for each one in the platform auto-train service. The first experiment is conducted using the Bert, DisltilBERT, and DeBERTa models, whereas the second one is conducted using the Roberta model. For both experiments, the pre-processed data are initially uploaded to the platform as texts to be classified (multi-classification) into news, non-news, and high-risk. In each experiment, the best model that has the highest F1 macro score is selected. Such an evaluation metric is the only one considered in both experiments due to the use of unbalanced data.
5.2. Experiments Results and Discussions
The best model is selected based on the highest recorded F1-score. This is because the accuracy score cannot represent different models’ performance due to the imbalanced data, where 87% of the data collected are labeled as not news, 11% of them are labeled as normal news, and only 2% of them are labeled as high-risk news. Moreover, the focus of this paper is on minimizing both the false negatives and the false positives. Thus, the F1-score is adopted to determine the best model. The following subsections explore the results obtained from both experiments.
5.2.1. Results of Experiment One: Supervised Machine Learning Algorithms
The computed evaluation metrics for each of the five machine learning classifiers combined with the two feature representation methods are shown in Table 3. The default value of n-gram is (1, 1), which represents unigrams only.
Table 3.
Evaluation of Machine Learning-based Classification Models’ performance.
The best performance was recorded for the logistic regression classifier with an F1-score of 87.6%. The logistic regression classifier achieved the highest F1-score when combined with the count vectorizer feature representation method with bigram range of (1, 2). For the TF-IDF feature representation method and the bigram range of (1, 2), the SVM recorded the highest F1-score of 86.8%.
5.2.2. Results of Experiment Two: Transformers-Based Models
For this second experiment with transformers models, we first investigated the performance of five different fine-tuned models on a text classification task (BERT_1, BERT_2, DistilBERT_1, DistilBERT_2, DeBERTa).
The evaluation metrics for all models were presented in Table 4. The most significant metric, F1 macro score, measures the overall performance across all classes. Based on this metric, the best performing model was BERT_1 with an F1 macro score of 0.6741. This indicates that BERT_1 achieved the highest accuracy in correctly classifying the text data across all classes.
Table 4.
Evaluation of Transformers-based Classification Models’ performance [BERT, DeBERTa, and DistilBERT models].
In addition to evaluating the performance of BERT, DeBERTa, and DistilBERT models, we investigated the performance of five different RoBERTa models for classifying the Cyberattacks dataset. Each model was based on the original RoBERTa architecture but with different hyperparameters. The models were evaluated using various metrics, including F1 macro score, as shown in Table 5.
Table 5.
Evaluation of Transformers-based Classification Models’ performance [RoBERTa models].
According to Table 5, the best performing model achieved an F1 macro score of 0.6671, slightly outperforming the other models. This indicates its superior ability to accurately classify the data across different categories.
Examining the hyperparameter variations between the models could reveal valuable insights into their performance differences. This analysis could help identify optimal hyperparameter configurations for future Roberta-based classification tasks using similar datasets.
5.3. Discussions
This paper presents the creation of a CybAttT dataset that includes cyberattack-related tweets collected using the X platform Application Programming Interface (API). All collected tweets are annotated by three annotators to classify them into three different classes: high-risk news, normal news, and not news, considering the majority voting. The resulting dataset is imbalanced, where it composes of 31,231 not-news tweets, 3948 normal news tweets, and 892 high-risk news. Five machine learning classification algorithms and ten different fine-tuned transformer-based models are then used to classify the CybAttT dataset. The models consist of four main stages; preprocessing, feature representation, classification and evaluation.
The comparison between all experiments revealed that the best performance was recorded for the logistic regression classifier with an F1-score of 87.6%. The logistic regression classifier achieved the highest F1-score when combined with the count vectorizer feature representation method with a bigram range of (1, 2).
The experiments conducted in this study provide strong evidence for the effectiveness and quality of the datasets used. In both experiments, the transformer-based models achieved high F1 macro scores, indicating their ability to accurately classify the text data across all classes. The best performing fine-tuned model, BERT_1, achieved an F1 macro score of 0.6741, demonstrating the suitability of the Cyberattacks dataset for training models for cyberattack detection. Experiments provides valuable insights into the performance of different transformer models for text classification tasks.
While all models achieved relatively high F1 macro scores, indicating their success in learning the classification task, the distilBERT models performed surprisingly well despite the minimal performance gap between models. This suggests their potential as a good option for applications with limited resources due to their smaller size and faster training times.
6. Conclusions and Future Works
This paper presented the creation and analysis of the CybAttT dataset, a valuable resource for detecting cyberattack-related tweets. We demonstrated the effectiveness of employing a three-annotator system for ensuring data accuracy and reliability. Our analysis revealed the inherent imbalance within the dataset, reflecting the real-world occurrence of cyberattacks. Subsequently, we conducted a comprehensive evaluation of various machine learning and fine-tuned models for classifying the CybAttT dataset. This analysis provided insights into the performance of different approaches and highlighted promising models for detecting cyberattacks in tweets.
The CybAttT dataset has the potential to significantly impact research and development efforts in the field of cyberattack detection and social media analysis. By providing a high-quality dataset specifically focused on cyberattack-related tweets, we aim to contribute to:
- Further research: Exploring advanced deep learning architectures for improved classification performance, developing real-time cyberattack detection systems, and enhancing social media monitoring tools.
- Real-world applications: Mitigating cyber threats by identifying and responding to potential attacks in a timely manner, improving public awareness about cybersecurity risks, and supporting law enforcement efforts in investigating cybercrime.
Author Contributions
Conceptualization, H.L., M.M. and K.A.; Validation, H.L., M.M. and K.A.; investigation, H.L., M.M. and K.A.; methodology, H.L., M.M. and K.A.; resources, H.L., M.M. and K.A.; data curation, H.L. and M.M.; writing—original draft preparation, H.L. and M.M.; writing—review and editing, H.L., M.M. and K.A.; visualization, H.L. and M.M.; supervision, M.M. and K.A.; project administration, M.M. and K.A. All authors have read and agreed to the published version of the manuscript.
Funding
This research received no external funding.
Institutional Review Board Statement
Not applicable.
Informed Consent Statement
Not applicable.
Data Availability Statement
The data introduced and described within this paper are available at: https://github.com/HudaLughbi/CybAttT (accessed on 14 February 2024).
Acknowledgments
The invaluable contributions of the volunteer annotators were paramount in ensuring the accuracy and reliability of the dataset, their commitment to quality played a pivotal role in shaping the project’s outcome.
Conflicts of Interest
The authors declare no conflicts of interest.
Notes
| 1 | “X” refers to the social media platform previously known as “Twitter” and rebranded as “X” in July 2023. |
| 2 | CybAttT dataset is available online for research purposes: https://github.com/HudaLughbi/CybAttT (accessed on 14 February 2024). |
| 3 | Tweepy: a python library for interacting with X platform API to collect tweets. (http://www.tweepy.org/ (accessed on 14 February 2024)). |
| 4 | Python package to clean emogis from a text: https://pypi.org/project/emoji (accessed on 14 February 2024). |
| 5 | NLTK is a Python library that provides a rich set of modules and resources for NLP, such as tokenizers, parsers, stemmers, taggers, corpora, and models. It is a vailable at https://www.nltk.org/index.html (accessed on 14 February 2024). |
| 6 | Hugging Face platform: https://huggingface.co/ (accessed on 14 February 2024). |
| 7 | Hugging Face autotrain service: https://huggingface.co/pricing#autotrain (accessed on 14 February 2024). |
References
- Security Operations Platform Powered by AI to Protect and Drive Your Business. Available online: www.threatstream.com (accessed on 20 January 2024).
- AI-Powered Threat Intelligence Operations and Cyber Risk Quantification. Available online: www.threatconnect.com (accessed on 20 January 2024).
- Dawson, J.; Thomson, R. The future cybersecurity workforce: Going beyond technical skills for successful cyber performance. Front. Psychol. 2018, 9, 744. [Google Scholar] [CrossRef] [PubMed]
- Ponemon, L. Cost of Data Breach Study; Ponemon Institute: Traverse City, MI, USA, 2017. [Google Scholar]
- Ifinedo, P. Information systems security policy compliance: An empirical study of the effects of socialisation, influence, and cognition. Inf. Manag. 2014, 51, 69–79. [Google Scholar] [CrossRef]
- Gehem, M.; Usanov, A.; Frinking, E.; Rademaker, M. Assessing Cyber Security: A Meta Analysis of Threats, Trends, and Responses to Cyber Attacks; The Hague Centre for Strategic Studies: Hague, The Netherlands, 2015. [Google Scholar]
- How Is Twitter Different from 7 Other Social Media Sites? Available online: www.tweeteraser.com/resources/how-is-twitter-different-from-7-other-social-media-sites/ (accessed on 14 February 2024).
- Global Social Media Statistics. Available online: www.datareportal.com/social-media-users (accessed on 14 February 2024).
- Raggad, B.G. Information Security Management: Concepts and Practice; CRC Press: Boca Raton, FL, USA, 2010. [Google Scholar]
- Jung, P.W. A Critical Analysis on the Concept of Cyber Security. Yonsei J. Med. Sci. Technol. Law 2011, 2, 1–25. [Google Scholar]
- Alruily, M. Issues of dialectal saudi twitter corpus. Int. Arab J. Inf. Technol. 2020, 17, 367–374. [Google Scholar] [CrossRef]
- Mars, M. From Word Embeddings to Pre-Trained Language Models: A State-of-the-Art Walkthrough. Appl. Sci. 2022, 12, 8805. [Google Scholar] [CrossRef]
- Altalhi, S.; Gutub, A. A survey on predictions of cyber-attacks utilizing real-time twitter tracing recognition. J. Ambient. Intell. Humaniz. Comput. 2021, 12, 10209–10221. [Google Scholar] [CrossRef]
- Biabani, S.; Tayyib, N. A Review on the Use of Machine Learning against the COVID-19 Pandemic. Eng. Technol. Appl. Sci. Res. 2022, 12, 8039–8044. Available online: https://www.etasr.com/index.php/ETASR/article/view/4628 (accessed on 14 February 2024). [CrossRef]
- Sangwan, R.S.; Badr, Y.; Srinivasan, S.M. Cybersecurity for AI Systems: A Survey. J. Cybersecur. Priv. 2023, 3, 166–190. [Google Scholar] [CrossRef]
- Bagui, S.S.; Mink, D.; Bagui, S.C.; Ghosh, T.; Plenkers, R.; McElroy, T.; Dulaney, S.; Shabanali, S. Introducing UWF-ZeekData22: A Comprehensive Network Traffic Dataset Based on the MITRE ATT&CK Framework. Data 2023, 8, 18. [Google Scholar]
- Ahsan, M.; Nygard, K.E.; Gomes, R.; Chowdhury, M.M.; Rifat, N.; Connolly, J.F. Cybersecurity Threats and Their Mitigation Approaches Using Machine Learning: A Review. J. Cybersecur. Priv. 2022, 2, 527–555. [Google Scholar] [CrossRef]
- Preuveneers, D.; Joosen, W. Sharing Machine Learning Models as Indicators of Compromise for Cyber Threat Intelligence. J. Cybersecur. Priv. 2021, 1, 140–163. [Google Scholar] [CrossRef]
- Lindley, D.V. Fiducial distributions and Bayes’ theorem. J. R. Stat. Soc. Ser. B (Methodol.) 1958, 20, 102–107. [Google Scholar] [CrossRef]
- Le, B.D.; Wang, G.; Nasim, M.; Babar, A. Gathering cyber threat intelligence from Twitter using novelty classification. arXiv 2019, arXiv:1907.01755. [Google Scholar]
- Ghankutkar, S.; Sarkar, N.; Gajbhiye, P.; Yadav, S.; Kalbande, D.; Bakereywala, N. Modelling machine learning for analysing crime news. In Proceedings of the 2019 International Conference on Advances in Computing, Communication and Control (ICAC3), Mumbai, India, 20–21 December 2019; pp. 1–5. [Google Scholar]
- Arora, T.; Sharma, M.; Khatri, S. Detection of cyber crime on social media using random forest algorithm. In Proceedings of the 2019 2nd International Conference on Power Energy, Environment and Intelligent Control (PEEIC), Greater Noida, India, 18–19 October 2019; pp. 47–51. [Google Scholar]
- Mahaini, M.I.; Li, S. Detecting cyber security related Twitter accounts and different sub-groups: A multi-classifier approach. In Proceedings of the 2021 IEEE/ACM International Conference on Advances in Social Networks Analysis and Mining, Virtual, 8–11 November 2021; pp. 599–606. [Google Scholar]
- Deshmukh, R.; Shinde, S.; Yadav, B.; Pathak, A.; Shetty, A. Darkintellect: An Approach to Detect Cyber Threat Using Machine Learning Techniques on Open-Source Information. Math. Stat. Eng. Appl. 2022, 71, 1431–1439. [Google Scholar]
- Behzadan, V.; Aguirre, C.; Bose, A.; Hsu, W. Corpus and deep learning classifier for collection of cyber threat indicators in twitter stream. In Proceedings of the 2018 IEEE International Conference on Big Data (Big Data), Seattle, WA, USA, 10–13 December 2018; pp. 5002–5007. [Google Scholar]
- Dionísio, N.; Alves, F.; Ferreira, P.M.; Bessani, A. Cyberthreat detection from twitter using deep neural networks. In Proceedings of the 2019 International Joint Conference on Neural Networks (IJCNN), Budapest, Hungary, 14–19 July 2019; pp. 1–8. [Google Scholar]
- Coyac-Torres, J.; Sidorov, G.; Aguirre-Anaya, E.; Hernández-Oregón, G. Cyberattack Detection in Social Network Messages Based on Convolutional Neural Networks and NLP Techniques. Mach. Learn. Knowl. Extr. 2023, 5, 1132–1148. [Google Scholar] [CrossRef]
- Hamoui, B.; Mars, M.; Almotairi, K. FloDusTA: Saudi Tweets Dataset for Flood, Dust Storm, and Traffic Accident Events. In Proceedings of the Twelfth Language Resources and Evaluation Conference, Marseille, France, 11–16 May 2020; pp. 1391–1396. Available online: https://aclanthology.org/2020.lrec-1.174 (accessed on 14 February 2024).
- Hkiri, E.; Mallat, S.; Zrigui, M.; Mars, M. Constructing a Lexicon of Arabic-English Named Entity using SMT and Semantic Linked Data. Int. Arab J. Inf. Technol. 2017, 14, 820825. [Google Scholar]
- Mars, M. Toward a robust spell checker for Arabic text. In Proceedings of the Computational Science and Its Applications—ICCSA 2016: 16th International Conference, Beijing, China, 4–7 July 2016; pp. 312–322. [Google Scholar]
- Fleiss, J.L. Measuring nominal scale agreement among many raters. Psychol. Bull. 1971, 76, 378. [Google Scholar] [CrossRef]
- Landis, J.R.; Koch, G.G. The measurement of observer agreement for categorical data. Biometrics 1977, 33, 159–174. [Google Scholar] [CrossRef] [PubMed]
- Salton, G.; Buckley, C. Term-weighting approaches in automatic text retrieval. Inf. Process. Manag. 1988, 24, 513–523. [Google Scholar] [CrossRef]
- Hoi, S.C.; Jin, R.; Lyu, M.R. Large-Scale Text Categorization by Batch Mode Active Learning. In Proceedings of the WWW 06: Proceedings of the 15th International Conference on World Wide Web, Edinburgh, Scotland, 23 May 2006; Volume 26, pp. 633–642. [Google Scholar]
- Ben-Hur, A.; Weston, J. A user’s guide to support vector machines. Data Min. Tech. Life Sci. 2010, 609, 223–239. [Google Scholar]
Disclaimer/Publisher’s Note: The statements, opinions and data contained in all publications are solely those of the individual author(s) and contributor(s) and not of MDPI and/or the editor(s). MDPI and/or the editor(s) disclaim responsibility for any injury to people or property resulting from any ideas, methods, instructions or products referred to in the content. |
© 2024 by the authors. Licensee MDPI, Basel, Switzerland. This article is an open access article distributed under the terms and conditions of the Creative Commons Attribution (CC BY) license (https://creativecommons.org/licenses/by/4.0/).