Abstract
Despite the fact that the concept of forecasting has emerged in the realm of tourism, studies delving into this sector have yet to provide a comprehensive overview of the evolution of tourism forecasting visualization. This research presents an analysis of the current state-of-the-art tourism demand forecasting (TDF) and combined tourism demand forecasting (CTDF) systems. Based on the Web of Science Core Collection database, this study built a framework for bibliometric analysis from these fields in three distinct phases (1980–2021). Furthermore, the VOSviewer analysis software was employed to yield a clearer picture of the current status and developments in tourism forecasting research. Descriptive analysis and comprehensive knowledge network mappings using approaches such as co-citation analysis and cooperation networking were employed to identify trending research topics, the most important countries/regions, institutions, publications, and articles, and the most influential researchers. The results yielded demonstrate that scientific output pertaining to TDF exceeds the output pertaining to CTDF. However, there has been a substantial and exponential increase in both situations over recent years. In addition, the results indicated that tourism forecasting research has become increasingly diversified, with numerous combined methods presented. Furthermore, the most influential papers and writers were evaluated based on their citations, publications, network position, and relevance. The contemporary themes were also analyzed, and obstacles to the expansion of the literature were identified. This is the first study on two topics to demonstrate the ways in which bibliometric visualization can assist researchers in gaining perspectives in the tourism forecasting field by effectively communicating key findings, facilitating data exploration, and providing valuable data for future research.
1. Introduction
As a result of the tendency for tourist arrivals to outpace the global economy, the tourism industry is the world’s leading economic and social development driver. Due to the tourism industry’s rapid expansion, tourism forecasting is gaining importance for businesses and governments [1]. In light of the imbalance between limited tourism resources and continual increases in demand, tourism demand forecasting has garnered much attention in recent years [1,2,3,4,5,6,7]. Notably, tourism’s role in the economic prosperity of numerous nations or regions has made tourism forecasting a lucrative field ripe for academic expansion [8].
In tourism forecasting, various forecasting research methods and approaches have been developed, adopted, and evaluated over the last few decades [9]. However, this development trend has sparked new concerns and insights [10,11,12]. Due to the surge in tourism research, scientific studies in related domains have evolved into standard literature reviews, scholarly publications, and comprehensive quantitative reviews [8,13]. Moreover, the researchers’ innovative thoughts and the value of these perspectives are more significant for this society [14]. In 2019, Liu et al. [13] employed scientometric analysis to give a variety of perspectives on popular areas and emerging trends in tourism forecasting research, drawing on influential publications retrieved from the Web of Science Core Collection database. Similarly, Song et al. [15] in 2019 reviewed important research to assess whether methods for tourism demand forecasting had evolved over time. In 2020, Zhang et al. [8] conducted a scientometric evaluation of worldwide tendencies and structures based on primary bibliographical databases to support the creation of extensive knowledge networking mappings based on worldwide tourism demand research.
However, tourism research has been described as dispersed, fragmented, and diverse [16,17]. Tourism forecasting fields refer to, among other terms, tourism demand, tourism demand forecasting, tourism demand volatility, tourism demand volatility forecasting, combined tourism demand forecasting, and combined tourism demand volatility forecasting. Notably, no systematic evaluation of the evolution of mixing several topics in tourism forecasting has been conducted, and bibliometric research on this topic has been reported less frequently. Furthermore, one of the three types of bibliometric procedures—review, evaluative, and relational studies—relational is the least used in tourism. Despite the abundance of publications and methods supporting tourism forecasts, bibliometric analysis knowledge mappings in the field and various topic explorations and comparisons have been sporadically visualized in previous research reviews. As a result, little knowledge has been published regarding the capabilities of mappings to reveal general structures [18,19].
The study of knowledge systems can facilitate a better understanding of the growth of advanced ideas and ideologies in the research field and the discovery of new research fields; it should be mentioned that there are numerous approaches to comprehend the tourism field’s body of knowledge. All of these techniques provide “windows” through which scholars can investigate the tourism forecasting field to obtain a deeper grasp of its basics and structures. Despite the fact that each window delivers some insights, they do not provide a comprehensive viewpoint to the spectator. Based on their insights into the ideology and techniques of tourism research, some scholars contend that bibliometric methods provide an alternative lens through which the structure of tourism research can be examined [20]. Tourism bibliometrics research can provide indicators for scientific output in the field over a period of time, allowing scholars to evaluate tourism as a learning and building system [21].
This study bridges the aforementioned gaps by undertaking a relational bibliometric review from the perspective of tourism demand forecasting. This paper prioritizes the expansion of the analysis of two themes in the concept, method, and hot topic of tourism demand forecasting research, which will be achieved through visual/graphic (infographic) formats to demonstrate the ways in which the field develops over time and to discern future research directions. Specifically, bibliometrics is the classification of data such as citations, author affiliations, keywords, themes investigated, and procedures using basic/advanced statistical methods, which are subsequently applied to published research in various realms [16]. Studies utilizing bibliometrics have identified prolific and/or prominent academics and/or institutions, intellectual structures, and knowledge domains by year, geographical regions of various disciplines, study themes within disciplines, and subject maturity [22,23,24,25,26,27,28,29,30]. Moreover, VOSviewer is a well-known approach for mapping information that integrates co-citation analysis with collaboration networks and developmental trend detection to streamline the bibliometric analysis method when determining the evolving state of research [31]. The fundamental building pieces of VOSviewer visualization graphs are nodes and links. They are used to depict time-sliced research using concentric circles of various colors, with interwoven relationships denoted by linkages [32].
This research addresses the gaps in the literature by combining descriptive analysis and comprehensive knowledge mappings based on worldwide tourism demand forecasting research. This is the first attempt in a tourism demand review study that focuses exclusively on two primary data themes: the tourism demand forecasting (TDF) and combined tourism demand forecasting (CTDF) areas from the Web of Science (WoS) database for the period 1980–2021. This is the first study to include bibliometric analysis in a comprehensive literature evaluation of combined tourism forecasts based on various topics. In addition, using co-citation analysis, cooperation networking, and new tendency analysis, a framework for analyzing the two themes of the tourism demand forecasting field was developed to identify the most important connections between trending research topics, the most important countries/regions, institutions, publications, and articles, and the most influential researchers. The application of the bibliometric method demonstrates the concepts, techniques, and prevalent hotspots of the tourist demand forecasting field through the visualization or graphical representations that reflect the ways in which this field continuously progresses and produces future study routes. Furthermore, this is the first study to synthesize the single and combined forecasting methods in two tourism demand forecasting topics using bibliometric analysis. The research is guided by four major questions: (1) What are the descriptive analysis results of the top prolific countries/regions, authors, institutions, and cited papers for the two compared themes? (2) What is the citation status, and what are the cited sources, references, and authors in the co-citation analysis for the two compared themes? (3) To what extent do single institutions, countries/regions, and authors stand out in the corresponding cooperation networks under the two-theme comparison? (4) Regarding future developments, which research processes and areas for further research offer the most promise?
The remainder of this study is structured as follows. The second section consists of an in-depth analysis of the bibliometric literature and a description of studies utilizing bibliometric method. This study’s research methodology is clarified in Section 3. The fourth section outlines the primary tourism forecasting methods and explains the two chosen topics for this study. The descriptive analysis and scientometric review study findings are provided and discussed in Section 5 and Section 6. Section 7 provides a summary of the research findings and recommendations for future research.
2. Literature Review
2.1. Bibliometric Methods
As mentioned by Denyer and Tranfield [33] in 2006, frequent evaluations of current research topics are required to acknowledge the contributions of a study and generate validated claims for the future development of this field. Tranfield et al. [34], in 2003, proposed that a literature review can assist with determining the appropriate intellectual terrain for further knowledge foundation building to handle different information when conducting an academic inquiry, which can introduce beginners, early career scholars, or non-specialists to major writers and works [35]. Meanwhile, bibliometrics analyzes bibliographical data through the application of quantitative techniques [36,37,38]. It explores the ways in which disciplines develop over time due to their cognitive, sociological, and theoretical frameworks [39]. This method assesses study outcomes, such as subjects pursued, approaches utilized, populations utilized, and basic or advanced statistical approaches applied to data in existing studies, including those published in books, conferences, and journals [40,41,42,43]. The evolution of disciplines’ epistemology, knowledge domains, and/or intellectual frameworks has been investigated. With the maturation of numerous disciplines, there is an increasing interest in studying and monitoring their development using sophisticated software systems. In response, bibliometric analysis is commonly used to map the structure and growth of scientific disciplines or specialties [16].
In 2015, Zupic and Čater [39] separated the bibliometric methods into three categories: (1) review studies (i.e., meta-analyses, systematic/structured literature reviews), which develop knowledge by applying fundamental statistical analyses to bibliographical records of publications; (2) evaluative studies, which assess academic research performance or output from multiple people or organizations to determine its influence [20]; (3) relational studies, which seek to identify the connections between different study domains, the generation of novel academic areas and approaches, or any patterns or tendencies towards co-citation and co-authorship [20]. The four-approach types are listed in Table 1.

Table 1.
Different approaches for bibliometric mapping.
The co-citation analysis was first introduced by Small [45] in 1973 and is one of the most used bibliometric techniques, along with author or journal co-citations [49]. Using co-citation counts, this study generates similarity measures across publications, authors, and journals [50]. It connects two concurrently referenced components under its frequency [45]. Co-citation analysis is a valuable bibliographical technique for identifying the clustering of co-citation pairings [16], which provides scholars with insights into the accumulating traditions, depth of knowledge, and cognitive framework of academic work [51,52]. In 1963, Kessler [44] felt that academic publications possessed coherence and dynamism, which, in addition to holding empirical content for bibliographic coupling analysis, may show theme linkages between cited articles. The number of common citations between two or more publications is indicative of their relationships.
As depicted in Figure 1, the left panel reflects that papers A and B could be one linkage connected through co-citation analysis since these have been both referenced by the first publication. The bigger the number of co-citations two papers receive, the greater their co-citation strength and the greater the likelihood that they are substantially connected [53]. In contrast, the right panel emphasizes a connection between references from articles A* and B*, as both of them cite the second reference. Specifically, two articles may cite the same resources. However, any two articles listed in another’s citation constitute bibliographical coupling [54,55]. Bibliographic coupling predates co-citation by several generations, yet co-citation analysis has been claimed to be more advanced than other bibliometric techniques in reflecting domain structures [56].
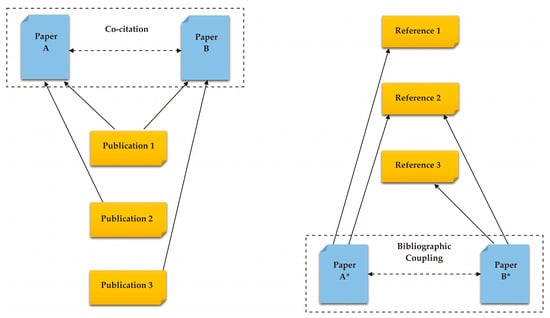
Figure 1.
Co-citation and Bibliographic coupling analyses (Reprinted/Adapted with permission from Ref. [57]. Copyright © 2014, Yuan, Gretzel and Tseng, published by John Wiley and Sons (RightsLink Copyright License No.: 5345300997228)). * denotes different papers (A* and B*) from the paper A and paper B on the left.
Co-word analysis is predicated on the frequency of keywords inside co-occurrence or the number of articles where keywords exist concomitantly [58]. Through calculating the strength of keyword co-occurrence correlations, keyword interconnections are identified and visualized. Because keywords are used to communicate the substance of a research paper, keyword analyses are widely performed to examine the conceptual networks of academic themes and patterns in a certain field [49]. After using co-citation analysis and keyword analysis in a literature review study, in 2017, Leung et al. [55] reported that the overlap between the two techniques was minimal and that combining the two techniques yielded more desirable results. Similarly, Chang et al. [54] proposed that integrating co-citation and keyword analyses might help researchers generate thorough mappings of the discipline’s conceptual infrastructure and better grasp its evolution.
Bibliometrics consists of various analytical methods regarding numerous categories of data employed throughout the research [59]. As these methods offer a variety of benefits and drawbacks, their use in analyzing academic tendencies within a certain field has spawned the bibliometrics movement [54]. Sometimes, bibliometric analysis is used with scientific mapping techniques to illuminate the conceptual framework of a certain study topic [32]. Therefore, scholars can use bibliometrics to assess and review research in the chosen field of study to identify its significant aspects [60]. Thus, a bibliometric method is used as a quantitative analysis technique to determine the current state and development patterns in diverse disciplines [61]. Notably, a bibliometric analysis method also offers new scholars in the tourism forecasting area with knowledge and insight into important authors and works, which can be helpful for those who are unfamiliar with the field.
2.2. Visualization of Bibliometric Data
Academic search engines and bibliography databases have expanded the range of tourism publications and provided more extensive accessibility to citation materials [35]. The increasing amount and complexity of published studies have forced the development of visualization tools to identify research gaps and contributions. Specifically designed methods have been developed to comprehend, display, contextualize, and analyze a variety of visualization processes. Typically, the application of these methods produces maps, diagrams, and charts that represent structures, developments, and operations. Bibliometric visualizations frequently display linked authors or publications across networks in a way conducive to the identification of links, groupings, and structural components. VOSviewer is an example of such method; it is a Java application that enables users to construct maps using network data and visualize and study these maps using bibliometric information [31]. Co-authorship, co-occurrence, and co-citation knowledge network mappings of authors, organizations, and journals are bibliometric networks built using VOSviewer [32]. VOSviewer provides three types of visualizations for each map: the network visualization, the overlay visualization, and the density visualization, and those visualizations are delineated below. The ability to zoom in and out of a map enables in-depth investigations, which are especially beneficial when working with large amounts of map data containing several elements. In addition, its most essential feature is its capacity to vividly display bibliometric statistics using techniques, as well as zooming in and out of bibliometric maps and converting and exporting the data into numerous file formats [31].
2.3. Bibliometric Methods in Tourism Forecasting
Academic fields are always evolving. A field of study is a subset of information within a research topic that is examined from multiple vantage points [57]. According to the literature on tourism, tourism’s emphasis on the current topic has shifted and evolved over time [62]. The most common application of bibliometrics in tourism publications is in assessing journals and their contributors [63]. Tourism bibliometric analysis was classified into various segments by Köseoglu et al. [16] in 2015, including journal evaluation and ranking research, article verification research, and subjects’ relationship/citation analysis. In 2014, Yuan et al. [57] outlined five focuses of tourism fields under bibliometric methods: (1) authors and organizations or institutions yields [12,64]; (2) social networking and intellectual movement [65]; (3) themes and lengthy evolution progress [66]; (4) journal growth and ranks [67,68]; (5) authors and publications with the most citations [64].
In the last few decades, tourist studies have become increasingly extensive [55,69]. Table 2 summarizes the principal studies that conducted literature assessments of the tourism forecasting area base on the Web of Science (WoS) database, which will be more conducive to determining the faults with the current research system and the proper remedial measures. The majority of studies and methods on the topic of tourism demand forecasting presented in the following literature review are based on descriptive statistics techniques for traditional data, which is merely a single review of the literature. Moreover, relatively few publications summarize the relationships between articles, authors and research methods. Furthermore, bibliometric methods have been sporadically applied to tourism demand forecasting research.
Table 2.
Main studies of tourism forecasting review.
3. Methodology
3.1. Database
There are two phases of data collection for this study using the VOSviewer analysis program. The initial step is to identify a comprehensive bibliography that enables broad access to high-quality scholarly research publications as reliable information resources. Web of Science (WoS) was used to retrieve the publications and gather data on the evolution of tourism forecasting in January 2022. The WoS from Thomson Reuters includes the Science Citation Index Expanded and the Social Sciences Citation Index [81]. In addition, it provides extensive access to reference and bibliography statistics for scholarly publications, making it a valuable resource for bibliometric studies [18,82].
The subsequent step is to extract articles from bibliographical databases using approved keywords, with particular attention paid to the reliability and generalizability of keywords and inspections to confirm the relevancy of each study retrieved. Combined methods in tourism forecasting are highly innovative. The research on combined forecasting in the tourism context is significantly less established, and a single-theme article database does not suffice to support the complete set of research. Therefore, we must consistently investigate and expand the field beyond generic theme research. This study utilized the two data themes of the article databases (Tourism Demand Forecasting and Combined Tourism Demand Forecasting). In addition, a screening process was used to exclude publications that were irrelevant to the study topic. This initial raw data yielded 12,865 documents for tourism demand and 2657 documents for tourism forecasting areas between 1980 to 2021. The number of articles was subsequently reduced by using the following criteria for extracting items from the WoS Collections database: (i) Database: Thomson Reuters’s WoS; (ii) Theme(a): “tourism demand forecasting” or “tourist arrivals forecasting”; Theme(b): “combine/combined/combining/combination tourism demand forecasting”; (iii) Time Span: “1980–2021”; (iv) Documents Type: “All Documents”; (v) Language Type: “English”. After examining all publications on the list for the aforementioned criteria, additional exclusions were made based on topical significance. After document screening, the final database contained 861 tourism demand forecasting documents and 29 combined tourism demand forecasting documents on sustainable construction.
3.2. Analysis Framework
Firstly, as inferred from Figure 2, the key data themes are categorized and summarized in line with the search-engine-retrieved articles on tourism demand forecasting and combined tourism demand forecasting based on the WoS database screening. In addition to general tourism demand forecasting research, the scope of the relatively new field of combined tourism forecasting was concerned to identify tourism forecasting research needs. Thus, a linked analytic framework was developed to assess and display the two themes of published tourism forecasting research between 1980 and 2021. Secondly, this study also conducted a descriptive statistics investigation and a scientometric evaluation of these analytical themes. Using a statistics description synopsis of the distribution of pertinent publications throughout 1980–2021, countries/regions, high-yield paper sources, authors and organizations, and those publications that have received the most citations, six desirable outcomes were derived from the existing body of tourism research in the first sub-step. In addition, the software VOSviewer was used to capture the maps of co-citations (cited sources, cited references, and cited authors), cooperation networks (author institutions or organizations, countries/regions, and authors), and topical issues pertaining to future research directions in order to discern the visualization links of cooperation knowledge network mappings pertaining to the two themes of the scientometric review. Finally, relying upon the aforementioned two parts, the used models or methods for the combined forecasting in tourism research were summarized to locate the current hotspots and development directions for subsequent studies. The outcomes of this procedure can serve as a helpful resource for future authors exploring innovative strategies for this research field.
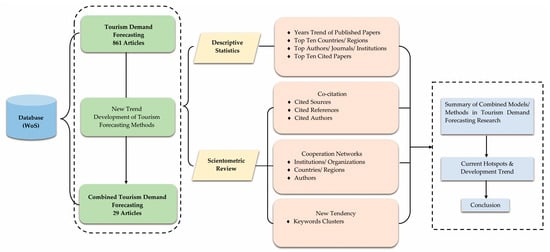
Figure 2.
Analysis Framework.
4. Main Tourism Forecasting Methods
Throughout the previous three to four decades, a multitude of tourism forecasting models have been proposed, each attempting to investigate the underlying reason for visitor volatility and develop precise projections for tourist arrivals [83]. Most of these studies employed multiple methods, which can be divided into five types: (1) time series models, (2) econometric models, (3) artificial intelligence (AI) models, (4) judgmental forecasting methods, and (5) combined and hybrid methods, as described in Figure 3. Based on the most fundamental models or methods, scholars can investigate and build further models in the field of tourism demand forecasting.
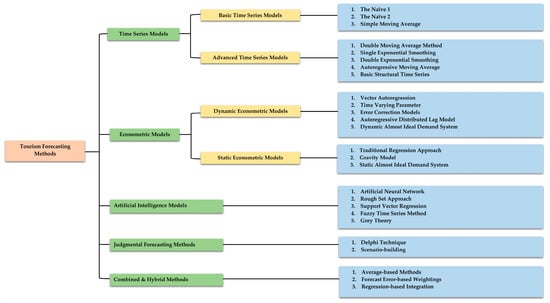
Figure 3.
The main tourism forecasting methods categories form (Reprinted/Adapted with permission from Ref. [83]. Copyright © 2018, Jun, Yuyan, Lingyu and Peng, published by Elsevier (RightsLink Copyright License No.: 5345280121479)).
4.1. Time Series Models
In the case of time series models, future trends may be predicted by extending a single past data series. By analyzing statistics, these models strive to identify patterns, slopes, and cycles in time series. In contrast to methods that rely on a random sampling of data, time series models rely on consecutive points that reflect sequential evaluations completed at uniformly spaced intervals [74]. When a pattern is found, future results can be predicted using time series models. Basic and advanced time series models are subsets of time series models. The most fundamental forms of time series models are the naïve, autoregressive (AR), single exponential smoothing (SES), moving average (MA), and historical average (HA) models. The addition of extra time series properties, such as trends and seasonality, distinguish advanced time series models from basic time series models. A wide variety of ARIMA models are often used in tourism demand time series evaluations. By including current and lagged data (AR), current and lagged random shocks (MA), degrees of integration (I), and seasonality variations (S), it is possible to estimate tourism demand in a wide variety of conditions using ARIMA models. To solve the limitations of simple exponential smoothing (SES), enhanced ES methods combine additional propensity and seasonality inclinations. Parallel to performing decompositions of tendencies, a number of other methods are routinely used to match tourism data with tendency curvatures for the goal of further research. Due to their ease of application and potential to capture past trends, time series models have been frequently used in the tourism forecasting industry [84]. Following an assessment of the accuracy of various tourist arrival forecasting models, it has been proven that time series models can create adequate forecasts at a low cost and with desirable benefits.
4.2. Ecomometric Models
Due to the ongoing interest in econometric forecasting models, there has been a greater emphasis on the search for causal links between economic concerns and tourist arrivals in various empirical situations. The first step in building econometric forecasting models is to “specify probable causality,” followed by “sorting” the inefficient and effective components (as supported by demand theory) to distinguish between the two. Due to their efficacy in accomplishing this objective, econometric forecasting models are an integral aspect of tourism forecasting research and practices. In econometric models, collections of postulated causal variables have been used to identify the correlations between variables such as tourism demand and tourist expenditure. Based on these explanatory variables’ functions, tourism forecasting may be formed [83]. Specifically, the industry has adopted advanced econometric models, including the distributed lag (DL) model, the autoregressive distributed lag model (ADLM/ARDL), and the error correction model (ECM). DL models consider both the current and historical values of contributing factors that determine contemporary visitor demand. When evaluating tourism demand, both the long-run relationship between tourism demand and its affecting elements and the short-run error correction mechanism based on the ADLM/ARDL are evaluated. Likewise, the ADLM/ARDL and ECM are essential for recognizing tourism demand trends and adding exogenous variables into existing dynamic time series models. It has been determined that the ADLM/ARDL and the ECM effectively predict or forecast tourism demand.
In contrast to the ADLM/ARDL and ECM, exogenous variables can be integrated into dynamic time series models as opposed to static single-equation models. Consider the ARIMAX model, which focuses significantly on forecasting changes in tourism demand, as an example. It is often referred to as a partial adjustment model, yet it has the same functional structure as a reduced ADLM/ARDL. ARIMAX-type models such as the ADLM/ARDL and ECM perform well when static changing parameters and MIDAS features are used in conjunction with them when predicting and forecasting tourism demand.
4.3. Artificial Intelligence Models
Strategies that are data-driven and model-free can analyze nonlinear data without prior knowledge of the relationships between the input and output variables. The current development and implementation of artificial-intelligence-based forecasting methods is a further significant component of forecasting. The artificial neural network (ANN) model, the most extensively used AI-based model, has shown an excellent capacity for survival and adaptability when processing erroneous inputs and dealing with nearly all sorts of nonlinearity, even with correct inputs. Artificial-intelligence-based methods have been widely used to forecast occurrences in a wide array of scientific fields, including medicine and astronomy. Due to the effectiveness of AI-assisted tools, tourism researchers are increasingly relying on them to forecast demand, including the support vector regression (SVR) method [85], the fuzzy time series method [86], the rough sets approach [87], and grey theory [88]. Some tourism demand forecasting studies have utilized artificial neural network (ANN) models such as the multilayer perceptron (MLP), the radial basis function (RBF), and the Elman network. The empirical findings indicate that ANN models with bad time series data perform well. Studies on tourism demand forecasting have focused on combined ANN models with conventional time series models. To measure the accuracy of forecasts, combining Box–Jenkins and ANN models, linear models (such as Naïve, ES, or ARIMA models), and nonlinear AI models (such as back-propagation neural networks or SVRs) are effective.
4.4. Judgmental Forecasting Methods
In tourism research, the Delphi technique and scenario-building are uncommon methods [89]. The Delphi method is a long-standing judgment method for lengthy demand forecasting that has been developed over an extended period [90]. This method aims to foster discussion and consensus regarding the overall unpredictability of tourist supply and demand [91], as knowledge of demand drivers and their origins is limited to nonexistent. The Delphi method is utilized to collect data on tourism, predict future consequences, and in particular, create regional databases. It is predicted that the integration of these initiatives will result in a useful regulatory instrument for tourism and hospitality administration. Meanwhile, in 1995, Moutinho and Witt [92] proposed an alternative Delphi consensus forecasting approach, whereby a panel of experts is encouraged to study and share their insights on the performance of the tourism business. This situation design method has been used in policymaking and sociological research, especially to explore climate change. However, Delphi technique in the realm of tourism forecasting is also continually evolving. Several studies, for instance, are being conducted to adjust visitor arrival projections using Delphi. Other research examined the accuracy of time series projections using Delphi questions, and some studies employ scenario analysis and dynamic Delphi polls to modify ADLM/ARDL estimations.
4.5. Combined and Hybrid Methods
Using approaches that combine various projections, a novel approach to tourism forecasting research includes the forecasts associated with the individual models [93]. Such procedures leverage a variety of techniques to generate many estimates for the same demand variable and then combine them into a single final forecast [15]. A hybrid model is a forecasting model that incorporates the best aspects of numerous models. Combining the predictions from many models can be accomplished using various methods, including averaging, weighting based on forecast accuracy, and regression-based integration. Another proposed benefit is that drawing on elements from various models allows for the portfolio diversification of various forecasts. Several studies have demonstrated that combination often improves forecasting accuracy in the context of the mean [94]. According to empirical studies, combined forecasts are also a valuable method for boosting the accuracy of tourism forecasting [93,95,96]. As such, exploiting efficacious methods to conduct tourism demand volatility forecasting, especially volatility combined forecasting, is a growing area of interest in tourism research [97,98]. As the projections are derived from methods including numerous sources or employing multiple sources in fundamentally different ways, this more general issue merits further analysis.
5. Descriptive Statistics Analysis
5.1. Trends in Tourism Demand Forecasting (TDF) and Combined Tourism Demand Forecasting (CTDF)
The two graphs show the temporal trend of publications between 1980 and 2021. The evolution of each collection over time can be examined and evaluated by referring to Figure 4. In the first emerging phase (1980 to 1990), the number of publications produced per year was negligible at almost zero. From 1991 to 2004, four papers were produced each year within Theme(a)-TDF-861 in the second pick-up pace phase. As for the third rapid development phase, Theme(a)-TDF-861 displays experienced growth with volatility as the volume of papers climbed to approximately 35/year. Remarkably, this phase exhibits a mushroomed trend due to the fluctuations for Theme(b)-CTDF-29. This theme has the potential to become a new area of interest for future research.
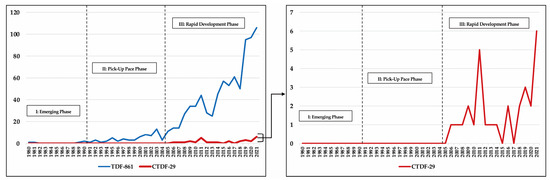
Figure 4.
Year-by-year trends of publications for two themes in phase I, phase II, and phase III.
The publications in distinct countries/regions relating to the two primary themes are depicted in the map and bar charts shown in Figure 5. Regarding the TDF-861 theme, the top three high-yielding countries/regions are China (259 publications), the UK (94 publications), and the USA (89 publications), accounting for about 30.08%, 10.92%, and 10.34% of published articles, respectively. As for CTDF-29, in terms of total publishing volumes, China accounts for 56.67% (17), the UK for 23.33% (7), and Taiwan (China) for 16.67% (5). Overall, China and the UK have become the most prolific countries, as inferred from the two-bar charts.
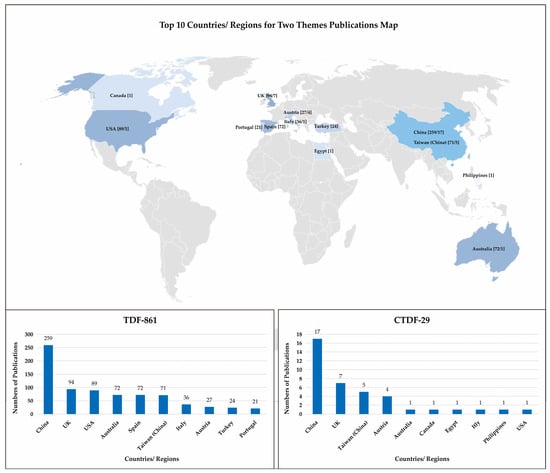
Figure 5.
Publications in different countries/regions.
5.2. Top Prolific Authors
Table 3 also shows the prolific authors, namely Song H.Y., Law R., Li G. and Witt S.F., within Theme(a) and Theme(b) based on the results of the top yielding countries/regions: China and the UK. Some of them are affiliated with the same institution, university, country/region, allowing them to collaborate on research. In the section on scientometric analysis that follows, these links will be mapped using the VOSviewer software. Therefore, these authors’ publications have the highest citation rate in tourism forecasting research for future studies. In addition, these experts are considered pioneers and explorers of combined tourism forecasting methods based on individual research and forecasting methods. Their findings have contributed significantly to the evolution of integrated forecasting in tourism demand research.
Table 3.
Top prolific authors in two themes.
5.3. Top Prolific Institutions
For Themes(a) and Theme(b) in Figure 6, when the top high-yield authors and high-yield countries/regions were combined with the observations, China and the UK produced the most published works between 1980 and 2021. The Hong Kong Polytechnic University and the University of Surrey, in particular, come out on top in these published works under both of the two themes. Consequently, it is imperative that readers seeking articles on tourism forecasting combine high-yield authors, journals, and institutions to uncover more high-quality research references [8]. Moreover, based on the number of publications on the two themes, authors from other countries/regions or institutions might work on Theme(b) and investigate additional combined research methods.
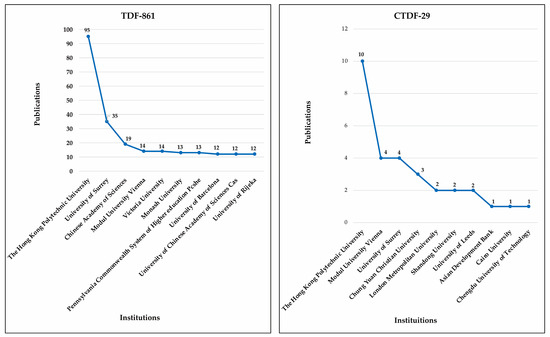
Figure 6.
Top prolific institutions.
5.4. Top Prolific Journals
As inferred from Table 4, the distribution indicates the top 5 high-yield publications. Tourism Management (impactor factor: 10.967) leads with 65 and 5 publications, respectively, in the TDF-861 and CTDF-29 themes, followed by Tourism Economics (impact factor: 4.438) with 63 articles in Theme(a). Annals of Tourism Research (impact factor: 9.011) has 55 and 6 publications, respectively, on the two themes. The International Journal of Forecasting (impact factor: 3.779) presents 24 and 2 papers on two themes, respectfully. In general, except for the tourism demand field, publications about tourism forecasting published highly influential publications. However, it is evident that just 29 papers on combined tourism make up a very small proportion of all publications in the tourism forecasting area, resulting in the publication of relatively few articles in the above-mentioned prestigious journals. In contrast, Table 4 does not provide the relationships from data relationship visualization in addition to static data. If only these data were considered, it would be difficult for readers to comprehend the relevance of the content in each journal and article. Consequently, the next section of the scientometric knowledge network mapping’s description allows readers to collect and analyze the dynamic links between journals and papers as well as other evaluation criteria in the field of tourism forecasting research.
Table 4.
Top five prolific journals in two themes.
5.5. Top Cited Papers
Table 5 displays the most frequently mentioned papers and some of their properties. These data aid researchers determine which article seems to be the most significant out of all those published on two themes. The total numbers of references and the average annual numbers of citations were used to measure the influence and quality of the publications. The publication of Song and Li [6] on TDF-861 received 817 citations, making 2008 the year with the most citations. The papers under tourism forecasting, on the other hand, all connect to high-yield authors and high-yield journals (Tourism Management). Several authors offered innovative methods for conducting research, such as merging individual models to improve the accuracy of forecasting in diverse research fields. In terms of the CTDF-29 theme, therefore, there was Hyndman et al. [99] in 2011 with 152 citations, Wong et al. [93] in 2007 with 137 citations, and Song et al. [15] in 2019 with 128 citations. However, combined tourism demand forecasting and tourism demand volatility forecasting produce fewer publications than other fields.
Table 5.
Top cited papers in two themes.
Therefore, according to the above analysis, combined methods in tourism forecasting is still innovative. Further academic research is required to assist governments, tourist organizations, and policymakers from many countries/regions in developing accurate and exact tourism strategies by recognizing tourism demand volatility [100,101,102,103].
6. Scientometric Review
6.1. Co-Citation Analysis
In the context of co-citation analysis, the semantics of articles with shared citations are evaluated [53]. The size, color, and connectivity of nodes and links in co-citation network maps can be utilized to analyze the findings of the study. The most prominent nodes are works that have been cited by numerous researchers, indicating that the paper has had a greater influence. Because the reference articles were published in different years, the colors of the links indicate when a specific tie was established. A couple of times, citations that occurred together within the primary sources are represented by links between nodes, which constitute co-citation connections [35]. In order to better comprehend the mental configuration maps of tourism demand forecasting and combined forecasting of the tourism demand area, this study evaluated the sources, references, and knowledge network mappings of the co-authors of two data subjects. Moreover, the structure of co-citation authorship links for authors with multicultural awareness in their respective fields was illustrated with statistics [8,16].
6.1.1. Cited Sources
The WoS bibliographic information for the two themes evaluated for this research was derived from approximately 900 articles, and Figure 7 depicts the co-citation knowledge network mappings for the journal resource. The interactive map makes it straightforward to identify the most important cited journals. When gathering data, the strength of the links significantly supports the frequency of co-citations for each journal. In addition, the cited journal articles generate knowledge networking mappings of co-cited journals, exhibiting linkage (L) and total link strength (TLS) for each journal. For example, co-citation was discovered to contain connections spanning from 224 down 110 across the knowledge networking mapping’s five highest co-cited publications in order from Theme(a) to Theme(b), namely, Tourism Management (199L and 130668TLS; 224L and 2033TLS), Annals of Tourism Research (199L and 74232TLS; 141L and 9700TLS), International Journal of Forecasting (199L and 52817TLS; 150L and 10277TLS), Journal of Travel Research (198L and 35905TLS; 132L and 7080TLS), and Tourism Economics (195L and 31882TLS; 110L and 3265TLS). These results demonstrate the journals’ power and impact on the tourism demand forecasting and combined tourism demand forecasting fields in terms of co-citation frequency. This conclusion is supported by the fact that each magazine possesses distinctive qualities, such as a persuasive editorial policy and type of peer review, a diverse geographical distribution of editors, and a diverse geographical distribution of writers.
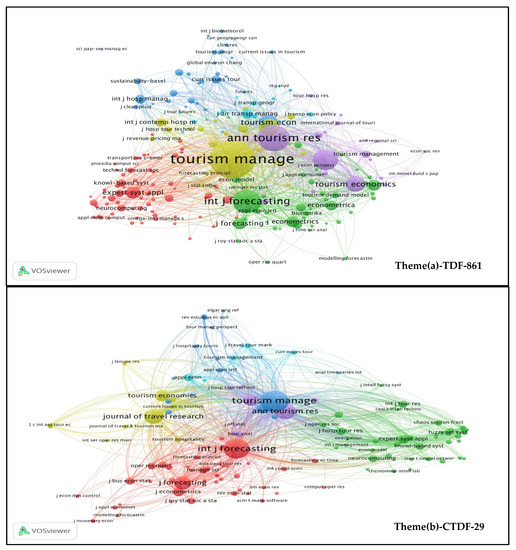
Figure 7.
Cited sources in co-citation for two themes.
Among them, the Journal of Travel Research (JTR) has the highest impact factor (10.982) among the tourism journals. JTR is the oldest of the world’s top-ranked scholarly publications devoted completely to travel and tourism, reflecting the economic and social significance of tourism on a global scale. It provides a worldwide and multidisciplinary viewpoint on the most effective development and management techniques by publishing research that expands our understanding of significant travel and tourism phenomena. Tourism Management (TM) also has a high impact factor (10.967). It is the premier academic publication devoted to travel and tourist management, including planning and policy. The journal examines international, national, and regional tourism as well as specialized management concerns through an interdisciplinary lens. TM welcomes innovative subjects and views that challenge existing paradigms in order to expand the tourism management knowledge base. Annals of Tourism Research (AOTR) ranks as the third journal with a 9.011 impact factor in the tourism category. It is a publication in the social sciences that focuses on scholarly viewpoints on tourism. AOTR is ultimately committed to the development of theoretical conceptions that transcend the commercial, social, and behavioral sciences while attempting to strike a balance between theory and application. Its strategies are to invite and encourage submissions from a variety of disciplines, to serve as a forum through which these disciplines can interact, and thus to contribute to the literature on tourism social science from a multidisciplinary perspective by expanding the frontiers of knowledge and fostering interdisciplinarity. In recent years, the influence of Tourism Economics (TE) has also increased (4.438). It focuses on the broader business elements of tourism. Articles discuss the components of the tourism product as well as the economic organization of tourism at the micro and macro levels. The core subject areas consist of, among others, forecasting, economic development, the structure of the tourism industry, and the regional economic implications of tourism developments. The International Journal of Forecasting (IJOF) publishes high-quality refereed papers covering all aspects of forecasting. Its objective is to unify the field and bridge the gap between theory and practice, making forecasting useful and relevant for decision and policy makers. It is open to many points of view and encourages debate to find solutions for problems facing the field. Topics cover economic and econometric forecasting, financial forecasting, and time series forecasting methods.
Therefore, since the establishment of these journals, there have been 1229 papers on tourism forecasting in the Journal of Travel Research; Tourism Management has 947 articles, with 38 published annually in the last five years; Annals of Tourism Research has 718 articles, with 21 published annually over the past five years. Tourism Economics covered 472 publications, whereas the International Journal of Forecasting covered 126 articles, with an average of six papers produced during the last five years. Most tourism forecasting scholars prefer to publish in one of the first three journals, namely TM and AOTR, partly because these periodicals are edited or reviewed by professionals in the field of tourism forecasting. Scholars in this field can benefit from the diversity of these people’s thoughts and perspectives.
6.1.2. Cited References
The most prominent nodes represent papers that have been mentioned by a variety of researchers in Figure 8. As expected, the majority of cited papers across the network of co-citations were published in Tourism Management and Annals of Tourism Research, as these are the main journals for the greatest number of articles on either of the two data themes. In 2008, Song and Li [6] attained the most citations on tourism demand modeling and forecasting and supported combined forecasting as a study orientation to improve forecasting accuracy. Remarkably, some research focuses on combined forecasting in tourism demand or tourism demand volatility. Wong et al. [93] in 2007 and Song and Li [6] in 2008 in Tourism Management, and Li et al. [116] in 2006 in the Journal of Travel Research, are the most highly cited articles in Theme(b)-CTDF.
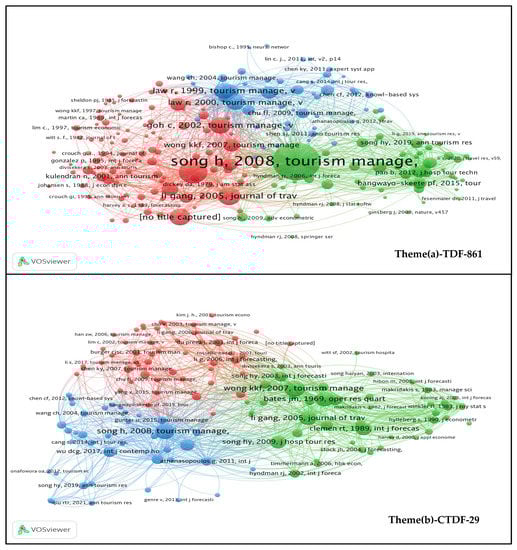
Figure 8.
Cited references in co-citation for two themes.
6.1.3. Cited Authors
According to Figure 9, the cited authors were retrieved within the network through meeting a frequency, citations(C), linkages(L), and total link strength (TLS). The threshold was limited between 200 and 300 in each of the two themes. These top three authors are presented in order of their initial year of co-citation, Theme(a)-TDF-861: Song H.Y., (516C, 215L, 16219TLS), Witt S.F. (443C, 216L, 11304TLS) and Law R. (392C, 216L, 10007TLS); Theme(b)-CTDF-29: Song H.Y. (55C, 139L, 2910TLS), Lim C. (23C, 122L, 1472TLS) and Chu F.L. (24C, 116L, 1421TLS). These two concepts all revolve around Song H.Y. In addition, all authors were engaged in tourism demand forecasting context research or combined tourism demand forecasting context research between 1980 and 2021, showing that they conducted the associated research in an ongoing manner. Therefore, upgrading subjects, such as the TDF and CTDF themes, would rely on the collaboration of academics from comparable domains.
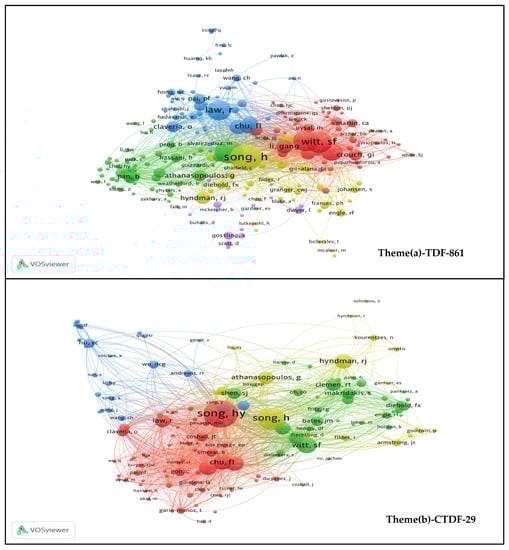
Figure 9.
Cited authors in co-citation for two themes.
Given that a high degree of diversity in scientific research cooperation is beneficial to the increase in scientific research output and the enhancement of the quality of the scientific research output, this is one of the reasons for the high citation rate. Therefore, sharing resources and expertise is viewed as crucial in fostering collaboration. From the perspective of the research level, the research on scientific cooperation can be divided into three levels: between countries/regions, between scientific research institutes or research and development (R&D) enterprises, and between individual scientists and research teams. Their own joint articles are referenced less frequently than publications published by domestic researchers and international authors. Intriguingly, the larger the level of international co-authorship for an academic institution, the higher the quality of its own research in comparison to a single institution’s cooperation. As suggested by the two themes in Figure 9, author qualities influence the desire to cooperate without distinguishing between national and international cooperation. Song H.Y. and Law R. work in the same university and have a strong intellectual partnership. Witt S.F. is from the University of Surrey, Lim C. is from the University of Macau, and Chu F.L. is from the National Taiwan University; they are encouraged to collaborate on research. This trend indicates that the author has a high degree of collaboration diversity and strong cooperation stability. A high degree of cooperation can increase the number of articles with high impact. Therefore, based on these specialists’ research and academic status, scholars will reference and study the new ideas and hotspots introduced by their writing of articles, building a highly cited knowledge network mapping centered on them and advancing the current growth of research in the field.
6.2. Cooperation Networks
Understanding the trends of scientific knowledge flowing through countries/regions, institutions, and authors, and locating significant academic organizations and authors, would be aided by cooperation analysis. Therefore, cooperation networks analyses are crucial for comprehending scholarly interaction and knowledge dissemination [35].
6.2.1. Institutions
For 1980–2021, institutions’ cooperation knowledge network mappings included corporation ties depicted in Figure 10: Theme(a)-TDF-861, with a total of 397 links (L), in order, including The Hong Kong Polytechnic University (110L), University of Surrey (49L), Chinese Academy of Sciences (32L), University of Chinese Academy of sciences (20L), Sun Yat-sen University (17L) and Bournemouth University (15L). Theme(b)-CTDF-29 exhibits a total of 18 links within The Hong Kong Polytechnic University (9L), University of Surrey (9L), Free University of Bozen-Bolzano (6L), Leeds Beckett University (6L), and North-West University (2L). In total, numerous themes are associated with multiple organizations. The Hong Kong Polytechnic University represents a prominent producer and a pioneer in academic tourism forecasting research from a quantitative scope across institutions. Likewise, the Chinese Academy of Sciences, Henan University, Fujian Normal University, Shanxi Normal University, and Guangxi Normal University are among the mainland Chinese universities with whom The Hong Kong Polytechnic has ties.
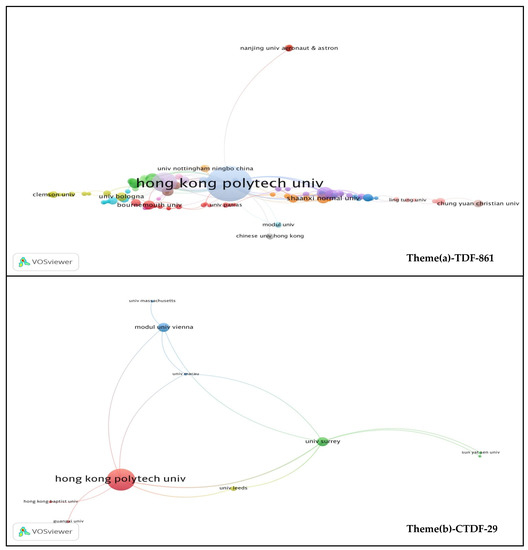
Figure 10.
Institutions in cooperation networks for two themes.
6.2.2. Countries/Regions
As depicted in Figure 11, the knowledge mappings of cooperating establish countries/regions, clusters, links, and total link strength during the years studied. The multiple top three countries/regions were determined throughout the knowledge network mappings based on their relative involvement in papers in this study from two different areas. As for theme(a)-TDF-861, the knowledge mapping refers to 68 countries/regions, 13 clusters, 199 links, and 348 total link strengths. Countries/Regions with the highest publication frequency (documents (D), citations (C), links (L) and total link strength (TLS)) encompass the People’s Republic of China (259D, 7229C, 25L, 100TLS), the UK (87D, 4186C, 29L, 98TLS) and Australia (71D, 2732C, 21L, 56TLS). Theme(b)-CTDF-29, with 14 countries/regions, 4 cluster, 28 links, 32 total link strength, describes the UK (8D, 277C, 11L, 14TLS), People’s Republic of China (18D, 558C, 4L, 8TLS), and France (1D, 10C, 5L, 5TLS).
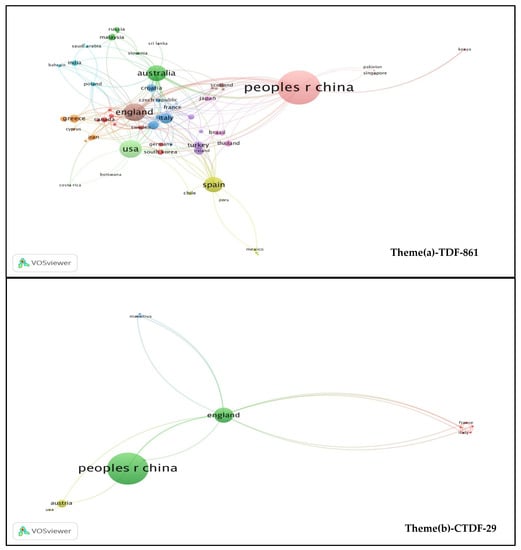
Figure 11.
Countries/Regions in cooperation networks for two themes.
Overall, tourism demand or volatility, research groups, scientific research, and the fraction of tourism-related institutions influence production [18]. Mainland China and Hong Kong (China) produced the most tourism forecasting studies, followed by the UK and Australia. This is due to the fact that these three countries/regions have substantial amounts of tourists, tourism resources, and tourism scholars. Geographical and physical limits, therefore, have a substantial impact on joint efforts. [35]. European nations, such as the United Kingdom, Switzerland, and Spain, contributed more to creating ties with other nations or regions based on their stronger propensity for association and study. However, relations between Asian nations are substantially less close. The findings correspond to the studies conducted by Zhang et al. [8] for 2020. This study shows that research into multilateral tourism collaboration may be boosted in the context of substantial tourism forecasting information. Similarly, the UK, Canada, and European nations may engage bilaterally in tourism research.
6.2.3. Authors
The knowledge network mappings of authors who helped with tourism demand forecasting and combined tourism demand forecasting research are shown in Figure 12. The studies published by Song H.Y. featured the most interconnected cooperative environment, followed by Law R. and Li G. These authors and their work have a prominent guiding effect on tourism forecasting and combined tourism forecasting research. Significantly, the collaboration between writers has become the norm in the field of scientific research. In other words, cooperation can be viewed as a strategic alternative for academics in response to the tradition that journal publications and citations are essential criteria for promotion and tenure or research grants. It enables researchers to participate in multiple research initiatives instead of committing all of their time to a single topic and combining abilities and sharing resources and experience. Cooperation appears to have the ability to improve a scholar’s research output in terms of the number of publications and the effect of their study on later work. For instance, if an author wants to increase the quantity of their scientific research output, they can focus on establishing a stable and high-frequency cooperation model with their partners, increasing the diversity of their partners, and actively cooperating with scholars from various academic backgrounds, which can help them improve the “quality” and “quantity” of their publications.
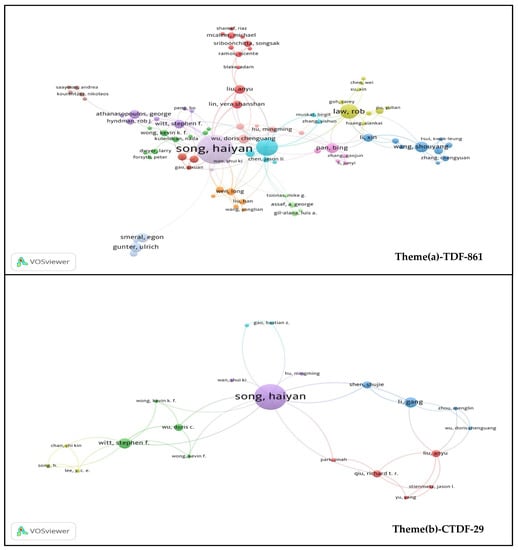
Figure 12.
Authors in cooperation networks for two themes.
In Theme(a)-TDF-861 and Theme(b)-CTDF-29, they gradually established the cooperation centers on Song H.Y. Two interesting points should be noted here: Li G., who collaborated with Song H.Y., hails from the University of Surrey in the UK (shown in the cluster to the left of the image of the group), and Li G., who has developed a close collaborative relationship with Law R., hails from Deakin University in Australia (shown in the cluster to the right of Li G.). Song H.Y. and Law R. are working in the same university (The Hong Kong Polytechnic University) and share the same research interests, academic credentials, and skills. They have engaged in high-frequency collaboration and encouraged Li G. to join them. Consequently, it is evident from the two themes that the scope of international scientific research cooperation in tourism demand forecasting continues to grow. A global network of scientific research cooperation for tourism forecasting has essentially been established. This shows that on the basis of expanding the scale of their collaborators, researchers actively cooperate with researchers with different professional backgrounds, which can improve the heterogeneity of the cooperation network.
Therefore, an exact investigation into the writers’ collaboration must be conducted. Nevertheless, given that members of the same faculties are more likely to interact, the most common sort of collaboration is between employees at the same university or institution, along with cooperation between investigators and past work. The investigation’s outcomes demonstrate how organizational affinity and mentorship links may help in long-term research collaboration. With numerous contributions and different links, the knowledge network mappings illustrate the domains’ multiple features and highlight how interactions between scholars have contributed to the development of the tourism demand forecasting and combined tourism demand forecasting disciplines.
6.3. New Tendency
Clustering paper co-citations can reveal scholar-recognized content, and keywords are a solid indicator for comprehending the research article. Evaluating keywords based on co-occurrence and clustering can identify the rise of hot zones, developing trends, and outburst terms that illustrate evolving trends. Patterns can highlight the study field’s boundaries [117] in tourism demand forecasting and combined tourism demand forecasting research. By examining keyword creation in TDF and CTDF, these knowledge network mappings will clearly display its trend technique. Furthermore, a cluster analysis was undertaken to analyze significant topics, substances, and relationships.
As illustrated in Figure 13, keywords experiencing the highest citation spikes were identified and evaluated using VOSviewer. The top 15 keywords (shown in Table 6) are arranged in order of their publication to analyze research models or methods in greater depth. Figure 13 and Table 6 provide some intriguing outcomes depending on the distribution of top keywords. As previously indicated, the size of each node indicates the frequency with which phrases appear for each of the two themes. The most frequently used terms are “tourist demand”, “tourism”, “forecasting”, “tourism demand forecasting”, and “forecast combination”, which are consistent with the research topic. Thus, the knowledge mapping cooperation center is developed based on the aforementioned keywords in two distinct topics. Second, the three-primary standard methods, the econometric model (i.e., EGARCH), the time series model (i.e., ARIMA, Exponential Smoothing), and the artificial intelligence model (i.e., artificial neural network), may be discovered by analyzing the keyword knowledge network mappings [15].
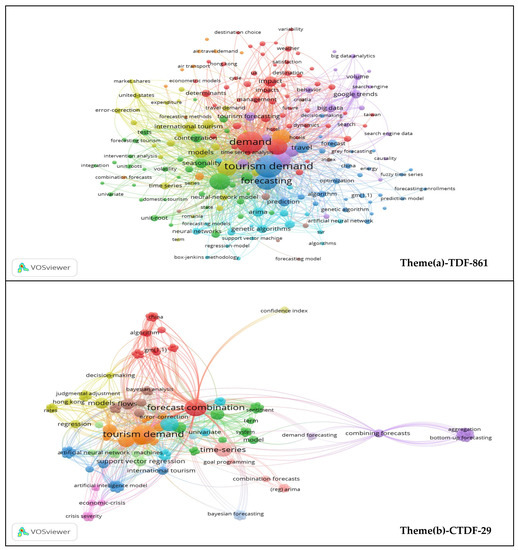
Figure 13.
Keywords clusters in new tendency for two themes.
Table 6.
Keywords clusters for two themes.
6.4. Summary of Combined Tourism Forecasting Methods
In tourism forecasting, empirical outcomes imply that any individual model cannot provide the most reliable forecasts for widespread occurrences [6,76]. As demonstrated by Wong et al. [93] in 2007, the accuracy of combined forecasts is significantly greater than the worst unified forecast models or the average accuracy of separate models, which was also shown by Shen et al. [95] in 2011 and Song et al. [96] in 2009. These systematic reviews may have swayed due to their historical and future significance, but urgent issues raised by new forecasting technology uses have also garnered academic interest.
In order to expedite the conduct of additional combined tourism forecasting research, the purpose of this study is to investigate additional models or approaches suited for tourism forecasting combinations. The following three primary model applications (time series models, econometric models, and AI-based models) refer to different models and methods. Time series models include univariate state space, wavelet analysis, spectrum analysis, Naïve, ES, (S)ARIMA, and others. Econometric models cover (S)AR(I)MAX, ADLM/ARDL, ECM, STSM, VECM, multivariate state space, and more. AI-based models refer to SVR, ANN, grey model, and fuzzy theory [15]. Comparisons of knowledge network mappings reveal that forecasting models have become more diversified, multiple models have been combined, and forecasting accuracy has increased, as seen by the substantial implications drawn from these findings. Table 7 provides an overview of the combined models and methods found in the most cited works on two distinct topics pertaining to these models to ensure that future research analyzes the empirical outputs of people and combines methods for tourism forecasting.
Table 7.
Summary of combined tourism forecasting research.
7. Conclusions
This research is, to the best of the authors’ knowledge, the first attempt to comprehend the evolution in the sub-fields of tourism forecasting for the primary two themes (TDF and CTDF) by combining descriptive analysis and scientometric analysis (i.e., VOSviewer) while mixing them with co-citation, cooperation networks, and emerging tendency perspectives. This effort was conducted to establish thorough knowledge mappings of numerous themes for tourism forecasting and to identify hot topics and emerging regions ripe for development, finally summarizing the combined forecasting methods used in tourism research. The research indicates that a revolutionary visualization approach can be used to fully explore the academic tourism domain. Five fundamental findings are made based on the framework’s descriptive analysis. First, the literature on the two themes mushroomed between the end of the second period and the third period. Second, the general path of tourism in the twenty-first century is one characterized by ongoing growth and diversity, attracting scientists and organizations to research combined tourism forecasting. However, few studies (two articles) in this field cover combined forecasting of tourism demand volatility. Third, based on the number of published authors and organizations, it is evident that China, the United Kingdom, Spain, and Australia dominate tourism forecasting research. Fourth, on the basis of the evaluated papers, the organizations in these nations produced the most research. To be precise, The Hong Kong Polytechnic University is a high-yielding institution that has cultivated close ties with various organizations, whilst Song H.Y., Law R., and Witt S.F. published the most literature. Fifth, the collaboration between authors has become the mainstream of scientific research. The diversity degree of authors’ cooperation is high, the stability of the cooperation is strong, and the degree of cooperation can improve the number of high-influence papers. Therefore, on the basis of the research and academic status of these experts, scholars will cite and learn the new ideas and hot spots put forward by their articles, forming a highly cited knowledge network mappings centered on them, thus promoting the development of research in this field.
This study’s findings demonstrate how bibliometric visualization methods may be used to investigate the tourism forecasting literature. In the meantime, this research provides perspectives on networks of connection and research focus groupings by illustrating the structural analysis of notable authors and papers. Author-to-author connections and collaborations can yield perspectives onto a realm of knowledge. The cluster method utilized in this study emphasizes key works with relevant topics and reveals structural gaps between certain clusters to assist researchers in selecting the areas of study focus. The mappings also detect articles serving as critical links between clusters. The bibliometric visualizations utilized in this work construct valuable datasets by presenting data in multiple colors. A continual perspective on nation co-authorship, co-occurring keywords, and key-paper citation spikes provides insight into new exploratory aspects. It sheds light on the ups and downs of significant advancements and collaboration. These spatiotemporal data enable researchers to explore new territories by highlighting popular subjects, authors, and articles.
The connecting lines of distinct references in two areas have been illustrated in this study. These publications were used to construct the multiple knowledge mappings centered on Tourism Management, Annals of Tourism Research, and International Journal of Forecasting; centered on Song H.Y. in two data themes; centered on China (Mainland, Hong Kong, Macau, and Taiwan); centered on The Hong Kong Polytechnic University; and centered on the keywords (Forecasting, Tourism demand, Tourism demand forecasting, and Forecast combination). However, it should be noted that combined forecasting in tourism research revealed fewer relationships.
On the basis of scientometric analysis with VOSviewer, two findings were made regarding rising patterns, including for the methods used in tourism forecasting studies and popular exploratory topics. The keyword cluster summary of notable papers identifies time series, econometric, and intelligence models as fundamental approaches. In addition, researchers have attempted to improve the accuracy of tourism forecasting by combining forecasts from several models or approaches with keyword clusters. This research on combined forecasting pertains to basic/advanced time series models, static/dynamic econometric models, and combined and hybrid models. As a result of the prevalence of hybrid and combined models or methods, it is forecasted that they will undergo additional rounds of evolution and academic implementation.
As with any research, this study has encountered some limitations. First, the data were gathered from the WoS database, which has several limitations, including an emphasis on full counting and the inability to arrange papers proportionally based on the different categories and levels of journals, conference proceedings, and book chapters. Due to the fact that only journal articles were reviewed in this study, only a limited number of academic works, such as articles, conference papers, references, and books, were included in the data collection phase. Moreover, tourism demand forecasting papers published in languages other than English may have been excluded from the WoS database. As the tourism forecasting area refers to multiple topics, this research only compared two themes. Despite these limitations, the results provide a comprehensive bibliometric overview of the main research trends in tourism demand forecasting across the 41 years since its inception. Future tourism demand forecasting research can concentrate on achieving the more realistic incorporation of internet datasets throughout the big data revolution in terms of current hot topics. It should also be highlighted that big data can enhance the accuracy of forecasting. Future studies will be able to expand the reach of databases such as Google Scholar and Scopus while applying a broader range of dependable approaches, such as sentimental analysis, to assist researchers in conducting data analyses and making advancements in the field of tourism forecasting. In addition, future studies can include conference papers and book chapters to diversify the dataset and enrich their findings. Furthermore, future research can conduct more systematic investigations into the development trend of tourism demand forecasting approaches, thereby contributing to the field’s advancement. This study’s findings reveal that tourism-related events such as COVID-19, theme parks, information technology (VR Tourism), and transportation development substantially impact the volatility of tourism demand. Currently, these are all study fields that are mainly untouched. Moreover, subsequent studies can incorporate further comparisons and analyses on relevant themes by examining other potential future keywords. Despite the restricted number of papers on tourism demand volatility forecasting, they can serve as a starting point for future studies. Finally, certain tourism forecasting research areas, including combined methods, have mainly retrospectively evaluated publications despite there being few studies, particularly in combined forecasting of tourism demand volatility. These areas are therefore suggested for future tourism forecasting research.
Author Contributions
Y.Z. proposed the research framework, conceptualization, formal analysis, methodology, data curation and writing—original draft preparation. W.C.C., Y.A.A., C.L.Y. and J.S.H. worked on the writing—review and editing and supervision. All authors have read and agreed to the published version of the manuscript.
Funding
This research received no external funding.
Institutional Review Board Statement
Not applicable.
Informed Consent Statement
Not applicable.
Data Availability Statement
The data used to support the findings of this study are included within the text.
Acknowledgments
The authors would like to thank the “RightsLink”, “Copyright Clearance Center, Inc.”, “John Wiley & Sons, Inc.” and “Elsevier” that provided the copyright licenses for adapted or cited tables and figures in this research. The authors are also grateful to “Cobo, M.J.; López-Herrera, A.G.; Herrera-Viedma, E.; Herrera, F. Science mapping software tools: Review, analysis, and cooperative study among tools. J. Am. Soc. Inf. Sci. Technol. 2011, 62, 1382–1402.” for providing Table 1 copyright permission; “Yuan, Y.; Gretzel, U.; Tseng, Y.H. Revealing the Nature of Contemporary Tourism Research: Extracting Common Subject Areas through Bibliographic Coupling. Int. J. Tour. Res. 2014, 17, 417–431.” for providing Figure 1 copyright permission; and “Jun, W.; Yuyan, L.; Lingyu, T.; Peng, G. Modeling a combined forecast algorithm based on sequence patterns and near characteristics: An application for tourism demand forecasting. Chaos Solitons Fractals 2018, 108, 136–147.” for providing Figure 3 copyright permission. Meanwhile, the authors appreciated anonymous reviewers for their constructive comments.
Conflicts of Interest
The authors declare no conflict of interest.
References
- Jiao, X.; Li, G.; Chen, J.L. Forecasting international tourism demand: A local spatiotemporal model. Ann. Tour. Res. 2020, 83, 102937. [Google Scholar] [CrossRef]
- Gunter, U.; Önder, I. Forecasting international city tourism demand for Paris: Accuracy of uni-and multivariate models employing monthly data. Tour. Manag. 2015, 46, 123–135. [Google Scholar] [CrossRef]
- Li, G.; Song, H.; Witt, S.F. Recent developments in econometric modeling and forecasting. J. Travel Res. 2005, 44, 82–99. [Google Scholar] [CrossRef]
- Pan, B.; Yang, Y. Forecasting destination weekly hotel occupancy with big data. J. Travel Res. 2017, 56, 957–970. [Google Scholar] [CrossRef]
- Shen, S.; Li, G.; Song, H. An assessment of combining tourism demand forecasts over different time horizons. J. Travel Res. 2008, 47, 197–207. [Google Scholar] [CrossRef]
- Song, H.; Li, G. Tourism demand modelling and forecasting—A review of recent research. Tour. Manag. 2008, 29, 203–220. [Google Scholar] [CrossRef]
- Xie, G.; Qian, Y.; Wang, S. A decomposition-ensemble approach for tourism forecasting. Ann. Tour. Res. 2020, 81, 102891. [Google Scholar] [CrossRef] [PubMed]
- Zhang, C.; Wang, S.; Sun, S.; Wei, Y. Knowledge mapping of tourism demand forecasting research. Tour. Manag. Perspect. 2020, 35, 100715. [Google Scholar] [CrossRef] [PubMed]
- Chen, K.Y. Combining linear and nonlinear model in forecasting tourism demand. Expert Syst. Appl. 2011, 38, 10368–10376. [Google Scholar] [CrossRef]
- Jogaratnam, G.; Chon, K.; McCleary, K.; Mena, M.; Yoo, J. An analysis of institutional contributors to three major academic tourism journals: 1992–2001. Tour. Manag. 2005, 26, 641–648. [Google Scholar] [CrossRef]
- Li, X.; Pan, B.; Law, R.; Huang, X. Forecasting tourism demand with composite search index. Tour. Manag. 2017, 59, 57–66. [Google Scholar] [CrossRef]
- Park, K.; Phillips, W.M.J.; Canter, D.D.; Abbott, J.A. Hospitality and tourism research rankings by author, university, and country using six major journals: The first decade of the new millennium. J. Hosp. Tour. Res. 2011, 35, 381–416. [Google Scholar] [CrossRef]
- Liu, H.; Liu, Y.; Wang, Y.; Pan, C. Hot topics and emerging trends in tourism forecasting research: A scientometric review. Tour. Econ. 2019, 25, 448–468. [Google Scholar] [CrossRef]
- Lee, H.A.; Au, N.; Li, G.; Law, R. An insight into research performance through a citation counting analysis. J. Hosp. Tour. Manag. 2014, 21, 54–63. [Google Scholar] [CrossRef]
- Song, H.; Qiu, R.T.; Park, J. A review of research on tourism demand forecasting: Launching the Annals of Tourism Research Curated Collection on tourism demand forecasting. Ann. Tour. Res. 2019, 75, 338–362. [Google Scholar] [CrossRef]
- Köseoglu, M.A.; Sehitoglu, Y.; Craft, J. Academic foundations of hospitality management research with an emerging country focus: A citation and co-citation analysis. Int. J. Hosp. Manag. 2015, 45, 130–144. [Google Scholar] [CrossRef]
- Xiao, H.; Smith, S.L.J. The making of tourism research: Insights from a social sciences journal. Ann. Tour. Res. 2006, 33, 490–507. [Google Scholar] [CrossRef]
- Fang, Y.; Yin, J.; Wu, B. Climate change and tourism: A scientometric analysis using CiteSpace. J. Sustain. Tour. 2018, 26, 108–126. [Google Scholar] [CrossRef]
- Li, X.; Ma, E.; Qu, H. Knowledge mapping of hospitality research− A visual analysis using CiteSpace. Int. J. Hosp. Manag. 2017, 60, 77–93. [Google Scholar] [CrossRef]
- Benckendorff, P.; Zehrer, A. A network analysis of tourism research. Ann. Tour. Res. 2013, 43, 121–149. [Google Scholar] [CrossRef]
- Barrios, M.; Borrego, A.; Vilaginés, A.; Ollé, C.; Somoza, M. A bibliometric study of psychological research on tourism. Scientometrics 2008, 77, 453–467. [Google Scholar] [CrossRef]
- Bornmann, L.; Mutz, R. Growth rates of modern science: A bibliometric analysis based on the number of publications and cited references. J. Assoc. Inf. Sci. Technol. 2015, 66, 2215–2222. [Google Scholar] [CrossRef]
- Chiu, W.T.; Ho, Y.S. Bibliometric analysis of tsunami research. Scientometrics 2007, 73, 3–17. [Google Scholar] [CrossRef]
- Ellegaard, O.; Wallin, J.A. The bibliometric analysis of scholarly production: How great is the impact? Scientometrics 2015, 105, 1809–1831. [Google Scholar] [CrossRef]
- Fahimnia, B.; Sarkis, J.; Davarzani, H. Green supply chain management: A review and bibliometric analysis. Int. J. Prod. Econ. 2015, 162, 101–114. [Google Scholar] [CrossRef]
- Gaviria-Marin, M.; Merigó, J.M.; Baier-Fuentes, H. Knowledge management: A global examination based on bibliometric analysis. Technol. Forecast. Soc. Change 2019, 140, 194–220. [Google Scholar] [CrossRef]
- Gaviria-Marin, M.; Merigo, J.M.; Popa, S. Twenty years of the Journal of Knowledge Management: A bibliometric analysis. J. Knowl. Manag. 2018, 22, 1655–1687. [Google Scholar] [CrossRef]
- Martínez-López, F.J.; Merigó, J.M.; Valenzuela-Fernández, L.; Nicolás, C. Fifty years of the European Journal of Marketing: A bibliometric analysis. Eur. J. Mark. 2018, 52, 439–468. [Google Scholar] [CrossRef]
- Merigó, J.M.; Yang, J.B. A bibliometric analysis of operations research and management science. Omega 2017, 73, 37–48. [Google Scholar] [CrossRef]
- Mora, L.; Bolici, R.; Deakin, M. The first two decades of smart-city research: A bibliometric analysis. J. Urban Technol. 2017, 24, 3–27. [Google Scholar] [CrossRef]
- Van Eck, N.J.; Waltman, L. Software survey: VOSviewer, a computer program for bibliometric mapping. Scientometrics 2010, 84, 523–538. [Google Scholar] [CrossRef]
- Cobo, M.J.; López-Herrera, A.G.; Herrera-Viedma, E.; Herrera, F. Science mapping software tools: Review, analysis, and cooperative study among tools. J. Am. Soc. Inf. Sci. Technol. 2011, 62, 1382–1402. [Google Scholar] [CrossRef]
- Denyer, D.; Tranfield, D. Using qualitative research synthesis to build an actionable knowledge base. Manag. Decis. 2006, 44, 213–227. [Google Scholar] [CrossRef]
- Tranfield, D.; Denyer, D.; Smart, P. Towards a methodology for developing evidence in formed management knowledge by means of systematic review. Br. J. Manag. 2003, 14, 207–222. [Google Scholar] [CrossRef]
- Jiang, Y.; Ritchie, B.W.; Benckendorff, P. Bibliometric visualisation: An application in tourism crisis and disaster management research. Curr. Issues Tour. 2019, 22, 1925–1957. [Google Scholar] [CrossRef]
- Pritchard, A. Statistical bibliography or bibliometrics. J. Doc. 1969, 25, 348–349. [Google Scholar]
- Sigala, M.; Kumar, S.; Donthu, N.; Sureka, R.; Joshi, Y. A bibliometric overview of the Journal of Hospitality and Tourism Management: Research contributions and influence. J. Hosp. Tour. Manag. 2021, 47, 273–288. [Google Scholar] [CrossRef]
- Broadus, R.N. Toward a definition of “bibliometrics”. Scientometrics 1987, 12, 373–379. [Google Scholar] [CrossRef]
- Zupic, I.; Čater, T. Bibliometric methods in management and organization. Organ. Res. Methods 2015, 18, 429–472. [Google Scholar] [CrossRef]
- Cehan, A.; Eva, M.; Iațu, C. A multilayer network approach to tourism collaboration. J. Hosp. Tour. Manag. 2021, 46, 316–326. [Google Scholar] [CrossRef]
- Cobo, M.J.; López-Herrera, A.G.; Herrera-Viedma, E.; Herrera, F. An approach for detecting, quantifying, and visualizing the evolution of a research field: A practical application to the fuzzy sets theory field. J. Informetr. 2011, 5, 146–166. [Google Scholar] [CrossRef]
- Small, J.; Harris, C.; Wilson, E. Gender on the agenda? The position of gender in tourism’s high ranking journals. J. Hosp. Tour. Manag. 2017, 100, 114–117. [Google Scholar] [CrossRef]
- Ye, Q.; Song, H.; Li, T. Cross-institutional collaboration networks in tourism and hospitality research. Tour. Manag. Perspect. 2012, 2, 55–64. [Google Scholar] [CrossRef]
- Kessler, M.M. Bibliographic coupling between scientific papers. Am. Doc. 1963, 14, 10–25. [Google Scholar] [CrossRef]
- Small, H. Co-citation in the scientific literature: A new measure of the relationship between two documents. J. Am. Soc. Inf. Sci. 1973, 24, 265–269. [Google Scholar] [CrossRef]
- Callon, M.; Courtial, J.P.; Turner, W.A.; Bauin, S. From translations to problematic networks: An introduction to co-word analysis. Soc. Sci. Inf. 1983, 22, 191–235. [Google Scholar] [CrossRef]
- Peters, H.; Van Raan, A. Structuring scientific activities by co-author analysis: An expercise on a university faculty level. Scientometrics 1991, 20, 235–255. [Google Scholar] [CrossRef]
- Glänzel, W. National characteristics in international scientific co-authorship relations. Scientometrics 2001, 51, 69–115. [Google Scholar] [CrossRef]
- Ding, Y.; Chowdhury, G.G.; Foo, S. Bibliometric cartography of information retrieval research by using co-word analysis. Inf. Processing Manag. 2001, 37, 817–842. [Google Scholar] [CrossRef]
- McCain, K.W. Mapping authors in intellectual space: A technical overview. J. Am. Soc. Inf. Sci. 1990, 41, 433–443. [Google Scholar] [CrossRef]
- Culnan, M.J. The intellectual development of management information systems, 1972–1982: A co-citation analysis. Manag. Sci. 1986, 32, 156–172. [Google Scholar] [CrossRef]
- Small, H.G. Cited documents as concept symbols. Soc. Stud. Sci. 1978, 8, 327–340. [Google Scholar] [CrossRef]
- Wang, N.; Liang, H.; Jia, Y.; Ge, S.; Xue, Y.; Wang, Z. Cloud computing research in the IS discipline: A citation/co-citation analysis. Decis. Support Syst. 2016, 86, 35–47. [Google Scholar] [CrossRef]
- Chang, Y.W.; Huang, M.H.; Lin, C.W. Evolution of research subjects in library and information science based on keyword, bibliographical coupling, and co-citation analyses. Scientometrics 2015, 105, 2071–2087. [Google Scholar] [CrossRef]
- Leung, X.Y.; Sun, J.; Bai, B. Bibliometrics of social media research: A co-citation and co-word analysis. Int. J. Hosp. Manag. 2017, 66, 35–45. [Google Scholar] [CrossRef]
- Jarneving, B. A comparison of two bibliometric methods for mapping of the research front. Scientometrics 2005, 65, 245–263. [Google Scholar] [CrossRef]
- Yuan, Y.; Gretzel, U.; Tseng, Y.H. Revealing the Nature of Contemporary Tourism Research: Extracting Common Subject Areas through Bibliographic Coupling. Int. J. Tour. Res. 2014, 17, 417–431. [Google Scholar] [CrossRef]
- Whittaker, J. Creativity and conformity in science: Titles, keywords and co-word analysis. Soc. Stud. Sci. 1989, 19, 473–496. [Google Scholar] [CrossRef]
- Van Raan, A.F. Fatal attraction: Conceptual and methodological problems in the ranking of universities by bibliometric methods. Scientometrics 2005, 62, 133–143. [Google Scholar] [CrossRef]
- Vogel, R.; Güttel, W.H. The dynamic capability view in strategic management: A bibliometric review. Int. J. Manag. Rev. 2013, 15, 426–446. [Google Scholar] [CrossRef]
- Tao, J.; Qiu, D.; Yang, F.; Duan, Z. A bibliometric analysis of human reliability research. J. Clean. Prod. 2020, 260, 121041. [Google Scholar] [CrossRef]
- Jafari, J. Research and scholarship: The basis of tourism education. J. Tour. Stud. 1990, 1, 33–41. [Google Scholar]
- Hall, C.M. Publish and perish? Bibliometric analysis, journal ranking and the assessment of research quality in tourism. Tour. Manag. 2011, 32, 16–27. [Google Scholar] [CrossRef]
- McKercher, B. Influence ratio: An alternate means to assess the relative influence of hospitality and tourism journals on research. Int. J. Hosp. Manag. 2012, 31, 962–971. [Google Scholar] [CrossRef]
- Ying, T.; Xiao, H. Knowledge Linkage: A Social Network Analysis of Tourism Dissertation Subjects. J. Hosp. Tour. Res. 2012, 36, 450–477. [Google Scholar] [CrossRef]
- Ballantyne, R.; Packer, J.; Axelsen, M. Trends in tourism research. Ann. Tour. Res. 2009, 36, 149–152. [Google Scholar] [CrossRef]
- Cheng, C.K.; Li, X.R.; Petrick, J.F.; O’Leary, J.T. An examination of tourism journal development. Tour. Manag. 2011, 32, 53–61. [Google Scholar] [CrossRef]
- McKercher, B.; Law, R.; Lam, T. Rating tourism and hospitality journals. Tour. Manag. 2006, 27, 1235–1252. [Google Scholar] [CrossRef]
- Pikkemaat, B.; Peters, M.; Bichler, B.F. Innovation research in tourism: Research streams and actions for the future. J. Hosp. Tour. Manag. 2019, 41, 184–196. [Google Scholar] [CrossRef]
- Witt, S.F.; Witt, C.A. Forecasting tourism demand: A review of empirical research. Int. J. Forecast. 1995, 11, 447–475. [Google Scholar] [CrossRef]
- Li, G. Tourism Demand Modeling and Forecasting: A Review of Literature Related to Greater China. J. China Tour. Res. 2009, 5, 2–40. [Google Scholar] [CrossRef]
- Wang, M.; Song, H. Air Travel Demand Studies: A Review. J. China Tour. Res. 2010, 6, 29–49. [Google Scholar] [CrossRef]
- Goh, C.; Law, R. The methodological progress of tourism demand forecasting: A review of related literature. J. Travel Tour. Mark. 2011, 28, 296–317. [Google Scholar] [CrossRef]
- Peng, B.; Song, H.; Crouch, G.I. A meta-analysis of international tourism demand forecasting and implications for practice. Tour. Manag. 2014, 45, 181–193. [Google Scholar] [CrossRef]
- Lin, V.S.; Song, H. A review of Delphi forecasting research in tourism. Curr. Issues Tour. 2015, 18, 1099–1131. [Google Scholar] [CrossRef]
- Wu, D.C.; Song, H.; Shen, S. New developments in tourism and hotel demand modeling and forecasting. Int. J. Contemp. Hosp. Manag. 2017, 29, 507–529. [Google Scholar] [CrossRef]
- Ghalehkhondabi, I.; Ardjmand, E.; Young, W.A.; Weckman, G.R. A review of demand forecasting models and methodological developments within tourism and passenger transportation industry. J. Tour. Futures 2019, 5, 75–93. [Google Scholar] [CrossRef]
- Jiao, E.X.; Chen, J.L. Tourism forecasting: A review of methodological developments over the last decade. Tour. Econ. 2019, 25, 469–492. [Google Scholar] [CrossRef]
- Li, X.; Law, R.; Xie, G.; Wang, S. Review of tourism forecasting research with internet data. Tour. Manag. 2021, 83, 104245. [Google Scholar] [CrossRef]
- Wang, S.; Gao, Y. A literature review and citation analyses of air travel demand studies published between 2010 and 2020. J. Air Transp. Manag. 2021, 97, 102135. [Google Scholar] [CrossRef]
- Garfield, E. The evolution of the science citation index. Int. Microbiol. 2007, 10, 65. [Google Scholar] [PubMed]
- Van Leeuwen, T. The application of bibliometric analyses in the evaluation of social science research. Who benefits from it, and why it is still feasible. Scientometrics 2006, 66, 133–154. [Google Scholar] [CrossRef]
- Jun, W.; Yuyan, L.; Lingyu, T.; Peng, G. Modeling a combined forecast algorithm based on sequence patterns and near characteristics: An application for tourism demand forecasting. Chaos Solitons Fractals 2018, 108, 136–147. [Google Scholar] [CrossRef]
- Claveria, O.; Monte, E.; Torra, S. Common trends in international tourism demand: Are they useful to improve tourism predictions? Tour. Manag. Perspect. 2015, 16, 116–122. [Google Scholar] [CrossRef]
- Chen, R.; Liang, C.Y.; Hong, W.C.; Gu, D.X. Forecasting holiday daily tourist flow based on seasonal support vector regression with adaptive genetic algorithm. Appl. Soft Comput. 2015, 26, 435–443. [Google Scholar] [CrossRef]
- Tsaur, R.C.; Kuo, T.C. The adaptive fuzzy time series model with an application to Taiwan’s tourism demand. Expert Syst. Appl. 2011, 38, 9164–9171. [Google Scholar] [CrossRef]
- Goh, C.; Law, R.; Mok, H.M. Analyzing and forecasting tourism demand: A rough sets approach. J. Travel Res. 2008, 46, 327–338. [Google Scholar] [CrossRef]
- Sun, X.; Sun, W.; Wang, J.; Zhang, Y.; Gao, Y. Using a Grey–Markov model optimized by Cuckoo search algorithm to forecast the annual foreign tourist arrivals to China. Tour. Manag. 2016, 52, 369–379. [Google Scholar] [CrossRef]
- Uysal, M.; Crompton, J.L. An overview of approaches used to forecast tourism demand. J. Travel Res. 1985, 23, 7–15. [Google Scholar] [CrossRef]
- Vanhove, N. Forecasting in tourism. Tour. Rev. 1980, 35, 2–7. [Google Scholar] [CrossRef]
- Kaynak, E.; Macaulay, J.A. The Delphi technique in the measurement of tourism market potential: The case of Nova Scotia. Tour. Manag. 1984, 5, 87–101. [Google Scholar] [CrossRef]
- Moutinho, L.; Witt, S.F. Forecasting the tourism environment using a consensus approach. J. Travel Res. 1995, 33, 46–50. [Google Scholar] [CrossRef]
- Wong, K.K.; Song, H.; Witt, S.F.; Wu, D.C. Tourism forecasting: To combine or not to combine? Tour. Manag. 2007, 28, 1068–1078. [Google Scholar] [CrossRef]
- Taylor, J.W. Forecast combinations for value at risk and expected shortfall. Int. J. Forecast. 2020, 36, 428–441. [Google Scholar] [CrossRef]
- Shen, S.; Li, G.; Song, H. Combination forecasts of international tourism demand. Ann. Tour. Res. 2011, 38, 72–89. [Google Scholar] [CrossRef]
- Song, H.; Witt, S.F.; Wong, K.F.; Wu, D.C. An empirical study of forecast combination in tourism. J. Hosp. Tour. Res. 2009, 33, 3–29. [Google Scholar] [CrossRef]
- Dergiades, T.; Mavragani, E.; Pan, B. Google Trends and tourists’ arrivals: Emerging biases and proposed corrections. Tour. Manag. 2018, 66, 108–120. [Google Scholar] [CrossRef]
- Shahrabi, J.; Hadavandi, E.; Asadi, S. Developing a hybrid intelligent model for forecasting problems: Case study of tourism demand time series. Knowl.-Based Syst. 2013, 43, 112–122. [Google Scholar] [CrossRef]
- Hyndman, R.J.; Ahmed, R.A.; Athanasopoulos, G.; Shang, H.L. Optimal combination forecasts for hierarchical time series. Comput. Stat. Data Anal. 2011, 55, 2579–2589. [Google Scholar] [CrossRef]
- Balli, H.O.; Tsui, W.H.K.; Balli, F. Modelling the volatility of international visitor arrivals to New Zealand. J. Air Transp. Manag. 2019, 75, 204–214. [Google Scholar] [CrossRef]
- Coshall, J.T. Combining volatility and smoothing forecasts of UK demand for international tourism. Tour. Manag. 2009, 30, 495–511. [Google Scholar]
- Coshall, J.T.; Charlesworth, R. A management orientated approach to combination forecasting of tourism demand. Tour. Manag. 2011, 32, 759–769. [Google Scholar] [CrossRef]
- Wan, S.K.; Song, H. Forecasting turning points in tourism growth. Ann. Tour. Res. 2018, 72, 156–167. [Google Scholar] [CrossRef]
- Lenzen, M.; Sun, Y.Y.; Faturay, F.; Ting, Y.P.; Geschke, A.; Malik, A. The carbon footprint of global tourism. Nat. Clim. Change 2018, 8, 522–528. [Google Scholar] [CrossRef]
- Goh, C.; Law, R. Modeling and forecasting tourism demand for arrivals with stochastic nonstationary seasonality and intervention. Tour. Manag. 2002, 23, 499–510. [Google Scholar] [CrossRef]
- Chen, K.Y.; Wang, C.H. Support vector regression with genetic algorithms in forecasting tourism demand. Tour. Manag. 2007, 28, 215–226. [Google Scholar] [CrossRef]
- Law, R. Back-propagation learning in improving the accuracy of neural network-based tourism demand forecasting. Tour. Manag. 2000, 21, 331–340. [Google Scholar] [CrossRef]
- Law, R.; Au, N. A neural network model to forecast Japanese demand for travel to Hong Kong. Tour. Manag. 1999, 20, 89–97. [Google Scholar] [CrossRef]
- Yang, X.; Pan, B.; Evans, J.A.; Lv, B. Forecasting Chinese tourist volume with search engine data. Tour. Manag. 2015, 46, 386–397. [Google Scholar] [CrossRef]
- Huang, J.H.; Min, J.C. Earthquake devastation and recovery in tourism: The Taiwan case. Tour. Manag. 2002, 23, 145–154. [Google Scholar] [CrossRef]
- Cho, V. A comparison of three different approaches to tourist arrival forecasting. Tour. Manag. 2003, 24, 323–330. [Google Scholar] [CrossRef]
- Andrawis, R.R.; Atiya, A.F.; El-Shishiny, H. Combination of long term and short term forecasts, with application to tourism demand forecasting. Int. J. Forecast. 2011, 27, 870–886. [Google Scholar] [CrossRef]
- Gunter, U.; Önder, I. Forecasting city arrivals with Google Analytics. Ann. Tour. Res. 2016, 61, 199–212. [Google Scholar] [CrossRef]
- Pai, P.F.; Hung, K.C.; Lin, K.P. Tourism demand forecasting using novel hybrid system. Expert Syst. Appl. 2014, 41, 3691–3702. [Google Scholar] [CrossRef]
- Song, H.; Gao, B.Z.; Lin, V.S. Combining statistical and judgmental forecasts via a web-based tourism demand forecasting system. Int. J. Forecast. 2013, 29, 295–310. [Google Scholar] [CrossRef]
- Li, G.; Wong, K.K.; Song, H.; Witt, S.F. Tourism demand forecasting: A time varying parameter error correction model. J. Travel Res. 2006, 45, 175–185. [Google Scholar] [CrossRef]
- Gunter, U.; Önder, I.; Smeral, E. Scientific value of econometric tourism demand studies. Ann. Tour. Res. 2019, 78, 102738. [Google Scholar] [CrossRef]
- Blake, A.; Durbarry, R.; Eugenio-Martin, J.L.; Gooroochurn, N.; Hay, B.; Lennon, J.; Sinclair, M.T.; Sugiyarto, G.; Yeoman, I. Integrating forecasting and CGE models: The case of tourism in Scotland. Tour. Manag. 2006, 27, 292–305. [Google Scholar] [CrossRef]
- Chan, C.K.; Witt, S.F.; Lee, Y.C.E.; Song, H. Tourism forecast combination using the CUSUM technique. Tour. Manag. 2010, 31, 891–897. [Google Scholar] [CrossRef]
- Liu, L. Demand forecast of regional tourism based on variable weight combination model. In International Conference on Information Computing and Applications; Springer: Berlin/Heidelberg, Germany, 2012. [Google Scholar]
- Croce, V. Can tourism confidence index improve tourism demand forecasts? Journal of Tourism Futures. 2016, 2, 6–21. [Google Scholar] [CrossRef]
- Li, G.; Wu, D.C.; Zhou, M.; Liu, A. The combination of interval forecasts in tourism. Ann. Tour. Res. 2019, 75, 363–378. [Google Scholar] [CrossRef]
- Hu, M.; Song, H. Data source combination for tourism demand forecasting. Tour. Econ. 2020, 26, 1248–1265. [Google Scholar] [CrossRef]
- Jiang, P.; Yang, H.; Li, R.; Li, C. Inbound tourism demand forecasting framework based on fuzzy time series and advanced optimization algorithm. Appl. Soft Comput. 2020, 92, 106320. [Google Scholar] [CrossRef]
- Gunter, U.; Önder, I.; Smeral, E. Are Combined Tourism Forecasts Better at Minimizing Forecasting Errors? Forecasting 2020, 2, 211–229. [Google Scholar] [CrossRef]
- Ma, X. Tourism Demand Forecasting Based on Grey Model and BP Neural Network. Complexity 2021, 2021, 1–13. [Google Scholar] [CrossRef]
- Qiu, R.T.; Liu, A.; Stienmetz, J.L.; Yu, Y. Timing matters: Crisis severity and occupancy rate forecasts in social unrest periods. Int. J. Contemp. Hosp. Manag. 2021, 33, 2044–2064. [Google Scholar] [CrossRef]
- Sánchez-Sánchez, F.J.; Sánchez, A.M.S. Forecasting models for the Andalusian tourism sector using advanced statistical methods. Cuad. Tur. 2021, 48, 525–529. [Google Scholar]
- Hu, Y.C.; Wu, G.; Jiang, P. Tourism Demand Forecasting Using Nonadditive Forecast Combinations. J. Hosp. Tour. Res. 2021. [Google Scholar] [CrossRef]
- Gunter, U. Improving Hotel Room Demand Forecasts for Vienna across Hotel Classes and Forecast Horizons: Single Models and Combination Techniques Based on Encompassing Tests. Forecasting 2021, 3, 884–919. [Google Scholar] [CrossRef]
- Hu, Y.C. Forecasting the demand for tourism using combinations of forecasts by neural network-based interval grey prediction models. Asia Pac. J. Tour. Res. 2021, 26, 1350–1363. [Google Scholar] [CrossRef]
Publisher’s Note: MDPI stays neutral with regard to jurisdictional claims in published maps and institutional affiliations. |
© 2022 by the authors. Licensee MDPI, Basel, Switzerland. This article is an open access article distributed under the terms and conditions of the Creative Commons Attribution (CC BY) license (https://creativecommons.org/licenses/by/4.0/).