Article

Mobility and Dissemination of COVID-19 in Portugal: Correlations and Estimates from Google’s Mobility Data

1
Portugal and Associated Laboratory Terra, Institute of Geography and Spatial Planning, Centre of Geographical Studies, University of Lisbon, 1600-276 Lisbon, Portugal
2
Directorate-General for Territory, 1099-052 Lisbon, Portugal
*
Author to whom correspondence should be addressed.
Data 2022, 7(8), 107; https://doi.org/10.3390/data7080107
Submission received: 1 May 2022 / Revised: 20 July 2022 / Accepted: 27 July 2022 / Published: 31 July 2022
(This article belongs to the Special Issue Health Informatics in the Age of COVID-19)

Abstract

:
The spread of the coronavirus disease 2019 (COVID-19) has important links with population mobility. Social interaction is a known determinant of human-to-human transmission of infectious diseases and, in turn, population mobility as a proxy of interaction is of paramount importance to analyze COVID-19 diffusion. Using mobility data from Google’s Community Reports, this paper captures the association between changes in mobility patterns through time and the corresponding COVID-19 incidence at a multi-scalar approach applied to mainland Portugal. Results demonstrate a strong relationship between mobility data and COVID-19 incidence, suggesting that more mobility is associated with more COVID-19 cases. Methodological procedures can be summarized in a multiple linear regression with a time moving window. Model validation demonstrate good forecast accuracy, particularly when we consider the cumulative number of cases. Based on this premise, it is possible to estimate and predict future evolution of the number of COVID-19 cases using near real-time information of population mobility.

1. Introduction

The coronavirus disease 2019 (COVID-19) has spread across the world and one year after the first confirmed case more than 100 million cases have been accounted worldwide, more than 2 million of them resulting in death. In March 2022, two years after the pandemic declaration, the number of confirmed cases has risen to nearly 500 million and fatalities have surpassed 6 million.
The spread of the disease, caused by the transmission of the severe acute respiratory syndrome coronavirus 2 (SARS-CoV-2), occurred quicker and to a greater extent than previous coronavirus epidemics [1]. In this sense, it forced countries to adopt epidemic containment measures [2]. In an increasingly globalized world, mobility is responsible for reducing epidemiological differences between regions [3], with travel restrictions being among the first non-therapeutic strategies to contain the spread of pathogens [4]. Therefore, being mobility the main driver of human contact and intrinsically associated with social interaction [5], essential to SARS-CoV-2 transmission, the main objective of non-therapeutic measures, widely adopted to stop human to human transmission, has been travel restrictions to force population to stay at home to reduce contacts [1,6]. Thus, reduced mobility is associated with decreasing transmission of COVID-19 [7,8,9,10].
Several studies show a strong relationship between COVID-19 cases and people mobility, identifying commuting behaviors as a spatial determinant of COVID-19 patterns [11,12,13,14,15,16]. Nonetheless, other authors have specifically analysed mobility based on near real-time information. The use of this kind of data is not new to epidemiological studies which shows good performance for trends and spatial patterns identification [17,18]. Regarding this pandemic, the work of Jia et al. [19] was pioneer in the identification that information on population mobility is epidemiologically informative of COVID-19 diffusion. Using mobile phone data, the authors identified that population movement within China explains with significance the geographical patterns of COVID-19 transmission. The study of Badr et al. [20] demonstrates a strong correlation between population mobility patterns and variation of COVID-19 incidence in 25 counties of the United States (US) and Kraemer et al. [6] proved the importance of mobility and travel restrictions in reducing COVID-19 transmission in China. In addition, the authors assessed that epidemic magnitude is also predictable from the volume of human movement. Yilmazkuday [21] research quantified the importance of travel between counties in the US concluding that where the population tends to stay at home more, there is less uncontrolled evolution of the pandemic and less chance of infection. In the European context, Cartenì et al. [22] related mobility habits with the evolution of the number of new infections over a 21-day horizon, identifying a direct relationship between road traffic in Italy and incidence of COVID-19. For Portugal, Mourão and Bento [23] and Alves [11] identified a positive relationship of contiguity between territorial units and the progression of pandemic spread, highlighting the importance of intermunicipal and interparish commuting for contagion, in line with the conclusions of Sousa et al. [15], and Casa Nova et al. [24] assessed the dynamic correlations between Google’s community reports and COVID-19 cases.
In this sense, increased mobility is related to a positive variation in incidence and is a good predictor of the number of COVID-19 cases, with several authors developing methodologies to predict the number of cases from population mobility data. Some support their analysis on Google’s “COVID-19 Community Mobility Reports” [7,24,25,26,27], because there is no repository with comparable volume of mobility information accessible as open data. The vast number of published papers that used this data is indicative of the quality of Google’s information, even though the information acquisition has a biased population sample. Other authors use alternative information on public transport use and road traffic [22], from social networks such as Facebook [28] and from cell phone geolocation [29,30]. Another important repository for changes of near real-time mobility data was Apple’s Mobility Trend Reports [31], that categorized mobility according to the mode of travel (walking, driving and transit) and was used to assess similar associations [5,32]. However, this repository has been discontinued and is no longer available online since April 2022. The pandemic process has prompted the discussion about the conditions and determinants that justify spatial inequalities in the dissemination of COVID-19, highlighting the need for relevant information to understand the trends, processes and patterns of spatial diffusion in order to support public health decision making to contain this disease. This article, part of COMPRI_MOv project (FCT-ID:613765655), investigates the association between changes in mobility and the number of COVID-19 cases in Portugal. In addition to investigating the linear correlations between mobility and the number of new cases, it seeks to assess whether it is possible to estimate the number of cases, for different geographical scales, from mobility patterns, laying the foundation for a predictive model. The distinctive aspect of this article lies on the exploration of human mobility and the confirmed cases of COVID-19, through linear multiple regressions using a rolling time window, generating the prediction of the near future number of cases based on open data, allowing a more effective preparation of health services response.
The diffusion of COVID-19 in Portugal reveals heterogeneous spatial-temporal patterns, although with a geography consolidated in the metropolitan areas, along the most urbanized municipalities of the coast and regional district capitals [11,33]. For several periods Portugal recorded a higher incidence rate than the average European context which makes it a relevant case study in order to understand which specific situations and contexts potentiated high transmission in the country. For this reason, it is of paramount importance to assess to what extent mobility patterns had local effects at multiple scales as determinants of COVID-19 spread.
This article is organized in four parts. The first corresponds to this introduction, followed by materials and methods, where study area, data and methodologies are presented. The third represents the results obtained which are discussed in part four, together with the final considerations and conclusions resulting from this research.

2. Materials and Methods
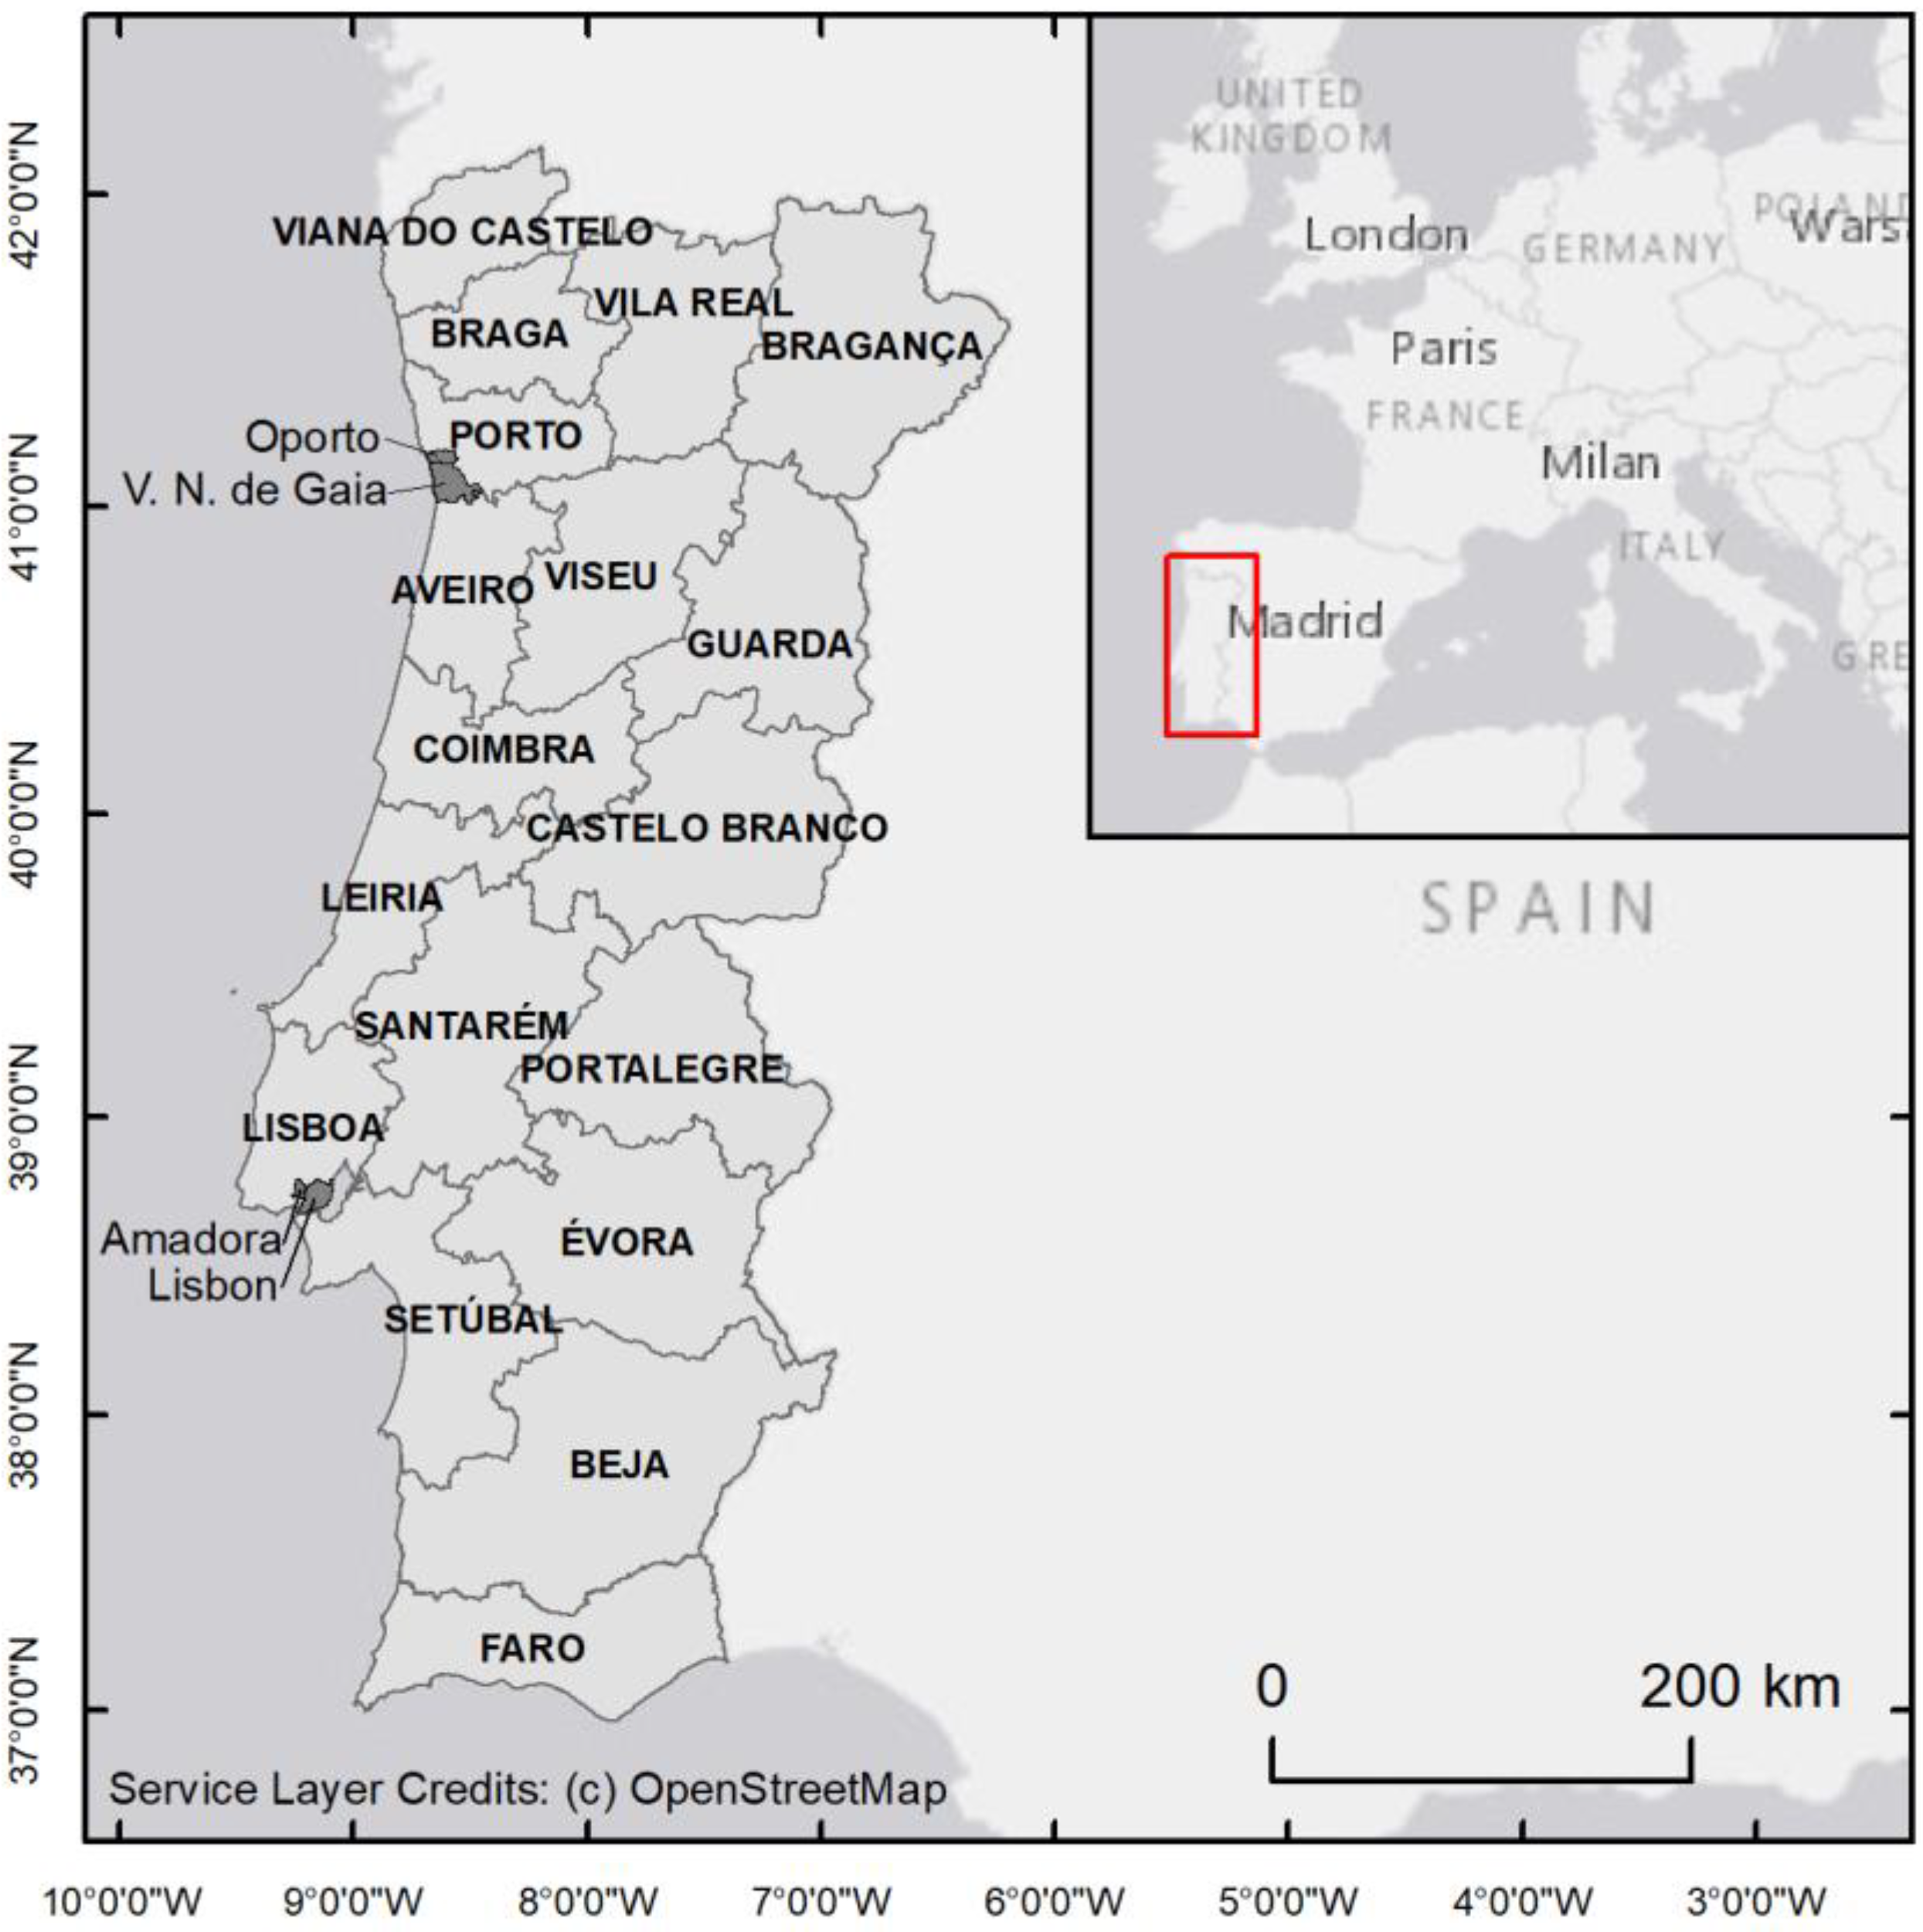
2.1. Study Area

The method proposed in this work was applied to mainland Portugal (Figure 1). The study area is located in the southwest of Europe (between latitudes 33° and 43° N, and longitudes 32° and 6° W), with a total land area of approximately 89,015 km2. With approximately 10.3 million residents in 2021 (the latest census year), Portugal is the 11th most populated country in Europe.
The study used three levels of geographical disaggregation: mainland Portugal, the district regions and 4 municipalities (Lisbon, Oporto, Amadora and Vila Nova de Gaia).

2.2. Estimation Methodology

The methodological approach to estimate the number of COVID-19 cases was based on a multiple linear regression. For this purpose, the epidemiological data and the six mobility variables made available by Google [34] (variation from the reference value in retail and leisure places, grocery stores and pharmacies, parks, public transport stations, workplaces and homes) were considered as follows:
Y i = β 0 + β 1 X i 1   + β 2 X i 2 + + β p X i p + ε i
where Y i represents the estimated number of COVID-19 cases for the date i, β0 is the constant term, X i are Google mobility explanatory variables, β p are the slope coefficients for each variable and ε i is model’s error term.
The time between changes in mobility and the change in the number of new confirmed cases was considered in this work with a lag of 14 days. The time lag must accommodate the incubation and the period needed for official reporting and communication of cases. In similar approaches with daily mobility data, authors have been considering a lag from 7 to 28 days [7,18,20,25] in relation to the date of the cases. This means that, for example, with a 14-day lag the number of infected people on September 1 were related to mobility previously recorded, more precisely on August 18. Different lags were considered, in an exploratory test, but a 14-day lag was the best fit for the Portuguese case. For the choice of the 14-day block in the modeling, blocks of different periods (7 and 21 days) were tested (Table 1).
Considering the high volume of daily data for the different geographic aggregations (country, districts and municipalities), a script (Appendix A) was implemented in Python [35] to reduce data analysis processing time (Figure 2). To fit a linear model with coefficients w = (w1, …, wp) that minimize the residual sum of squares between the observed targets in the dataset, and the targets predicted by the linear approximation, scikit-learn library was used [36].
The regression analysis was performed with two different procedures: one supported in 14-day blocks, advancing at a step of 14 days (p14), and another, from the immediately preceding 14 days, with a window rolling forward at a step of 1 day (p1) (Figure 3).
Using the regression parameters of a 14-day block, it is possible to predict the evolution of the number of infected people in the future at least up to 14 days. The regression parameters used for forecasting are also of two different types, those resulting from the 14-day block, a 14-day step, and those from the 14 days immediately preceding, a 1-day step.
For mainland Portugal, the period analyzed was between March 2020 and March 2021, while for the geographical level of the districts and municipalities the period was between September 2020 and March 2021, due to epidemiological data availability.

2.3. Dependent Variable

The epidemiological information was acquired from Directorate-General of Health (Direção-Geral da Saúde, DGS) reports [37]. The availability of official national epidemiological information from this source is a great limitation to its use because of the need to collect information manually, which is more prone to errors, and requires manual data editing prior to any analysis and modelling process, or good notions of programming languages for developing scripts for automatic acquisition. This is not one of the best examples in data sharing policy compared to other European countries. Example of excellence is the Italian Civil Protection data repository [38] which provides information ready to be processed in CSV/Excel/JSON file formats (https://github.com/pcm-dpc/COVID-19, accessed on 14 March 2022).
In addition, another limitation of DGS data, already explored by Marques da Costa et al. [39], is data inconsistencies, for example, loss of synchronization (the sum of new cases differs from cumulative), incorrect allocation of cases to territorial units, breaks in the periodicity of disclosure, temporally overlapping series or interruption of disclosure of certain indicators. Specifically, information at the municipal scale has experienced several problems with the maintenance of the data series. Initially it was made available as the daily number of cumulative confirmed cases. Later, the periodicity changed to weekly, and in November 2020, this indicator was replaced by the incidence at 14 days per 100 thousand inhabitants. This change required calculations to determine the actual number of new cases, however, as the availability occurs weekly representing a period of 14 days, there is an overlap in the series which introduces uncertainty into the calculated data that cannot be validated in an objective way. Since March 2022 municipal data is no longer available through DGS reports.
Although the information presents quality issues for this study, it is still official information, which is the only that the authors considered.
The cases of COVID-19 as the dependent variable are represented by the number of new cases per day. It refers to the daily variation of newly detected confirmed cases of COVID-19, normally reporting to the previous two to three days, except if testing or reporting took longer.

Number of Cases

During the first year of incidence of COVID-19 in Portugal, there were three waves of differentiated magnitudes (Figure 4), with unequal territorial expressions (Figure 5).
In the following sub-chapters, the evolution will be described in periods.
  • First wave
Similar to in most European countries, the first wave presented low severity because of early general lockdowns based on the uncertainty and lack of knowledge about the disease. It is important to note that testing at this stage was still very limited. Mobility levels reached their minimum at lockdown (Figure 6). Geographically, the diffusion process took place from the metropolitan areas of Lisbon and Porto to the remaining coastal cities and slowly inland without affecting all municipalities of mainland Portugal. Hierarchical diffusion processes stand out as the main responsible in this phase, followed by expansion by contagion.
  • Summer
Between June and August 2020, the country experienced the period after the first lockdown and the number of infections were low and controlled in a national context. In terms of mobility, work from home was still in place and was a period of school holidays. However, the municipalities around Lisbon demonstrated a differentiated behavior with an incidence about two times higher than the rest of the regions combined, although it maintained stricter restrictions compared to the rest of the country. Mobility patterns came close to pre-pandemic levels.
  • Second wave
Started in the north of the country but reached the rest of the territory with special emphasis also on the municipalities of the Lisbon metropolitan area and other major cities. The rise in cases matched with increased mobility associated with returning to school and face-to-face work after the summer holidays. Simultaneously coincides with the reduction of non-pharmaceutical interventions that limited social interaction.
  • Third wave
Has started immediately after the end of the second wave and the number of new cases registered the highest values to date in Portugal. This was the wave of greatest magnitude, during the first year, with record cases in every municipality. In this context the most relevant mobility component in the propagation was possibly associated with Christmas celebrations and New Year’s festivities.

2.4. Independent Variables

Google mobility data [34] from COVID-19 Community Mobility Reports (https://www.google.com/covid19/mobility/, accessed on 11 April 2021) represents the percentage change in mobility, based on the median of the first 5 weeks of 2020 (3 January to 6 February 2020), considered representative of the pre-pandemic mobility patterns. The statistics are created with aggregated and anonymized datasets of users who have enabled the Location History setting on Google technology applications.
The variation is determined based on people’s visits and length of stay in places such as retail and recreation, grocery and pharmacy, parks, transit stations, workplaces, and residential places. Retail and recreation congregates spaces such as restaurants, cafes, shopping centers, theme parks, museums, libraries and movie theatres. Grocery and pharmacy concerns essential goods such as grocery markets, food warehouses, drug stores, pharmacies and similar. Parks data considers national parks, beaches, plazas and public gardens. Transit data comes from public transport hubs. Workplaces represents places of work and residential are residential areas (Figure 6).
Residential-related mobility recorded its maximum differences comparing pre-pandemic levels during the lockdown periods but remained above the reference value throughout most of the data series, with some peaks associated to mobility restrictions. Frequency of workplaces had the opposite evolution, with abrupt negative changes during lockdowns and almost permanent negative variation throughout the period represented. The use of public transport hubs never recovered to the pre-pandemic values but fell to a lesser extent in the period coinciding with the beginning of the second wave, associated with greater mobility with the return to work and school after summer holidays. Parks recorded a frequency well above the reference value, especially in the summer (attention to the different axis) and negative variations coincide with periods of lockdown or very high incidence. Grocery and pharmacy and retail and recreation appear to have a similar evolution, although the first recorded values above the referential during more time in the summer and the latter had a more abrupt negative change during lockdowns.
Comparing mobility behavior with the evolution of the number of cases in mainland Portugal, it is visible that the increase of the number of new cases is related to changes in mobility variables.

3. Results

3.1. Estimation Results

3.1.1. Model Adjustment

Our results confirm that mobility is positively associated with COVID-19 infection. The relationship between mobility variables and the occurrence of new cases was established according to two methods: by 14-day blocks (step 14, p14) and by the sequence of the 14 days immediately preceding (step 1, p1).
The model adjustment was tested with data from new cases from 1 September 2020 and the first mobility data in the corresponding previous 14 days, that is, from 18 August 2020. The results point to a strong relationship between observed and projected data according to the mobility change values of the previous 14 days.
For the national context (Figure 7), there is a strong adjustment of the cumulative curve of estimated cases with the observed cumulative cases of COVID-19, being, as expected, particularly closer when the estimated values result from the p1 model.
The observation of the daily estimated data confirms the best fit of the p1 model when comparing to the real number of new cases (Figure 8).
The data aggregation level and the size of the territorial units are important for the estimation process. The adjustment for Lisbon municipality (Figure 9a–d) is very strong, for both p1 and p14 models.
The observation of the results for the municipalities of Oporto and Vila Nova de Gaia (Figure 10a–d) also shows the robustness of the method when more extreme behaviors occur, such as those that occurred on November 3rd and January 18th in these two municipalities, revealing a good sensibility of the model to abrupt changes in case counting.
The results are significant and follow the evolution trend, except in moments where the incidence reached extreme values. It is more important to predict the trend than the exact number of new cases. The ability to project a given volume of COVID-19 incidence allows a sufficient degree of knowledge about the future evolution of the pandemic, essential for its management in terms of implementation of public health measures. It is also noted that adjustments vary with the spatial scale under analysis (data aggregation).

3.1.2. Linear Correlations

To analyze the correlations between mobility and the number of cases, 3 dates were chosen corresponding to the previous phase, during and after the 3 pandemic waves. In general, it appears that the correlations on all dates are significant (>0.5), with special emphasis on 15 March 2020 and 20 February 2021 (Table 2). The day with the lowest correlation (0.26) corresponds to 11 October 2020, obtained using the p14 model.
In order to verify regional differences in the correlations, the analysis was disaggregated at the district level (Table 3). The first aspect to be highlighted is the absence of mobility data for some municipalities, which made it impossible to analyze all municipalities and as an alternative we considered the 18 Portuguese districts. On all dates the correlations are significant, with emphasis on 25 January 2021, which in both models shows correlations greater than 0.6. In geographic terms, although there is no significant differentiation, it is observed that the districts of Aveiro, Braga, Santarém and Porto have higher average correlations than the other districts. With little significant correlations in all dates, the less populated district of Bragança stands out. The p1 model, as expected, shows mostly higher correlations than the p14 model on four of the six days analyzed.
Correlations appear lower when there were information gaps in the mobility data series at the time of processing. The procedures for completing these gaps may have contributed since the samples are smaller in these regions and therefore may be far from representing the real patterns.
According to Table 3, Braga presents a higher correlation average in the third wave, which is the moment when models performed best in most municipalities with Évora reaching 0.92 of correlation coefficient.
There is an increase in model’s adjustment with the pandemic progression since in the first two waves not all municipalities had yet confirmed cases and the spatial patterns revealed “coastalization” and “bipolarization” [11]. High disparities within districts can be responsible for weak associations in the first moments. The growth of the fit of regression models as the disease spreads over space and time is also evident in Sousa et al. [15] study for mainland Portugal.

3.1.3. Forecast of Values for the following 14 Days

A prediction of the values at 14 days was performed, following the two methods, those of blocks of 14 days and those of 14 days immediately preceding. That is, from the last known regression parameters, mobility values were used, and the values of the following 14 days were forecasted. The adjustment is significant, as can be seen for mainland Portugal and municipalities of Lisbon, Porto and Amadora (Figure 11a–d).
Although the prediction method has some difficulty in adjusting to sudden changes in epidemiological data (number of new cases), the method allows to obtain a significant 14-day forecast with good adjustments to reality.
Negative values have been predicted with step14 that result from the need for the model to adjust after periods of high incidence, considering that there is no daily moving window. The projection of negative values is not necessarily a problem, since this is the way that the model adjusts to peak variations.

3.2. Validation of Models

Figure 12a,b are histograms of the absolute differences between observed and estimated number of cases, calculated for models p1 and p14. The absolute errors for the p1 (Figure 12a) and p14 (Figure 12b) models applied to mainland Portugal, show a higher error interval in the p14 model compared to the p1 model.
In both cases the higher frequency of errors is associated with low error values. Al-though p1 has a higher adjustment, as the correlations show, the absolute error has lower frequency in p14, although in this one the amplitude of errors is higher.
In order to quantitatively evaluate the accuracy of cases estimates, three accuracy measurements, Mean Absolute Error (MAE), Root Mean Square Error (RMSE) and Mean Absolute Percentage Error (MAPE), were calculated (Table 4). The p1 model has lower errors than the p14 model in most districts. However, it is possible to verify in some districts (Bragança, Castelo Branco, Coimbra, Évora, Porto and Santarém) that the results of the p14 model are superior. The districts of Lisbon and Porto stand out for their high absolute error (119 and 116) and the district of Santarém for its high absolute and relative error (622 and 0.795).
The RSME is higher in the districts of Lisbon and Oporto, influenced by major cities of this metropolitan regions, which have socio territorial specificities with dynamism that tends to aggravate the transmission of COVID-19 [11,40,41] and where mobility, despite being relevant, may not be the most relevant determinant.
Santarém district presents, by all metrics, the highest residual values followed by Lisbon and Oporto. While the case of latter two was already explained, the atypical and extreme case of Santarém may be explained by gaps in mobility data. Better results in Castelo Branco, Évora and Bragança, where the number of new cases maintained a stable tendency, never reaching high incidence values.

4. Discussion and Conclusions

This article has explored the effects of mobility (measured by Google) on COVID-19 cases by using daily data across several geographic scales in Portugal, covering the period between March 2020 and March 2021.
Here we have demonstrated, through freely available mobility data and official epidemiological data, that with linear regression models it is possible to obtain estimates of the number of cases. Using two models (p1 and p14), in Python scripts to automate calculations, it was found that it is possible in a simple way to obtain results for extended data ranges and for different levels of geographic aggregation. It is important to mention that procedures performed refer to a situation where vaccination coverage was still low in Portugal.
The results of this work point out to the existence of a proportional relationship between changes in mobility patterns and the propagation of the SARS-CoV-2 virus. This association was established between the number of new cases and changes in mobility volumes with a lag of 14 days. Based on this relationship, the projection of values for the near future, a 14 day horizon, is possible with acceptable margins of accuracy to allow for precautionary decisions of public health nature.
The use of mobility data in relation to the incidence of COVID-19 applied to Portugal demonstrates a strong relationship, suggesting that more mobility is associated with more COVID-19 cases. However, this relationship does not imply that mobility is the only cause of transmission. This is supported by studies that claim that change in mobility patterns in Portugal with the reduction of mobility contributes to the reduction of the disease’s effective reproduction number [5,42] and thus the incidence is reduced in the following weeks [43]. Other factors associated with transmission of the virus such as the use of masks, social distance or vaccination are not part of this model. Although, the advantage of the developed models lies in the ease of implementation and exploitation when compared with more complex epidemiological models, and the possibility of use in contexts with data gaps.
A key insight from our work is a strong capacity to forecast COVID-19 for 14 days ahead, since there was a lack of studies for Portugal that projected the future evolution of COVID-19 cases at multiple scales of analysis with mobility data. The methodology can be used to develop an epidemiologic surveillance system that predicts the evolution of the pandemic using “near real-time” mobility data, supporting decision-making processes related to public health and non-pharmaceutical measures to contain the spread of COVID-19. This approach does not have to be limited to COVID-19 and can be replicated for other infectious diseases, as other studies for influenza [17,18], provided that the optimal lag is effectively determined considering the epidemiological information and the type of mobility data.
The results achieved are in line with similar works. For example, Ilin et al. [28] used statistical models to generate 10-day forecasts of COVID-19 cases supported by Google mobility data, having verified a good adjustment of the models to local data. Kishore et al. [44] explored the use of Google data to assess the role of mobility in spreading COVID-19 infection in India. The authors observed a high correlation coefficient between epidemiological and mobility indicators for the lockdown and unlock phases.
Better epidemiological information, in terms of dissemination format, periodicity and spatial resolution, is necessary so that more detailed results and scientific evidence can be achieved in the study of epidemiological phenomena, today associated with SARS-CoV2, in the future with other infectious diseases that will certainly occur at a more or less distant moment in time.
The work developed depends on the existence of epidemiological and mobility data. Regarding epidemiological data, it is important to mention a critical aspect in the development of models, which is the data quality. As noted by Tamagusko and Ferreira [42], the number of infected individuals confirmed daily may not correspond to the disease’s reality, because the number of confirmed infections depends on the number of tests performed, and the criteria adopted to test the population were not well explained. Number of cases from official sources is highly dependent on the degree of testing performed, often with severe territorial disparities influenced by context factors [45]. Lack of information quality control can be responsible for biases that lead to results being subject to ecological fallacy [46] and modifiable area unit issues are common with epidemiological data [47], especially distribution of COVID-19 cases [48]. This bias does not allow for the identification of cause-effect relationships, however since mobility is a proxy of social interaction, which is the real driver for the spread of contagious diseases, we believe that the correlations identified are a first step for future studies to explore inferring causality. Another aspect refers to the fact that the data are not made available in a format that is easily manipulated (human-readable and machine-readable), that can be submitted to analysis and modelling tasks or integrated in a geographic information system, which is a limitation for fast and accurate data usage [39].
Some delay in Google updating latest data can also constrain obtaining information in time to allow forecasting the future for the generality of the Portuguese territory. One aspect that deserves special attention in works that use this data is the possibility of existing a bias related to the users who generate mobility data not representing the total population, because the sample depends on users of Google services consenting to location sharing. Naturally, this issue is critical in regions where the use of mobile phones is not a common practice. Another possible limitation is the fact that mobility data were used in raw. In contrast with other studies [5] that use techniques to smooth series weekly patterns (influenced by weekends, holidays, etc.), no transformation or standardization was performed, which could change the results.
A last potential limitation is the linear approach, since there are studies that use other type of regressions, such as polynomial [49,50], to predict the trend evolution of new cases.
Having found high correlations between mobility and the number of cases, in future research it will be important to explore the effect of different degrees of vaccination coverage on the evolution of the number of cases as well as additional sources of mobility near real-time data such as mobile phone or car data. Open data was indispensable in this work and the institutions that produce and disseminate them should invest in better data sharing policies.

Author Contributions

Conceptualization, N.M.C.; methodology, N.M.C. and E.M.C.; software, N.M.; formal analysis, N.M.C. and N.M.; investigation, N.M.C., N.M. and A.A.; data curation, A.A.; writing—original draft preparation, N.M. and A.A.; writing—review and editing, N.M.C. and E.M.C.; project administration, N.M.C.; funding acquisition, N.M.C. All authors have read and agreed to the published version of the manuscript.

Funding

This work was supported by national funds from FCT—Foundation for Science and Technology (FCT I.P.: UIDB/00295/2020) and RESEARCH 4 COVID-19: Project COMPRIME (Get to Know More for Intervention)—ID: 596685735 and Project COMPRI_MOv (Get to Know More for Intervention in the context of mobility)—ID: 613765655.

Institutional Review Board Statement

Not applicable.

Informed Consent Statement

Not applicable.

Data Availability Statement

The epidemiological data used in the study is available in the following URL: https://covid19.min-saude.pt/relatorio-de-situacao/ accessed on 28 January 2022. Google mobility data was downloaded from: https://www.google.com/covid19/mobility/ accessed on 11 April 2021.

Conflicts of Interest

The authors declare no conflict of interest.

Appendix A

The code developed in Python and the processed data can be accessed in the repository https://github.com/nmileu/compri_mov accessed on 1 May 2022.

References

  1. Yang, Y.; Peng, F.; Wang, R.; Guan, K.; Jiang, T.; Xu, G.; Sun, J.; Chang, C. The deadly coronaviruses: The 2003 SARS pandemic and the 2020 novel coronavirus epidemic in China. J. Autoimmun. 2020, 109, 102434. [Google Scholar] [CrossRef] [PubMed]
  2. Desvars-Larrive, A.; Dervic, E.; Haug, N.; Niederkrotenthaler, T.; Chen, J.; Di Natale, A.; Lasser, J.; Gliga, D.S.; Roux, A.; Sorger, J.; et al. PA structured open dataset of government interventions in response to COVID-19. Sci. Data 2020, 7, 285. [Google Scholar] [CrossRef] [PubMed]
  3. Gushulak, B.D.; MacPherson, D.W. Population Mobility and Infectious Diseases: The Diminishing Impact of Classical Infectious Diseases and New Approaches for the 21st Century. Clin. Infect. Dis. 2000, 31, 776–780. [Google Scholar] [CrossRef]
  4. Mateus, A.L.P.; Otete, H.E.; Beck, C.R.; Dolan, G.P.; Nguyen-Van-Tam, J.S. Effectiveness of travel restrictions in the rapid containment of human influenza: A systematic review. Bull. World Health Organ. 2014, 92, 868–880D. [Google Scholar] [CrossRef] [PubMed]
  5. Nouvellet, P.; Bhatia, S.; Cori, A.; Ainslie, K.E.C.; Baguelin, M.; Bhatt, S.; Boonyasiri, A.; Brazeau, N.F.; Cattarino, L.; Cooper, L.V.; et al. Reduction in mobility and COVID-19 transmission. Nat. Commun. 2021, 12, 1090. [Google Scholar] [CrossRef] [PubMed]
  6. Kraemer, M.U.G.; Yang, C.-H.; Gutierrez, B.; Wu, C.-H.; Klein, B.; Pigott, D.M.; Open COVID-19 Data Working Group; Du Plessis, L.; Faria, N.R.; Li, R.; et al. The effect of human mobility and control measures on the COVID-19 epidemic in China. Science 2020, 368, 493–497. [Google Scholar] [CrossRef] [PubMed] [Green Version]
  7. Barboza, L.A.; Vásquez, P.; Mery, G.; Sanchez, F.; García, Y.E.; Calvo, J.G.; Rivas, T.; Pérez, M.D.; Salas, D. The Role of Mobility and Sanitary Measures on the Delay of Community Transmission of COVID-19 in Costa Rica. Epidemiologia 2021, 2, 294–304. [Google Scholar] [CrossRef]
  8. Tomori, D.V.; Rübsamen, N.; Berger, T.; Scholz, S.; Walde, J.; Wittenberg, I.; Lange, B.; Kuhlmann, A.; Horn, J.; Mikolajczyk, R.; et al. Individual social contact data and population mobility data as early markers of SARS-CoV-2 transmission dynamics during the first wave in Germany—an analysis based on the COVIMOD study. BMC Med. 2021, 19, 271. [Google Scholar] [CrossRef]
  9. Lai, S.; Ruktanonchai, N.W.; Zhou, L.; Prosper, O.; Luo, W.; Floyd, J.R.; Wesolowski, A.; Santillana, M.; Zhang, C.; Du, X.; et al. Effect of non-pharmaceutical interventions to contain COVID-19 in China. Nature 2020, 585, 410–413. [Google Scholar] [CrossRef]
  10. Hsiang, S.; Allen, D.; Annan-Phan, S.; Bell, K.; Bolliger, I.; Chong, T.; Druckenmiller, H.; Huang, L.Y.; Hultgren, A.; Krasovich, E.; et al. The effect of large-scale anti-contagion policies on the COVID-19 pandemic. Nature 2020, 584, 262–267. [Google Scholar] [CrossRef]
  11. Alves, A. Modelação Espácio-Temporal da Propagação da COVID-19 em Portugal Continental: Evidências da Importância de Fatores Geográficos Spatio-Temporal Modeling of the Spread of COVID-19 in Mainland Portugal: Evidence of the Importance of Geographic Factors. Master’s Thesis, Universidade de Lisboa, Lisboa, Portugal, 2022. [Google Scholar]
  12. Andersen, L.M.; Harden, S.R.; Sugg, M.M.; Runkle, J.D.D.; Lundquist, T.E. Analyzing the spatial determinants of local COVID-19 transmission in the United States. Sci. Total Environ. 2020, 754, 142396. [Google Scholar] [CrossRef] [PubMed]
  13. Murgante, B.; Borruso, G.; Balletto, G.; Castiglia, P.; Dettori, M. Why Italy first? Health, geographical and planning aspects of the COVID-19 outbreak. Sustainability 2020, 12, 5064. [Google Scholar] [CrossRef]
  14. Severo, M.; Ribeiro, A.I.; Lucas, R.; Leão, T.; Barros, H. Urban Rail Transportation and SARS-Cov-2 Infections: An Ecological Study in the Lisbon Metropolitan Area. Front. Public Health 2021, 9, 611565. [Google Scholar] [CrossRef] [PubMed]
  15. Sousa, P.; Marques da Costa, N.; Marques da Costa, E.; Rocha, J.; Peixoto, V.R.; Fernandes, A.C.; Gaspar, R.; Duarte-Ramos, F.; Abrantes, P.; Leite, A. COMPRIME—COnhecer Mais PaRa Intervir MElhor: Preliminary Mapping of Municipal Level Determinants of COVID-19 Transmission in Portugal at Different Moments of the 1st Epidemic Wave. Port. J. Public Health 2021, 38, 18–25. [Google Scholar] [CrossRef]
  16. Tieskens, K.F.; Patil, P.; Levy, J.I.; Brochu, P.; Lane, K.J.; Fabian, M.P.; Carnes, F.; Haley, B.M.; Spangler, K.R.; Leibler, J.H. Time-varying associations between COVID-19 case incidence and community-level sociodemographic, occupational, environmental, and mobility risk factors in Massachusetts. BMC Infect. Dis. 2021, 21, 686. [Google Scholar] [CrossRef] [PubMed]
  17. Barlacchi, G.; Perentis, C.; Mehrotra, A.; Musolesi, M.; Lepri, B. Are you getting sick? Predicting influenza-like symptoms using human mobility behaviors. EPJ Data Sci. 2017, 6, 27. [Google Scholar] [CrossRef] [Green Version]
  18. Engebretsen, S.; Engø-Monsen, K.; Aleem, M.A.; Gurley, E.S.; Frigessi, A.; de Blasio, B.F. Time-aggregated mobile phone mobility data are sufficient for modelling influenza spread: The case of Bangladesh. J. R. Soc. Interface 2020, 17, 20190809. [Google Scholar] [CrossRef] [PubMed]
  19. Jia, J.S.; Lu, X.; Yuan, Y.; Xu, G.; Jia, J.; Christakis, N.A. Population flow drives spatio-temporal distribution of COVID-19 in China. Nature 2020, 582, 389–394. [Google Scholar] [CrossRef]
  20. Badr, H.S.; Du, H.; Marshall, M.; Dong, E.; Squire, M.M.; Gardner, L.M. Association between mobility patterns and COVID-19 transmission in the USA: A mathematical modelling study. Lancet Infect. Dis. 2020, 20, 1247–1254. [Google Scholar] [CrossRef]
  21. Yilmazkuday, H. COVID-19 spread and inter-county travel: Daily evidence from the U.S. Transp. Res. Interdiscip. Perspect. 2020, 8, 100244. [Google Scholar] [CrossRef]
  22. Cartenì, A.; Di Francesco, L.; Martino, M. How mobility habits influenced the spread of the COVID-19 pandemic: Results from the Italian case study. Sci. Total Environ. 2020, 741, 140489. [Google Scholar] [CrossRef] [PubMed]
  23. Mourao, P.; Bento, R. Explaining covid-19 contagion in Portuguese municipalities using spatial autocorrelation models. Rev. Galega Econ. 2021, 30, 1–12. [Google Scholar] [CrossRef]
  24. Casa Nova, A.; Ferreira, P.; Almeida, D.; Dionísio, A.; Quintino, D. Are Mobility and COVID-19 Related? A Dynamic Analysis for Portuguese Districts. Entropy 2021, 23, 786. [Google Scholar] [CrossRef]
  25. Fantazzini, D. Short-term forecasting of the COVID-19 pandemic using Google Trends data: Evidence from 158 countries. Appl. Econom. 2020, 59, 33–54. [Google Scholar] [CrossRef]
  26. Sulyok, M.; Walker, M. Community movement and covid-19: A global study using google’s community mobility reports. Epidemiol. Infect. 2020, 148, e284. [Google Scholar] [CrossRef]
  27. Yilmazkuday, H. Stay-at-home works to fight against COVID-19: International evidence from Google mobility data. J. Hum. Behav. Soc. Environ. 2021, 31, 210–220. [Google Scholar] [CrossRef]
  28. Ilin, C.; Annan-Phan, S.; Tai, X.H.; Mehra, S.; Hsiang, S.; Blumenstock, J.E. Public mobility data enables COVID-19 forecasting and management at local and global scales. Sci. Rep. 2021, 11, 13531. [Google Scholar] [CrossRef] [PubMed]
  29. Grantz, K.H.; Meredith, H.R.; Cummings, D.A.T.; Metcalf, C.J.E.; Grenfell, B.T.; Giles, J.R.; Mehta, S.; Solomon, S.; Labrique, A.; Kishore, N.; et al. The use of mobile phone data to inform analysis of COVID-19 pandemic epidemiology. Nat. Commun. 2020, 11, 4961. [Google Scholar] [CrossRef] [PubMed]
  30. Guan, G.; Dery, Y.; Yechezkel, M.; Ben-Gal, I.; Yamin, D.; Brandeau, M.L. Early detection of COVID-19 outbreaks using human mobility data. PLoS ONE 2021, 16, e0253865. [Google Scholar] [CrossRef] [PubMed]
  31. Mobility Trends Reports. Available online: https://covid19.apple.com/mobility (accessed on 2 February 2022).
  32. Praharaj, S.; King, D.; Pettit, C.; Wentz, E. Using Aggregated Mobility Data to Measure the Effect of COVID-19 Policies on Mobility Changes in Sydney, London, Phoenix, and Pune. Transp. Find. 2020. [Google Scholar] [CrossRef]
  33. Marques da Costa, E.; Marques da Costa, N. O processo pandémico da COVID-19 em Portugal Continental: Análise geográfica dos primeiros 100 dias [The COVID-19 pandemic process in Mainland Portugal. A geographical analysis of the first 100 days]. Finisterra 2020, 55, 11–18. [Google Scholar] [CrossRef]
  34. COVID-19 Community Mobility Reports. Available online: https://www.google.com/covid19/mobility/ (accessed on 30 January 2022).
  35. Van Rossum, G. Python Reference Manual; Department of Computer Science, CWI: Amsterdam, The Netherlands, 1995. [Google Scholar]
  36. Pedregosa, F.; Varoquaux, G.; Gramfort, A.; Michel, V.; Thirion, B.; Grisel, O.; Blondel, M.; Prettenhofer, P.; Weiss, R.; Dubourg, V.; et al. Scikit-Learn: Machine Learning in Python. J. Mach. Learn. Res. 2011, 12, 2825–2830. [Google Scholar]
  37. Direção-Geral da Saúde. (DGS). Relatório de Situação—COVID-19. Available online: https://covid19.min-saude.pt/relatorio-de-situacao/ (accessed on 28 January 2022).
  38. Italian Civil Protection Department; Morettini, M.; Sbrollini, A.; Marcantoni, I.; Burattini, L. COVID-19 in Italy: Dataset of the Italian Civil Protection Department. Data Brief 2020, 30, 105526. [Google Scholar] [CrossRef]
  39. Marques da Costa, N.; Mileu, N.; Alves, A. Dashboard comprime_compri_mov: Multiscalar spatio-temporal monitoring of the covid-19 pandemic in Portugal. Future Internet 2021, 13, 45. [Google Scholar] [CrossRef]
  40. Kang, D.; Choi, H.; Kim, J.H.; Choi, J. Spatial epidemic dynamics of the COVID-19 outbreak in China. Int. J. Infect. Dis. 2020, 94, 96–102. [Google Scholar] [CrossRef] [PubMed]
  41. Nathan, M. The city and the virus. Urban Stud. 2021, 17, 00420980211058383. [Google Scholar] [CrossRef]
  42. Tamagusko, T.; Ferreira, A. Data-Driven Approach to Understand the Mobility Patterns of the Portuguese Population during the COVID-19 Pandemic. Sustainability 2020, 12, 9775. [Google Scholar] [CrossRef]
  43. Oh, J.; Lee, H.Y.; Khuong, Q.L.; Markuns, J.F.; Bullen, C.; Barrios, O.E.A.; Hwang, S.-S.; Suh, Y.S.; McCool, J.; Kachur, S.P.; et al. Mobility restrictions were associated with reductions in COVID-19 incidence early in the pandemic: Evidence from a real-time evaluation in 34 countries. Sci. Rep. 2021, 11, 13717. [Google Scholar] [CrossRef] [PubMed]
  44. Kishore, K.; Jaswal, V.; Verma, M.; Koushal, V. Exploring the Utility of Google Mobility Data During the COVID-19 Pandemic in India: Digital Epidemiological Analysis. JMIR Public Health Surveill 2021, 7, e29957. [Google Scholar] [CrossRef]
  45. Cordes, J.; Castro, M.C. Spatial analysis of COVID-19 clusters and contextual factors in New York City. Spat. Spatio-Temporal. Epidemiol. 2020, 34, 100355. [Google Scholar] [CrossRef]
  46. Fatima, M.; O’keefe, K.J.; Wei, W.; Arshad, S.; Gruebner, O. Geospatial analysis of covid-19: A scoping review. Int. J. Environ. Res. Public Health 2021, 18, 2336. [Google Scholar] [CrossRef] [PubMed]
  47. Roquette, R.; Nunes, B.; Painho, M. The relevance of spatial aggregation level and of applied methods in the analysis of geographical distribution of cancer mortality in mainland Portugal (2009–2013). Popul. Health Metr. 2018, 16, 6. [Google Scholar] [CrossRef] [PubMed]
  48. Wang, Y.; Di, Q. Modifiable areal unit problem and environmental factors of COVID-19 outbreak. Sci. Total Environ. 2020, 740, 139984. [Google Scholar] [CrossRef] [PubMed]
  49. Florez, H.; Singh, S. Online dashboard and data analysis approach for assessing COVID-19 case and death data. F1000Research 2020, 9, 570. [Google Scholar] [CrossRef]
  50. Paez, A. Using Google Community Mobility Reports to investigate the incidence of COVID-19 in the United States. Findings 2020. [Google Scholar] [CrossRef]
Figure 1. Study area at district regions level (Portugal mainland).
Data 07 00107 g001
Figure 2. COVID-19 cases estimation flowchart.
Data 07 00107 g002
Figure 3. Regression analysis procedures p1 and p14.
Data 07 00107 g003
Figure 4. Evolution of the number of new cases and 14-day average.
Data 07 00107 g004
Figure 5. Monthly distribution of new cases per municipality in mainland Portugal.
Data 07 00107 g005
Figure 6. Variation of mobility in Portugal (red boxes indicate lockdown periods).
Data 07 00107 g006
Figure 7. Observed and estimated values according to the two methods of new cases accumulated since 1 September, Portugal. Source: Prepared from DGS, 2020; Google, 2020.
Data 07 00107 g007
Figure 8. Daily values of real new cases and estimated according to the two methods, since 1 September, Portugal. Source: Prepared from DGS, 2020; Google, 2020.
Data 07 00107 g008
Figure 9. Observed and estimated values according to the two methods of new cases accumulated since 1 September, municipality of: (a) Lisbon; (b) Oporto; (c) Vila Nova de Gaia; (d) Amadora. Source: Prepared from DGS, 2020; Google, 2020.
Data 07 00107 g009
Figure 10. Observed and estimated new daily values according to the two methods, since 1 September, municipality of: (a) Lisbon; (b) Oporto; (c) Vila Nova de Gaia; (d) Amadora. Source: Prepared from DGS, 2020; Google, 2020.
Data 07 00107 g010
Figure 11. Observed and predicted cumulative cases according to the two methods: (a) Portugal; (b) Lisbon; (c) Porto; (d) Amadora. Source: Prepared from DGS, 2020; Google, 2020.
Data 07 00107 g011
Figure 12. Absolute error distribution: (a) for p1 model; (b) for p14 model.
Data 07 00107 g012
Table 1. Linear regression lag tests for mainland Portugal for the period under analysis.
Fit Measure7-Day Lag14-Day Lag21-Day Lag
R0.5800.6570.635
R20.3360.4310.403
AIC425342204230
Table 2. Correlation between the mobility and epidemiological indicators during the COVID-19 pandemic waves in Portugal mainland.
PreviousDuringAfter
Model15 March 202025 September 202010 January 202115 April 202010 November 202025 January 202115 May 20205 December 202020 February 2021
p10.980.790.750.570.420.800.600.650.90
p140.410.860.630.730.260.920.760.640.70
Table 3. Correlation between the mobility and epidemiological indicators during the COVID-19 pandemic waves in Portugal districts.
25 September 202010 January 202110 November 202025 January 20215 December 202020 February 2021
Districtp1p14p1p14p1p14p1p14p1p14p1p14
Aveiro0.4460.5150.7700.6930.6610.6610.7270.8240.7760.3400.4080.611
Braga0.8320.7300.7610.7510.7050.7050.7300.8250.5590.3800.5970.535
Bragança0.3960.2480.5930.6300.4270.3090.8850.7020.6820.3980.4930.255
Castelo Branco0.5440.1100.4650.5800.5720.5720.6480.7140.5670.4990.8990.410
Coimbra0.6940.6090.5050.4210.3740.3740.6620.9030.5140.6320.7450.498
Évora0.3180.5850.6020.5530.2830.2830.7600.9150.4830.8830.6190.429
Faro0.2420.3870.4250.6200.6000.6000.8170.7570.4970.6130.8440.447
Leiria0.6420.2980.7640.5420.3560.3560.7340.8130.4610.6630.7640.508
Lisboa0.4980.4860.8380.6020.3200.3200.7940.7920.3210.6590.6940.775
Porto0.4720.6500.7930.6940.6970.6970.7070.7790.4040.5060.5440.568
Santarém0.4720.6500.7930.6940.6970.6970.7070.7790.4040.5060.5440.568
Setúbal0.4900.4580.8970.4430.3540.3540.8430.8460.3140.6320.6770.313
Vila Real0.5780.3360.6980.6270.4960.4960.7290.8090.3030.8340.4770.434
Viseu0.2800.4930.3390.4260.3770.3770.8060.9320.3720.6680.6780.868
Table 4. Error measurements.
MAERMSEMAPE
Districtp1p14p1p14p1p14
Aveiro36.13737.40255.10459.3080.1790.176
Braga63.28458.088103.66298.7980.0240.006
Bragança12.09530.76018.04142.9820.0340.650
Castelo Branco11.23510.23017.47216.8240.0130.075
Coimbra21.32417.90734.50131.4020.0160.026
Évora11.09311.77019.88821.0490.1060.474
Faro14.05412.19623.90121.6830.2350.160
Leiria21.53920.06436.61134.3470.2430.218
Lisboa119.069108.299181.409179.1730.1830.139
Porto116.980104.314212.290220.9730.1680.250
Santarém622.338617.632828.573820.2280.7930.795
Setúbal22.02747.17269.09677.5710.1900.184
Vila Real12.73511.51020.97120.6920.3020.255
Viseu24.34321.49042.76238.6500.2620.212
Publisher’s Note: MDPI stays neutral with regard to jurisdictional claims in published maps and institutional affiliations.

