Abstract
In the era of big data and artificial intelligence, public datasets are becoming increasingly important for researchers to build and evaluate their models. This paper presents the FIKWaste dataset, which contains time series data for the volume of waste produced in three restaurant kitchens in Portugal. Organic (undifferentiated) and inorganic (glass, paper, and plastic) waste bins were monitored for a consecutive period of four weeks. In addition to the time series measurements, the FIKWaste dataset contains labels for waste disposal events, i.e., when the waste bins are emptied, and technical and non-technical details of the monitored kitchens.
Data Set License: CC-BY-4.0
Keywords:
dataset; industrial kitchen; waste bin; glass; paper; plastic; undifferentiated; ultrasonic 1. Summary
IK produce considerable amounts of waste. Yet, in contrast to other smart city application domains that have seen considerable research in waste management (e.g., [1,2,3,4,5,6,7,8,9]), very little attention has been devoted to the operation of IK (e.g., [10,11]).
The FIK project (see https://futurekitchen.m-iti.org/—accessed on 25 February 2021) was performed in Portuguese luxury hotels and the food preparation sector with the strategic aim to develop a next-generation IK concept utilizing IoT enabled interactive technologies, optimized appliance arrangements, and re-imagined spatial, lighting, and equipment layouts to maximize the workflow efficiency and pleasure of the operating staff. One of the main goals of the FIK project was to understand the interactions between the consumption of electricity and water and the generation of waste in such spaces. To this end, electricity, water, and waste monitoring technology were deployed in three restaurants for a consecutive period of four weeks [12].
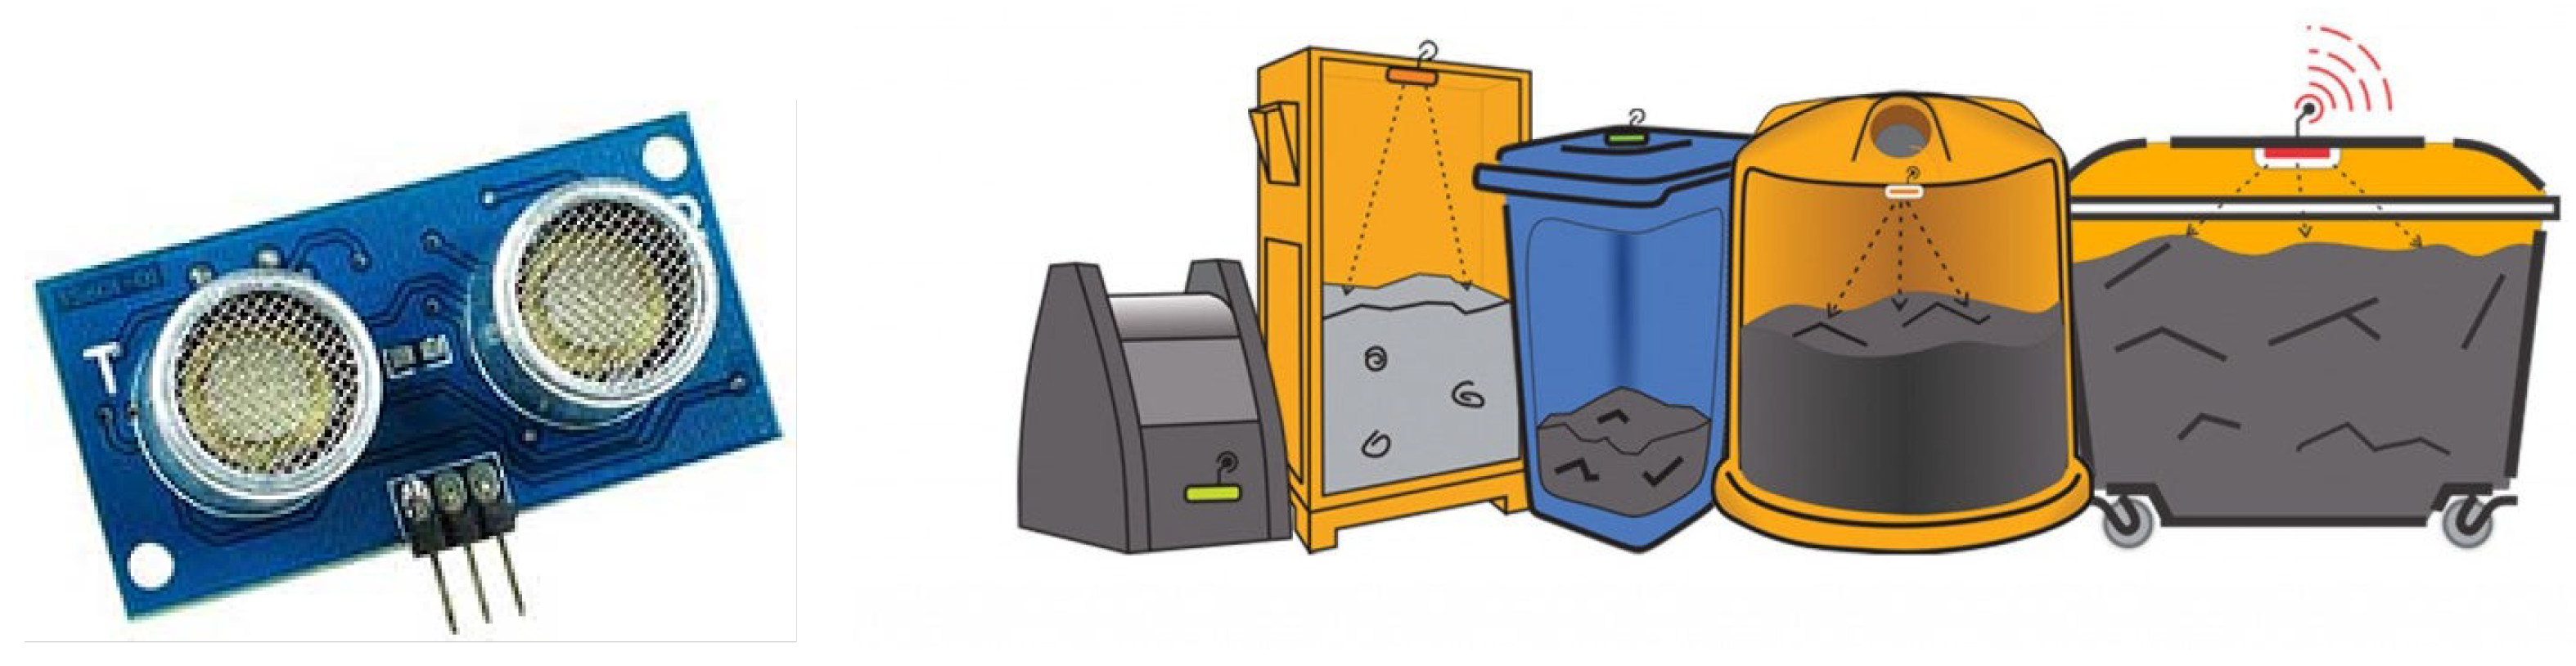
This data descriptor presents the data collected through the real-time monitoring of waste generation and waste bin disposal in the scope of this project. More precisely, organic (undifferentiated) and inorganic (glass, paper, and plastic) waste bins were monitored in three IK for a consecutive period of four weeks.
1.1. Relation to Prior Research
One of the most studied waste management research topics is the ability to automatically detect the fill level of waste bins, as this provides valuable inputs to various stakeholders (e.g., waste collection services, building managers, and even policymakers). Broadly speaking, the vast majority of the works on waste bin level detection can be divided into one of two categories: (1) image based (e.g., [1,2,3]) and (2) distance based (e.g., [4,5,7,8]).
Image based approaches rely on sequences of overhead images of the waste bins and image processing algorithms. The most common algorithms are waste bin detection and waste bin level classification. The former aims at finding waste bins in new images, whereas the latter attempts to classify the waste level in the identified waste bins. Image based solutions provide very good performance, e.g., in [2], the authors reported an average bin detection rate of 97.5% and a waste level classification rate of 99.4%. Nevertheless, such solutions are considerably expensive as they require capturing overhead images and heavy processing algorithms that generally need to run on the cloud or on the edge [13].
Distance based approaches provide a less expensive solution since they rely mostly on ultrasonic range sensors whose price can be as low and 1 to 40 Euros, depending on the required accuracy. Furthermore, these approaches rely mostly on signal processing algorithms applied to the measured distances’ time series, which can often run on embedded devices. Distance based solutions also provide very good accuracy values concerning distance measurements. For example, Reference [5] reported an average deviation between manual and system readings of less than 1 cm, whereas in [8], the authors reported a 2–3 cm accuracy. However, the main drawback of such solutions is that they rely on batteries to work. Therefore, it is necessary to find the right trade-off between the rate of measurements and the lifetime of the battery. In this regard, in [8], the authors reported that by taking measurements every 15 min, the theoretical lifetime of their sensor node would be up to 500 days.
With respect to IK, the few existing works mainly focus on understanding how to reduce food waste. For example, the work in [10] reported efforts to characterize the waste generated by a restaurant in a touristic area of Central Italy. The obtained results show that food alone (organic waste) is responsible for over 28% of the total waste generation. Another example is the work from Silvennoinen et al. [11], where the authors monitored and studied food waste in 51 Finish food service outlets. According to this research, about 17.5% of the produced food ended up as waste.
Interestingly, while these two works relied heavily on the quantification of waste generation, they did not use any automatic monitoring strategies. Instead, the amounts of generated waste were monitored following manual processes that relied on report cards. For instance, in [11], the participants had to produce daily reports of the amounts of food prepared, kitchen waste, serving waste, customer leftovers, and the number of customers. While none of these works reported the reasons for using manual strategies, this is possibly due to the lack of reliable solutions for that effect. Thus, it is fair to assume that further research in automatic waste monitoring is necessary, particularly in industrial contexts such as IK.
1.2. Relation to Prior Datasets
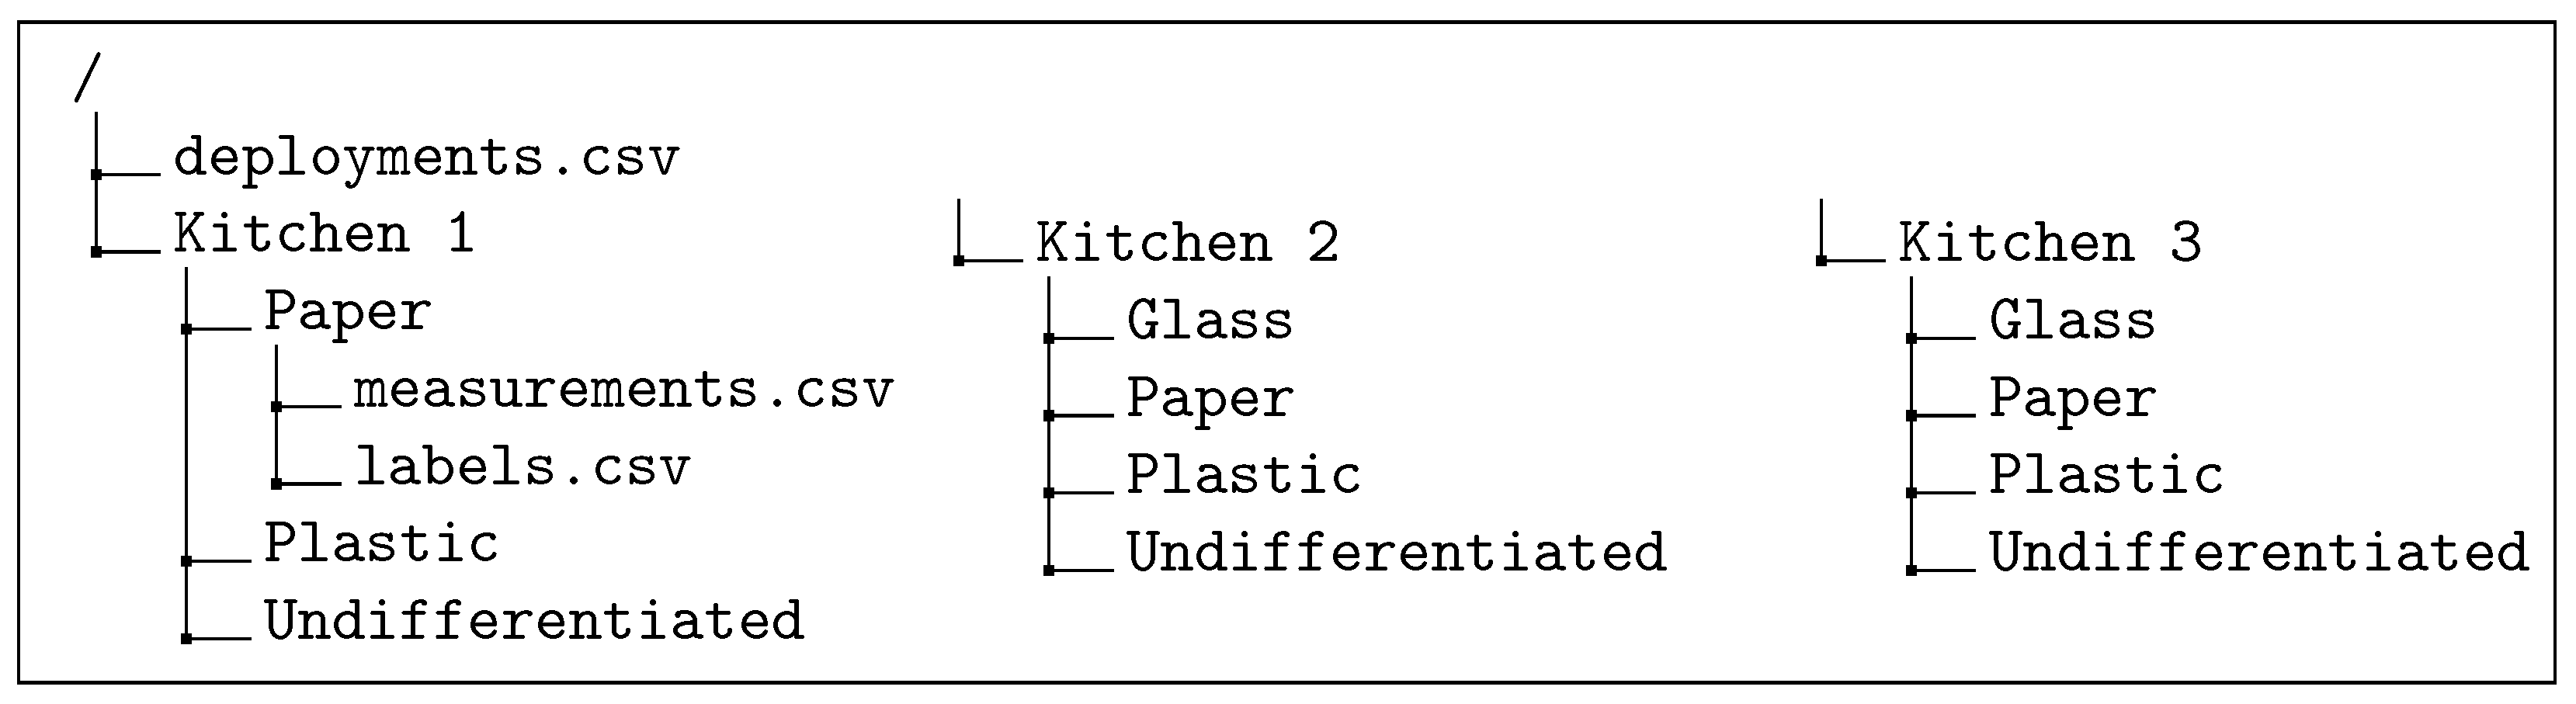
A typical dataset for image based approaches would consist of labeled waste bin images. More precisely, at least two labels would be necessary: (1) the position of the waste bin (for detection algorithms) and (2) the fill level (for waste-level classification). In contrast, a typical dataset for distance based approaches would consist of time series measurements of the distances measured by the sensor and the corresponding volume represented. Since the fill levels are obtained directly from the measurements, it is not mandatory to have labels with the waste levels.
Although several research works exist in the field of waste management, to the best of our knowledge, there are not many publicly available datasets. This situation contrasts other fields that have seen enormous efforts to release public datasets in the previous years, e.g., electricity [14] and water [15].
A search on the data world website (see https://data.world/—accessed on 20 January 2021) for the keywords “waste”, “bin”, and “industrial” returned 95, 3, and 2 results, respectively. From these, none contained the keywords “restaurant” and “kitchen”. In contrast, the keyword “household” was associated with ten datasets. We thus believe that FIKWaste represents a very good and unique contribution to the waste monitoring and management research field as concerns distance based approaches since this was the methodology used in the FIK project.
2. Methods
One of the critical features of waste monitoring and management is keeping track of the waste generation and informing when to clean waste bins. This implies having the ability to track near real-time how much waste is in the containers and detect significant changes in this value (e.g., [16]). This section provides an overview of the data collection process that led to creating the FIKWaste dataset.
2.1. Data Collection Setup
In the FIK project, the waste monitoring was performed using ultra-sonic range finders (see https://www.acmesystems.it/HC-SR04—accessed on 25 February 2021) installed on the lids of the waste bins. This solution is widely used in waste research management (e.g., [4,7]) and keeps track of the volume of waste by measuring the distance between the containers’ lids and their contents. Figure 1 shows the sensor used and an illustration of the working principle.
Figure 1.
Left: HC-SR04 ultrasonic distance sensor. Right: illustration of the application (image from http://tiny.cc/mm98tz—accessed on 25 February 2021).
In order to proceed with the data collection, a bespoke monitoring platform was developed. The main components of the platform are illustrated in Figure 2. From left to right, the sensor nodes scan the waste bins and send the data to a local gateway using the MQTT (see https://mqtt.org/—accessed on 25 February 2021) protocol. The data are stored locally before being uploaded to the Internet using the standard HTTPS protocol.
Figure 2.
Main components of the waste monitoring platform (icons by draw.io and flaticon.com).
Figure 3 shows the block diagram with the different components of the sensor nodes. In high-level terms, the data acquisition algorithm works as follows. The data acquisition software running in the NodeMCU (see https://www.nodemcu.com/index_en.html—accessed on 25 February 2021) takes distance readings from the ultrasonic sensor at a predefined interval of M minutes, during S seconds. The median of the S second readings is then taken and compared to the actual distance between the sensor and the bottom of the waste bin to assess if the lid is open or closed. Median values above this value indicate that the waste bin was open during the measurements and were thus discarded. In this case, new measurements were taken during the next S seconds interval. Otherwise, the valid measurement was sent to the gateway using the MQTT protocol. A RTC was used to keep track of the time in each sensor node. By default, the values for M and S were set to 1 and 5, respectively. Nevertheless, these can be given as inputs to the data acquisition algorithm.
Figure 3.
Block diagram showing the different components of the sensor nodes.
Figure 4 shows the block diagram with the different components of the gateway. The gateway was placed close to the sensor nodes to ensure proper communications using the MQTT protocol. This device is responsible for collecting, storing, and uploading the measurements to locations on the Internet. More precisely, every minute, the most up-to-date measurements were uploaded to an online database server for providing third-party entities with near-real-time access to the data. Moreover, every day at 12:00 AM, a CSV file with the daily readings was uploaded to a shared folder. Upon successful upload, the local database was cleaned to keep its footprint as light as possible at all times.
Figure 4.
Block diagram showing the different components of the gateway.
Since the gateway was connected to the Internet, it was not necessary to install an RTC for clock synchronization. Instead, the NTP was used. Finally, a 3S lithium battery was used to allow deployments in places without a power connection and to avoid data losses in case of a power outage since the sensor nodes did not have storage capabilities.
2.2. Deployments
The monitoring platform was deployed in three restaurant kitchens for up to four weeks in each kitchen. The details of each kitchen are summarized in Table 1.
Table 1.
Details of the three deployments. The columns M and S refer to the sampling intervals of the sensor nodes.
To extend the duration of the battery charge, in the deployments of Kitchens 2 and 3, it was decided to set the value of M to five minutes. Furthermore, the sensor nodes were programmed to only capture data during the kitchens’ working hours. Using this setup, the 1S battery would last four days on average, whereas the setup used in Kitchen 1 lasted only two days on average. Figure 5 shows the hardware prototypes that were deployed and an example of the sensor node installed in one of the waste bins.
Figure 5.
Left: sensor node prototype. Center: gateway prototype. Right: installation example.
2.3. Data Preprocessing
Despite the initial assumption that waste bin disposal events would be represented by volume values very close to zero, when deploying the sensor nodes, it was found that the empty waste bags were not usually totally stretched. As such, a volume of zero was not very common even after a disposal event. Furthermore, it was found that on many occasions, a decrease in the monitored volume did not represent a disposal event, representing, instead, periods when the kitchen staff adjusted the waste bags.
Therefore, in order to collect ground-truth information on the times that the waste bins were emptied, a webcam was placed in the direction of the bins. The videos were then analyzed to label the measurement data with this information. The three authors examined the video and selected the points in time when the waste bins were emptied.
Unfortunately, due to some technical issues, the video recordings were not available all the time. Therefore, part of the labeling was performed manually. To this end, each of the three authors provided the labels to the measurements where no video was available. The labels from the three authors were then compared, and only those selected at least twice were considered. The remaining were discarded.
3. Data Description
The FIKWaste dataset is made available individually for each monitoring kitchen, and all the data files are in CSV format. Figure 6 shows an overview of the underlying organization of the FIKWaste data. The following subsections describe the contents of the different files.
Figure 6.
Underlying folder and file organization of the FIKWaste dataset.
3.1. Measurements Data
The measurement files (measurements.csv) contain the measurements taken from the waste bins. These measurements are provided in raw form, i.e., as they were measured by the sensors. The respective volumes are calculated using Equation (1).
where is the area of the base, is the height of the bin, and is the height measured by the sensor. The underlying fields of the measurements files are described in Table 2.
Table 2.
Column descriptions for the measurements files (measurements.csv).
Table 3 presents a snippet of the raw waste measurements data, in this case for the undifferentiated waste bin from IK 3. Note that that at 16:14:46, the volume of waste was less than in the previous moments, which indicates a potential waste disposal event at 15:50:13.
Table 3.
Snippet of the raw waste measurement data taken from the undifferentiated waste bin in IK 1.
3.2. Labels Data
The label files (labels.csv) identify the periods when the kitchen staff emptied the waste bins. The underlying fields are described in Table 4.
Table 4.
Column descriptions for the label files (labels.csv).
Table 5 presents the first five waste disposal labels for the undifferentiated waste bin from IK 3. As can be observed, the first record indicates a disposal event at 15:50:13.
Table 5.
First five waste disposal events for the undifferentiated waste bin in IK 3.
3.3. Deployments
The deployment file (deployments.csv) contains technical and non-technical details of each deployment. The underlying fields are described in Table 6. Note that the start and end dates refer to the date of the first and last measurements in the waste bins of each kitchen, respectively. These dates do not necessarily correspond to the start and end dates in Table 1 since these correspond to the start and end of the FIK monitoring campaigns.
Table 6.
Column descriptions for the ground truth files (deployments.csv).
4. Data Exploration
The number of measurements for the different waste bins in the monitored kitchens is presented in Table 7. As can be observed, the number of samples was much higher in Kitchen 1 since the data were collected every minute. In contrast, in Kitchens 2 and 3, data were only collected every five minutes.
Table 7.
Total number of records per waste bin in each of the monitored kitchens. The heatmap from blue to read indicates the data availability (dark blue—more data; dark red—less data).
Figure 7 shows the distribution of the waste volume in each of the monitored bins. As can be observed, Kitchen 1 tended to have lower volumes of waste in the bins. It is also interesting to observe that the monitored volumes for paper and plastic in Kitchens 2 and 3 never reached a value close to zero.
Figure 7.
Boxplots illustrating the distribution of the measured waste bin volumes. Left: Kitchen 1. Center: Kitchen 2. Right: Kitchen 3. The circles represent the smallest and highest outliers found in the data.
There are two reasons for this effect: first, when placing the empty bags, it is not common to fully stretch them. As such, despite the bags being empty, the distance measured by the sensor does not correspond to a volume of zero. Second, the weight of the waste items prevents them from going to the bottom of the bin (particularly plastic and paper). A potential solution to mitigate this issue would be to add additional ultrasonic sensors around the lid of the waste bin and compute a more robust distance value by combining the different measurements.
The total number of labels is presented in Table 8. Please note that since only events labeled by at least two of the authors were considered, some waste disposal events are not labeled.
Table 8.
Total number of labeled waste bin disposals in each of the monitored kitchens. The heatmap from blue to read indicates the label availability (dark blue - more labels; dark red - less labels).
Figure 8 illustrates the waste bin volume measurements supplemented with the labeled disposal events. The dotted line indicates periods for which there were no data available. This can happen either because the bin was being emptied (therefore not sending measurements to the gateway), the measurements were discarded due to opening of the lid (as mentioned in Section 2.1), or because the sensor node ran out of battery (the case with the glass and paper between 12 PM of 13 March 13 and the afternoon of 14 March 14.
Figure 8.
Volume measurements supplemented with waste bin events (Kitchen 2, from 12 March 2019 to 14 March 2019).
It can also be observed that the volume measurements for plastic and paper are generally more unstable that for the other materials. In contrast, the measurements for heavier materials like glass and organic waste are much more stable. It is therefore suggested that some sort of filtering is implemented. Figure 9 and Figure 10 illustrate the effect of different window sizes when employing rolling median filtering to the plastic and paper waste bins from Kitchens 1 and 3. In either case, both filters did a very good job of removing the noise and highlighting edges in the signal. However, it is important to remark that for Kitchens 2 and 3, a window of 31 samples would cause significant delays in the signal.
Figure 9.
Example of the rolling median filter with windows of five and 31 samples in the plastic waste bins of Kitchens 1 and 3.
Figure 10.
Example of the rolling median filter with windows of five and 31 samples in the paper waste bins of Kitchens 1 and 3.
Author Contributions
Conceptualization, L.P. and V.A.; methodology, L.P. and V.A.; software, L.P., V.A., and F.V.; validation, L.P., V.A., and F.V.; resources, L.P.; data curation, L.P., V.A., and F.V.; writing—original draft preparation, L.P.; writing—review and editing, L.P. and V.A.; visualization, L.P.; supervision, L.P.; project administration, L.P.; funding acquisition, L.P. All authors read and agreed to the published version of the manuscript.
Funding
This research was funded by project M1420-01-0247-FEDER-000018 (Madeira 14-20). Lucas Pereira received funding from the Portuguese Foundation for Science and Technology (FCT) under Grants CEECIND/01179/2017 and UIDB/50009/2020.
Data Availability Statement
The data presented in this study are openly available in OSF at doi:10.17605/OSF.IO/TYAJ6 (accesed on 25 February 2021), reference number tyaj6.
Acknowledgments
We would like to acknowledge all the staff in the monitored kitchens and the technicians that assisted in planning and performing the three deployments of the monitoring platform.
Conflicts of Interest
The authors declare no conflict of interest.
Abbreviations
The following abbreviations are used in this manuscript:
| CSV | Comma Separated Values |
| FIK | Future Industrial Kitchen |
| HTTPS | Hypertext Transfer Protocol Secure |
| IK | Industrial Kitchen |
| IoT | Internet of Things |
| MQTT | MQ Telemetry Transport |
| NTP | Network Time Protocol |
| OSF | Open Science Framework |
| RTC | Real Time Clock |
References
- Islam, M.S.; Hannan, M.A.; Basri, H.; Hussain, A.; Arebey, M. Solid waste bin detection and classification using Dynamic Time Warping and MLP classifier. Waste Manag. 2014, 34, 281–290. [Google Scholar] [CrossRef] [PubMed]
- Aziz, F.; Arof, H.; Mokhtar, N.; Mubin, M.; Abu Talip, M.S. Rotation invariant bin detection and solid waste level classification. Measurement 2015, 65, 19–28. [Google Scholar] [CrossRef]
- Hannan, M.A.; Arebey, M.; Begum, R.A.; Basri, H.; Al Mamun, M.A. Content-based image retrieval system for solid waste bin level detection and performance evaluation. Waste Manag. 2016, 50, 10–19. [Google Scholar] [CrossRef] [PubMed]
- Lundin, A.C.; Ozkil, A.G.; Schuldt-Jensen, J. Smart cities: A case study in waste monitoring and management. In Proceedings of the 50th Hawaii International Conference on System Sciences, Waikoloa Village, HI, USA, 4–7 January 2017; p. 10. [Google Scholar]
- Ramson, S.R.J.; Moni, D.J. Wireless sensor networks based smart bin. Comput. Electr. Eng. 2017, 64, 337–353. [Google Scholar] [CrossRef]
- Mikami, K.; Chen, Y.; Nakazawa, J. Using Deep Learning to Count Garbage Bags. In Proceedings of the 16th ACM Conference on Embedded Networked Sensor Systems, Shenzhen, China, 4–7 November 2018; pp. 329–330. [Google Scholar]
- Hassan, H.; Saad, F.; Fazlin, N.; Aziz, A. Waste Monitoring System based on Internet-of-Thing (IoT). In Proceedings of the 2018 IEEE Conference on Systems, Process and Control (ICSPC), Melaka, Malaysia, 14–15 December 2018; pp. 187–192. [Google Scholar]
- Addabbo, T.; Fort, A.; Mecocci, A.; Mugnaini, M.; Parrino, S.; Pozzebon, A.; Vignoli, V. A LoRa-based IoT Sensor Node for Waste Management Based on a Customized Ultrasonic Transceiver. In Proceedings of the 2019 IEEE Sensors Applications Symposium (SAS), Sophia Antipolis, France, 11–13 March 2019; pp. 1–6. [Google Scholar]
- Marques, P.; Manfroi, D.; Deitos, E.; Cegoni, J.; Castilhos, R.; Rochol, J.; Pignaton, E.; Kunst, R. An IoT-based smart cities infrastructure architecture applied to a waste management scenario. Ad Hoc Netw. 2019, 87, 200–208. [Google Scholar] [CrossRef]
- Tatàno, F.; Caramiello, C.; Paolini, T.; Tripolone, L. Generation and collection of restaurant waste: Characterization and evaluation at a case study in Italy. Waste Manag. 2017, 61, 423–442. [Google Scholar] [CrossRef] [PubMed]
- Silvennoinen, K.; Nisonen, S.; Pietiläinen, O. Food waste case study and monitoring developing in Finnish food services. Waste Manag. 2019, 97, 97–104. [Google Scholar] [CrossRef] [PubMed]
- Pereira, L.; Aguiar, V.; Vasconcelos, F. Future Industrial Kitchen: Challenges and Opportunities. In Proceedings of the 6th ACM International Conference on Systems for Energy-Efficient Buildings, Cities, and Transportation, New York, NY, USA, 13–14 November 2019; pp. 163–164. [Google Scholar]
- Roh, L. Council Post: Cloud Computing Vs. Edge Computing: Friends Or Foes? March 2020. Forbes—Online. Available online: https://www.forbes.com/sites/forbestechcouncil/2020/03/05/cloud-computing-vs-edge-computing-friends-or-foes/ (accessed on 26 February 2021).
- Pereira, L.; Nunes, N. Performance evaluation in non-intrusive load monitoring: Datasets, metrics, and tools—A review. Wiley Interdiscip. Rev. Data Min. Knowl. Discov. 2018, 8, e1265. [Google Scholar] [CrossRef]
- Di Mauro, A.; Cominola, A.; Castelletti, A.; Di Nardo, A. Urban Water Consumption at Multiple Spatial and Temporal Scales. A Review of Existing Datasets. Water 2021, 13, 36. [Google Scholar] [CrossRef]
- Vasconcelos, F.; Aguiar, V.; Pereira, L. Ultrasonic waste monitoring in the future industrial kitchen: Poster abstract. In Proceedings of the 17th Conference on Embedded Networked Sensor Systems, New York, NY, USA, 10–13 November 2019; pp. 446–447. [Google Scholar]
Publisher’s Note: MDPI stays neutral with regard to jurisdictional claims in published maps and institutional affiliations. |
© 2021 by the authors. Licensee MDPI, Basel, Switzerland. This article is an open access article distributed under the terms and conditions of the Creative Commons Attribution (CC BY) license (http://creativecommons.org/licenses/by/4.0/).