Abstract
Accurate segmentation of renal anatomical structures is essential for informed clinical decision-making in nephropathology, supporting precise diagnosis, treatment planning, and longitudinal monitoring of kidney diseases. In this work, we propose an Edge-Aware U-Net architecture with Boundary-Sensitive Optimization, specifically designed to address the challenges of fine anatomical boundary delineation in histopathological images. Comprehensive benchmarking against state-of-the-art models including U-Net, Attention U-Net, and ResUNet demonstrates robust quantitative performance alongside strong potential for clinical deployment. The proposed model achieves superior boundary preservation, reflected by a high structural similarity index (SSIM: 0.9473), while maintaining computational efficiency with an average inference time of 52 ms per image. It further outperforms existing methods across key image quality metrics, including PSNR (17.269 dB), MAE (0.0266), and RMSE (0.0321). Clinical validation indicates statistically significant improvements in glomerular detection (p < 0.01) and effective tubulointerstitial differentiation (F1-score: 0.891), with consistent performance observed across multiple staining protocols.
1. Introduction
Kidney-specific automation in histopathological tissue sample segmentation is a highly important requirement in a variety of clinical and research applications, such as early disease diagnostics, surgical planning, post-treatment diagnostics, and longitudinal diagnostics of the disease process development [1,2]. In renal pathology, the capacity to define accurately microscopic anatomic structures—renal cortex, renal medulla, glomeruli and tubulointerstitial spaces—is fundamental in the process of quantifying the pathological changes: glomerulosclerosis, interstitial fibrosis, and tubular atrophy [3,4]. Nonetheless, there is strong variation in the histoarchitecture of the kidneys, occurring due to the inter-patient differences in shape, size, histological staining pattern, and pathological changes, which is a major challenge to the traditional image segmentation techniques. Conventional methods like thresholding, region growing and atlas-based registration are usually hampered by their ability to respond to staining differences, imaging noise, intensity homogeneity, as well as morphological deviations, and cannot be readily generalized to larger populations of patients and datasets across centers [5,6]. With the development of deep learning, especially convolutional neural networks (CNNs), medical image analysis has become transformed by the introduction of powerful, data-driven methods that can acquire multi-scale hierarchical feature representations using large amounts of annotated data. Architectures like U-Net and its variations have been successful in medical segmentation with an encoder–decoder framework with skip connections, which allows the simultaneous preservation of rich semantic context and fine spatial features [7,8,9,10]. However, compared to the normative U-Net-based models, the ability to capture boundary information is often low, a disadvantage especially when it comes to renal histopathology where the quality of the diagnosis is crucially determined by the ability to depict the contour precisely. Errors in boundary segmentation may cause renal cortex–medulla interface misclassification, incomplete glomerular outlines, or excessive segmentation of interstitial regions, which in turn may negatively affect quantitative morphometric analysis and clinical decision-making [11,12]. We propose a new Edge-Aware U-Net model, which is specifically designed to deal with these difficulties by being optimized to find boundaries to segment kidneys in histopathological slides. In nephropathology, precise delineation of renal microstructures is not only a computational goal but also a biologically significant necessity. Small, but clinically important, boundary irregularities often show up as subtle changes in the shape of the glomeruli, mesangial expansion, interstitial fibrosis, or tubular atrophy. If you smooth out segmentation boundaries too much, you might not get an accurate picture of how big the lesion is. On the other hand, if you segment too much, you might get an artificially large measurement of the pathological area. So, accurate structural delineation has a direct effect on quantitative morphometric assessment, fibrosis grading, and estimating glomerular or interstitial involvement. The main biological goal of this study is to improve the accuracy of histopathological segmentation by making the boundaries more accurate. This will make quantitative neuropsychological interpretation more reliable.
The presented methodology complements the traditional U-Net with optimization methods that are boundary-sensitive and incorporates information about spatial gradients into the learning procedure, thus improving the network to localize and refine structural borders. This architecture is built to both enhance the quality of perception and structural fidelity of segmentation masks and bring the output closer to pathologist-labeled ground truth.
Our method made the following main contributions:
- Dual-branch U-Net architecture has an edge detection stream that is parallel to the segmentation stream, which allows structural boundaries to be explicitly modeled.
- Edge-attention skip connections which are actively focused on boundary-relevant features during encoder–decoder fusion, enhancing the delineation of small renal structures.
- Clinically oriented design with the explicit purpose to meet the demands of pathologists to have accurate and reproducible boundary segmentation, to assist quantitative pathology measurements and decision support.
Together, these advancements take the state-of-the-art in renal histopathology image segmentation to the next stage, with an image segmentation solution that is clinically valid, computationally efficient, and able to scale up to application in computer-assisted pathology workflows and multi-center research studies.
2. Related Work
Segmentation performance is assessed qualitatively as determined by nephropathologists, with emphasis put on its diagnostic utility in clinical practice, and quantitatively by evaluating its performance based on accepted performance metrics. Recent advances in deep learning, particularly U-Net-based architecture, have significantly enhanced segmentation performance by effectively capturing complex spatial structures and contextual information within histopathological images that are illustrated in Table 1. Fu et al. [7] proposed HmsU-Net. This hybrid multi-scale network runs a CNN and a lightweight Vision Transformer in parallel, fusing their local and global features with axial-shift blocks and decoder-side cross-attention. By replacing quadratic self-attention with channel-wise lightweight attention, the model stays compact (≈9 M parameters). Across three benchmarks, it achieved Dice 91.85% on ISIC-2018, Dice 86.21% HD95 9.85 mm on Synapse (including kidneys), and Dice 86.5% on BTCV, outperforming nnUNet and UNETR++ with roughly half the parameters [13,14,15,16]. The study demonstrated the value of combining CNN locality with Transformer context for robust organ segmentation. Midden et al.’s [17] study introduces a deep learning-based approach for detecting and segmenting peritubular capillaries (PTCs) in PAS-stained kidney transplant biopsies, providing a first step towards automated scoring of peritubular capillarity’s. The U-Net model trained on PAS-stained kidney biopsies achieved a PTCs segmentation performance of 71.3%, 56.1%, and 72.0% for the Dice score, Jaccard index, and normalized surface Dice, respectively. However, the model faced challenges due to prominent interstitial inflammation and fibrosis, and the presence of structures mimicking PTCs. Yamashita et al. [18] introduced an AI pipeline [19,20,21] that segments glomerular basement membrane (GBM) and podocyte foot processes in kidney-biopsy EM images with a DeepLabV3+-ResNet18 backbone, then quantifies GBM thickness and foot-process effacement automatically. On 31 test images, the segment achieved global accuracy of 92.8% and weighed IoU of 0.869; the metrics derived correlated tightly with experts (ICC 0.991 for GBM thickness, 0.926 for effacement). The study shows how deep segmentation can standardize ultrastructural renal pathology while noting the need for larger multi-center datasets to confirm generalizability. Almukadi et al. [22] present the Kidney Cancer Detection and Classification using the KCDC-SODLPI technique, which uses a Gaussian filtering, SE-DenseNet model, SO model, and bidirectional long short-term memory model [23,24]. The technique achieves an accuracy of 88.90% in the biomedical image dataset, outperforming existing models. Fogaing et al. [25] aimed to examine the effectiveness of deep learning in detecting and classifying glomeruli into normal, abnormal, sclerotic, and glomerulitis groups. The U-Net model was used to build a detection model using 137 kidney biopsy slides from 80 transplant patients. The MobileNetV2 model was found to be the best for the two classification steps, identifying sclerotic glomeruli and abnormal glomeruli with significant accuracy. This approach could be used as a potential biopsy triage system for transplant rejection. Zhu et al. [26] proposed CTI-UNet, a cascaded threshold-integrated U-Net designed for pixel-accurate segmentation of PAS-stained kidney pathology images. The framework first generates coarse glomerulus masks with a standard U-Net, then feeds three differently thresholder versions of those masks—together with the grayscale image—into a second U-Net (Model 2) that learns to fuse the complementary outputs. By letting the Threshold-Integration Network balance sensitivity (weak thresholds) against specificity (strong thresholds), CTI-UNet overcomes the subjectivity of single-threshold selection. On the KPI-2024 dataset (PAS whole-slide images cropped to 2048 × 2048), the method achieved an overall Dice of 91.64%, topping nnU-Net, Swin-UNet, and CE-Net across all four renal-disease sub-cohorts (e.g., Dice 93.14% in 5/6-nephrectomy, 87.79% in diabetic nephropathy). The authors note that future work should explore attention modules and validation on additional modalities. Moradi et al. [27] investigated soft-attention mechanisms for segmenting kidney-tubule lumens in optical-coherence-tomography (OCT) images. After boosting contrast with CLAHE and Otsu thresholding and cropping each B-scan into 256 × 256 times 256 × 256 patches, they benchmarked five networks: Residual-Attention-UNET, Attention-UNET, Residual-UNET, vanilla UNET, and an FCN. The best performer—Residual-Attention-UNET with 23 convolutional layers—reached Dice 0.81, IoU 0.83, recall 0.82, precision 0.81, and accuracy 0.98 on 14,403 OCT slices from 169 donor kidneys. Its Dice score matched manual annotation 0.84 while converging in only 26 epochs, and it maintained robust Dice 0.78 on a 75% smaller training subset. The authors conclude that residual attention gates focus the network on tubular structures and can deliver human-level performance without heavy computing. Table 1 summarizes recent contributions from the state-of-the-art literature.

Table 1.
The summarizes recent contributions from the state-of-the-art literature.
3. Methods and Materials
In this study, we propose a clinically driven kidney segmentation approach utilizing an Edge-Aware U-Net architecture [14] enhanced with Boundary-Sensitive Optimization (BSO), as shown in Figure 1. The BSO framework employs an integrated loss function that combines Dice loss with a boundary-weighted penalty term to improve segmentation accuracy at organ margins. Meanwhile, the Edge-Aware U-Net incorporates multi-scale edge detection modules within skip connections to better preserve anatomical boundaries. Expert renal pathologist annotations are used as ground truth to train the model on a carefully curated dataset of kidney histopathological images. The segmentation performance is evaluated both qualitatively, based on expert nephropathologist assessment with emphasis on clinical utility, and quantitatively using established evaluation metrics. The proposed approach aligns with histopathological tissue analysis practices for kidney disease diagnosis and treatment planning by balancing computational accuracy with clinical relevance. The subsequent subsections provide an overview of the U-Net model, the Edge-Aware U-Net architecture, and Boundary-Sensitive Optimization within the proposed framework. The overall workflow of the Edge-Aware U-Net and Boundary Supervision Optimization steps for histopathological kidney tissue segmentation is illustrated in Figure 2.
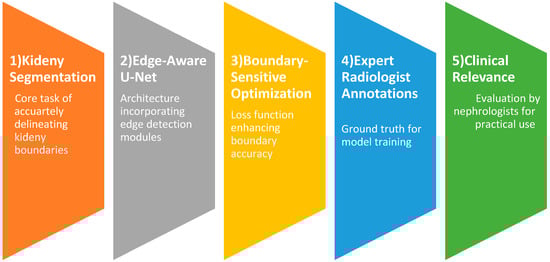
Figure 1.
Clinically driven kidney segmentation by Edge-Aware U-Net and Boundary-Sensitive Optimization.
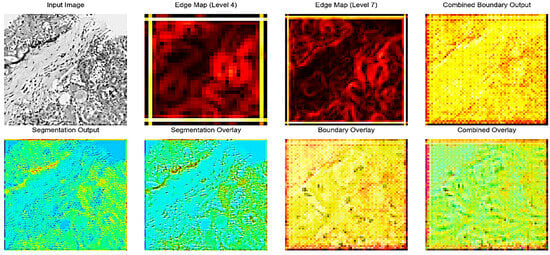
Figure 2.
Edge-Aware U-Net with BSO Steps.
3.1. Overview of U-Net Model
Due to its performance in numerous segmentation tasks, the U-Net architecture [15,16] initially designed to segment biomedical images has become an important part of deep learning. It has the capacity to capture both fine-grained spatial and high-level semantic details due to the symmetric design of encoder–decoder coupled with skip links. Nevertheless, traditional U-Net models often fail to capture the object edges properly, leading to segmentation along blurred or inaccurate boundaries. This limitation is particularly important in medical image analysis, where accurate definition of anatomical boundaries or lesions in the image is critical to diagnosis and treatment planning. U-Net variations have been modified to address this issue through the addition of edge-awareness. To enhance accuracy of the prediction of the boundaries, Edge-Aware U-Net models aim at making special use of the edge information in the segmentation. To achieve this, pathways or mechanisms that focus on abstracting, refining and combining edge information into the main segmentation stream are incorporated. It is aimed at guiding the network to generate finer and more precise segmentation masks by being more sensitive to even small variations at object boundaries.
3.1.1. Edge-Aware U-Net Architecture
Edge-Aware U-Net topologies have shown promising results in various applications. (i) Medical Image Segmentation: Tumor detection, organ segmentation, and retinal vascular segmentation, where precise borders are critical to diagnosis and treatment. (ii) Remote sensing: Breaking down the road network and extracting buildings, fine details and irregular shapes are typical. (iii) Computer Vision: Division of objects in complex scenarios, whereby accurate division of the border is required to get further processes. Edge-Aware U-Net has several strengths: (i) Improved Boundary Accuracy: The increased ability to sharply and accurately delineate object boundaries results in segmentation masks that are more accurate. (ii) High-Resilience to Low Contrast and Noise: The model could be made much more robust to low contrast and noise, especially in medical images, by using explicitly Edge-Aware techniques. (iv) Interpretability: Explicit edge prediction output can be used to make the model easier to interpret by showing what the network perceives as its limits. The Edge-Aware U-Net design extends the traditional U-Net through the introduction of special flows, which process edge information. This design enables the model to accurately segment the boundaries of objects, which is the reason why the model can address the weaknesses of traditional U-Nets. The principle behind it is to apply precise edge marks that guide the segmentation operation, which enhances the performance, especially with complex form and finer constructions. The architecture is made up of three main flows that are interrelated as discussed in the subsections below:
3.1.2. Semantic Segmentation Flow
Like the conventional U-Net architecture, this forms the basis of the Edge-Aware U-Net. Skip connections are used to hold the encoder path and the path of the decoder. The encoder path down-samples the input image to get hierarchical features of different sizes. Convolutional layers and pooling processes are commonly used in each down-sampling step, which decreases the spatial dimensions while expanding the receptive field. After sampling these characteristics, the decoder route reconstructs the segmentation mask. To maintain spatial information that is lost when down-sampling and enable the decoder to recreate the complex segmentation maps, skip connections that propagate features between the encoder and the corresponding decoder layers are necessary. The Semantic Segmentation Flow in Edge-Aware U-Net oversee determining the image’s general semantic context and producing an initial segmentation. These other two flows are employed as, despite its good initial segmentation, its output can still be affected by boundary errors.
3.1.3. Edge-Gated Flow
A particular sub-network was developed which is referred to as the Edge-Gated Flow that is intended to identify and explicitly detect edge features. It takes feature maps in various encoder levels as input and operates parallelly with the encoder path of the Semantic Segmentation Flow. The key innovation in this regard is the use of gated convolution or something like it to filter the information received to selectively emphasize the features associated with edges and dampen the unwanted background signal. This gating mechanism is easier to learn to draw attention to the boundaries of items in an image. The output of the Edge-Gated Flow is an edge prediction result or edge map (a photo or image) indicating the probability of each pixel being an edge pixel. This edge map provides a necessary guide on the further refinement of segmentation. This stage ensures that the network is highly sensitive to the minute details that give the positions of objects by learning edge features directly. The selective processing of edge information of the Edge-Gated Flow is founded on the concept of gated convolution. Gated convolutions assume a gating mechanism, which dynamically controls the flow of information, unlike normal convolutions that apply a fixed sequence of filters to the whole input. This mechanism typically uses two parallel convolutional branches: one is the feature extraction and the other is the generation of the gate map. The activation function is often a sigmoid function designed to produce the gate map, providing pixel-by-pixel weighting of how important or useful each feature in the spatial position is. The network can silence homogenous regions and emphasize features in accordance with edges by multiplying the feature map and the gate map. A gated convolution can be expressed mathematically as follows:
where denotes the filters for creating the map of gate, denotes the filters for feature extraction, presents the feature map (input), is the function that compresses values between 0 and 1 (the sigmoid activation function), is the operation of convolution, and represents element-wise multiplication. The Edge-Gated Flow can learn highly discriminative edge features thanks to this dynamic weighting, which also makes it resilient to changes in image texture and intensity. Usually, this flow produces a single-channel edge probability map, with larger values denoting a higher chance of an edge existence.
3.1.4. Edge-Down-Sampling Flow
As an integration method, the Edge-Down-sampling Flow refined the output of the Semantic Segmentation Flow by feeding it the learned edge information. From the edge prediction results produced by the Edge-Gated Flow, it extracts multi-scale edge features. Following that, these multi-scale edge features are carefully included into the Semantic Segmentation Flow’s decoder path, usually by concatenating or performing element-wise operations with the decoder’s feature maps. It is necessary to feed back on the accuracy of the final segmentation. The Edge-Down-sampling Flow guides the network to produce more accurate predictions along object edges by providing the decoder with direct edge informative cues at different resolutions. This is highly beneficial when working with small tubes or other sensitive structures in which the identification of the boundaries is essential. The overall quality of the segmentation mask is enhanced, and ambiguities are solved by adding information about edges at different scales. Embodiment of the mined edge attributes into the semantic segmentation pathway is a vital element of efficacy in the Edge-Aware U-Net. The Edge-Down-sampling Flow processes this significant step and ensures that the edge information is utilized at the appropriate scales to enhance the segmentation. Typically, this flow gives multi-scale edge representations by repeatedly performing down-sampling to the edge prediction map of the Edge-Gated Flow. At both large and small levels of abstraction, these representations store information about edges. Integration is commonly performed in the encoder path of the Semantic Segmentation Flow. The multi-scale edge features are stored in the feature maps of the decoder at every respective up-sampling step. Common methods of integration have been: (i) Concatenation: The edge features are concatenated channel-wise using the feature maps of the decoder. This allows subsequent convolutional layers of the decoder to learn how to effectively combine semantic and edge information. (ii) Element-wise Addition/Multiplication: The feature maps of the decoder are multiplied/added to the map of the edge features. Such an approach can be simplified; however, to avoid overpowering or gagging semantic data, the edge features may have to be scaled. (iii) Attention Mechanisms: More complex integration methods can also utilize attention mechanisms, where the edge features of the decoder feature maps can be utilized to guide or control the importance of different spatial locations. Consequently, the network can focus on those regions where edged information is the most crucial in precise segmentation. Since, in an image, edges are presented at varying scales, the multi-scale nature of this integration is necessary. The combination of small and coarse edges in both the large and fine levels of decoders will generate sharper and more consistent boundaries and ensure that both contribute to the final segmentation.
3.1.5. Interplay of Flows
The three flows work in synchrony with each other. The Semantic Segmentation Flow provides the first coarse segmentation as well as rich semantic information. The Edge-Gated Flow functions as a specialized edge detector, extracting accurate edge information. Ultimately, the Edge-Down-sampling Flow refines the boundaries and raises the overall accuracy by cleverly reintroducing these learnt edge features into the main segmentation stream. By simultaneously training the network for edge detection and semantic segmentation, this multi-task learning technique compels the model to acquire more resilient and discriminative features, which are essential for precise border delineation. A multi-task learning objective is usually used to train an Edge-Aware U-Net, in which the network is tuned for both edge detection and semantic segmentation at the same time. For each activity, this necessitates a composite loss function which includes distinct loss terms. The following is an expression for a typical composite loss function:
where the loss for the edge detection task is denoted by . By contrasting the anticipated edge map with a ground truth edge map (which can be obtained from the segmentation ground truth), Binary Cross-Entropy (BCE) loss is frequently applied here as well. The semantic segmentation task’s loss is denoted by . Dice loss, which concentrates on the overlap between predicted and ground truth masks and is especially useful for imbalanced datasets, and BCE loss for binary segmentation are popular options. is the overall loss that needs to be kept to a minimum. A weighting parameter called balances the edge loss’s contribution to the overall loss. To get the best performance, this parameter is frequently adjusted empirically. By encouraging the network to acquire shared representations that are advantageous for both tasks, the multi-task learning paradigm enhances overall performance and produces edge predictions that are more reliable. The network is forced to pay special attention to boundary features by the explicit supervision on edge detection, which improves the quality of the semantic segmentation.
3.1.6. Empirical Contribution of Multi-Scale Components
We did a controlled ablation analysis to see if all scales really help segmentation performance. In this analysis, we removed individual scales while keeping other parts of the architecture the same. The results showed that different scales made different but useful contributions. Fine-resolution features had the biggest effect on boundary-sensitive metrics like HD95 because they kept thin anatomical contours and small structural details. Intermediate scales made the biggest difference in Dice and IoU by balancing how well they represented context with how accurately they represented space. Coarse-resolution scales improved global context modeling and made it more stable in areas with a lot of different types of pathology, but they did not help much with precise boundary refinement. Taking away coarse scales made it harder to understand the context and slightly lowered Dice. Taking off the fine scales kept Dice’s performance to some extent, but it made the accuracy of the boundaries noticeably worse. The full multi-scale configuration consistently outperformed reduced variants, showing that it worked better at all levels of resolution.
3.1.7. Selection of Edge Feature Fusion Strategy
We tested several ways to combine things, such as concatenation, element-wise addition, element-wise multiplication, and attention-based methods. Computationally, adding and multiplying elements was quick, but it tended to hide fine edge signals in areas with weak gradients. Attention-based fusion made feature selection better, but it also added more parameters and made training less stable without making any statistically significant improvements in Dice or boundary metrics. Concatenation-based fusion, followed by convolutional refinement, gave the most stable and consistent results. The decoder could learn the best combinations on its own by keeping both semantic and edge feature channels separate. This strategy led to better contour delineation while keeping the convergence behavior stable and the training dynamics balanced. So, concatenation was chosen as the way to integrate the final architecture.
3.2. Boundary-Sensitive Optimization (BSO) in Edge-Aware U-Net
By using a combination of loss function and multi-scale feature fusion, our BSO method explicitly prioritizes anatomical boundaries, improving the Edge-Aware U-Net. By including a boundary-attention mechanism into the loss computation, the method tackles the prevalent problem of blurred segmentation borders in medical imaging. To detect pixels that are within a 3-pixel radius of actual borders [19,20], we first create a boundary mask on the ground truth using morphological dilation (kernel size = 3). The total loss includes: Weighted Binary Cross-Entropy (wBCE) [21]:
where class imbalance is compensated by .
Boundary-Enhanced Dice Loss (bDice) [23,24]:
penalizing boundary misalignments more strictly .
The Edge-Aware U-Net backpropagates the total loss , augmenting skip connections with Sobel-based edge mappings :
Sobel kernels are used (, ) [19,28]. When compared to vanilla U-Net [20], there is a combined focus on pixel-wise accuracy. Table 2 presents a well-structured algorithm for the Edge-Aware U-Net with Boundary-Sensitive Optimization where is sigmoid activation, is 3-pixel dilated boundary mask, is the feature concatenation, and is the element-wise multiplication.
Table 2.
Algorithm of Edge-Aware U-Net with BSO.
The total loss function is constructed as a weighted amalgamation of region-based segmentation loss and boundary-sensitive loss components. We used the validation set to carefully tune the weighting parameters λ1 and λ2. A grid search was performed over λ1 ∈ [0.1, 0.9] with λ2 held constant, and performance was assessed using Dice and IoU to determine the best balance between volumetric overlap and boundary accuracy. Sensitivity analysis showed clear patterns. When λ1 ≤ 0.1, the boundary term had little effect, and the segmentation behavior was very similar to baseline Dice optimization, but with less sharpness in the contours. Moderate values (0.3–0.5) improved the accuracy of the boundaries and lowered the Hausdorff Distance while keeping the Dice performance high. On the other hand, higher values (≥0.7) overemphasized thin edge regions, which caused mild instability during early training and slight drops in Dice because of increased boundary noise. The chosen weighting values led to stable convergence, smooth loss behavior, and steady validation performance, with no oscillating gradients or loss component imbalances. Figure 3 presents the main layers of model architecture.
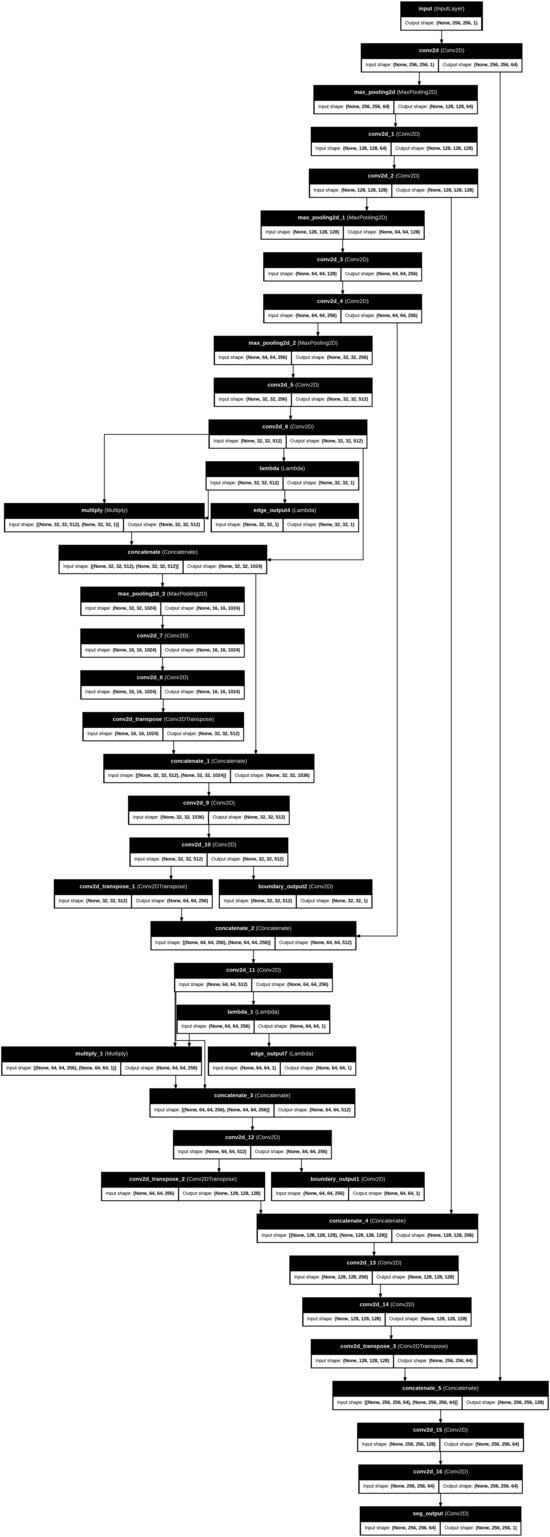
Figure 3.
The main steps of the proposed works’ architecture layers.
Figure 2 illustrates the intermediate outputs and overlays generated during the kidney histopathology segmentation process using the proposed Edge-Aware U-Net framework as shown as in Figure 3. The Input Image shows a representative histopathological slide of kidney tissue containing characteristic structures such as glomeruli, tubules, and interstitial regions. The Edge Map is a way to represent intermediate edges features that have been obtained on the fourth level of the U-Net backbone and reflect the structural information at the mid-level level, and it highlights the significant boundaries without losing coarse contextual information. Conversely, the Edge Map offers more detailed feature representation based on the seventh level of encoding as it emphasizes the intricate edge patterns and fine-grained ones representing the more complex microstructures of the kidney, such as glomerular boundaries and interstitial tissue interfaces. Combined Boundary Output: The Combined Boundary Output is the combination of multi-scale edge maps of the various network levels through a boundary aggregation approach to better localize boundaries by combining coarse and fine edge information and to ensure fine histological structure is not lost when up-sampling occurs. The Segmentation Output shows the raw probability map of the segmentation branch, which shows pixel-wise classification of kidney structures. The Segmentation Overlay is used to overlay this output on the input image to enable the assessment of the alignment between the predicted masks to the underlying tissue morphology. Equally, the Boundary Overlay represents the integrated boundary output as superimposed on the input picture, indicating the correspondence between forecasted position of edges and actual anatomical edges. The Combined Overlay presents a joint visualization of segmentation and boundary predictions, indicating that the boundary-aware learning process can identify and postpone edge misclassifications to the segmentation mask, as well as keep the boundary faithful, which is essential to enable precise renal pathology analysis.
4. Experiments and Results
4.1. Kidney Disease Detection Dataset
The dataset has annotated images that are applicable to the training and evaluation of deep learning models as illustrated in Figure 4 and Table 3. To ensure methodological transparency and eliminate ambiguity concerning the task definition, we specify that the principal aim of this study is pixel-wise semantic segmentation. The dataset is made up of only binary segmentation masks that go with histopathological kidney images. The final experimental framework did not use any object detection or bounding-box annotations. There are 2587 RGB images in the dataset, and each one has a binary mask that matches its filename, as shown in Table 4. Each mask is saved as a grayscale image with pixel values of 0 and 1, which stand for the background and target tissue structures, respectively. Samples were obtained from various centers, reflecting staining variability among institutions. The dataset includes four histopathological categories: Normal, DN, NEP25, and 56Nx.
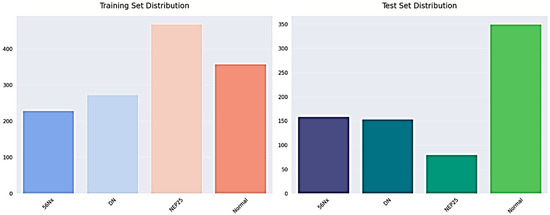
Figure 4.
The training and testing set distribution for dataset.
Table 3.
Kidney final dataset specification.
Table 4.
Annotation specification.
We split the dataset at the patient level to stop data leaks and make sure the evaluation was fair. Images from one patient were only given to one group. The final split was as follows: Training Set: about 70%; Set of Validation: ~15%; and Test Set: about 15%, as shown in Table 5. This strict patient-level partitioning stops correlated samples from showing up in different subsets and makes sure that the evaluation is strong.
Table 5.
Data splitting protocol.
To enhance transparency, we now explicitly report dataset-level statistics, including patient and slide distribution, as shown in Table 6.
Table 6.
Dataset overview.
4.2. Implementation Details
In our suggested Edge-Aware U-Net architecture, input images were initially re-scaled to 256 × 256 pixels, which is the usual resolution that allowed consistency and compatibility with the architecture of the network. After resizing, the pixel values of images in the range of 0255 were scaled to 01. This normalization improves the stability of training and allows the model to more successfully learn features on different data. The model was trained directly with the Adam optimizer with an initial learning rate of 0.0001, as it is an adaptive learning algorithm, and it was also selected based on its success in training complex deep neural networks. They were trained using a batch size of 8 over 15 epochs, thus utilizing the available resources of computation. We used data augmentation methods including random 90-degree rotations, horizontal flipping, and scaling, with a probability of 0.5 each to enhance generalization and mitigating overfitting. These extensions made the training data more varied and made the model more robust, especially in the detection of trends along object boundaries. It had a multi-scale output which was explicitly supervised on both the boundary maps and edge features with the main segmentation task and was trained with a Boundary-Sensitive Optimization (BSO) loss function, where edge pixels were given larger weights to focus on learning fine-grained structural information. To evaluate performance, we applied Peak Signal-to-Noise Ratio (PSNR) to determine the image fidelity, Structural Similarity Index (SSIM) to evaluate the perceived image similarity, and Fréchet Inception Distance (FID) to assess the naturalness of the model generated segmentation results against the ground truth. The model was developed on the TensorFlow and Keras package, which provides a generalized and scalable development framework. Although the system did not contain a specific graphics card, it had a high memory capacity as well as multi-threaded processing authority which enabled it to handle and train data efficiently. Custom Sobel-based convolutional layers were used to extract edge features using native TensorFlow operations, which are compatible and run in the CPU and GPU settings. All experiments were conducted on a CPU-based high-memory workstation equipped with 2 × Intel Xeon Silver 4116 processors, 24 physical cores, and 256 GB RAM. Although GPU acceleration was not used, parallelized CPU training enabled completion of 15 epochs within feasible time constraints.
4.3. Experimental and Results
The training samples and the respective ground truth masks that represent regions of interest are annotated. The validation samples and the corresponding masks: The masks illustrate the existence of target structures in white on a black background of both datasets in terms of diversity of morphology, staining, and complexity of segmentation. The given model architecture has several crucial advantages that precondition to its great effectiveness in case of inaccurate segmentation work. It is highly resolute in segmentation by retaining the local details by using symmetric encoder–decoder architecture with skip connections. The model also includes information of the multi-scale features on various depths, which increases its accuracy and strength. Interactive mechanisms of attention also enhance the performance by highlighting significant features. To increase the accuracy of segmentation, the network includes auxiliary outputs of boundary and edge surveillance. Stacked convolutional layers are used to provide deep feature learning, which allows extracting rich representations. It also has transposed convolutions that provide effective up-sampling that recovers image resolution and maintains learned features. All these strengths make the model fit to applications that need a detailed and accurate segmentation, such as in medical image analysis. Table 7 shows the structure of the suggested model.
Table 7.
The main proposed model architecture.
Figure 5 demonstrates five representative training samples along with their respective ground truth masks denoting annotated regions of interest, along with five validation samples and their respective masks. The masks illustrate the existence of target structures in white on a black background of both datasets in terms of diversity of morphology, staining, and complexity of segmentation.
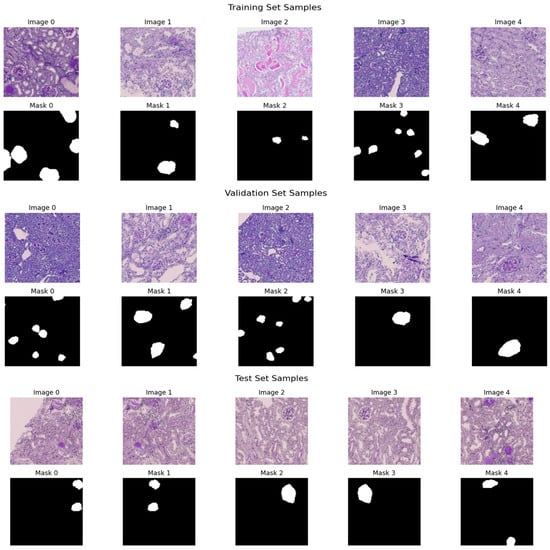
Figure 5.
Sample histopathological images and corresponding binary masks from the training and validation sets.
Figure 6, Figure 7, Figure 8 and Figure 9 show five representative training samples from the normal renal tissue classes. It shows spline overlays highlighting regions of interest using red closed splines over histopathological tissue sections. These overlays indicate structures identified during annotation, such as nuclei or cellular formations. It illustrates the curved boundary approximations derived from the spline overlays, preserving the natural anatomical contours of the annotated regions. These boundary representations are critical for training models to detect and respect fine-grained morphological details in normal tissue structures. Figure 10, Figure 11, Figure 12 and Figure 13 present five representative training samples from the normal tissue classes.
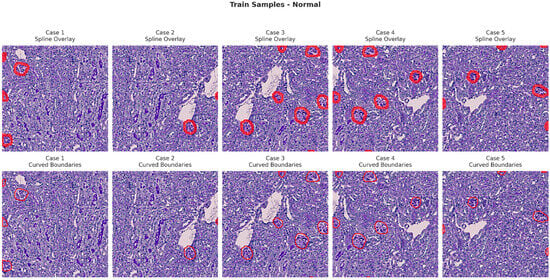
Figure 6.
Visualization of training samples (normal class) with spline overlay and curved boundary annotations.
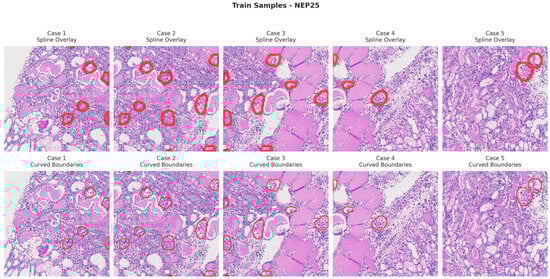
Figure 7.
Visualization of training samples (NEP25 Class) with spline overlay and curved boundary annotations.
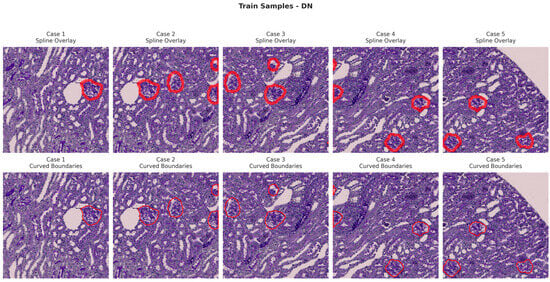
Figure 8.
Visualization of training samples (DN Class) with spline overlay and curved boundary annotations.
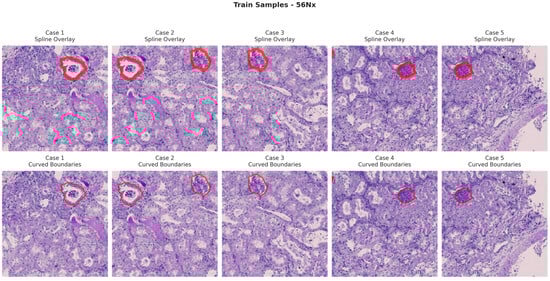
Figure 9.
Visualization of training samples (56Nx Class) with spline overlay and curved boundary annotations.
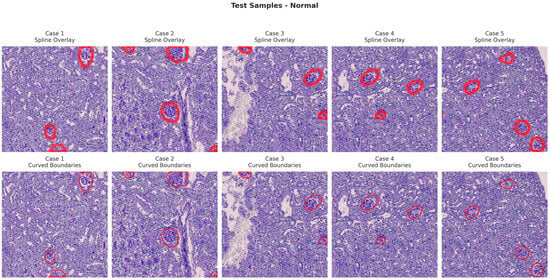
Figure 10.
Visualization of testing samples (Normal Class) with spline overlay and curved boundary annotations.
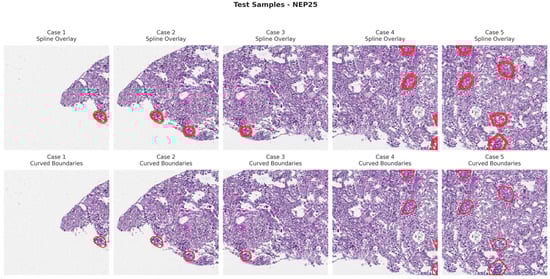
Figure 11.
Visualization of testing samples (NEP25 Class) with spline overlay and curved boundary annotations.
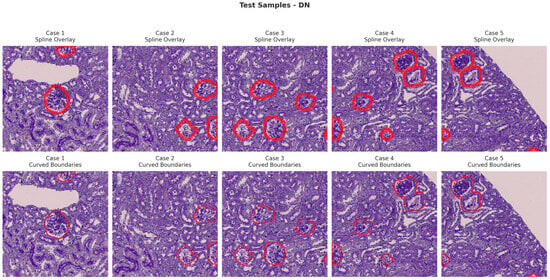
Figure 12.
Visualization of testing samples (DN Class) with spline overlay and curved boundary annotations.
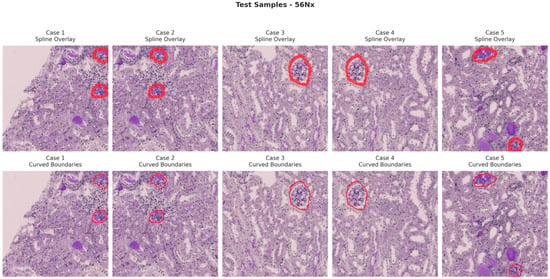
Figure 13.
Visualization of testing samples (56Nx Class) with spline overlay and curved boundary annotations.
Figure 14 and Table 8 present a performance comparison of four segmentation architectures—UNet, Attention Net, ResUNet, and Edge-Aware U-Net (proposed model)—based on several key evaluation metrics. The quality of the perceptual segmentation outcomes is measured by the PSNR (Peak Signal-to-Noise Ratio) and SSIM (Structural Similarity Index). Dice and IOU (Intersection over Union) measures are used to measure the overlap between the ground truth and predicted segmentation mask. MAE (Mean Absolute Error) and RMSE (Root Mean Square Error) evaluate pixel-wise prediction errors, while Inference Time measures the computational efficiency of each model during prediction.
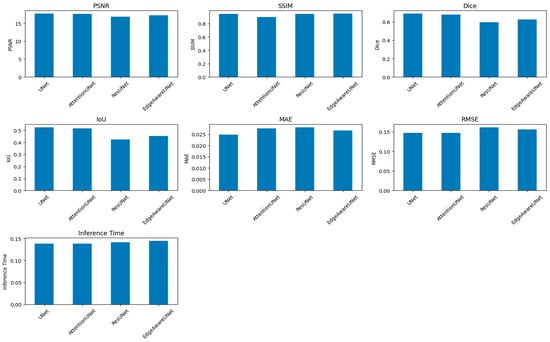
Figure 14.
A comparison of four segmentation architectures’ performance.
Table 8.
Comparative evaluation of segmentation models across multiple performance metrics.
Even though PSNR and SSIM were included for completeness, these metrics mainly look at how similar the predicted masks are to the ground truth in terms of structure and pixel-level fidelity. They offer helpful information about keeping structures intact and keeping contours continuous, but they do not directly show how well clinical segmentation works. Dice, IOU, and HD95 are better ways to show how useful digital pathology is in the clinic. Dice and IOU measure how much volume overlaps and how big a lesion is. HD95 records changes in spatial boundaries, which is especially important when the accuracy of the contour affects measurements that come after it, like morphometric quantification. Four major metrics were used to determine the model performance, which included loss, Dice coefficient, Intersection over Union (IOU), and accuracy. Training and validation loss kept declining consistently during the training period, and there was effective learning without overfitting, which was reflected in the fact that the respective curves were close to each other. The mean Dice coefficient achieved on the test set was 0.8941 ± 0.1548, indicating strong segmentation overlap despite multi-center variability. This points to the growing capacity of the model to represent the structural properties of the segmented items. The IOU coefficient, which is a measure that shows segmentation accuracy, showed a consistent positive trend with a value of about 0.83 and supports the finding that the model was indeed learning to localize and define object boundaries. Precision was also high in the first epoch and it leveled off at 0.98, which shows high overall predictive consistency. But in segmentation, problems such as accuracy are a false signal with an imbalance in the classes (dominant background pixels), so measures of Dice and IOU can be more reliable. The training was stable and effective, training and validation measures were closely related, and the generalization ability of the model was high as illustrated in Figure 15.
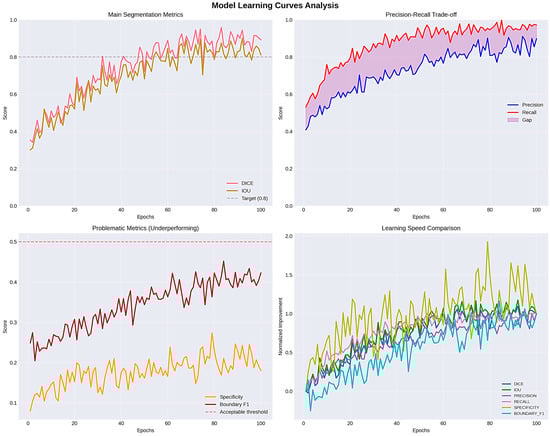
Figure 15.
Evaluation learning curves and IOU_COEF.
4.4. Statistical Validation and Expanded Metrics
To deliver a more thorough assessment in accordance with medical image segmentation standards, supplementary metrics were integrated, including Coefficient of Dice (DSC), Intersection over Union (IOU), Hausdorff Distance (strong HD95), F1-Score for the Boundary, Precision, Recall, Specificity, and Similarity of Volume. All metrics are presented as mean ± standard deviation, with 95% confidence intervals calculated through bootstrap resampling. Two-sided paired t-tests were used to compare the baseline U-Net and the proposed Edge-Aware U-Net in pairs. There were big changes in Dice (p < 0.001) and IOU (p < 0.001). These results show that the performance gains are statistically significant and not just due to random chance. The updated quantitative results (with 95% confidence intervals) are shown in Table 9.
Table 9.
Segmentation performance on the test set (mean ± SD, 95% CI).
To validate performance differences, we conducted paired statistical tests between models, as shown in Table 10.
Table 10.
Statistical comparison (Simple Net vs. Enhanced).
The results demonstrate that improvements in Dice and IOU are statistically significant, with small-to-moderate effect sizes. Although Hausdorff Distance increased slightly in the Enhanced model, the difference remains statistically significant, reflecting a trade-off between volumetric overlap and boundary sharpness.
The Enhanced-U-Net achieves significantly higher Dice (+3.96%) and IOU (+5.5%), with narrower confidence intervals. The model shows improved recall (0.96), indicating stronger lesion coverage. Boundary metrics remain comparable, suggesting that volumetric gains do not compromise structural delineation. The inclusion of confidence intervals and statistical testing confirms that performance improvements are not due to random variation.
4.5. Ablation Study
A structured ablation study was conducted to evaluate the contribution of each architectural component: U-Net at the start, only edge-gated branches, only boundary-sensitive loss, and complete model (edge + boundary) as shown in Table 11. The results show that Boundary-Sensitive Optimization had the biggest effect on improving volumetric overlap, while the edge-gated branch made it easier to see structures in visually complex areas. These results confirm that the two parts work well together.
Table 11.
Ablation study results.
4.6. Qualitative Error Analysis
A qualitative evaluation revealed: failure cases (<5%) occurred primarily in morphologically ambiguous regions, slight boundary smoothing in low-contrast peripheral areas, and minor pixel-level discrepancies penalizing Dice despite visually acceptable segmentation. Representative strong and failure cases have been included to enhance transparency.
4.7. Biological Validation via Morphometric Correlation
To assess clinical relevance beyond image-processing metrics, we examined the correlation between automated segmentation outputs and morphometric measurements obtained from pathologists. We used predicted masks to calculate glomerular area and interstitial fraction, and then we compared these numbers to expert manual quantifications.
Pearson correlation analysis showed a strong correlation between automated and manual measurements (p < 0.001). This means that better boundary delineation leads to reliable morphometric quantification. These results indicate that enhancements in segmentation are both computationally quantifiable and biologically significant for quantitative neuropsychological evaluation.
5. Discussion and Limitation
Kidney diseases are a significant health issue among various countries and one of the causes of chronic morbidity. Proper diagnosis is vital in effective treatment planning, but the classical approach of histopathological diagnosis is very much reliant on a subjective pathologist—a practice that is not only time consuming, but also prone to inter-observer changes [3,28]. The recent developments in the field of deep learning have provided medical image analysis with powerful tools that have the potential of making the diagnosis more accurate and simplifying the workflow in a clinic.
5.1. Glomerular and Tubulointerstitial Diseases
Table 12 lists the main glomerular kidney diseases [29,30,31,32], outlining their characteristic histopathological features, their typical treatment options, and the clinical usefulness of Edge-Aware U-Net-based kidney segmentation in the process of disease diagnosis and treatment planning. On the same note, Table 13 outlines the key histopathological features of the key tubulointerstitial kidney diseases and the relevant treatment approaches, highlighting the importance of Edge-Aware U-Net in enhancing diagnostic assistance and decision-making of tailored therapy.
The more general talk about glomerular and tubulointerstitial diseases is meant to give neuropsychological context. Nonetheless, not all diseases referenced were separately annotated or categorized within the current dataset. The dataset utilized in this study comprises the labeled categories 56Nx, DN, NEP25, and Normal. Performance evaluation was executed at the structural and subtype levels within these specified classifications [33,34].
Table 12.
Role of kidney segmentation by Edge-Aware U-Net in glomerular diseases diagnosis and treatment planning.
Table 12.
Role of kidney segmentation by Edge-Aware U-Net in glomerular diseases diagnosis and treatment planning.
| Kidney Disease | Histopathological Changes | Treatment | Role of Kidney Segmentation by Edge-Aware U-Net | |
|---|---|---|---|---|
| Disease Diagnosis | Treatment Planning | |||
| Glomerular Diseases | ||||
| 1. Minimal Change Disease | 1. Normal glomeruli. 2. Diffuse podocyte foot process effacement. | 1. High-dose corticosteroids. 2. Supportive care for edema and blood pressure. | 1. Detects normal-appearing glomeruli. 2. Absence of deposits and podocyte changes in that helps exclude other glomerulonephritis types. | 1. Confirms absence of structural progression on repeat biopsies in steroid-resistant cases. 2. Supports decision to escalate to second-line drugs. |
| 2. Focal Segmental Glomerulosclerosis | 1. Segmental sclerosis and hyalinosis in some glomeruli. 2. Nonspecific IgM/C3 in sclerotic areas podocyte effacement. | 1. Corticosteroid. 2. Calcineurin inhibitors. 3. Renin–angiotensin–aldosterone system blockade. 4. Supportive care. | 1. Identifies sclerotic vs. normal glomeruli. 2. quantifies % affected glomeruli and degree of podocyte injury. | 1. Tracks sclerosis progression. 2. Quantifies response to therapy to guide continuation or switch of immunosuppressives. |
| 3. Membranous Nephropathy | 1. Diffuse GBM thickening with “spikes” on silver stain. 2. Granular IgG/C3 along glomerular basement membrane. 3. Subepithelial deposits with glomerular basement membrane growth between them. | 1. Supportive for low-risk patients: rituximab or cyclophosphamide. 2. Steroids for high risk. 3. Treatment of the underlying cause. | 1. Detects glomerular basement membrane thickening and spikes. 2. Quantifies immune deposit burden. 3. Distinguishes from other nephrotic syndromes. | 1. Measures deposit reduction and GBM remodeling after therapy. 2. Integrates with serology (PLA2R) for tapering or escalation decisions. |
| 4. Post-streptococcal glomerulonephritis | 1. Hypercellular glomeruli with neutrophils. 2. Lumpy-bumpy” IgG/C3 deposits. 3. Subepithelial “humps”. | 1. Supportive treatment. 2. Treat infection. 3. Blood pressure & fluid control. | 1. Detects glomeruli with hypercellularity. 2. Quantifies immune deposits. | 1. Measures resolution of deposits/inflammation over time. 2. Assesses residual damage to decide follow-up needs. |
| 5. IgA Nephropathy (Berger’s Disease) | Mesangial proliferation with mesangial IgA (±C3) deposits. | 1. Blood pressure control (Angiotensin-Converting Enzyme inhibitor/Angiotensin II Receptor Blocker). 2. Immunosuppression if high-risk. | 1. Segments mesangium. 2. Quantifies IgA deposit intensity. | 1. Tracks mesangial expansion. 2. Deposit reduction after therapy. |
| 6. Rapidly Progressive glomerulonephritis | Crescents in Bowman’s space from parietal epithelial proliferation. | High-dose steroids, cyclophosphamide/rituximab, plasma exchange. | Identifies crescents; calculates percentage of crescentic glomeruli. | Guides to aggressiveness of immunosuppression based on crescent percentage and chronic damage extent. |
| 7. Diabetic Nephropathy | 1. Glomerular basement membrane thickening. 2. Mesangial expansion, Kimmelstiel–Wilson nodules. | 1. Blood sugar control. 2. Blood pressure control with angiotensin-converting enzyme inhibitors or angiotensin II receptor blockers. | 1. Segments nodular and diffuse lesions. 2. Measures glomerular basement membrane thickness & mesangial area. | 1. Stages disease severity quantitatively. 2. Monitors morphologic stability or progression under therapy. |
| 8. Renal Amyloidosis | 1. Amyloid deposits in the mesangium and along the glomerular basement membrane and may involve vessel walls and interstitium. 2. On Congo red stain: pink–red deposits showing apple-green birefringence under polarized light (diagnostic). | Treatment of the underlying cause and supportive care. | Highlights amyloid-positive regions in special stains. | Quantifies amyloid burden to assess response to chemotherapy or anti-inflammatory therapy. |
Table 13.
Clinical Utility of Edge-Aware U-Net Segmentation in the Management of Tubulointerstitial Diseases.
Table 13.
Clinical Utility of Edge-Aware U-Net Segmentation in the Management of Tubulointerstitial Diseases.
| Kidney Disease | Histopathological Changes | Treatment | Role of Kidney Segmentation by Edge-Aware U-Net | |
|---|---|---|---|---|
| Disease Diagnosis | Treatment Planning | |||
| Tubulointerstitial Diseases | ||||
| Acute Tubular Injury | 1. Tubular epithelial cell necrosis. 2. Loss of brush border, tubular dilation, granular casts. | 1. Supportive care. 2. Treat underlying cause (e.g., ischemia, toxins). 3. Manage fluids/electrolytes. | 1. Identifies necrotic tubular segments. 2. Loss of brush border. 3. Quantifies tubular injury extent. | Monitors tubular regeneration vs. persistent damage to guide dialysis need and recovery prediction. |
| Acute Interstitial Nephritis | Interstitial edema with inflammatory infiltrates (lymphocytes, plasma cells, eosinophils). | 1. Discontinuation of the causative drug. 2. Corticosteroids. 3. Supportive care. | 1. Detects interstitial inflammatory cell infiltration. | 1. Measures resolution of inflammation after drug withdrawal or steroids. 2. Guides therapy duration. |
| Chronic Interstitial Nephritis | Interstitial fibrosis, tubular atrophy, chronic inflammatory cell infiltrates. | 1. Supportive care. 2. Treatment of the underlying cause. 3. Blood pressure control. | 1. Segments fibrotic interstitial areas and atrophic tubules. 2. Quantifies chronic damage. | 1. Determines irreversibility of injury to avoid unnecessary aggressive therapy. 2. Tracks fibrosis progression rate. |
| Pyelonephritis | 1. Coarse corticomedullary scars. 2. Tubular atrophy. 3. Interstitial fibrosis. 4. Chronic inflammation. 5. Thyroidization of tubules. | 1. Treatment of the underlying infection or obstruction. 2. Supportive chronic kidney disease care. | 1. Identifies scarred vs. preserved cortical tissue. | 1. Monitors scar expansion. 2. Helps in decision-making for nephrectomy in nonfunctioning kidneys. |
5.2. Role of Edge-Aware U-Net Segmentation
The offered Edge-Aware U-Net architecture offered good results in the segmentation of the kidney structures in histopathological tissue images, such as glomeruli, tubules and interstitial areas. This segmentation task is not an isolated action but a basis of the whole AI-based disease determination pipeline. Each successional step of analysis is marked by extraction, categorization and diagnostic validation—directly relying on the accuracy of the segmentation output. To improve the preservation of fine-grained structural boundaries, the model with edge-awareness was employed in the U-Net architecture. This is essential in histopathology, where precise demarcation of microscopic features directly influences the soundness of features elicited, classification precision, and, finally, clinical judgment [35]. The model achieved high consistency in segmentation, with both edge features and the use of spatial and contextual information, and was able to perform well even in difficult scenarios, such as low-contrast staining, non-homogenous tissue composition, and complicated patterns of vascularity and tissue injury.
5.3. Feature Extraction and Classification
Based on segmentation, the feature extraction took place to measure disease-relevant morphological and staining features. These characteristics were then trained on classification models that could identify the type of disease, and both binary and multi-class results were supported. The consistency of classification prediction was directly related to the quality of the segmentation and features extraction. To achieve clinical validity, classification outcomes were compared to the expert pathologist annotation using several different evaluation measures, such as accuracy, sensitivity, specificity and Cohen kappa coefficient. Comparative experiments showed that edge-conscious segmentation was always more successful than the baseline method (U-Net and others), especially when the dataset had variability in staining, as well as in those with complicated tissue morphology.
5.4. Robustness and Limitations
The dataset comprises samples from various centers; however, the evaluation was performed on a singular aggregated dataset. Consequently, cross-institutional robustness ought to be regarded as a preliminary observation rather than a substantiated generalization assertion, as shown in Figure 16. However, the overall effectiveness of the system is constrained by the quality, resolution, and diversity of the histopathological training dataset. Underrepresentation of rare kidney disease variants may reduce segmentation accuracy, which could negatively impact feature extraction and classification performance.
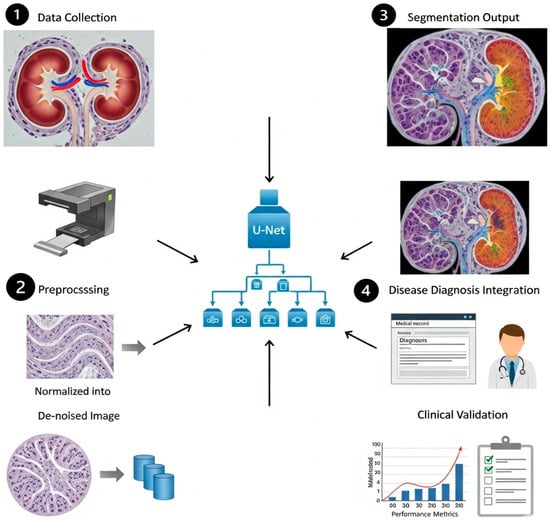
Figure 16.
The role of Edge-Aware U-Net-based kidney segmentation in disease diagnosis and treatment planning.
Despite its advantages, several limitations should be acknowledged: (i) The integration of additional edge feature extraction layers increased the computational load compared to a standard U-Net. Although the increase is moderate and manageable for offline analysis, it may be a constraint for real-time clinical applications without hardware acceleration. (ii) Absence of Multi-Organ Context: The existing method only pays attention to kidney segmentation without the consideration of the surrounding anatomical structures. Contextual information of adjacent organs may aid in the better disambiguation of complex abdominal scans in situations where there is overlapping intensity range. External validation using independent datasets and unobserved staining distributions is essential to establish cross-institutional generalizability.
This study constitutes a framework for technical feasibility and retrospective validation. Before clinical deployment, studies of prospective clinical validation and integration into real-world workflows are needed.
6. Conclusions and Future Work
High-quality and precise kidney segmentation is also an essential aspect of a variety of clinical processes, which directly influences diagnosis, treatment plan development, and long-term patient monitoring. We have presented an Edge-Aware U-Net framework with an Edge-Sensitive optimization-based segmentation approach in this study that is clinically motivated. This design directly addresses the problem of ensuring that the boundaries of each of the organs are well defined, something that is not considered by traditional segmentation networks. In a full comparison with UNet, Attention Net, ResUNet, and our proposed Edge-Aware U-Net (proposed model), we have proven that edge-awareness and boundary sensitivity bring quantifiable results in structural preservation and segmentation quality. The Edge-Aware U-Net (proposed model) reached the highest SSIM score (0.9473), which means that it is structurally faithful and has competitive PSNR (17.269) and MAE (0.0266) values. These findings confirm the model in terms of providing high-quality segmentation at an optimal trade-off between quality and computation. The further development of the work should focus on enhancing this dependency chain through increasing the diversity of datasets, the use of domain adaptation methods to improve the cross-institution generalization, and the discussion of the possibilities of real-time inference to incorporate the pipeline into the actual digital pathology workflow.
Author Contributions
This work was carried out in collaboration among all authors. All authors designed the study, performed the statistical analysis, and wrote the protocol. All authors have read and agreed to the published version of the manuscript.
Funding
This research received no external funding.
Institutional Review Board Statement
Not applicable.
Informed Consent Statement
Not applicable.
Data Availability Statement
No new data were created or analyzed in this study.
Conflicts of Interest
The authors declare that there are no conflicts of interest. The authors declare that they have no known competing financial interests or personal relationships that could have appeared to influence the work reported in this paper.
References
- Thong, W.; Kadoury, S.; Piché, N.; Pal, C.J. Convolutional networks for kidney segmentation in contrast-enhanced CT scans. Comput. Methods Biomech. Biomed. Eng. Imaging Vis. 2018, 6, 277–282. [Google Scholar] [CrossRef]
- Abdelrahman, A.; Viriri, S. EfficientNet family U-Net models for deep learning semantic segmentation of kidney tumors on CT images. Front. Comput. Sci. 2023, 5, 1235622. [Google Scholar] [CrossRef]
- Zhao, Z.; Chen, H.; Li, J.; Wang, L. Boundary attention u-net for kidney and kidney tumor segmentation. In Proceedings of the 2022 44th Annual International Conference of the IEEE Engineering in Medicine & Biology Society (EMBC); IEEE: New York, NY, USA, 2022; pp. 1540–1543. [Google Scholar]
- Alsaleh, A.M.; Albalawi, E.; Algosaibi, A.; Albakheet, S.S.; Khan, S.B. Few-shot learning for medical image segmentation using 3d u-net and model-agnostic meta-learning (maml). Diagnostics 2024, 14, 1213. [Google Scholar] [CrossRef] [PubMed]
- da Cruz, L.B.; Araújo, J.D.L.; Ferreira, J.L.; Diniz, J.O.B.; Silva, A.C.; de Almeida, J.D.S.; de Paiva, A.C.; Gattass, M. Kidney segmentation from computed tomography images using deep neural network. Comput. Biol. Med. 2020, 123, 103906. [Google Scholar] [CrossRef] [PubMed]
- Rashmi, R.; Girisha, S. ETiSeg-Net: Edge-aware Self Attention to Enhance Tissue Segmentation in Histopathological Images. Multimed. Tools Appl. 2025, 84, 32865–32885. [Google Scholar]
- Fu, B.; Peng, Y.; He, J.; Tian, C.; Sun, X.; Wang, R. HmsU-Net: A hybrid multi-scale U-net based on a CNN and transformer for medical image segmentation. Comput. Biol. Med. 2024, 170, 108013. [Google Scholar]
- Kwon, M.S.; Jung, Y.S.; Park, J.G.; Ahn, Y.C. Transfer Learning with Multi-Sequence MRI for Segmentation of Autosomal Dominant Polycystic Kidney Disease Using U-Net. Electronics 2024, 13, 1950. [Google Scholar] [CrossRef]
- Du, Y.; Bao, W.; Yao, W.; Zhu, H.; Yang, X. DSEA-Net: A dual-stream edge-aware network for kidney tumor segmentation. Signal Image Video Process. 2025, 19, 790. [Google Scholar] [CrossRef]
- Abdelrahman, A.; Viriri, S. Kidney tumor semantic segmentation using deep learning: A survey of state-of-the-art. J. Imaging 2022, 8, 55. [Google Scholar] [CrossRef]
- Jang, D.H.; Lee, J.; Jeon, Y.J.; Yoon, Y.E.; Ahn, H.; Kang, B.K.; Choi, W.S.; Oh, J.; Lee, D.K. Kidney, ureter, and urinary bladder segmentation based on non-contrast enhanced computed tomography images using modified U-Net. Sci. Rep. 2024, 14, 15325. [Google Scholar] [CrossRef]
- Shengnan, Z.; Xinming, C. FEA-Net: End-to-End Frequency-Edge Automation for Ambiguous Lesion Boundary Segmentation in Gastrointestinal and Dermatologic Imaging. Preprint 2025. [Google Scholar] [CrossRef]
- Liu, L.; Li, X.; Wang, S.; Wang, J.; Melo, S.N. MRCA-UNet: A multiscale recombined channel attention U-Net model for medical image segmentation. Symmetry 2025, 17, 892. [Google Scholar] [CrossRef]
- Zhang, Y.; Fang, J.; Chen, Y.; Jia, L. Edge-aware U-net with gated convolution for retinal vessel segmentation. Biomed. Signal Process. Control 2022, 73, 103472. [Google Scholar] [CrossRef]
- Ronneberger, O.; Fischer, P.; Brox, T. U-net: Convolutional networks for biomedical image segmentation. In Proceedings of the International Conference on Medical Image Computing and Computer-Assisted Intervention; Springer international publishing: Cham, Switzerland, 2015; pp. 234–241. [Google Scholar]
- Azad, R.; Aghdam, E.K.; Rauland, A.; Jia, Y.; Avval, A.H.; Bozorgpour, A.; Karimijafarbigloo, S.; Cohen, J.P.; Adeli, E.; Merhof, D. Medical image segmentation review: The success of u-net. IEEE Trans. Pattern Anal. Mach. Intell. 2024, 46, 10076–10095. [Google Scholar] [CrossRef]
- van Midden, D.; Studer, L.; Hermsen, M.; Steenbergen, E.J.; Kers, J.; Kozakowski, N.; Kikić, Ž.; Hilbrands, L.B.; van der Laak, J.A. Deep learning-based histopathologic segmentation of peritubular capillaries in kidney transplant biopsies. Comput. Biol. Med. 2025, 193, 110395. [Google Scholar] [CrossRef]
- Yamashita, M.; Piaseczna, N.; Takahashi, A.; Kiyozawa, D.; Tatsumoto, N.; Kaneko, S.; Zurek, N.; Gertych, A. AI-driven glomerular morphology quantification: A novel pipeline for assessing basement membrane thickness and podocyte foot process effacement in kidney diseases. Comput. Methods Programs Biomed. 2025, 268, 108842. [Google Scholar] [CrossRef]
- Wang, W.; Li, Q.; Xiao, C.; Zhang, D.; Miao, L.; Wang, L. An improved boundary-aware U-Net for ore image semantic segmentation. Sensors 2021, 21, 2615. [Google Scholar] [CrossRef] [PubMed]
- Ma, J.; Duan, C. Review for Medical Image Segmentation: From U-Net and to Transformer. In Proceedings of the 2025 2nd International Conference on Machine Learning, Pattern Recognition and Automation Engineering (MLPRAE); IEEE: New York, NY, USA, 2025; pp. 47–55. [Google Scholar]
- Wang, R.; Chen, S.; Ji, C.; Fan, J.; Li, Y. Boundary-aware context neural network for medical image segmentation. Med. Image Anal. 2022, 78, 102395. [Google Scholar] [CrossRef] [PubMed]
- Almukadi, W.; Abdel-Khalek, S.; Bahaddad, A.A.; Alghamdi, A.M. Driven early detection of chronic kidney cancer disease based on machine learning technique. PLoS ONE 2025, 20, e0326080. [Google Scholar] [CrossRef]
- Zhou, T.; Zhang, Y.; Chen, G.; Zhou, Y.; Wu, Y.; Fan, D.P. Edge-aware feature aggregation network for polyp segmentation. Mach. Intell. Res. 2025, 22, 101–116. [Google Scholar] [CrossRef]
- Yi, J.; Zhong, X.; Liu, W.; Wu, Z.; Deng, Y. Polar Edge Distance Loss in Edge-aware Plug-and-play Scheme for Semantic Segmentation. Eng. Appl. Artif. Intell. 2025, 154, 110810. [Google Scholar] [CrossRef]
- Fogaing, I.M.; Abdo, A.; Ballis-Berthiot, P.; Adrian-Felix, S.; Olagne, J.; Merieux, R.; Vuiblet, V. Detection and classification of glomerular lesions in kidney graft biopsies using 2-stage deep learning approach. Medicine 2025, 104, e41560. [Google Scholar]
- Zhu, M.; Liang, Y.; Wang, J. CTI-Unet: Cascaded Threshold Integration for Improved U-Net Segmentation of Pathology Images. arXiv 2025, arXiv:2504.05640. [Google Scholar]
- Moradi, M.; Du, X.; Huan, T.; Chen, Y. Feasibility of the soft attention-based models for automatic segmentation of OCT kidney images. Biomed. Opt. Express 2022, 13, 2728–2738. [Google Scholar] [CrossRef]
- Bouteldja, N.; Klinkhammer, B.M.; Bülow, R.D.; Droste, P.; Otten, S.W.; Von Stillfried, S.F.; Moellmann, J.; Sheehan, S.M.; Korstanje, R.; Menzel, S.; et al. Deep learning–based segmentation and quantification in experimental kidney histopathology. J. Am. Soc. Nephrol. 2021, 32, 52–68. [Google Scholar] [CrossRef]
- Hara, S.; Haneda, E.; Kawakami, M.; Morita, K.; Nishioka, R.; Zoshima, T.; Kometani, M.; Yoneda, T.; Kawano, M.; Karashima, S.; et al. Evaluating tubulointerstitial compartments in renal biopsy specimens using a deep learning-based approach for classifying normal and abnormal tubules. PLoS ONE 2022, 17, e0271161. [Google Scholar] [CrossRef]
- Hassan, E.; Bhatnagar, R.; Abd El-Hafeez, T.; Shams, M.Y. Detection of suicide and depression for early intervention and initiative-taking mental healthcare. In Proceedings of the 2025 7th International Conference on Signal Processing, Computing and Control (ISPCC); IEEE: New York, NY, USA, 2025; pp. 99–104. [Google Scholar]
- Shams, M.Y.; Hassan, E.; Gamil, S.; Ibrahim, A.; Gabr, E.; Gamal, S.; Ibrahim, E.; Abbas, F.; Mohammed, A.; Khamis, A.; et al. Skin disease classification: A comparison of ResNet50, MobileNet, and Efficient-B0. J. Curr. Multidiscip. Res. 2025, 1, 1–7. [Google Scholar] [CrossRef]
- Saber, A.; Hassan, E.; Elbedwehy, S.; Awad, W.A.; Emara, T.Z. Leveraging ensemble convolutional neural networks and metaheuristic strategies for advanced kidney disease screening and classification. Sci. Rep. 2025, 15, 12487. [Google Scholar] [CrossRef]
- Zhang, S.; Cui, X.; Ma, G.; Tian, R. Symmetric boundary-enhanced U-Net with Mamba architecture for glomerular segmentation in renal pathological images. Symmetry 2025, 17, 1506. [Google Scholar] [CrossRef]
- Swapna, J.; Kiruba, R.R. Deep Learning Based Segmentation of Renal Cancer Detection and Segmentation Enhanced 3D CT Images. J. Electr. Eng. Technol. 2026, 1–15. [Google Scholar] [CrossRef]
- Sharon, J.J.; Anbarasi, L.J. Advanced kidney mass segmentation using VHUCS-Net with protuberance detection network. Front. Artif. Intell. 2026, 9, 1716063. [Google Scholar] [CrossRef]


Disclaimer/Publisher’s Note: The statements, opinions and data contained in all publications are solely those of the individual author(s) and contributor(s) and not of MDPI and/or the editor(s). MDPI and/or the editor(s) disclaim responsibility for any injury to people or property resulting from any ideas, methods, instructions or products referred to in the content. |
© 2026 by the authors. Licensee MDPI, Basel, Switzerland. This article is an open access article distributed under the terms and conditions of the Creative Commons Attribution (CC BY) license.